Embed Size (px)
DESCRIPTION
Here are the numbers over the past year for North San Diego Coastal Real Estate markets.
Citation preview

Jun-10760,000
Jun-09767,500
%-1%
Change-7,500
Jun-09 vs. Jun-10: The median sold price is down 1%Median Sold Price by Month Windermere Real Estate
Jun-09 vs. Jun-10
Loren Sanders
Clarus MarketMetrics® 1 of 2 07/21/2010Information not guaranteed. © 2009-2010 Terradatum and its suppliers and licensors (www.terradatum.com/about/licensors.td).
AllBathrooms:MLS: AllAllSq Ft:
92130, 92008, 92009, 92054, 92024, 92007, 92014, 92067, 92075, 92011Single Family Residential: (Detached)Period: All All
Property Types:ZIP Codes:
AllConstruction Type:Price: Lot Size:Bedrooms:1 year (monthly)SANDICOR
1 of 21
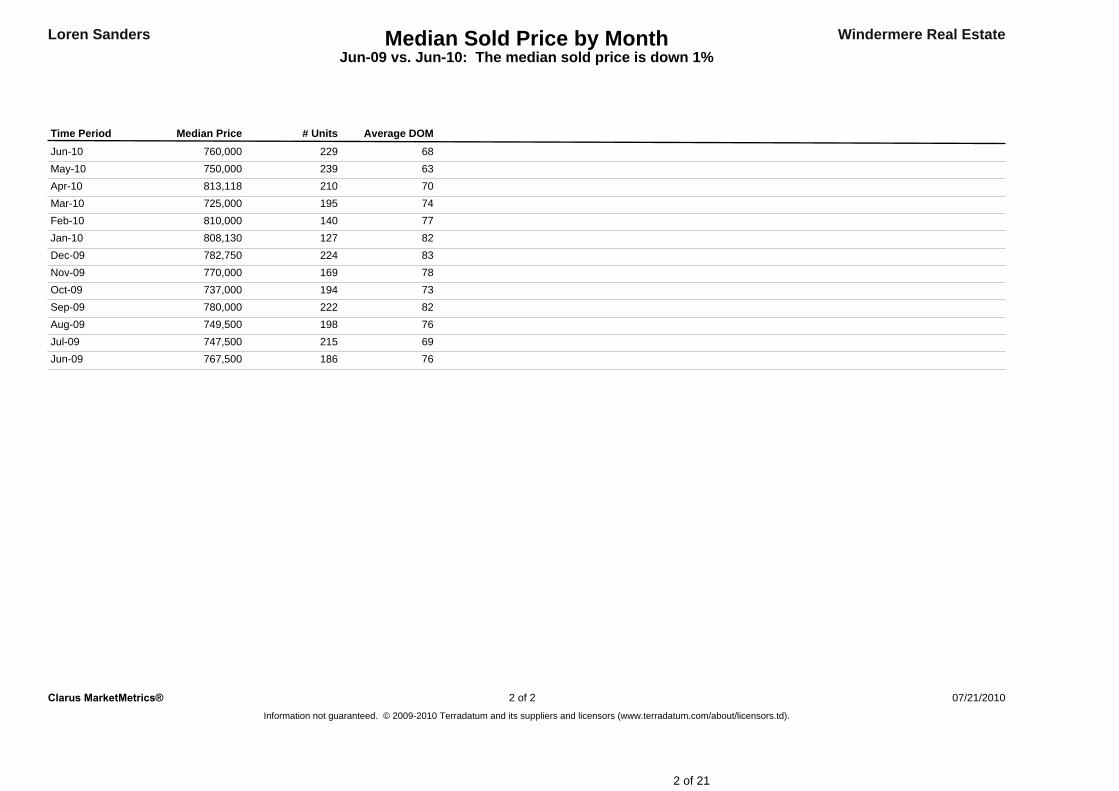
Median Sold Price by MonthJun-09 vs. Jun-10: The median sold price is down 1%
Windermere Real EstateLoren Sanders
Time Period Median Price # Units Average DOMJun-10 760,000 229 68May-10 750,000 239 63Apr-10 813,118 210 70Mar-10 725,000 195 74Feb-10 810,000 140 77Jan-10 808,130 127 82Dec-09 782,750 224 83Nov-09 770,000 169 78Oct-09 737,000 194 73Sep-09 780,000 222 82Aug-09 749,500 198 76Jul-09 747,500 215 69Jun-09 767,500 186 76
Clarus MarketMetrics® 2 of 2 07/21/2010Information not guaranteed. © 2009-2010 Terradatum and its suppliers and licensors (www.terradatum.com/about/licensors.td).
2 of 21

Jun-09 vs. Jun-10: The median price of for sale properties is down 6% and the median price of sold properties is down 1%Windermere Real Estate
Jun-09 vs. Jun-10
1,250,000 -6%
Loren Sanders
1,175,000Jun-10
Median For Sale vs. Median Sold
ChangeJun-09 %-75,000
Jun-09 Jun-10 %767,500 -1%
Jun-09 vs. Jun-10
760,000Change-7,500
Clarus MarketMetrics® 1 of 2 07/21/2010Information not guaranteed. © 2009-2010 Terradatum and its suppliers and licensors (www.terradatum.com/about/licensors.td).
AllBathrooms:MLS: AllAllSq Ft:
92130, 92008, 92009, 92054, 92024, 92007, 92014, 92067, 92075, 92011Single Family Residential: (Detached)Period: All All
Property Types:ZIP Codes:
AllConstruction Type:Price: Lot Size:Bedrooms:1 year (monthly)SANDICOR
3 of 21
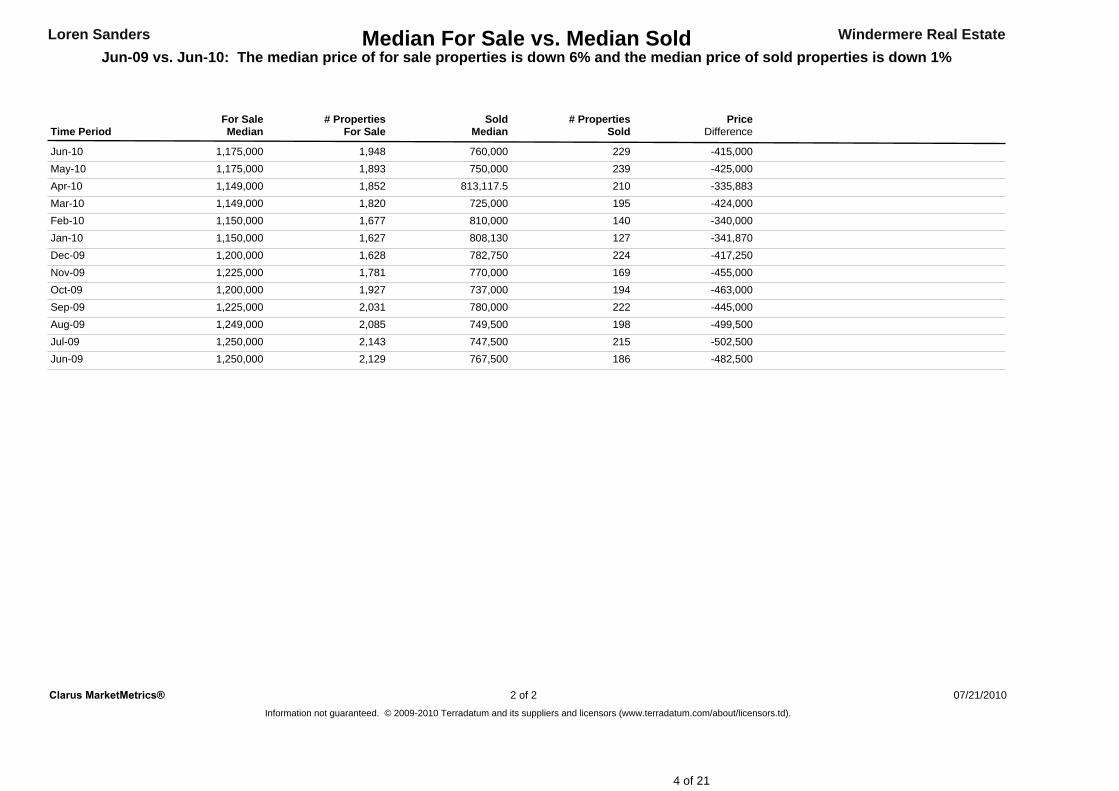
Median For Sale vs. Median SoldJun-09 vs. Jun-10: The median price of for sale properties is down 6% and the median price of sold properties is down 1%
Windermere Real EstateLoren Sanders
Time Period For SaleMedian SoldMedianFor Sale # Properties # PropertiesSold Price
Difference
Jun-10 1,948 2291,175,000 760,000 -415,000May-10 1,893 2391,175,000 750,000 -425,000Apr-10 1,852 2101,149,000 813,117.5 -335,883Mar-10 1,820 1951,149,000 725,000 -424,000Feb-10 1,677 1401,150,000 810,000 -340,000Jan-10 1,627 1271,150,000 808,130 -341,870Dec-09 1,628 2241,200,000 782,750 -417,250Nov-09 1,781 1691,225,000 770,000 -455,000Oct-09 1,927 1941,200,000 737,000 -463,000Sep-09 2,031 2221,225,000 780,000 -445,000Aug-09 2,085 1981,249,000 749,500 -499,500Jul-09 2,143 2151,250,000 747,500 -502,500Jun-09 2,129 1861,250,000 767,500 -482,500
Clarus MarketMetrics®Information not guaranteed. © 2009-2010 Terradatum and its suppliers and licensors (www.terradatum.com/about/licensors.td).
2 of 2 07/21/2010
4 of 21

Jun-10229
Jun-09186
%+23%
Change43
Jun-09 vs. Jun-10: The number of Sold properties is up 23%Sold Properties by Month Windermere Real Estate
Jun-09 vs. Jun-10
Loren Sanders
Clarus MarketMetrics® 1 of 2 07/21/2010Information not guaranteed. © 2009-2010 Terradatum and its suppliers and licensors (www.terradatum.com/about/licensors.td).
AllBathrooms:MLS: AllAllSq Ft:
92130, 92008, 92009, 92054, 92024, 92007, 92014, 92067, 92075, 92011Single Family Residential: (Detached)Period: All All
Property Types:ZIP Codes:
AllConstruction Type:Price: Lot Size:Bedrooms:1 year (monthly)SANDICOR
5 of 21

Sold Properties by MonthJun-09 vs. Jun-10: The number of Sold properties is up 23%
Windermere Real EstateLoren Sanders
Time Period # Properties Median Price Average DOMJun-10 760,000229 68May-10 750,000239 63Apr-10 813,118210 70Mar-10 725,000195 74Feb-10 810,000140 77Jan-10 808,130127 82Dec-09 782,750224 83Nov-09 770,000169 78Oct-09 737,000194 73Sep-09 780,000222 82Aug-09 749,500198 76Jul-09 747,500215 69Jun-09 767,500186 76
Clarus MarketMetrics® 2 of 2 07/21/2010Information not guaranteed. © 2009-2010 Terradatum and its suppliers and licensors (www.terradatum.com/about/licensors.td).
6 of 21

Jun-10212
Jun-09203
%+4%
Change9
Jun-09 vs. Jun-10: The number of Under Contract properties is up 4%Under Contract Properties by Month Windermere Real Estate
Jun-09 vs. Jun-10
Loren Sanders
Clarus MarketMetrics® 1 of 2 07/21/2010Information not guaranteed. © 2009-2010 Terradatum and its suppliers and licensors (www.terradatum.com/about/licensors.td).
AllBathrooms:MLS: AllAllSq Ft:
92130, 92008, 92009, 92054, 92024, 92007, 92014, 92067, 92075, 92011Single Family Residential: (Detached)Period: All All
Property Types:ZIP Codes:
AllConstruction Type:Price: Lot Size:Bedrooms:1 year (monthly)SANDICOR
7 of 21

Under Contract Properties by MonthJun-09 vs. Jun-10: The number of Under Contract properties is up 4%
Windermere Real EstateLoren Sanders
Time Period # Properties Median Price Average DOMJun-10 827,000212 69May-10 819,000223 68Apr-10 767,450246 63Mar-10 769,550234 63Feb-10 750,000186 78Jan-10 837,000180 74Dec-09 795,000137 86Nov-09 825,000162 77Oct-09 799,000210 80Sep-09 810,000211 82Aug-09 779,000205 76Jul-09 737,000199 69Jun-09 799,000203 79
Clarus MarketMetrics® 2 of 2 07/21/2010Information not guaranteed. © 2009-2010 Terradatum and its suppliers and licensors (www.terradatum.com/about/licensors.td).
8 of 21

Jun-10468
Jun-09422
%+11%
Change46
Jun-09 vs. Jun-10: The number of New properties is up 11%New Properties by Month Windermere Real Estate
Jun-09 vs. Jun-10
Loren Sanders
Clarus MarketMetrics® 1 of 2 07/21/2010Information not guaranteed. © 2009-2010 Terradatum and its suppliers and licensors (www.terradatum.com/about/licensors.td).
AllBathrooms:MLS: AllAllSq Ft:
92130, 92008, 92009, 92054, 92024, 92007, 92014, 92067, 92075, 92011Single Family Residential: (Detached)Period: All All
Property Types:ZIP Codes:
AllConstruction Type:Price: Lot Size:Bedrooms:1 year (monthly)SANDICOR
9 of 21
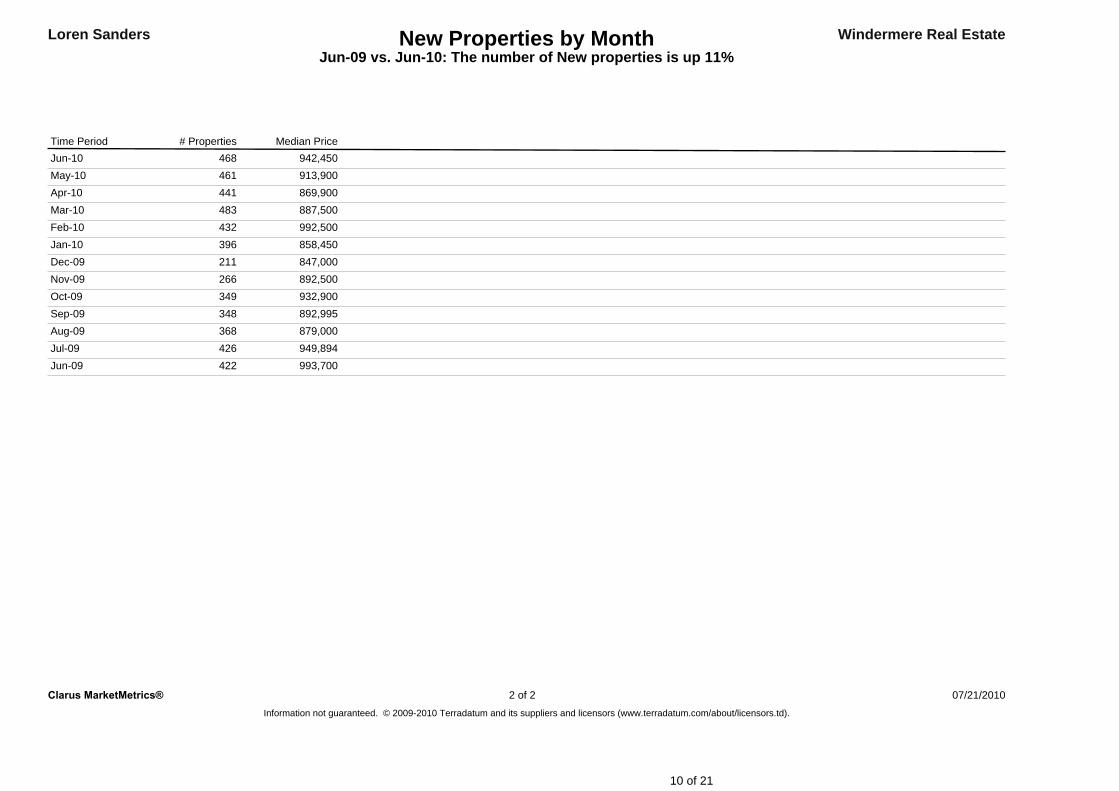
New Properties by MonthJun-09 vs. Jun-10: The number of New properties is up 11%
Windermere Real EstateLoren Sanders
Time Period # Properties Median PriceJun-10 942,450468May-10 913,900461Apr-10 869,900441Mar-10 887,500483Feb-10 992,500432Jan-10 858,450396Dec-09 847,000211Nov-09 892,500266Oct-09 932,900349Sep-09 892,995348Aug-09 879,000368Jul-09 949,894426Jun-09 993,700422
Clarus MarketMetrics® 2 of 2 07/21/2010Information not guaranteed. © 2009-2010 Terradatum and its suppliers and licensors (www.terradatum.com/about/licensors.td).
10 of 21

Jun-101,948
Jun-092,129
%-9%
Change-181
Jun-09 vs. Jun-10: The number of For Sale properties is down 9%For Sale Properties by Month Windermere Real Estate
Jun-09 vs. Jun-10
Loren Sanders
Clarus MarketMetrics® 1 of 2 07/21/2010Information not guaranteed. © 2009-2010 Terradatum and its suppliers and licensors (www.terradatum.com/about/licensors.td).
AllBathrooms:MLS: AllAllSq Ft:
92130, 92008, 92009, 92054, 92024, 92007, 92014, 92067, 92075, 92011Single Family Residential: (Detached)Period: All All
Property Types:ZIP Codes:
AllConstruction Type:Price: Lot Size:Bedrooms:1 year (monthly)SANDICOR
11 of 21

For Sale Properties by MonthJun-09 vs. Jun-10: The number of For Sale properties is down 9%
Windermere Real EstateLoren Sanders
Time Period # Properties Median Price Average DOMJun-10 1,175,0001,948 116May-10 1,175,0001,893 134Apr-10 1,149,0001,852 145Mar-10 1,149,0001,820 153Feb-10 1,150,0001,677 169Jan-10 1,150,0001,627 181Dec-09 1,200,0001,628 191Nov-09 1,225,0001,781 188Oct-09 1,200,0001,927 188Sep-09 1,225,0002,031 187Aug-09 1,249,0002,085 186Jul-09 1,250,0002,143 185Jun-09 1,250,0002,129 185
Clarus MarketMetrics® 2 of 2 07/21/2010Information not guaranteed. © 2009-2010 Terradatum and its suppliers and licensors (www.terradatum.com/about/licensors.td).
12 of 21

Jun-10232
Jun-09209
%+11%
Change23
Jun-09 vs. Jun-10: The number of Expired properties is up 11%Expired Properties by Month Windermere Real Estate
Jun-09 vs. Jun-10
Loren Sanders
Clarus MarketMetrics® 1 of 2 07/21/2010Information not guaranteed. © 2009-2010 Terradatum and its suppliers and licensors (www.terradatum.com/about/licensors.td).
AllBathrooms:MLS: AllAllSq Ft:
92130, 92008, 92009, 92054, 92024, 92007, 92014, 92067, 92075, 92011Single Family Residential: (Detached)Period: All All
Property Types:ZIP Codes:
AllConstruction Type:Price: Lot Size:Bedrooms:1 year (monthly)SANDICOR
13 of 21

Expired Properties by MonthJun-09 vs. Jun-10: The number of Expired properties is up 11%
Windermere Real EstateLoren Sanders
Time Period Median Price# Properties Average DOMJun-10 1,200,000232 129May-10 1,234,500190 142Apr-10 1,168,500174 130Mar-10 1,169,000175 131Feb-10 1,295,000154 168Jan-10 1,212,450202 157Dec-09 1,295,000260 156Nov-09 1,285,000202 135Oct-09 1,400,000202 181Sep-09 1,495,000242 151Aug-09 1,199,000197 135Jul-09 1,299,000227 137Jun-09 1,250,876209 129
Clarus MarketMetrics® 2 of 2 07/21/2010Information not guaranteed. © 2009-2010 Terradatum and its suppliers and licensors (www.terradatum.com/about/licensors.td).
14 of 21
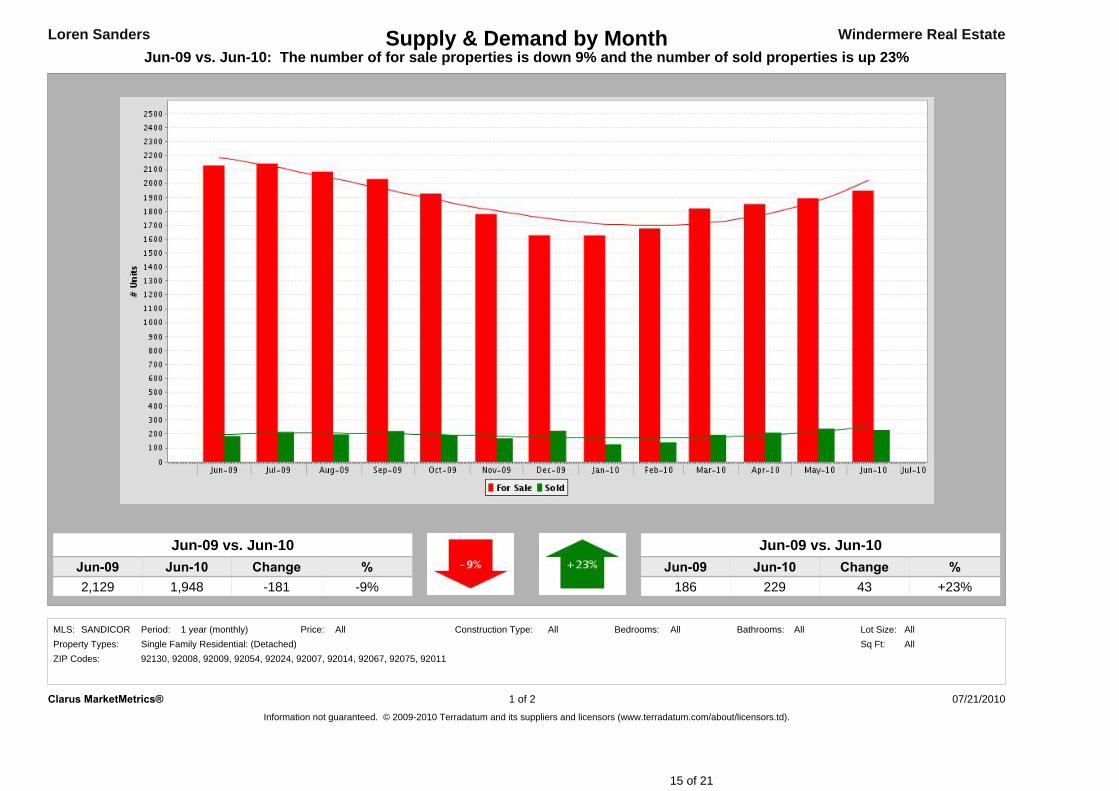
Jun-09 vs. Jun-10: The number of for sale properties is down 9% and the number of sold properties is up 23%Windermere Real Estate
Jun-09 vs. Jun-10
2,129 -9%
Loren Sanders
1,948Jun-10
Supply & Demand by Month
ChangeJun-09 %-181
Jun-09 Jun-10 %186 +23%
Jun-09 vs. Jun-10
229Change
43
Clarus MarketMetrics® 1 of 2 07/21/2010Information not guaranteed. © 2009-2010 Terradatum and its suppliers and licensors (www.terradatum.com/about/licensors.td).
AllBathrooms:MLS: AllAllSq Ft:
92130, 92008, 92009, 92054, 92024, 92007, 92014, 92067, 92075, 92011Single Family Residential: (Detached)Period: All All
Property Types:ZIP Codes:
AllConstruction Type:Price: Lot Size:Bedrooms:1 year (monthly)SANDICOR
15 of 21

Supply & Demand by MonthJun-09 vs. Jun-10: The number of for sale properties is down 9% and the number of sold properties is up 23%
Loren Sanders Windermere Real Estate
Time Period For SaleFor Sale SoldSold# Properties Average DOM Average DOM# Properties
Jun-10 116 681,948 229May-10 134 631,893 239Apr-10 145 701,852 210Mar-10 153 741,820 195Feb-10 169 771,677 140Jan-10 181 821,627 127Dec-09 191 831,628 224Nov-09 188 781,781 169Oct-09 188 731,927 194Sep-09 187 822,031 222Aug-09 186 762,085 198Jul-09 185 692,143 215Jun-09 185 762,129 186
Clarus MarketMetrics® 2 of 2 07/21/2010Information not guaranteed. © 2009-2010 Terradatum and its suppliers and licensors (www.terradatum.com/about/licensors.td).
16 of 21
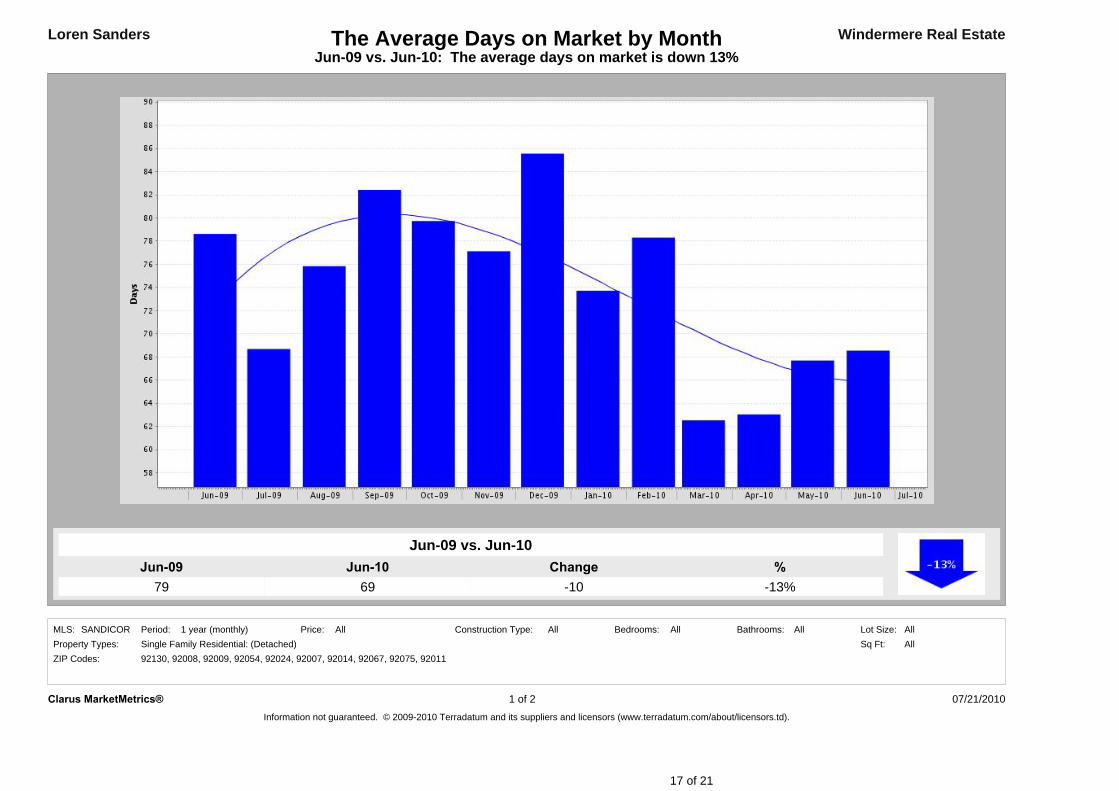
Jun-1069
Jun-0979
%-13%
Change-10
Jun-09 vs. Jun-10: The average days on market is down 13%The Average Days on Market by Month Windermere Real Estate
Jun-09 vs. Jun-10
Loren Sanders
Clarus MarketMetrics® 1 of 2 07/21/2010Information not guaranteed. © 2009-2010 Terradatum and its suppliers and licensors (www.terradatum.com/about/licensors.td).
AllBathrooms:MLS: AllAllSq Ft:
92130, 92008, 92009, 92054, 92024, 92007, 92014, 92067, 92075, 92011Single Family Residential: (Detached)Period: All All
Property Types:ZIP Codes:
AllConstruction Type:Price: Lot Size:Bedrooms:1 year (monthly)SANDICOR
17 of 21

The Average Days on Market by MonthJun-09 vs. Jun-10: The average days on market is down 13%
Windermere Real EstateLoren Sanders
Time Period # UC UnitsAverage DOMJun-10 21269May-10 22368Apr-10 24663Mar-10 23463Feb-10 18678Jan-10 18074Dec-09 13786Nov-09 16277Oct-09 21080Sep-09 21182Aug-09 20576Jul-09 19969Jun-09 20379
Clarus MarketMetrics® 2 of 2 07/21/2010Information not guaranteed. © 2009-2010 Terradatum and its suppliers and licensors (www.terradatum.com/about/licensors.td).
18 of 21

Jun-09 vs. Jun-10: The average months supply of inventory is down 16%Windermere Real Estate
Jun-09 vs. Jun-10
8.5 -16%
Loren Sanders
7.1Jun-10
Months Supply of Inventory
ChangeJun-09 %-1.4
Clarus MarketMetrics® 1 of 2 07/21/2010Information not guaranteed. © 2009-2010 Terradatum and its suppliers and licensors (www.terradatum.com/about/licensors.td).
AllBathrooms:MLS: AllAllSq Ft:
92130, 92008, 92009, 92054, 92024, 92007, 92014, 92067, 92075, 92011Single Family Residential: (Detached)Period: All All
Property Types:ZIP Codes:
AllConstruction Type:Price: Lot Size:Bedrooms:1 year (monthly)SANDICOR
19 of 21

Months Supply of InventoryJun-09 vs. Jun-10: The average months supply of inventory is down 16%
Loren Sanders Windermere Real Estate
Time Period During MonthLast Day of Month DOMMSI# Units For Sale # UC Units UC Average
Jun-10 212 691,504 7May-10 223 681,480 7Apr-10 246 631,432 6Mar-10 234 631,411 6Feb-10 186 781,337 7Jan-10 180 741,245 7Dec-09 137 861,231 9Nov-09 162 771,417 9Oct-09 210 801,515 7Sep-09 211 821,578 7Aug-09 205 761,683 8Jul-09 199 691,717 9Jun-09 203 791,717 8
Clarus MarketMetrics® 2 of 2 07/21/2010Information not guaranteed. © 2009-2010 Terradatum and its suppliers and licensors (www.terradatum.com/about/licensors.td).
20 of 21

07/21/2010Clarus MarketMetrics®Information not guaranteed. © 2009-2010 Terradatum and its suppliers and licensors (www.terradatum.com/about/licensors.td).
Loren SandersWindermere Real Estate
Market Dynamics
21 of 21