Embed Size (px)
Citation preview
Jubilant FoodWorks
Caught in a vicious cycle; Maintain Reduce
December 22, 2015
Prabhudas Lilladher Pvt. Ltd. and/or its associates (the 'Firm') does and/or seeks to do business with companies covered in its research reports. As a result investors should be aware that the Firm may have a conflict of interest that could affect the objectivity of the report. Investors should consider this report as only a single factor in making their investment decision.
Please refer to important disclosures and disclaimers at the end of the report
Compan
y Update Amnish Aggarwal
[email protected] +91‐22‐66322233
Gaurav Jogani [email protected] +91‐22‐66322238
Rating Reduce
Price Rs1,457
Target Price Rs1,140
Implied Upside ‐21.8%
Sensex 25,733
Nifty 7,834
(Prices as on December 21, 2015)
Trading data
Market Cap. (Rs bn) 95.5
Shares o/s (m) 65.6
3M Avg. Daily value (Rs m) 528.5
Major shareholders
Promoters 48.79%
Foreign 41.46%
Domestic Inst. 3.96%
Public & Other 5.79%
Stock Performance
(%) 1M 6M 12M
Absolute 1.7 (20.1) 9.5
Relative 2.2 (14.3) 15.5
How we differ from Consensus
EPS (Rs) PL Cons. % Diff.
2017 25.5 31.2 ‐18.4
2018 34.7 46.4 ‐25.1
Price Performance (RIC: JUBI.BO, BB: JUBI IN)
Source: Bloomberg
0
500
1,000
1,500
2,000
2,500
Dec‐14
Feb‐15
Apr‐15
Jun‐15
Aug‐15
Oct‐15
Dec‐15
(Rs)
JUBI is caught in a vicious cycle of poor demand, rising costs and increasing
competition. JUBI has undertaken 3‐4% price increase recently, second price
increase in the past three months. While Sept price increase was mainly in side
orders, Nov price increase has been confined to Pizza. We note that certain items in
menu in both the phases have seen double‐digit price increase. Although JUBI has
been amongst most innovative QSRs, it will face increasing competition from new
global brands (Sbarro, US Pizza, Wendy’s, Burger King, Taco bell etc.) and local
players available through food aggregators. JUBI is vulnerable to home delivery
centric food aggregators, given 55% share of home delivery in Dominos sales. We
believe that successive price increases will delay volume growth recovery.
JUBI has suffered a loss of Rs330m in Dunkin Donuts (DD) in FY15 and is expected
to suffer a loss of Rs500m in FY16, we expect losses to peak out around Rs600m by
FY18 only, any positive contribution is unlikely in foreseeable future. DD has a
tough task on hand, given tough competition from cafe’s like Starbucks, Costa
Coffee and Barista on one hand and Cafe Coffee Day and McCafe on the other.
JUBI’s margins have been impacted by an increase of 420bps in manpower, 280bps
in rent and 150bps in ad spend due to launch of DD stores, store expansion in
Dominos and low volumes in both existing and new stores. We estimate JUBI
requires SSS growth of 7.5% to cover expenses and cover fixed cost increase.
We are cutting FY16 and FY17 EPS estimates by 2‐9% to factor in lower‐than‐
anticipated margin expansion; given tepid consumer environment and low same
store sales (SSS) growth. We are also introducing FY18 estimates which show 27.5%
sales growth and 37% PAT growth led by 10% SSS growth.
JUBI trades at 44xDec17 EPS after factoring in 30% EPS CAGR post FY16 which
leaves limited scope for further re‐rating. We value the stock at 35xDec17 and
arrive at target price of Rs1140. Maintain ‘Reduce’.
Key financials (Y/e March) 2015 2016E 2017E 2018E
Revenues (Rs m) 20,745 25,344 32,319 41,204
Growth (%) 20.4 22.2 27.5 27.5
EBITDA (Rs m) 2,628 3,150 4,004 5,217
PAT (Rs m) 1,233 1,332 1,671 2,278
EPS (Rs) 18.8 20.3 25.5 34.7
Growth (%) (2.2) 8.1 25.4 36.4
Net DPS (Rs) 0.4 0.5 0.8 1.1
Profitability & Valuation 2015 2016E 2017E 2018E
EBITDA margin (%) 12.7 12.4 12.4 12.7
RoE (%) 20.0 18.4 19.9 23.0
RoCE (%) 19.5 18.1 19.6 22.7
EV / sales (x) 4.6 3.7 2.9 2.3
EV / EBITDA (x) 36.0 30.1 23.6 17.9
PE (x) 77.5 71.7 57.2 41.9
P / BV (x) 14.2 12.3 10.6 8.9
Net dividend yield (%) — — 0.1 0.1
Source: Company Data; PL Research

December 22, 2015 2
Jubilant FoodWorks
Successive price increases might be counterproductive
Jubilant Foodworks has taken a price increase of 3‐4% on the aggregate portfolio in
the second half of November. This is the second price increase by the company in a
span of three months as a price increase of similar nature was undertaken in Sept
2015. However we believe that a spate of price increases in short time interval can
further impact growth in current demand scenario as:
Price increases sharp in a few segments
We analyzed the price increase undertaken by JUBI in the past two trenches across
portfolio. Although the quantum of price increase is 6‐7%, the price increases are not
uniform as a few products in the portfolio have seen even mid to high double digit
price increase.
Sept 2015 price increase was undertaken in only Pizza Mania and Side orders.
Pizza Mania had 2‐17% price increase except Veg singles and Non veg singles.
Pizza mania combo had seen 5‐10% price increase. Cumulatively Pizza Mania has
seen price increase of 22‐60% in the past three years. Side orders saw a price
increase of 9‐27% excluding a few items. Most of the items have seen a price
increase of 30‐50% in the past 3 years. Some of the items like Chocolava cake
have seen prices increasing from Rs40 to Rs105 in the past five years. We note
that side orders are ~16% of sales for JUBI and might come under increasing
pressure due to sustained price increases.
Exhibit 1: Pizza Mania has seen upto 17.3% price increase
Prices (Rs) Nov‐12 Sep‐15 Nov‐15 Change %Nov12‐15
Pizza Mania
Veg Singles 44 58 58 0 32.2
Veg Doubles 66 81 95 17.3 43.1
Veg ‐ Gold Corn 65 70 7.7
Non Veg Singles 78 93 95 2.2 22.4
Non Veg Doubles 89 105 115 9.5 29.4
Spicy Chicken 100 105 5.0
Pizza Mania Combo
Veg Singles 176 240 265 10.4 51.0
Veg Doubles 231 335 370 10.4 60.4
Non Veg Singles 276 385 405 5.2 46.9
Non Veg Doubles 315 430 460 7.0 46.0
Mixed Doubles 281 385 420 9.1 49.3
KIDS MEAL 138 140 1.4
Source: Company, PL Research
Exhibit 2: Most side orders have seen 9.4‐27.3% price increase
Side Orders Nov‐12 Sep‐15 Nov‐15 Change%Nov12‐15
Pasta Italiano Veg 113 135 150 11.1 33.3
Pasta Italiano Non Veg 124 135 165 22.2 33.3
Chicken Wings 124 160 175 9.4 41.4
Garlic Breadsticks 79 95 105 10.5 33.3
Stuffed Garlic Bread 100 130 150 15.4 49.8
Chocó Lava Cake 73 85 105 23.5 43.6
Cheese Dip 23 25 25 0.0 11.1
Calzone Pockets Veg 110 140 27.3
Calzone Pockets Non Veg 125 150 20.0
Taco Indiana Veg 115 140 21.7
Taco Indiana Chicken 130 150 15.4
Oven baked Subwhich non Veg 105 130 23.8
Oven baked Subwhich Veg 105 115 9.5
Zingy parcel 35 35 0.0
Zingy parcel non veg 40 40 0.0
Crispy Chicken Strips 140 140 0.0
Source: Company, PL Research
December 22, 2015 3
Jubilant FoodWorks
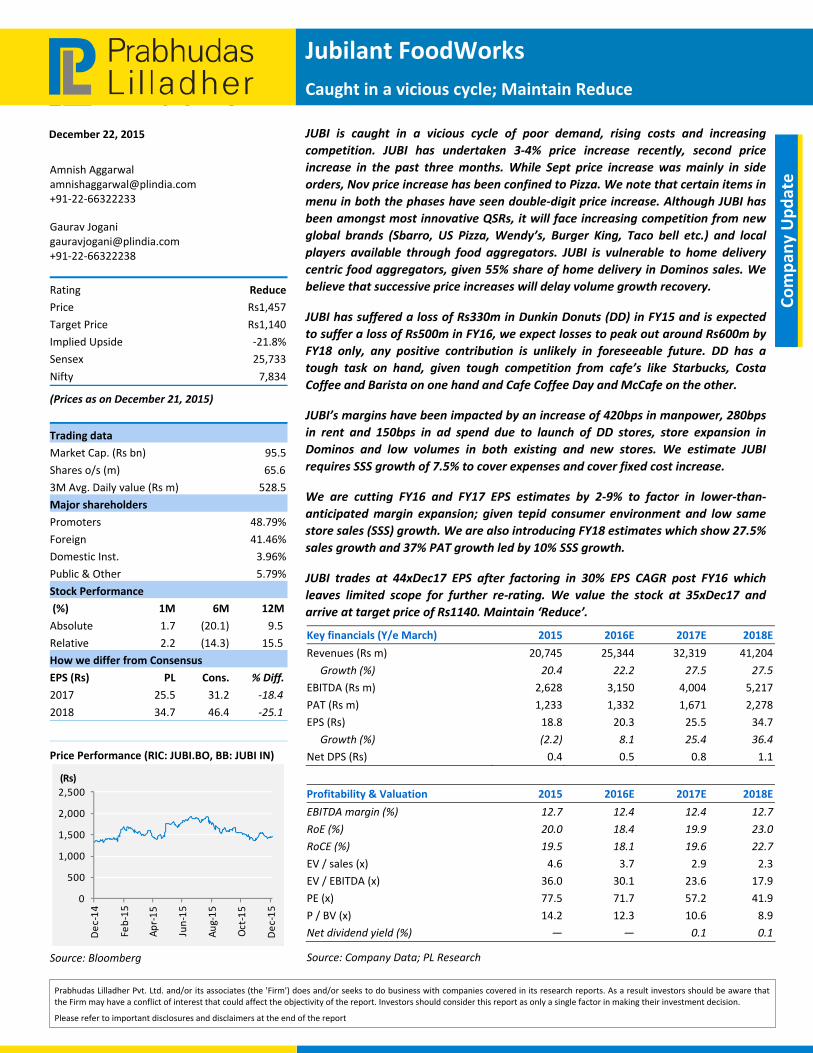
Nov 2015 price increase has been 3‐4% mainly in the Pizza segment. Exotic
Italian Pizza, Veg delight regular and Simply Veg large have not seen any price
increase. Veg delight segment has seen price cut of 4.1% and 10% (Medium and
large) and Veg feast regular Pizza 1.8%. Excluding these, prices have increased
by 1.9% to 24.3%. Prices in the past three years are up by 22‐57% barring a
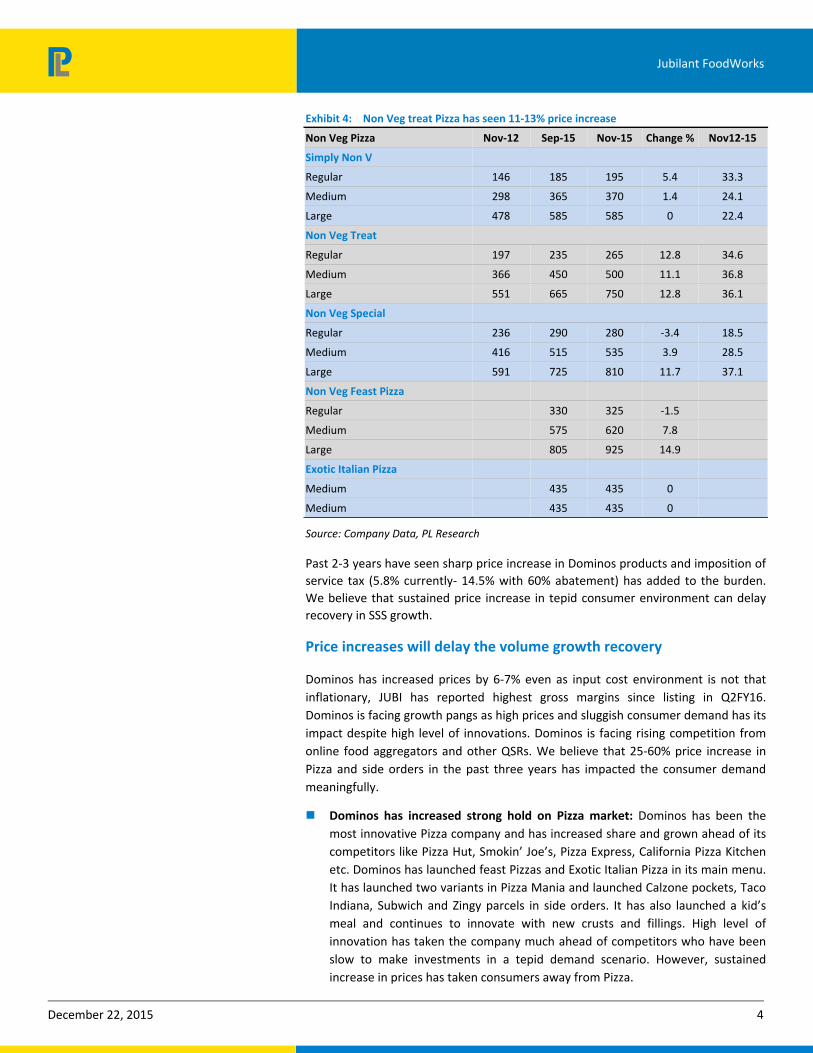
couple of SKUs. Non veg pizza prices have increased up to 15% except in three
SKUs i.e. simply non veg large, regular size in non veg special and non veg feast
pizza. The cumulative price increase in the past three years has been to the tune
of 18.5‐37.1%.
Exhibit 3: Veg Delight Pizza prices cut 4‐10%; Veg treat Pizza prices up 10‐24%
Vegetarian Pizza (Rs) Nov‐12 Sep‐15 Nov‐15 Change% Nov12‐15
Simply Veg Margherita
Regular 84 100 115 15.0 36.3
Medium 203 260 265 1.9 30.9
Large 371 465 465 0 25.3
Veg Delight Spicy Triple Tango, Double Cheese Margherita
Regular 146 185 185 0 26.5
Medium 298 365 350 ‐4.1 17.4
Large 478 585 525 ‐10.3 9.8
Veg Treat Farm House, Country Special, Mexican Green Wave
Regular 146 185 230 24.3 57.3
Medium 298 365 430 17.8 44.2
Large 478 585 645 10.3 34.9
Veg Special Peppy Paneer, Veggie Paradise, 5 Pepper, Deluxe Veggie
Regular 197 235 240 2.1 21.9
Medium 366 450 465 3.3 27.2
Large 551 665 705 6.0 27.9
Veg Feast Pizza Veg Extravenza, Cloud 9, Chef's Veg Wonder
Regular 285 280 ‐1.8
Medium 515 535 3.9
Large 750 810 8.0
Exotic Italian Pizza Milan Veg Fantasy, Roman Veg Supreme
Medium 415 415 0
Medium 435 435 0
Source: Company Data, PL Research
December 22, 2015 4
Jubilant FoodWorks
Exhibit 4: Non Veg treat Pizza has seen 11‐13% price increase
Non Veg Pizza Nov‐12 Sep‐15 Nov‐15 Change % Nov12‐15
Simply Non V
Regular 146 185 195 5.4 33.3
Medium 298 365 370 1.4 24.1
Large 478 585 585 0 22.4
Non Veg Treat
Regular 197 235 265 12.8 34.6
Medium 366 450 500 11.1 36.8
Large 551 665 750 12.8 36.1
Non Veg Special
Regular 236 290 280 ‐3.4 18.5
Medium 416 515 535 3.9 28.5
Large 591 725 810 11.7 37.1
Non Veg Feast Pizza
Regular 330 325 ‐1.5
Medium 575 620 7.8
Large 805 925 14.9
Exotic Italian Pizza
Medium 435 435 0
Medium 435 435 0
Source: Company Data, PL Research
Past 2‐3 years have seen sharp price increase in Dominos products and imposition of
service tax (5.8% currently‐ 14.5% with 60% abatement) has added to the burden.
We believe that sustained price increase in tepid consumer environment can delay
recovery in SSS growth.
Price increases will delay the volume growth recovery
Dominos has increased prices by 6‐7% even as input cost environment is not that
inflationary, JUBI has reported highest gross margins since listing in Q2FY16.
Dominos is facing growth pangs as high prices and sluggish consumer demand has its
impact despite high level of innovations. Dominos is facing rising competition from
online food aggregators and other QSRs. We believe that 25‐60% price increase in
Pizza and side orders in the past three years has impacted the consumer demand
meaningfully.
Dominos has increased strong hold on Pizza market: Dominos has been the
most innovative Pizza company and has increased share and grown ahead of its
competitors like Pizza Hut, Smokin’ Joe’s, Pizza Express, California Pizza Kitchen
etc. Dominos has launched feast Pizzas and Exotic Italian Pizza in its main menu.
It has launched two variants in Pizza Mania and launched Calzone pockets, Taco
Indiana, Subwich and Zingy parcels in side orders. It has also launched a kid’s
meal and continues to innovate with new crusts and fillings. High level of
innovation has taken the company much ahead of competitors who have been
slow to make investments in a tepid demand scenario. However, sustained
increase in prices has taken consumers away from Pizza.
December 22, 2015 5
Jubilant FoodWorks
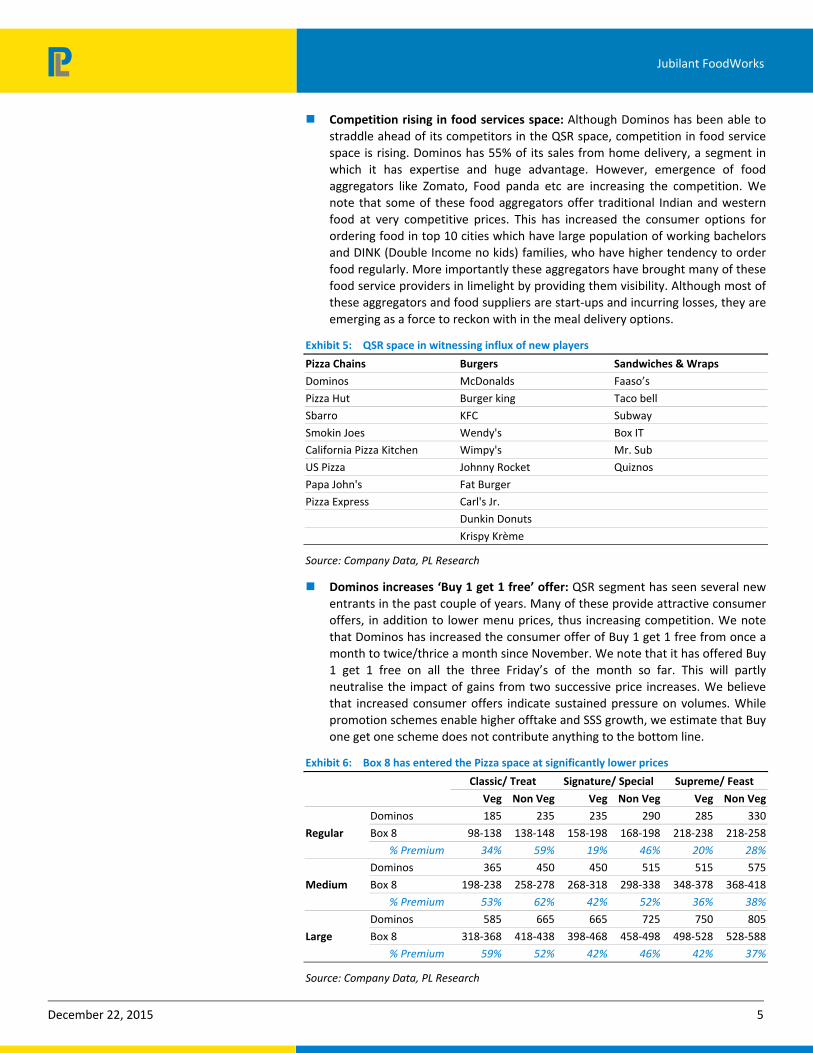
Competition rising in food services space: Although Dominos has been able to
straddle ahead of its competitors in the QSR space, competition in food service space is rising. Dominos has 55% of its sales from home delivery, a segment in
which it has expertise and huge advantage. However, emergence of food aggregators like Zomato, Food panda etc are increasing the competition. We note that some of these food aggregators offer traditional Indian and western
food at very competitive prices. This has increased the consumer options for ordering food in top 10 cities which have large population of working bachelors and DINK (Double Income no kids) families, who have higher tendency to order
food regularly. More importantly these aggregators have brought many of these food service providers in limelight by providing them visibility. Although most of these aggregators and food suppliers are start‐ups and incurring losses, they are
emerging as a force to reckon with in the meal delivery options.
Exhibit 5: QSR space in witnessing influx of new players
Pizza Chains Burgers Sandwiches & Wraps
Dominos McDonalds Faaso’s
Pizza Hut Burger king Taco bell
Sbarro KFC Subway
Smokin Joes Wendy's Box IT
California Pizza Kitchen Wimpy's Mr. Sub
US Pizza Johnny Rocket Quiznos
Papa John's Fat Burger
Pizza Express Carl's Jr.
Dunkin Donuts
Krispy Krème
Source: Company Data, PL Research
Dominos increases ‘Buy 1 get 1 free’ offer: QSR segment has seen several new
entrants in the past couple of years. Many of these provide attractive consumer offers, in addition to lower menu prices, thus increasing competition. We note
that Dominos has increased the consumer offer of Buy 1 get 1 free from once a month to twice/thrice a month since November. We note that it has offered Buy 1 get 1 free on all the three Friday’s of the month so far. This will partly
neutralise the impact of gains from two successive price increases. We believe that increased consumer offers indicate sustained pressure on volumes. While promotion schemes enable higher offtake and SSS growth, we estimate that Buy
one get one scheme does not contribute anything to the bottom line.
Exhibit 6: Box 8 has entered the Pizza space at significantly lower prices
Classic/ Treat Signature/ Special Supreme/ Feast
Veg Non Veg Veg Non Veg Veg Non Veg
Regular
Dominos 185 235 235 290 285 330
Box 8 98‐138 138‐148 158‐198 168‐198 218‐238 218‐258
% Premium 34% 59% 19% 46% 20% 28%
Medium
Dominos 365 450 450 515 515 575
Box 8 198‐238 258‐278 268‐318 298‐338 348‐378 368‐418
% Premium 53% 62% 42% 52% 36% 38%
Large
Dominos 585 665 665 725 750 805
Box 8 318‐368 418‐438 398‐468 458‐498 498‐528 528‐588
% Premium 59% 52% 42% 46% 42% 37%
Source: Company Data, PL Research
December 22, 2015 6
Jubilant FoodWorks
Dunkin Donut losses and high overheads impact margins
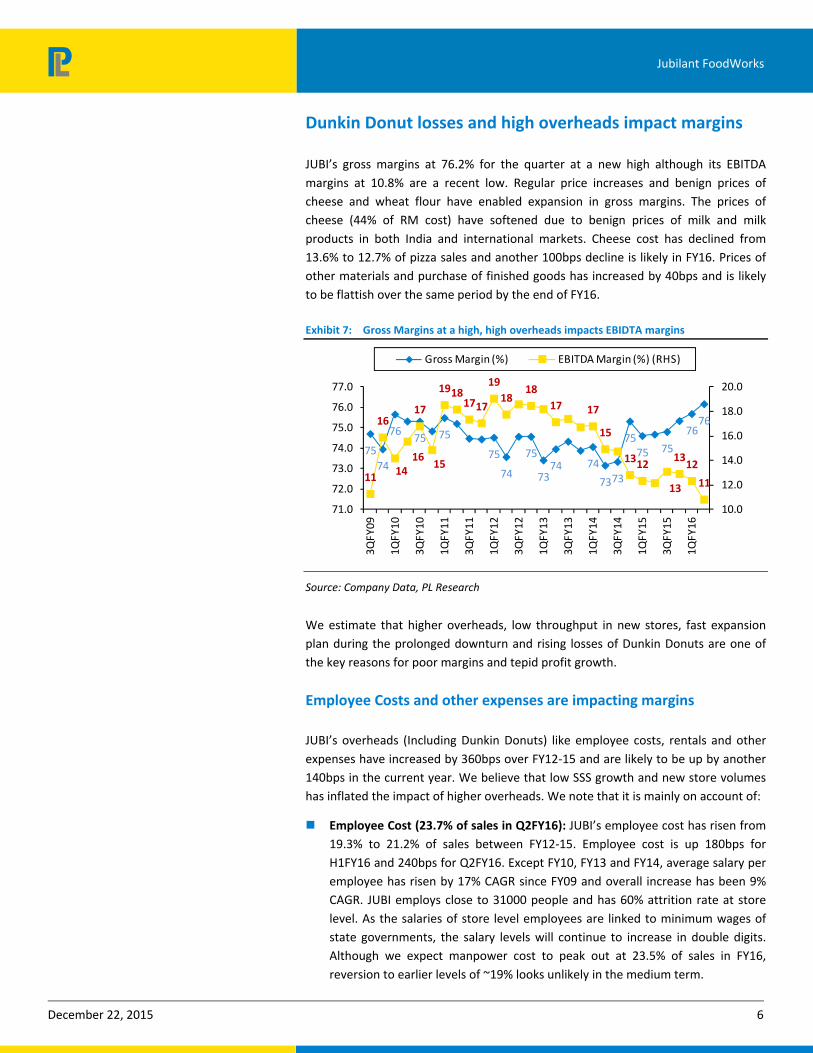
JUBI’s gross margins at 76.2% for the quarter at a new high although its EBITDA
margins at 10.8% are a recent low. Regular price increases and benign prices of
cheese and wheat flour have enabled expansion in gross margins. The prices of
cheese (44% of RM cost) have softened due to benign prices of milk and milk
products in both India and international markets. Cheese cost has declined from
13.6% to 12.7% of pizza sales and another 100bps decline is likely in FY16. Prices of
other materials and purchase of finished goods has increased by 40bps and is likely
to be flattish over the same period by the end of FY16.
Exhibit 7: Gross Margins at a high, high overheads impacts EBIDTA margins
75
74
7675 75
75
74
75
7374 74
7373
7575 75
7676
11
16
1416
17
15
19181717
19
1818
17 17
15
1312
13
1312
11
10.0
12.0
14.0
16.0
18.0
20.0
71.0
72.0
73.0
74.0
75.0
76.0
77.0
3QFY09
1QFY10
3QFY10
1QFY11
3QFY11
1QFY12
3QFY12
1QFY13
3QFY13
1QFY14
3QFY14
1QFY15
3QFY15
1QFY16
Gross Margin (%) EBITDA Margin (%) (RHS)
Source: Company Data, PL Research
We estimate that higher overheads, low throughput in new stores, fast expansion
plan during the prolonged downturn and rising losses of Dunkin Donuts are one of
the key reasons for poor margins and tepid profit growth.
Employee Costs and other expenses are impacting margins
JUBI’s overheads (Including Dunkin Donuts) like employee costs, rentals and other
expenses have increased by 360bps over FY12‐15 and are likely to be up by another
140bps in the current year. We believe that low SSS growth and new store volumes
has inflated the impact of higher overheads. We note that it is mainly on account of:
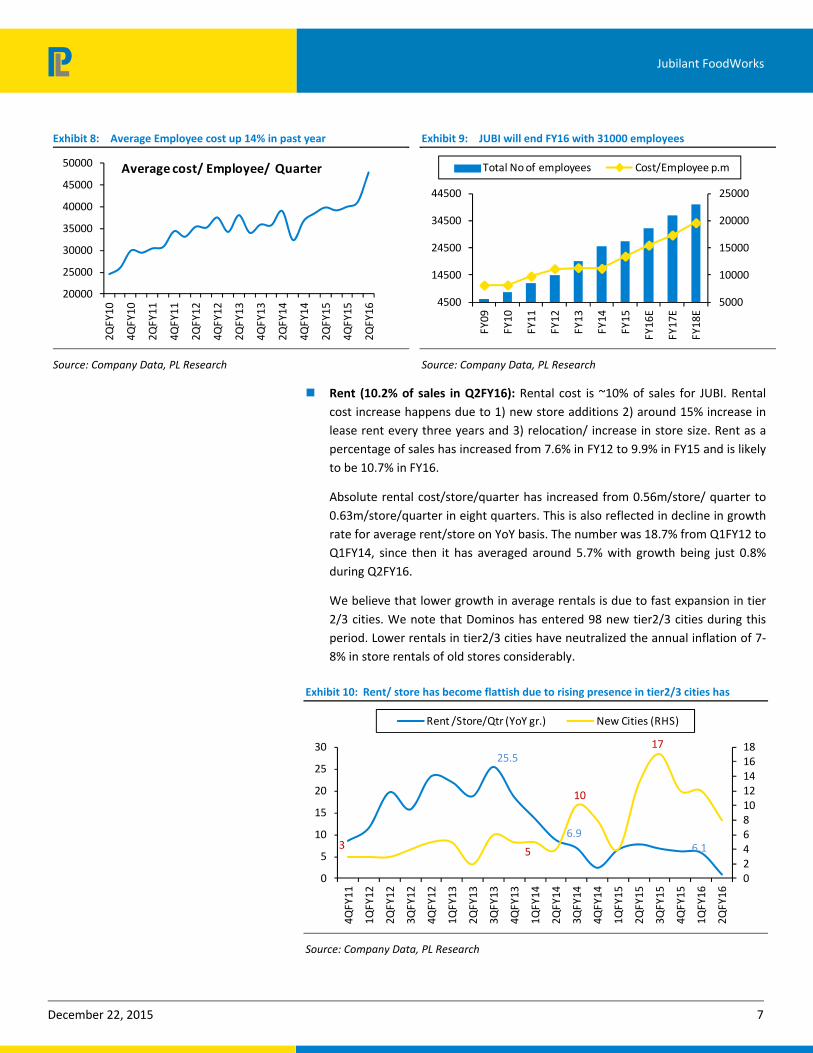
Employee Cost (23.7% of sales in Q2FY16): JUBI’s employee cost has risen from
19.3% to 21.2% of sales between FY12‐15. Employee cost is up 180bps for
H1FY16 and 240bps for Q2FY16. Except FY10, FY13 and FY14, average salary per
employee has risen by 17% CAGR since FY09 and overall increase has been 9%
CAGR. JUBI employs close to 31000 people and has 60% attrition rate at store
level. As the salaries of store level employees are linked to minimum wages of
state governments, the salary levels will continue to increase in double digits.
Although we expect manpower cost to peak out at 23.5% of sales in FY16,
reversion to earlier levels of ~19% looks unlikely in the medium term.
December 22, 2015 7
Jubilant FoodWorks
Exhibit 8: Average Employee cost up 14% in past year
20000
25000
30000
35000
40000
45000
50000
2QFY10
4QFY10
2QFY11
4QFY11
2QFY12
4QFY12
2QFY13
4QFY13
2QFY14
4QFY14
2QFY15
4QFY15
2QFY16
Average cost/ Employee/ Quarter
Source: Company Data, PL Research
Exhibit 9: JUBI will end FY16 with 31000 employees
5000
10000
15000
20000
25000
4500
14500
24500
34500
44500
FY09
FY10
FY11
FY12
FY13
FY14
FY15
FY16E
FY17E
FY18E
Total No of employees Cost/Employee p.m
Source: Company Data, PL Research
Rent (10.2% of sales in Q2FY16): Rental cost is ~10% of sales for JUBI. Rental
cost increase happens due to 1) new store additions 2) around 15% increase in
lease rent every three years and 3) relocation/ increase in store size. Rent as a
percentage of sales has increased from 7.6% in FY12 to 9.9% in FY15 and is likely
to be 10.7% in FY16.
Absolute rental cost/store/quarter has increased from 0.56m/store/ quarter to
0.63m/store/quarter in eight quarters. This is also reflected in decline in growth
rate for average rent/store on YoY basis. The number was 18.7% from Q1FY12 to
Q1FY14, since then it has averaged around 5.7% with growth being just 0.8%
during Q2FY16.
We believe that lower growth in average rentals is due to fast expansion in tier
2/3 cities. We note that Dominos has entered 98 new tier2/3 cities during this
period. Lower rentals in tier2/3 cities have neutralized the annual inflation of 7‐
8% in store rentals of old stores considerably.
Exhibit 10: Rent/ store has become flattish due to rising presence in tier2/3 cities has
25.5
6.96.13
5
10
17
024681012141618
0
5
10
15
20
25
30
4QFY11
1QFY12
2QFY12
3QFY12
4QFY12
1QFY13
2QFY13
3QFY13
4QFY13
1QFY14
2QFY14
3QFY14
4QFY14
1QFY15
2QFY15
3QFY15
4QFY15
1QFY16
2QFY16
Rent /Store/Qtr (YoY gr.) New Cities (RHS)
Source: Company Data, PL Research

December 22, 2015 8
Jubilant FoodWorks
Increase in rent as a percentage of sales despite low increase/ store reflect the
impact of low same store sales growth and more importantly poor throughput in
new cities.
Other Expenses (31.4% of sales in 2QFY16): Other expenses include expenses
on Manufacturing and repairs (12.9%), delivery cost (3%), adspend (5.5%),
franchisee fee (3.3%) and Misc and others (6.6%). Other expenses have
increased by 240bps i.e. from 28.8% in FY12 to 31.2% in FY15. Adspend has
increased by 150bps, Misc expenses by 90bps and manufacturing expenses by
70bps. Adspend has been on new launches, Dunkin Donuts addition and also
geographical expansion. Power and fuel expenses have increased by 110bps to
5.8% of sales led by steady increase in power tariffs.
Exhibit 11: Other expenses up 270bps since 4QFY13
32.4
28.2
30.731.6 31.4
252627282930313233
1QFY10
3QFY10
1QFY11
3QFY11
1QFY12
3QFY12
1QFY13
3QFY13
1QFY14
3QFY14
1QFY15
3QFY15
1QFY16
Other Expenditure
Source: Company Data, PL Research
Exhibit 12: Staff Costs up 410bps, rent 280bps over FY12‐16
20.0
19.3
19.1
19.5
21.2 23.4
23.5
23.3
7.9
7.6 8.3 9.0 9.9 10.7
10.4
10.0
29.3
28.8
29.2
30.6
31.2
29.7
29.7
29.8
0.0
5.0
10.0
15.0
20.0
25.0
30.0
35.0
FY11 FY12 FY13 FY14 FY15 FY16E FY17E FY18E
Staff Cost Rent Cost Other Expenses
Source: Company Data, PL Research
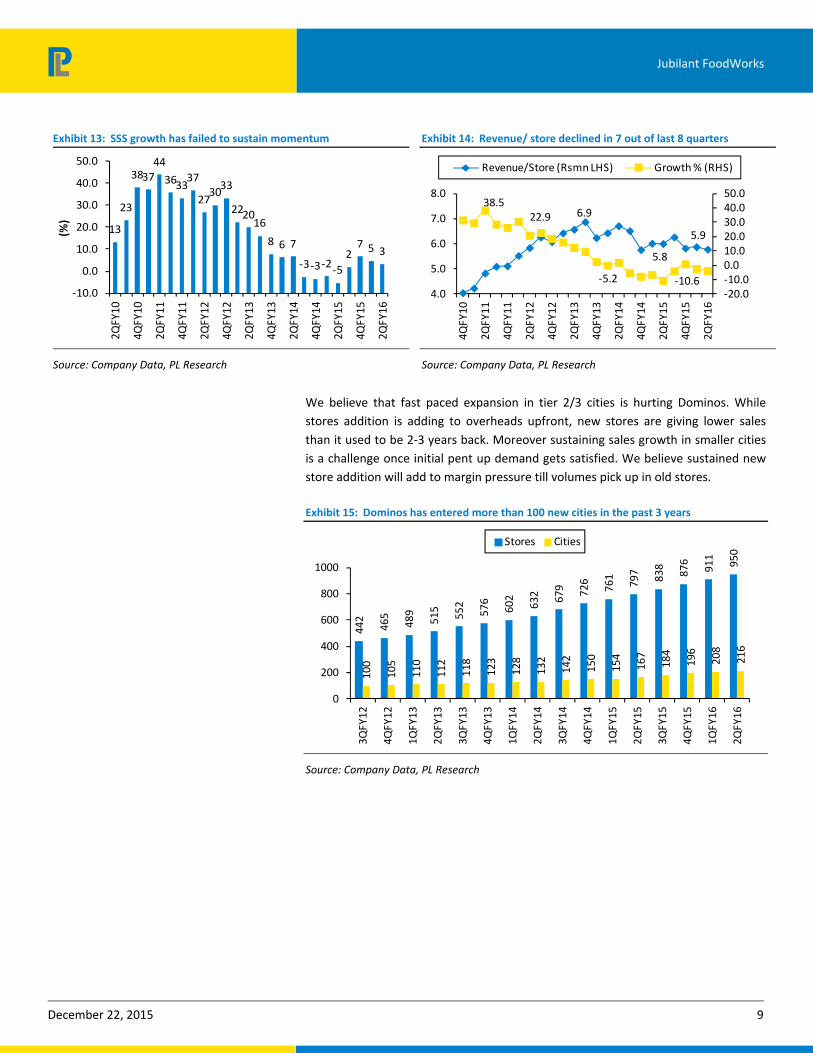
Declining revenue/Store, rising rollout in interiors increasing costs
Dominos SSS growth has been languishing in low to mid single digits, after it turned
positive in 3QFY15. Systemwide revenue per store increased from Rs4.1m in 4QFY10
to a high of Rs6.9m in 2QFY13. However it has declined for 7 out of last 8 quarters
and stands at Rs5.8m in 2QFY16. Revenue per store has declined by 16% in past
three years with 2QFY15 sales/store declining by 10.6%. Jubilant Food has doubled
the number of stores from 465 in FY12 to 930 in FY15 (includes 54 DD Stores). Tepid
SSS growth in Dominos and slow ramp up of DD has impacted revenue per store. We
estimate that the average sales/store of Dominos is Rs25m as against Rs9~10m for
DD. Decline in system sales/store would have been lower by 2‐3%, but for lower
sales in DD.
December 22, 2015 9
Jubilant FoodWorks
Exhibit 13: SSS growth has failed to sustain momentum
13
23
383744
363337
273033
222016
8 6 7
‐3‐3‐2‐5
27 5 3
‐10.0
0.0
10.0
20.0
30.0
40.0
50.0
2QFY10
4QFY10
2QFY11
4QFY11
2QFY12
4QFY12
2QFY13
4QFY13
2QFY14
4QFY14
2QFY15
4QFY15
2QFY16
(%)
Source: Company Data, PL Research
Exhibit 14: Revenue/ store declined in 7 out of last 8 quarters
6.9
5.8
5.9
38.522.9
‐5.2 ‐10.6‐20.0‐10.00.010.020.030.040.050.0
4.0
5.0
6.0
7.0
8.0
4QFY10
2QFY11
4QFY11
2QFY12
4QFY12
2QFY13
4QFY13
2QFY14
4QFY14
2QFY15
4QFY15
2QFY16
Revenue/Store (Rsmn LHS) Growth % (RHS)
Source: Company Data, PL Research
We believe that fast paced expansion in tier 2/3 cities is hurting Dominos. While
stores addition is adding to overheads upfront, new stores are giving lower sales
than it used to be 2‐3 years back. Moreover sustaining sales growth in smaller cities
is a challenge once initial pent up demand gets satisfied. We believe sustained new
store addition will add to margin pressure till volumes pick up in old stores.
Exhibit 15: Dominos has entered more than 100 new cities in the past 3 years
442
465
489
515
552
576
602
632 679 726
761
797
838
876 911
950
100
105
110
112
118
123
128 132
142
150
154
167
184
196 208
216
0
200
400
600
800
1000
3QFY12
4QFY12
1QFY13
2QFY13
3QFY13
4QFY13
1QFY14
2QFY14
3QFY14
4QFY14
1QFY15
2QFY15
3QFY15
4QFY15
1QFY16
2QFY16
Stores Cities
Source: Company Data, PL Research
December 22, 2015 10
Jubilant FoodWorks
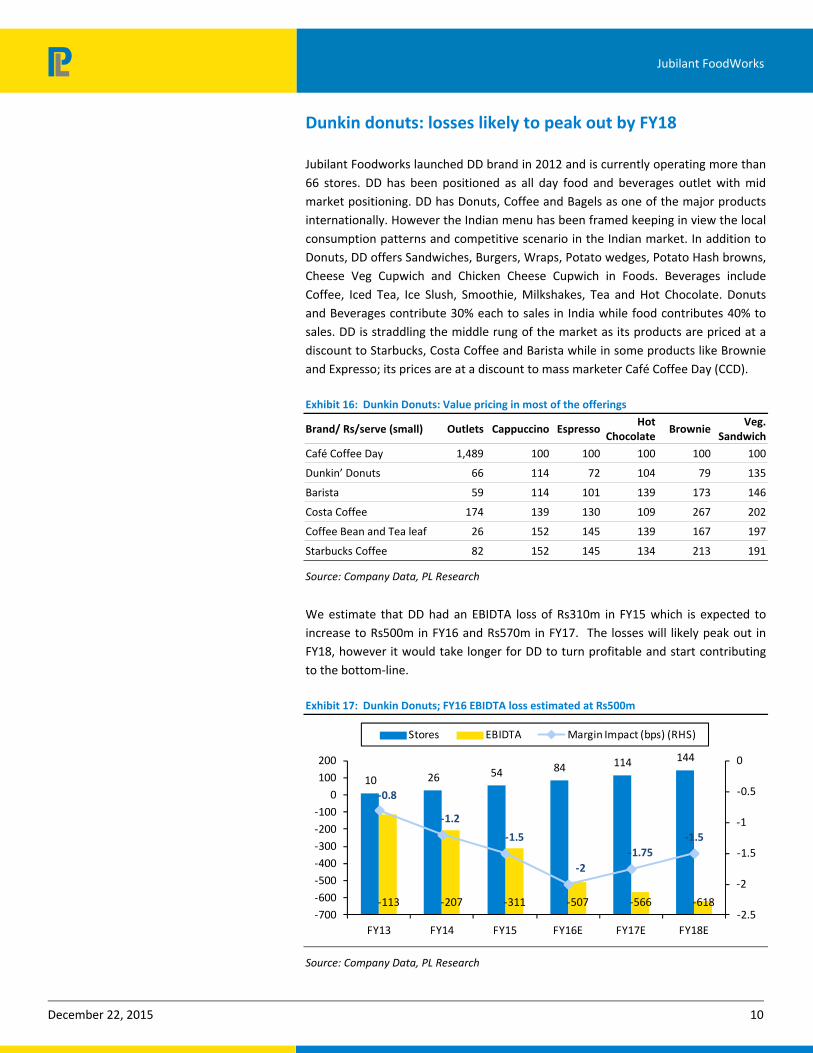
Dunkin donuts: losses likely to peak out by FY18
Jubilant Foodworks launched DD brand in 2012 and is currently operating more than
66 stores. DD has been positioned as all day food and beverages outlet with mid
market positioning. DD has Donuts, Coffee and Bagels as one of the major products
internationally. However the Indian menu has been framed keeping in view the local
consumption patterns and competitive scenario in the Indian market. In addition to
Donuts, DD offers Sandwiches, Burgers, Wraps, Potato wedges, Potato Hash browns,
Cheese Veg Cupwich and Chicken Cheese Cupwich in Foods. Beverages include
Coffee, Iced Tea, Ice Slush, Smoothie, Milkshakes, Tea and Hot Chocolate. Donuts
and Beverages contribute 30% each to sales in India while food contributes 40% to
sales. DD is straddling the middle rung of the market as its products are priced at a
discount to Starbucks, Costa Coffee and Barista while in some products like Brownie
and Expresso; its prices are at a discount to mass marketer Café Coffee Day (CCD).
Exhibit 16: Dunkin Donuts: Value pricing in most of the offerings
Brand/ Rs/serve (small) Outlets Cappuccino Espresso Hot
ChocolateBrownie
Veg. Sandwich
Café Coffee Day 1,489 100 100 100 100 100
Dunkin’ Donuts 66 114 72 104 79 135
Barista 59 114 101 139 173 146
Costa Coffee 174 139 130 109 267 202
Coffee Bean and Tea leaf 26 152 145 139 167 197
Starbucks Coffee 82 152 145 134 213 191
Source: Company Data, PL Research
We estimate that DD had an EBIDTA loss of Rs310m in FY15 which is expected to
increase to Rs500m in FY16 and Rs570m in FY17. The losses will likely peak out in
FY18, however it would take longer for DD to turn profitable and start contributing
to the bottom‐line.
Exhibit 17: Dunkin Donuts; FY16 EBIDTA loss estimated at Rs500m
10 26 54 84 114 144
‐113 ‐207 ‐311 ‐507 ‐566 ‐618
‐0.8
‐1.2
‐1.5
‐2
‐1.75
‐1.5
‐2.5
‐2
‐1.5
‐1
‐0.5
0
‐700
‐600
‐500
‐400
‐300
‐200
‐100
0
100
200
FY13 FY14 FY15 FY16E FY17E FY18E
Stores EBIDTA Margin Impact (bps) (RHS)
Source: Company Data, PL Research
December 22, 2015 11
Jubilant FoodWorks
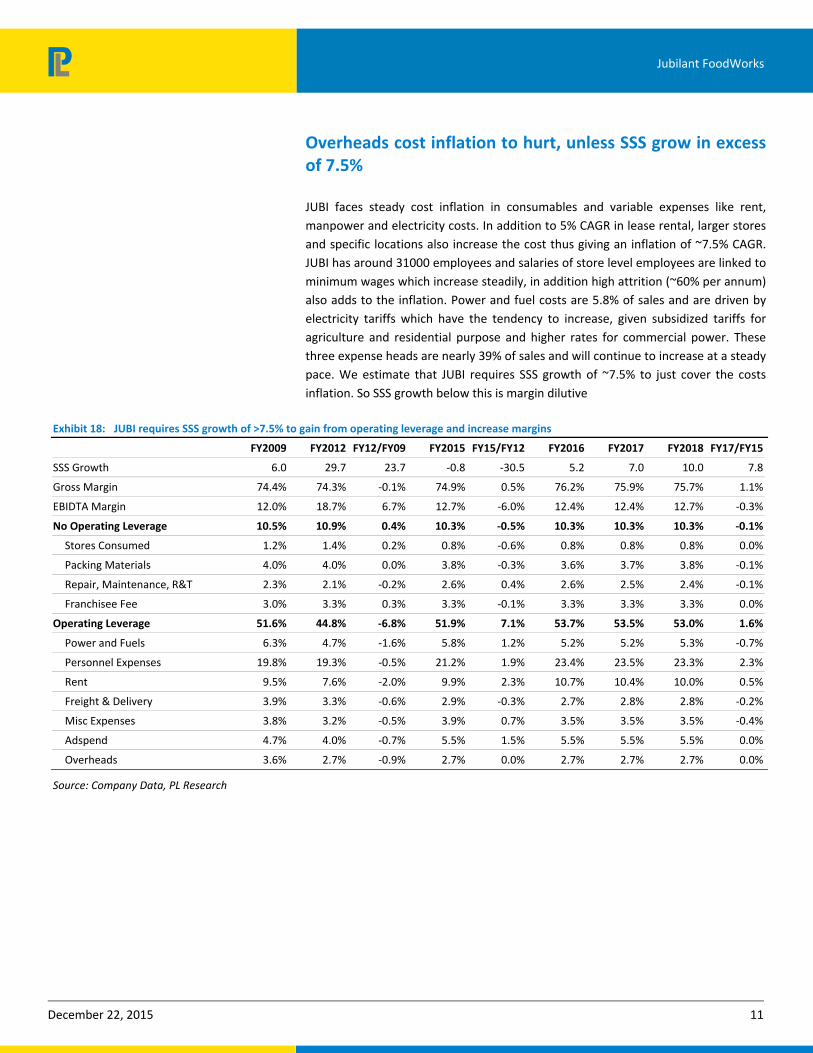
Overheads cost inflation to hurt, unless SSS grow in excess of 7.5%
JUBI faces steady cost inflation in consumables and variable expenses like rent,
manpower and electricity costs. In addition to 5% CAGR in lease rental, larger stores
and specific locations also increase the cost thus giving an inflation of ~7.5% CAGR.
JUBI has around 31000 employees and salaries of store level employees are linked to
minimum wages which increase steadily, in addition high attrition (~60% per annum)
also adds to the inflation. Power and fuel costs are 5.8% of sales and are driven by
electricity tariffs which have the tendency to increase, given subsidized tariffs for
agriculture and residential purpose and higher rates for commercial power. These
three expense heads are nearly 39% of sales and will continue to increase at a steady
pace. We estimate that JUBI requires SSS growth of ~7.5% to just cover the costs
inflation. So SSS growth below this is margin dilutive
Exhibit 18: JUBI requires SSS growth of >7.5% to gain from operating leverage and increase margins
FY2009 FY2012 FY12/FY09 FY2015 FY15/FY12 FY2016 FY2017 FY2018 FY17/FY15
SSS Growth 6.0 29.7 23.7 ‐0.8 ‐30.5 5.2 7.0 10.0 7.8
Gross Margin 74.4% 74.3% ‐0.1% 74.9% 0.5% 76.2% 75.9% 75.7% 1.1%
EBIDTA Margin 12.0% 18.7% 6.7% 12.7% ‐6.0% 12.4% 12.4% 12.7% ‐0.3%
No Operating Leverage 10.5% 10.9% 0.4% 10.3% ‐0.5% 10.3% 10.3% 10.3% ‐0.1%
Stores Consumed 1.2% 1.4% 0.2% 0.8% ‐0.6% 0.8% 0.8% 0.8% 0.0%
Packing Materials 4.0% 4.0% 0.0% 3.8% ‐0.3% 3.6% 3.7% 3.8% ‐0.1%
Repair, Maintenance, R&T 2.3% 2.1% ‐0.2% 2.6% 0.4% 2.6% 2.5% 2.4% ‐0.1%
Franchisee Fee 3.0% 3.3% 0.3% 3.3% ‐0.1% 3.3% 3.3% 3.3% 0.0%
Operating Leverage 51.6% 44.8% ‐6.8% 51.9% 7.1% 53.7% 53.5% 53.0% 1.6%
Power and Fuels 6.3% 4.7% ‐1.6% 5.8% 1.2% 5.2% 5.2% 5.3% ‐0.7%
Personnel Expenses 19.8% 19.3% ‐0.5% 21.2% 1.9% 23.4% 23.5% 23.3% 2.3%
Rent 9.5% 7.6% ‐2.0% 9.9% 2.3% 10.7% 10.4% 10.0% 0.5%
Freight & Delivery 3.9% 3.3% ‐0.6% 2.9% ‐0.3% 2.7% 2.8% 2.8% ‐0.2%
Misc Expenses 3.8% 3.2% ‐0.5% 3.9% 0.7% 3.5% 3.5% 3.5% ‐0.4%
Adspend 4.7% 4.0% ‐0.7% 5.5% 1.5% 5.5% 5.5% 5.5% 0.0%
Overheads 3.6% 2.7% ‐0.9% 2.7% 0.0% 2.7% 2.7% 2.7% 0.0%
Source: Company Data, PL Research
December 22, 2015 12
Jubilant FoodWorks
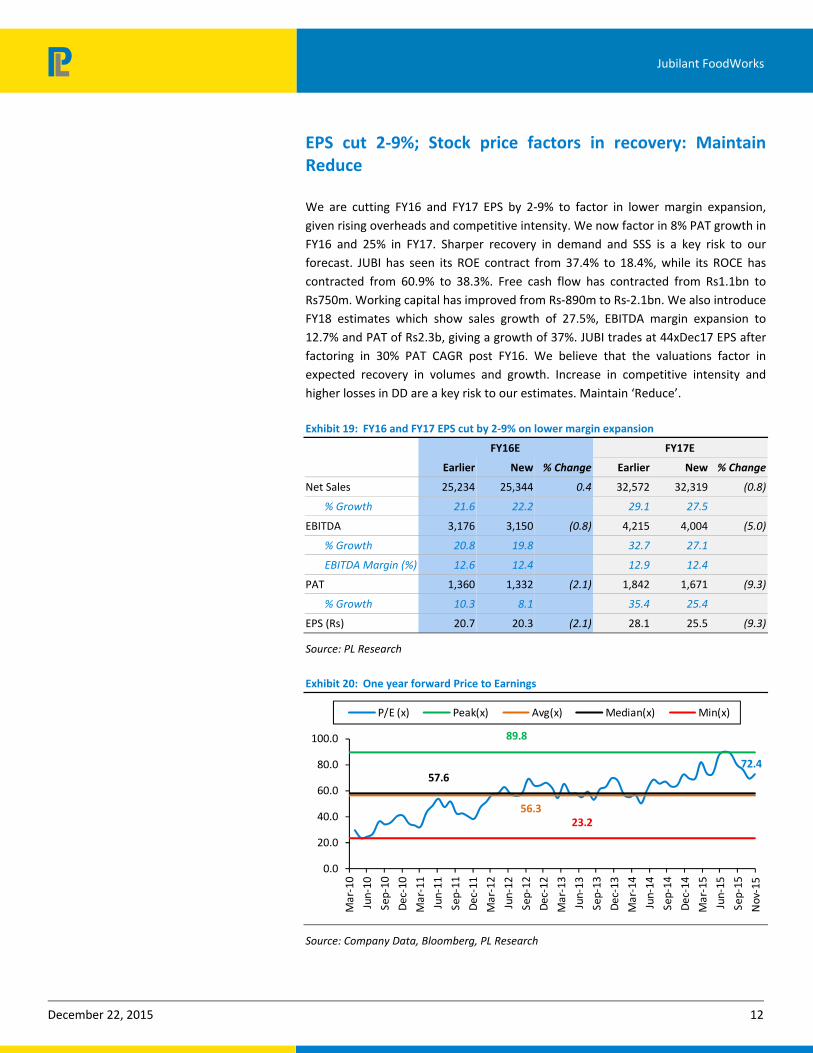
EPS cut 2‐9%; Stock price factors in recovery: Maintain Reduce
We are cutting FY16 and FY17 EPS by 2‐9% to factor in lower margin expansion,
given rising overheads and competitive intensity. We now factor in 8% PAT growth in
FY16 and 25% in FY17. Sharper recovery in demand and SSS is a key risk to our
forecast. JUBI has seen its ROE contract from 37.4% to 18.4%, while its ROCE has
contracted from 60.9% to 38.3%. Free cash flow has contracted from Rs1.1bn to
Rs750m. Working capital has improved from Rs‐890m to Rs‐2.1bn. We also introduce
FY18 estimates which show sales growth of 27.5%, EBITDA margin expansion to
12.7% and PAT of Rs2.3b, giving a growth of 37%. JUBI trades at 44xDec17 EPS after
factoring in 30% PAT CAGR post FY16. We believe that the valuations factor in
expected recovery in volumes and growth. Increase in competitive intensity and
higher losses in DD are a key risk to our estimates. Maintain ‘Reduce’.
Exhibit 19: FY16 and FY17 EPS cut by 2‐9% on lower margin expansion
FY16E FY17E
Earlier New % Change Earlier New % Change
Net Sales 25,234 25,344 0.4 32,572 32,319 (0.8)
% Growth 21.6 22.2 29.1 27.5
EBITDA 3,176 3,150 (0.8) 4,215 4,004 (5.0)
% Growth 20.8 19.8 32.7 27.1
EBITDA Margin (%) 12.6 12.4 12.9 12.4
PAT 1,360 1,332 (2.1) 1,842 1,671 (9.3)
% Growth 10.3 8.1 35.4 25.4
EPS (Rs) 20.7 20.3 (2.1) 28.1 25.5 (9.3)
Source: PL Research
Exhibit 20: One year forward Price to Earnings
Source: Company Data, Bloomberg, PL Research
72.4
89.8
56.3
57.6
23.2
0.0
20.0
40.0
60.0
80.0
100.0
Mar‐10
Jun‐10
Sep‐10
Dec‐10
Mar‐11
Jun‐11
Sep‐11
Dec‐11
Mar‐12
Jun‐12
Sep‐12
Dec‐12
Mar‐13
Jun‐13
Sep‐13
Dec‐13
Mar‐14
Jun‐14
Sep‐14
Dec‐14
Mar‐15
Jun‐15
Sep‐15
Nov‐15
P/E (x) Peak(x) Avg(x) Median(x) Min(x)
December 22, 2015 13
Jubilant FoodWorks
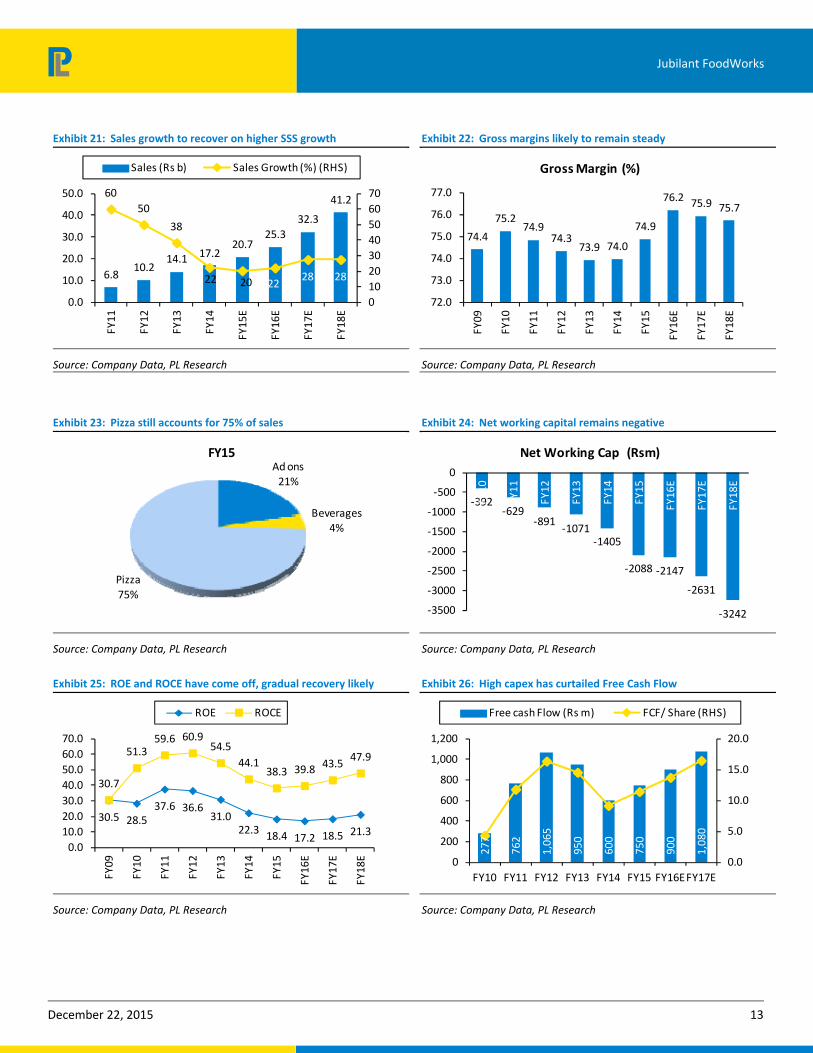
Exhibit 21: Sales growth to recover on higher SSS growth
6.810.2
14.1 17.220.7
25.3
32.3
41.260
50
38
22 20 2228 28
0
10
20
30
40
50
60
70
0.0
10.0
20.0
30.0
40.0
50.0
FY11
FY12
FY13
FY14
FY15E
FY16E
FY17E
FY18E
Sales (Rs b) Sales Growth (%) (RHS)
Source: Company Data, PL Research
Exhibit 22: Gross margins likely to remain steady
74.4
75.274.9
74.373.9 74.0
74.9
76.2 75.9 75.7
72.0
73.0
74.0
75.0
76.0
77.0
FY09
FY10
FY11
FY12
FY13
FY14
FY15
FY16E
FY17E
FY18E
Gross Margin (%)
Source: Company Data, PL Research
Exhibit 23: Pizza still accounts for 75% of sales
Ad ons21%
Beverages4%
Pizza
75%
FY15
Source: Company Data, PL Research
Exhibit 24: Net working capital remains negative
‐392‐629
‐891‐1071
‐1405
‐2088 ‐2147
‐2631
‐3242‐3500
‐3000
‐2500
‐2000
‐1500
‐1000
‐500
0FY10
FY11
FY12
FY13
FY14
FY15
FY16E
FY17E
FY18E
Net Working Cap (Rsm)
Source: Company Data, PL Research
Exhibit 25: ROE and ROCE have come off, gradual recovery likely
30.5 28.537.6 36.6
31.022.3
18.4 17.2 18.5 21.3
30.7
51.359.6 60.9
54.5
44.138.3 39.8 43.5
47.9
0.0
10.0
20.0
30.0
40.0
50.0
60.0
70.0
FY09
FY10
FY11
FY12
FY13
FY14
FY15
FY16E
FY17E
FY18E
ROE ROCE
Source: Company Data, PL Research
Exhibit 26: High capex has curtailed Free Cash Flow
277
762
1,065
950
600
750
900
1,080
0.0
5.0
10.0
15.0
20.0
0
200
400
600
800
1,000
1,200
FY10 FY11 FY12 FY13 FY14 FY15 FY16EFY17E
Free cash Flow (Rs m) FCF/ Share (RHS)
Source: Company Data, PL Research
December 22, 2015 14
Jubilant FoodWorks
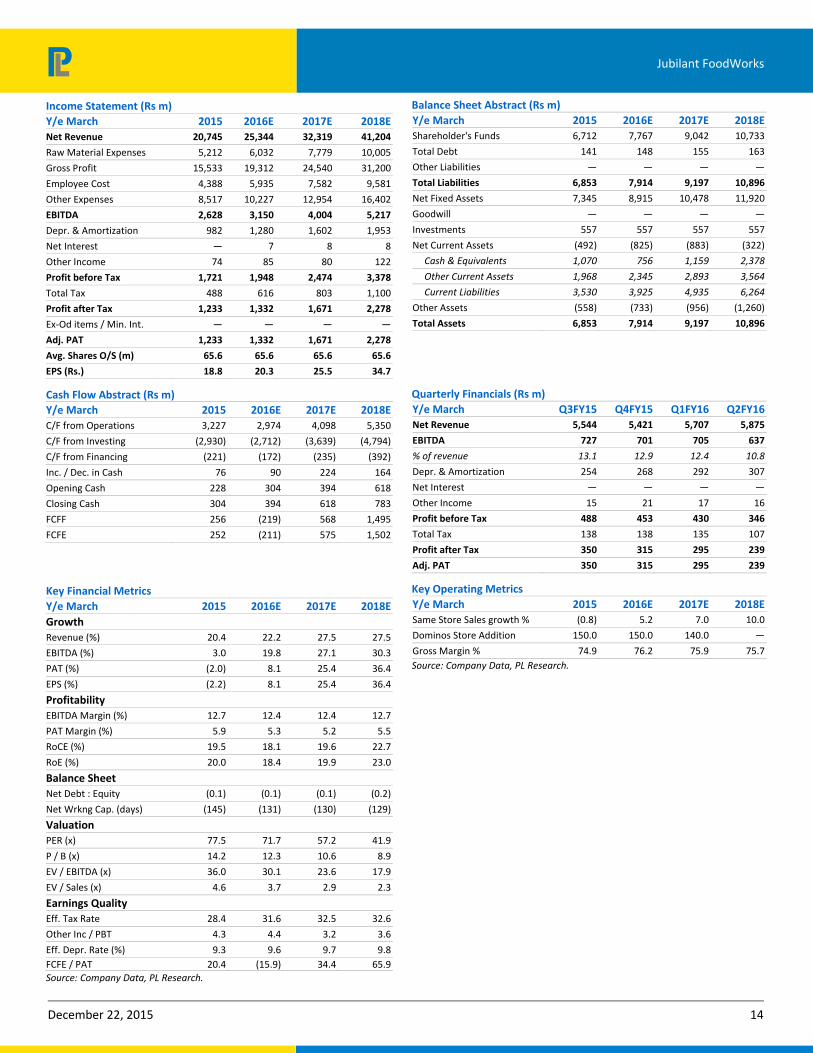
Income Statement (Rs m)
Y/e March 2015 2016E 2017E 2018E
Net Revenue 20,745 25,344 32,319 41,204
Raw Material Expenses 5,212 6,032 7,779 10,005
Gross Profit 15,533 19,312 24,540 31,200
Employee Cost 4,388 5,935 7,582 9,581
Other Expenses 8,517 10,227 12,954 16,402
EBITDA 2,628 3,150 4,004 5,217
Depr. & Amortization 982 1,280 1,602 1,953
Net Interest — 7 8 8
Other Income 74 85 80 122
Profit before Tax 1,721 1,948 2,474 3,378
Total Tax 488 616 803 1,100
Profit after Tax 1,233 1,332 1,671 2,278
Ex‐Od items / Min. Int. — — — —
Adj. PAT 1,233 1,332 1,671 2,278
Avg. Shares O/S (m) 65.6 65.6 65.6 65.6
EPS (Rs.) 18.8 20.3 25.5 34.7
Cash Flow Abstract (Rs m)
Y/e March 2015 2016E 2017E 2018E
C/F from Operations 3,227 2,974 4,098 5,350
C/F from Investing (2,930) (2,712) (3,639) (4,794)
C/F from Financing (221) (172) (235) (392)
Inc. / Dec. in Cash 76 90 224 164
Opening Cash 228 304 394 618
Closing Cash 304 394 618 783
FCFF 256 (219) 568 1,495
FCFE 252 (211) 575 1,502
Key Financial Metrics
Y/e March 2015 2016E 2017E 2018E
Growth
Revenue (%) 20.4 22.2 27.5 27.5
EBITDA (%) 3.0 19.8 27.1 30.3
PAT (%) (2.0) 8.1 25.4 36.4
EPS (%) (2.2) 8.1 25.4 36.4
Profitability
EBITDA Margin (%) 12.7 12.4 12.4 12.7
PAT Margin (%) 5.9 5.3 5.2 5.5
RoCE (%) 19.5 18.1 19.6 22.7
RoE (%) 20.0 18.4 19.9 23.0
Balance Sheet
Net Debt : Equity (0.1) (0.1) (0.1) (0.2)
Net Wrkng Cap. (days) (145) (131) (130) (129)
Valuation
PER (x) 77.5 71.7 57.2 41.9
P / B (x) 14.2 12.3 10.6 8.9
EV / EBITDA (x) 36.0 30.1 23.6 17.9
EV / Sales (x) 4.6 3.7 2.9 2.3
Earnings Quality
Eff. Tax Rate 28.4 31.6 32.5 32.6
Other Inc / PBT 4.3 4.4 3.2 3.6
Eff. Depr. Rate (%) 9.3 9.6 9.7 9.8
FCFE / PAT 20.4 (15.9) 34.4 65.9
Source: Company Data, PL Research.
Balance Sheet Abstract (Rs m)
Y/e March 2015 2016E 2017E 2018E
Shareholder's Funds 6,712 7,767 9,042 10,733
Total Debt 141 148 155 163
Other Liabilities — — — —
Total Liabilities 6,853 7,914 9,197 10,896
Net Fixed Assets 7,345 8,915 10,478 11,920
Goodwill — — — —
Investments 557 557 557 557
Net Current Assets (492) (825) (883) (322)
Cash & Equivalents 1,070 756 1,159 2,378
Other Current Assets 1,968 2,345 2,893 3,564
Current Liabilities 3,530 3,925 4,935 6,264
Other Assets (558) (733) (956) (1,260)
Total Assets 6,853 7,914 9,197 10,896
Quarterly Financials (Rs m)
Y/e March Q3FY15 Q4FY15 Q1FY16 Q2FY16
Net Revenue 5,544 5,421 5,707 5,875
EBITDA 727 701 705 637
% of revenue 13.1 12.9 12.4 10.8
Depr. & Amortization 254 268 292 307
Net Interest — — — —
Other Income 15 21 17 16
Profit before Tax 488 453 430 346
Total Tax 138 138 135 107
Profit after Tax 350 315 295 239
Adj. PAT 350 315 295 239
Key Operating Metrics
Y/e March 2015 2016E 2017E 2018E
Same Store Sales growth % (0.8) 5.2 7.0 10.0
Dominos Store Addition 150.0 150.0 140.0 —
Gross Margin % 74.9 76.2 75.9 75.7
Source: Company Data, PL Research.
December 22, 2015 15
Jubilant FoodWorks
Prabhudas Lilladher Pvt. Ltd.
3rd Floor, Sadhana House, 570, P. B. Marg, Worli, Mumbai‐400 018, India
Tel: (91 22) 6632 2222 Fax: (91 22) 6632 2209
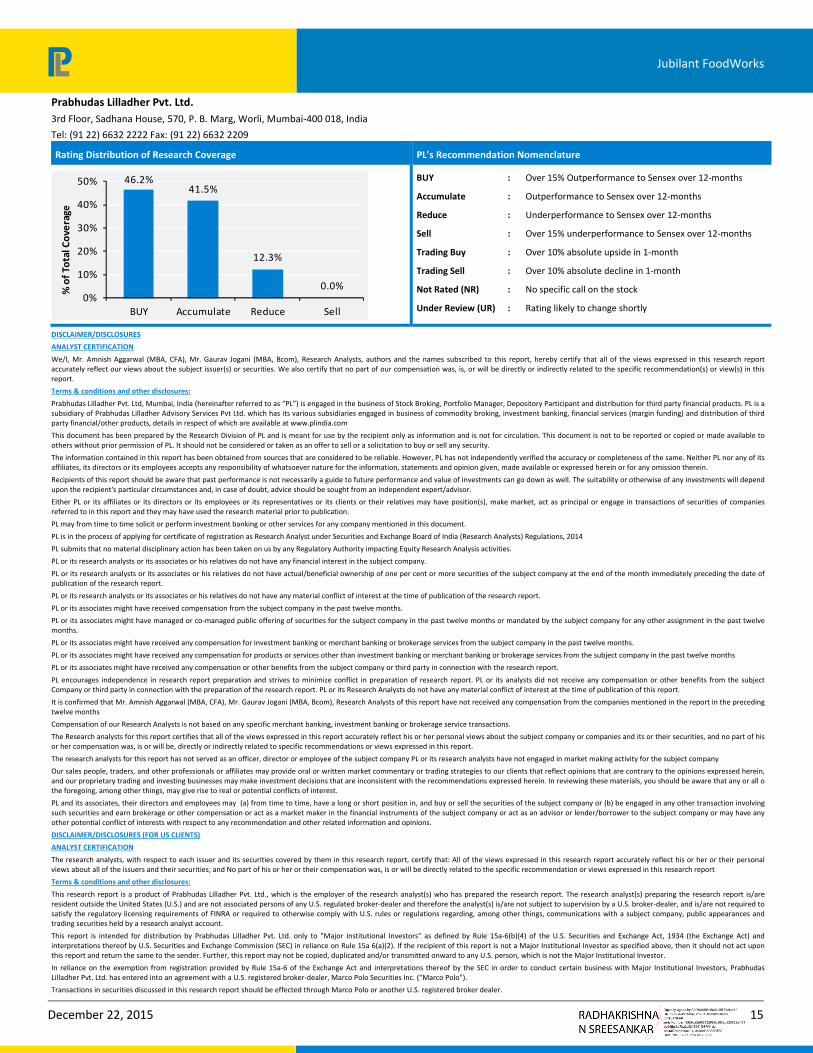
Rating Distribution of Research Coverage PL’s Recommendation Nomenclature
46.2%41.5%
12.3%
0.0%0%
10%
20%
30%
40%
50%
BUY Accumulate Reduce Sell
% of Total Coverage
BUY : Over 15% Outperformance to Sensex over 12‐months
Accumulate : Outperformance to Sensex over 12‐months
Reduce : Underperformance to Sensex over 12‐months
Sell : Over 15% underperformance to Sensex over 12‐months
Trading Buy : Over 10% absolute upside in 1‐month
Trading Sell : Over 10% absolute decline in 1‐month
Not Rated (NR) : No specific call on the stock
Under Review (UR) : Rating likely to change shortly
DISCLAIMER/DISCLOSURES
ANALYST CERTIFICATION
We/I, Mr. Amnish Aggarwal (MBA, CFA), Mr. Gaurav Jogani (MBA, Bcom), Research Analysts, authors and the names subscribed to this report, hereby certify that all of the views expressed in this research report accurately reflect our views about the subject issuer(s) or securities. We also certify that no part of our compensation was, is, or will be directly or indirectly related to the specific recommendation(s) or view(s) in this report.
Terms & conditions and other disclosures:
Prabhudas Lilladher Pvt. Ltd, Mumbai, India (hereinafter referred to as “PL”) is engaged in the business of Stock Broking, Portfolio Manager, Depository Participant and distribution for third party financial products. PL is a subsidiary of Prabhudas Lilladher Advisory Services Pvt Ltd. which has its various subsidiaries engaged in business of commodity broking, investment banking, financial services (margin funding) and distribution of third party financial/other products, details in respect of which are available at www.plindia.com
This document has been prepared by the Research Division of PL and is meant for use by the recipient only as information and is not for circulation. This document is not to be reported or copied or made available to others without prior permission of PL. It should not be considered or taken as an offer to sell or a solicitation to buy or sell any security.
The information contained in this report has been obtained from sources that are considered to be reliable. However, PL has not independently verified the accuracy or completeness of the same. Neither PL nor any of its affiliates, its directors or its employees accepts any responsibility of whatsoever nature for the information, statements and opinion given, made available or expressed herein or for any omission therein.
Recipients of this report should be aware that past performance is not necessarily a guide to future performance and value of investments can go down as well. The suitability or otherwise of any investments will depend upon the recipient's particular circumstances and, in case of doubt, advice should be sought from an independent expert/advisor.
Either PL or its affiliates or its directors or its employees or its representatives or its clients or their relatives may have position(s), make market, act as principal or engage in transactions of securities of companies referred to in this report and they may have used the research material prior to publication.
PL may from time to time solicit or perform investment banking or other services for any company mentioned in this document.
PL is in the process of applying for certificate of registration as Research Analyst under Securities and Exchange Board of India (Research Analysts) Regulations, 2014
PL submits that no material disciplinary action has been taken on us by any Regulatory Authority impacting Equity Research Analysis activities.
PL or its research analysts or its associates or his relatives do not have any financial interest in the subject company.
PL or its research analysts or its associates or his relatives do not have actual/beneficial ownership of one per cent or more securities of the subject company at the end of the month immediately preceding the date of publication of the research report.
PL or its research analysts or its associates or his relatives do not have any material conflict of interest at the time of publication of the research report.
PL or its associates might have received compensation from the subject company in the past twelve months.
PL or its associates might have managed or co‐managed public offering of securities for the subject company in the past twelve months or mandated by the subject company for any other assignment in the past twelve months.
PL or its associates might have received any compensation for investment banking or merchant banking or brokerage services from the subject company in the past twelve months.
PL or its associates might have received any compensation for products or services other than investment banking or merchant banking or brokerage services from the subject company in the past twelve months
PL or its associates might have received any compensation or other benefits from the subject company or third party in connection with the research report.
PL encourages independence in research report preparation and strives to minimize conflict in preparation of research report. PL or its analysts did not receive any compensation or other benefits from the subject Company or third party in connection with the preparation of the research report. PL or its Research Analysts do not have any material conflict of interest at the time of publication of this report.
It is confirmed that Mr. Amnish Aggarwal (MBA, CFA), Mr. Gaurav Jogani (MBA, Bcom), Research Analysts of this report have not received any compensation from the companies mentioned in the report in the preceding twelve months
Compensation of our Research Analysts is not based on any specific merchant banking, investment banking or brokerage service transactions.
The Research analysts for this report certifies that all of the views expressed in this report accurately reflect his or her personal views about the subject company or companies and its or their securities, and no part of his or her compensation was, is or will be, directly or indirectly related to specific recommendations or views expressed in this report.
The research analysts for this report has not served as an officer, director or employee of the subject company PL or its research analysts have not engaged in market making activity for the subject company
Our sales people, traders, and other professionals or affiliates may provide oral or written market commentary or trading strategies to our clients that reflect opinions that are contrary to the opinions expressed herein, and our proprietary trading and investing businesses may make investment decisions that are inconsistent with the recommendations expressed herein. In reviewing these materials, you should be aware that any or all o the foregoing, among other things, may give rise to real or potential conflicts of interest.
PL and its associates, their directors and employees may (a) from time to time, have a long or short position in, and buy or sell the securities of the subject company or (b) be engaged in any other transaction involving such securities and earn brokerage or other compensation or act as a market maker in the financial instruments of the subject company or act as an advisor or lender/borrower to the subject company or may have any other potential conflict of interests with respect to any recommendation and other related information and opinions.
DISCLAIMER/DISCLOSURES (FOR US CLIENTS)
ANALYST CERTIFICATION
The research analysts, with respect to each issuer and its securities covered by them in this research report, certify that: All of the views expressed in this research report accurately reflect his or her or their personal views about all of the issuers and their securities; and No part of his or her or their compensation was, is or will be directly related to the specific recommendation or views expressed in this research report
Terms & conditions and other disclosures:
This research report is a product of Prabhudas Lilladher Pvt. Ltd., which is the employer of the research analyst(s) who has prepared the research report. The research analyst(s) preparing the research report is/are resident outside the United States (U.S.) and are not associated persons of any U.S. regulated broker‐dealer and therefore the analyst(s) is/are not subject to supervision by a U.S. broker‐dealer, and is/are not required to satisfy the regulatory licensing requirements of FINRA or required to otherwise comply with U.S. rules or regulations regarding, among other things, communications with a subject company, public appearances and trading securities held by a research analyst account.
This report is intended for distribution by Prabhudas Lilladher Pvt. Ltd. only to "Major Institutional Investors" as defined by Rule 15a‐6(b)(4) of the U.S. Securities and Exchange Act, 1934 (the Exchange Act) and interpretations thereof by U.S. Securities and Exchange Commission (SEC) in reliance on Rule 15a 6(a)(2). If the recipient of this report is not a Major Institutional Investor as specified above, then it should not act upon this report and return the same to the sender. Further, this report may not be copied, duplicated and/or transmitted onward to any U.S. person, which is not the Major Institutional Investor.
In reliance on the exemption from registration provided by Rule 15a‐6 of the Exchange Act and interpretations thereof by the SEC in order to conduct certain business with Major Institutional Investors, Prabhudas Lilladher Pvt. Ltd. has entered into an agreement with a U.S. registered broker‐dealer, Marco Polo Securities Inc. ("Marco Polo").
Transactions in securities discussed in this research report should be effected through Marco Polo or another U.S. registered broker dealer.