Embed Size (px)
Citation preview

JRC TECHNICAL REPORTS
Assessment for All initiative(a4a)Workshop on development of MSEalgorithms with R/FLR/a4a
Ernesto Jardim, Finlay Scott, IagoMosqueira, Leire Citores, JenniferDevine, Simon Fischer, Leire Ibaibarriaga,Alessandro Mannini, Colin Millar, DavidMiller, Coilin Minto, Jose De Oliveira,Chato Osio, Agurtzane Urtizberea, ParisVasilakopoulos, Laurie Kell
2017
EUR 28705 EN
Report EUR xxxxx EN
20xx
Forename(s) Surname(s)
First subtitle line first line
Second subtitle line second
Third subtitle line third line
First Main Title Line First Line
Second Main Title Line Second Line
Third Main Title Line Third Line
This publication is a Technical report by the Joint Research Centre (JRC), the European Commission’s science
and knowledge service. It aims to provide evidence-based scientific support to the European policymaking
process. The scientific output expressed does not imply a policy position of the European Commission. Neither
the European Commission nor any person acting on behalf of the Commission is responsible for the use that
might be made of this publication.
Contact information Name: Ernesto Jardim Address: Joint Research Centre, Via Enrico Fermi 2749, TP 051, 21027 Ispra (VA), Italy
Email: [email protected]
Tel.: +39 0332 785311
JRC Science Hub
https://ec.europa.eu/jrc
JRC106750
EUR 28705 EN
PDF ISBN 978-92-79-71290-6 ISSN 1831-9424 doi:10.2760/18924
Luxembourg: Publications Office of the European Union, 2017
© European Union, 2017
Reuse is authorised provided the source is acknowledged. The reuse policy of European Commission documents is regulated by Decision 2011/833/EU (OJ L 330, 14.12.2011, p. 39).
For any use or reproduction of photos or other material that is not under the EU copyright, permission must be
sought directly from the copyright holders.
How to cite this report: Jardim, E., Scott, F., Mosqueira Sanchez, I., Citores, L., Devine, J., Fischer, S.,
Ibaibarriaga, L., Mannini, A., Millar, C., Miller, D., Minto, C., De Oliveira, J., Osio, G., Urtizberea, A.,
Vasilakopoulos, P. and Kell, L., Assessment for All initiative(a4a) - Workshop on development of MSE algorithms
with R/FLR/a4a, EUR 28705 EN, Publications Office of the European Union, Luxembourg, 2017, ISBN 978-92-
79-71290-6, doi:10.2760/18924, JRC106750
All images © European Union 2017
Assessment for All initiative(a4a) Workshop on development of MSE algorithms with R/FLR/a4a
Abstract: The a4a aims to develop a set of common methods and procedures to build a minimal standard MSE algorithm, which should allow the development of MSE simulations in an operational time frame. The JRC
organized a workshop, 30/01-03/02 in Ispra, Italy, which was a mix of hands-on coding and discussion/implementation of concepts associated with MSEs.
Assessment for All initiative(a4a)Workshop on development of MSE al-gorithms with R/FLR/a4a
Ernesto Jardim, Finlay Scott, Iago Mosqueira, Leire Citores, Jennifer Devine, Simon Fischer, Leire
Ibaibarriaga, Alessandro Mannini, Colin Millar, David Miller, Coilin Minto, Jose De Oliveira, Chato Osio,
Agurtzane Urtizberea, Paris Vasilakopoulos, Laurie Kell
Contents
Abstract ............................................................................................................. 1
1. Introduction................................................................................................. 2
2. Terms of Reference and agenda ...................................................................... 2
2.1. Terms of Reference .................................................................................. 2
2.2. Agenda................................................................................................... 2
3. MSE design and code development ................................................................. 3
4. Case studies ................................................................................................ 4
5. Final comments ............................................................................................ 4
6. Annex - The a4a MSE algorithm...................................................................... 6
7. Annex - The a4a generic MP R code................................................................. 14
List of figures...................................................................................................... 18

Abstract
The a4a approach to Management Strategies Evaluation (MSE ) is to develop a set of com-mon methods and procedures to build a minimal standard MSE algorithm. This has themost common elements of both uncertainty and management options. Such a tool setshould allow for the development of MSE simulations for many fisheries in an operationaltime frame. Between the 30th of January and the 3rd of February, in Ispra, Italy, the JRCorganized a workshop on development of MSE algorithms with R/FLR/a4a. The workshopwas a mix of hands-on coding and discussion/implementation of concepts associated withMSEs. The participants used the most recent version of the a4a MSE code, modularized themost important processes and developed their own version of several processes so that theMSE could model and test alternative management procedures to the one initially coded.
1
1. Introduction
The a4a approach to Management Strategies Evaluation (MSE ) is to develop a set of com-mon methods and procedures to build a minimal standard MSE algorithm. This has themost common elements of both uncertainty and management options. Such a tool setshould allow for the development of MSE simulations for many fisheries in an operationaltime frame.The a4a MSE design uses a two step approach. The first step defines the ’standard’
components of an MSE while the second step sets the details, for example the HCR or the OM
conditioning.The Workshop on development of MSE algorithms with R/FLR/a4a was a mix of hands-on
coding and discussion/implementation of concepts associated with MSEs. The participantsused the most recent version of the a4a MSE code, modularized the most important pro-cesses and developed their own version of several processes so that the MSE could modeland test alternative management procedures to the one initially coded.For background information on a4a check the website or the FLa4a introductory vignette1.
2. Terms of Reference and agenda
2.1 Terms of ReferenceUsing as a basis the FLR/a4a MSE code:
• Discuss and revise the current design, in particular consider code modularization sothat the distinct MSE elements can be "easily" changed/included,
• Implement/test suggested improvements as much as possible,
• Discuss and test strategies for parallelization,
• Discuss multi-species and/or multi-fleet analysis,
• Document code changes,
• Suggest future developments,
2.2 AgendaThe agenda of the meeting was:
• Monday
◦ Welcome◦ Presentation of a4a MSE code◦ Presentation on tuna RFMOs MSE development◦ Discussion about MSE design◦ Discussion about implementation in the a4a MSE code◦ Discussion about parallelization and multi-species/multi-fleet analysis◦ Planning for next days work
• Tuesday - Coding and testing
• Wednesday - Coding and testing
• Thursday - Coding and testing
• Friday
◦ Wrapping up and packing code snippets◦ Documentation◦ Close
1vignette("introduction", package="FLa4a")
2
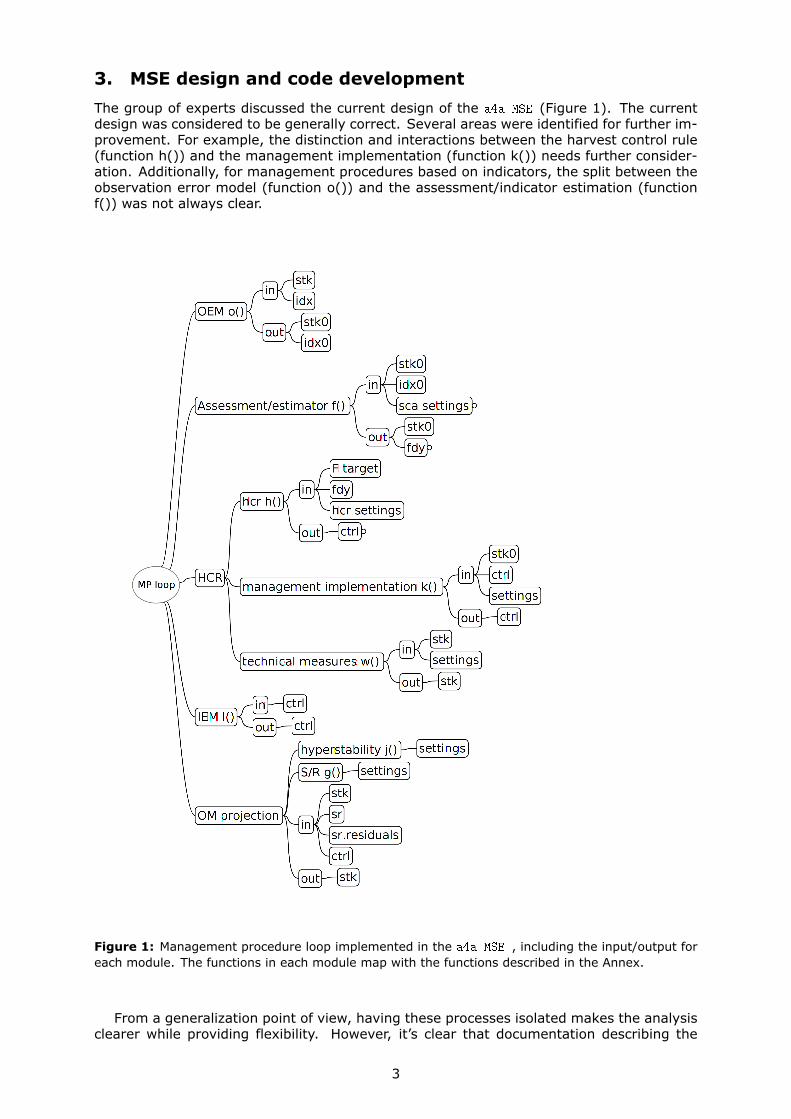
3. MSE design and code development
The group of experts discussed the current design of the a4a MSE (Figure 1). The currentdesign was considered to be generally correct. Several areas were identified for further im-provement. For example, the distinction and interactions between the harvest control rule(function h()) and the management implementation (function k()) needs further consider-ation. Additionally, for management procedures based on indicators, the split between theobservation error model (function o()) and the assessment/indicator estimation (functionf()) was not always clear.
Figure 1: Management procedure loop implemented in the a4a MSE , including the input/output foreach module. The functions in each module map with the functions described in the Annex.
From a generalization point of view, having these processes isolated makes the analysisclearer while providing flexibility. However, it’s clear that documentation describing the
3

analysis mut be available and each module must be well explained, including the mechanicsof using each of them in the overall analysis and the interactions between them.Several suggestions were lifted from the discussions and testing carried out.
• Use "wrapper" approach to mimic S4 dispatch. Explore the method used in function f()to allow the usage of several stock assessment methods, to introduce flexibility in eachmodule. The most important advantage is to make it easy for users to develop theirown functions. It may also reduce maintenance when compared with S4 methods.The disadvantage of this approach is that it’s based on name matching, which makesit fragile.
• Scenarios and settings/control for each function. The process of passing settings toeach module and defining scenarios requires development. It was set up for specificrequests from DGMARE and STECF and requires generalization and flexibility.
• Control statistics. Need to develop the storage of control statistics, which are gen-erated during the loop and provide information about each module. For example theconvergence indicator of stock assessment models. This method will have to be flexi-ble to allow the users to store the relevant information for each application.
• Performance statistics. To compute statistics to compare the different options beingtested, a set of statistics are computed using the package "mse" of Iago Mosqueira(JRC). The list of statistics may require further discussion. However, the way thismethod is implemented is very flexible and can take all statistics which can be con-verted into an R formula.
• How to generate different indices. Management procedures may require abundanceindices like CPUE, indices from acoustic survey, or even length-based indices. Thegeneration of those indices in the observation error model is not trivial and requiredevelopment of methods which can be quickly used.
• Methods to deal with non-convergence of some iterations. In some cases the stockassessment model does not converge, generating estimates which are not optimaland can be biased. Methods to deal which such cases automatically will have to bedeveloped. It’s not possible to interact with the code in each loop to manually dealwith this problem.
4. Case studies
To test the current a4a MSE a set of case studies were developed using the same operatingmodel. These cases studies implemented management procedures using:
• several stock assessment methods (including a dynamic biomass production modelSPiCT, and XSA) and two different harvest control rules.
• indicators of stock status which are not based on a stock assessment, more in linewith what is done for data-limited stocks; e.g. indicators based on biomass indicesand mean individual length of large mature fish were tested.
The case studies were implemented by adapting the current a4a MSE code. This provideda good test of the generality of the current code as well as providing a guide to whereimprovements can be made. All changes were recorded and uploaded to the centralizedrepository.Furthermore, a case study using a different operating model, based on the stock of
Adriatic Anchovy, was also developed to test the use of stock assessment method SPICT.
5. Final comments
The testing and developing of code during the meeting constituted a hands-on revision ofthe current version of the MSE code, the FLa4a package and the FLR packages supportingit.The results obtained showed that the code was already well prepared for the exercise of
collaborative coding. In a short time frame (2 to 3 days) the group was able to implement 3
4

different management procedures, and explore expanding the separate processes to usingseveral different stock assessment models, harvest control rules, etc.The mathematical description of the management procedure (annex in section 6) was a
key element to allow a common understanding of the model.On the other hand several issues arose which require further consideration, namely the
development and implementation of control statistics, scenarios and settings to be passedto each function, and the dispatching mechanism.
5

6. Annex - The a4a MSE algorithm
6

Assessment for All initiative(a4a)
The a4a Management Strategies Evaluation algorithm
Ernesto Jardim1, Finlay Scott1, and Iago Mosqueira1
1European Commission, Joint Research Centre, Sustainable resources directorate, Waterand Marine Resources unit, 21027 Ispra (VA), Italy
*Corresponding author [email protected]
January 25, 2017
Abstract
This document presents the Management Strategies Evaluation algorithm developed in the JRCAssessment For All (a4a ) initiative. Management Strategy Evaluation (MSE ) is a complex simula-tion and forecasting procedure that takes into account structural and observational uncertainty onstock dynamics (growth, recruitment, maturity) and on its exploitation by fishing fleets (selectivity,effort). The MSE paradigm can lead to to the articulation of the central part of a decision makingframework for fisheries management under uncertainty. The a4a approach to MSE is to develop aset of common methods and procedures to build a minimal standard MSE algorithm. This has themost common elements of both uncertainty and management options. Such a toolset should allow forthe development of MSE simulations for many fisheries in an operational time frame. The a4a MSE
design uses a two step approach. The first step defines the ’standard’ components of an MSE whilethe second step sets the details, for example the HCR or the OM conditioning.
1
Contents
1 Introduction 3
2 Notation and Definition of variables 4
3 Operating model 5
4 Observation error model 64.1 Catch in number of individuals, ca,t . . . . . . . . . . . . . . . . . . . . . . . . . . . . 64.2 Index of abundance, da,t . . . . . . . . . . . . . . . . . . . . . . . . . . . . . . . . . . . 6
5 Management procedure 65.1 Assessment/Estimator of stock statistics . . . . . . . . . . . . . . . . . . . . . . . . . . 65.2 Management Decision/Harvest Control Rule . . . . . . . . . . . . . . . . . . . . . . . . 65.3 Management system . . . . . . . . . . . . . . . . . . . . . . . . . . . . . . . . . . . . . 7
5.3.1 Input/effort management . . . . . . . . . . . . . . . . . . . . . . . . . . . . . . 75.3.2 Output/TAC management . . . . . . . . . . . . . . . . . . . . . . . . . . . . . 75.3.3 Technical measures . . . . . . . . . . . . . . . . . . . . . . . . . . . . . . . . . . 7
6 Implementation error model 7
7 Summary 7
2
1 Introduction
Management Strategy Evaluation (MSE ) is a complex simulation and forecasting procedure thattakes into account structural and observational uncertainty on stock dynamics (growth, recruitment,maturity) and on its exploitation by fishing fleets (selectivity, effort). The MSE paradigm can lead toto the articulation of the central part of a decision making framework for fisheries management underuncertainty. The algorithms for development and application of MSE simulations are currently fairlydiverse across different fora and fisheries, despite the obvious common elements and a shared overallstructure.
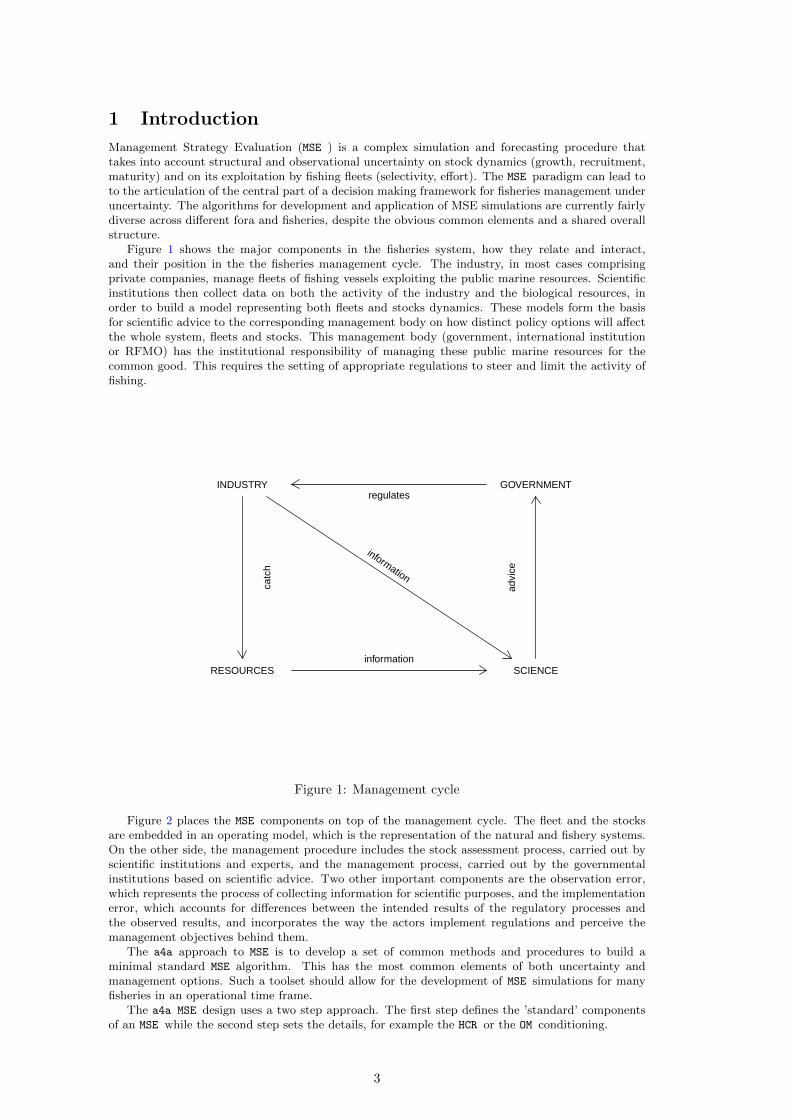
Figure 1 shows the major components in the fisheries system, how they relate and interact,and their position in the the fisheries management cycle. The industry, in most cases comprisingprivate companies, manage fleets of fishing vessels exploiting the public marine resources. Scientificinstitutions then collect data on both the activity of the industry and the biological resources, inorder to build a model representing both fleets and stocks dynamics. These models form the basisfor scientific advice to the corresponding management body on how distinct policy options will affectthe whole system, fleets and stocks. This management body (government, international institutionor RFMO) has the institutional responsibility of managing these public marine resources for thecommon good. This requires the setting of appropriate regulations to steer and limit the activity offishing.
INDUSTRY
RESOURCES
GOVERNMENT
SCIENCEinformation
information
advi
ce
regulates
catc
h
Figure 1: Management cycle
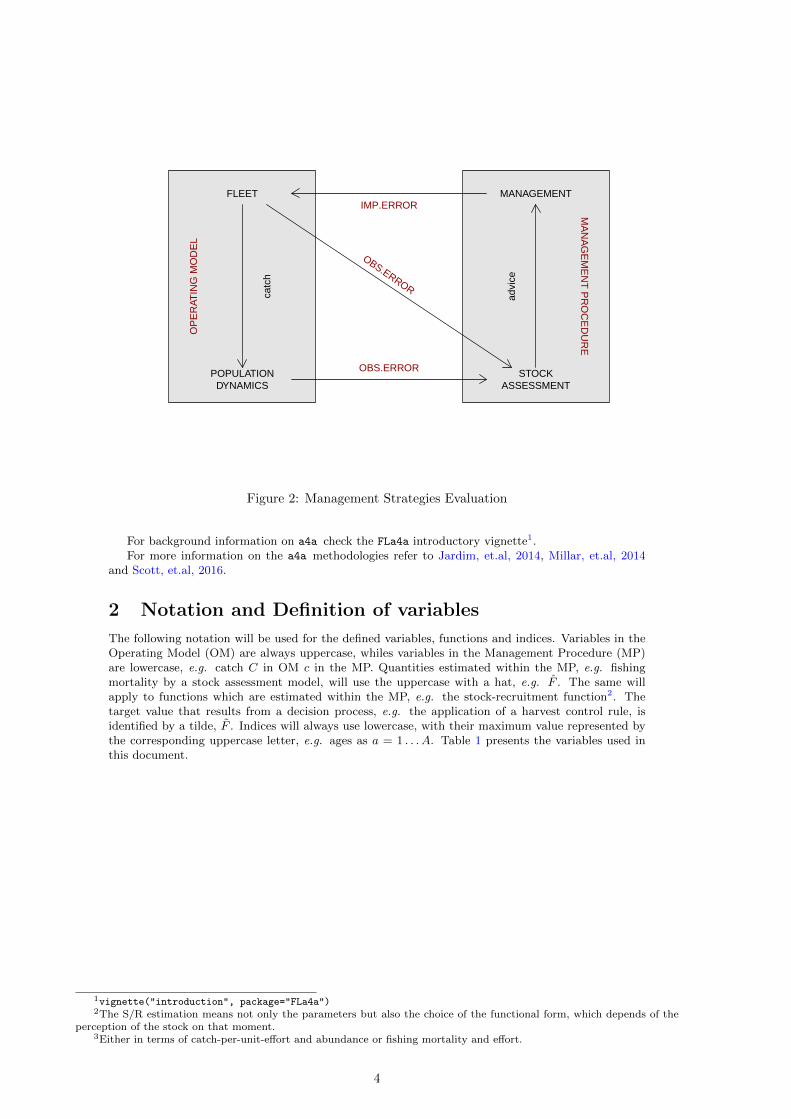
Figure 2 places the MSE components on top of the management cycle. The fleet and the stocksare embedded in an operating model, which is the representation of the natural and fishery systems.On the other side, the management procedure includes the stock assessment process, carried out byscientific institutions and experts, and the management process, carried out by the governmentalinstitutions based on scientific advice. Two other important components are the observation error,which represents the process of collecting information for scientific purposes, and the implementationerror, which accounts for differences between the intended results of the regulatory processes andthe observed results, and incorporates the way the actors implement regulations and perceive themanagement objectives behind them.
The a4a approach to MSE is to develop a set of common methods and procedures to build aminimal standard MSE algorithm. This has the most common elements of both uncertainty andmanagement options. Such a toolset should allow for the development of MSE simulations for manyfisheries in an operational time frame.
The a4a MSE design uses a two step approach. The first step defines the ’standard’ componentsof an MSE while the second step sets the details, for example the HCR or the OM conditioning.
3
OP
ER
ATIN
G M
OD
EL
MA
NA
GE
ME
NT
PR
OC
ED
UR
EFLEET
POPULATIONDYNAMICS
MANAGEMENT
STOCKASSESSMENT
OBS.ERROR
OBS.ERROR
advi
ce
IMP.ERROR
catc
h
Figure 2: Management Strategies Evaluation
For background information on a4a check the FLa4a introductory vignette1.For more information on the a4a methodologies refer to Jardim, et.al, 2014, Millar, et.al, 2014
and Scott, et.al, 2016.
2 Notation and Definition of variables
The following notation will be used for the defined variables, functions and indices. Variables in theOperating Model (OM) are always uppercase, whiles variables in the Management Procedure (MP)are lowercase, e.g. catch C in OM c in the MP. Quantities estimated within the MP, e.g. fishingmortality by a stock assessment model, will use the uppercase with a hat, e.g. F . The same willapply to functions which are estimated within the MP, e.g. the stock-recruitment function2. Thetarget value that results from a decision process, e.g. the application of a harvest control rule, isidentified by a tilde, F . Indices will always use lowercase, with their maximum value represented bythe corresponding uppercase letter, e.g. ages as a = 1 . . . A. Table 1 presents the variables used inthis document.
1vignette("introduction", package="FLa4a")2The S/R estimation means not only the parameters but also the choice of the functional form, which depends of the
perception of the stock on that moment.3Either in terms of catch-per-unit-effort and abundance or fishing mortality and effort.
4
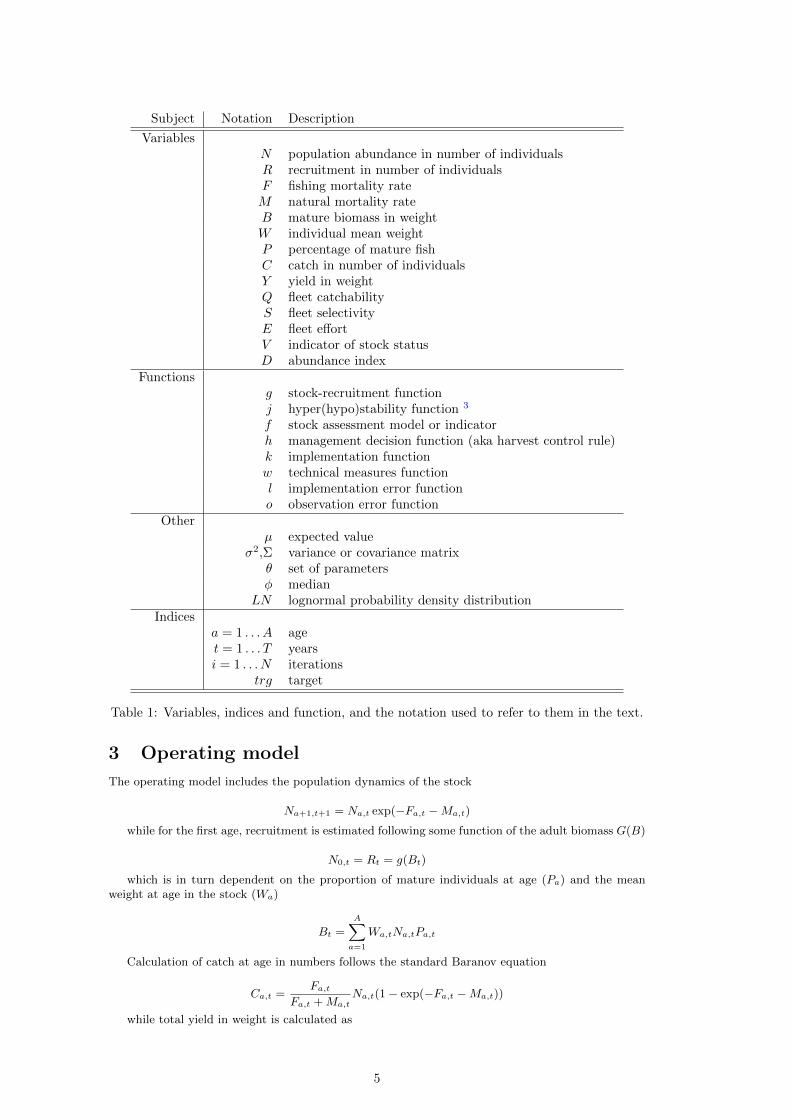
Subject Notation Description
VariablesN population abundance in number of individualsR recruitment in number of individualsF fishing mortality rateM natural mortality rateB mature biomass in weightW individual mean weightP percentage of mature fishC catch in number of individualsY yield in weightQ fleet catchabilityS fleet selectivityE fleet effortV indicator of stock statusD abundance index
Functionsg stock-recruitment functionj hyper(hypo)stability function 3
f stock assessment model or indicatorh management decision function (aka harvest control rule)k implementation functionw technical measures functionl implementation error functiono observation error function
Otherµ expected value
σ2,Σ variance or covariance matrixθ set of parametersφ median
LN lognormal probability density distributionIndices
a = 1 . . . A aget = 1 . . . T yearsi = 1 . . . N iterations
trg target
Table 1: Variables, indices and function, and the notation used to refer to them in the text.
3 Operating model
The operating model includes the population dynamics of the stock
Na+1,t+1 = Na,t exp(−Fa,t −Ma,t)
while for the first age, recruitment is estimated following some function of the adult biomass G(B)
N0,t = Rt = g(Bt)
which is in turn dependent on the proportion of mature individuals at age (Pa) and the meanweight at age in the stock (Wa)
Bt =A∑
a=1
Wa,tNa,tPa,t
Calculation of catch at age in numbers follows the standard Baranov equation
Ca,t =Fa,t
Fa,t +Ma,tNa,t(1− exp(−Fa,t −Ma,t))
while total yield in weight is calculated as
5
Yt =A∑
a=1
Wa,tCa,t
Fishing mortality at age is related to effort through selectivity-at-age, catchability and the (pos-sibly non-linear) function (j)
Fa,t = Sa,tQtj(Et)
4 Observation error model
4.1 Catch in number of individuals, ca,t
Catch in numbers-at-age4 are observed with error
ca,t = Ca,t exp εc
where εc is log-normally distributed
εc ∼ LN(µc, σ2c )
4.2 Index of abundance, da,tThe index of abundance is observed with error, through catchability, which defines its relationshipwith the stock abundance-at-age
da,t = Na,tqa,t exp εd
where εd is log-normally distributed
εd ∼ LN(µd, σ2d)
5 Management procedure
5.1 Assessment/Estimator of stock statistics
Input into the decision rule includes the indicator of current status (V ), given the available informa-tion, in this case catches (c) and an index of abundance (d)
V = f(ca,t, da,t|θf )
where
V =∼ LN(µv,Σv)
transformed through some suitable function (f), for example a stock assessment. The preciseinputs, and the elements in θ will depend on the precise form of the HCR. In an age based system,for example, these would be estimates of Ft, Bt and Ct
5.The stock assessment component of the status estimator might include an stock-recruitment re-
lationship
N0,t = g(Bt)
g is the stock recruitment relationship estimated within the MP and represents the perceiveddynamics, which differs from G, included in the OM.
5.2 Management Decision/Harvest Control Rule
In this code it is assumed that management is carried out through changes in F , although theimplementation of those changes can be done through a combination of systems: input control,output control and/or technical measures. A first decision is made about the target fishing mortalityfor next year. The result of this decision is afterwards translated into an implementation variable.
Fa+1,t+1 = h(Fa−1,t−1, Ftrg, ttrg)
4Generally derived from sampling of numbers-at-length and a growth model or age-length key5Which in our notation would be represented by Ft, Bt and Ct.
6
5.3 Management system
This process translates the management decision into a regulation, for example fishing opportunities,or days at sea. It mimics the process used to formulate the advice from the scientific estimates oflikely effects of different fishing mortality levels.
5.3.1 Input/effort management
Et+1 = k(Fa+1,t+1|θk) exp εE
εE ∼ LN(µE , σ2E)
5.3.2 Output/TAC management
Ct+1 = k(Fa+1,t+1|θk) exp εC
εC ∼ LN(µC , σ2C)
5.3.3 Technical measures
Technical measures affect the exploitation by imposing a shift in the age structure of the catch. Bothgear selectivity or availability can be mimicked using shifts in the age structure of the exploitation.The overall level of exploitation is dealt by the input or output controls and technical measures areseen as a complement.
Sa,t+1 = w(Sa,t|θw) exp εS
εS ∼ LN(µS , σ2S)
6 Implementation error model
Fa,t+1 = l({Et+1, Ct+1}, Sa,t+1|θl) exp εF
εF ∼ LN(µF , σ2F )
7 Summary
Flexible framework to run single species MSE analysis. Each MSE element and process has a functionthat allows the user to set its own approach:
� Fleet dynamics - j()
� Stock-recruitment relationship - g()
� Observation error model - o()
� Stock assessment model or status indicator - {f(), g()}� Harvest control rule - h()
� Management system - k()
� Technical measures - w()
� Implementation error model - l()
7

7. Annex - The a4a generic MP R code
14
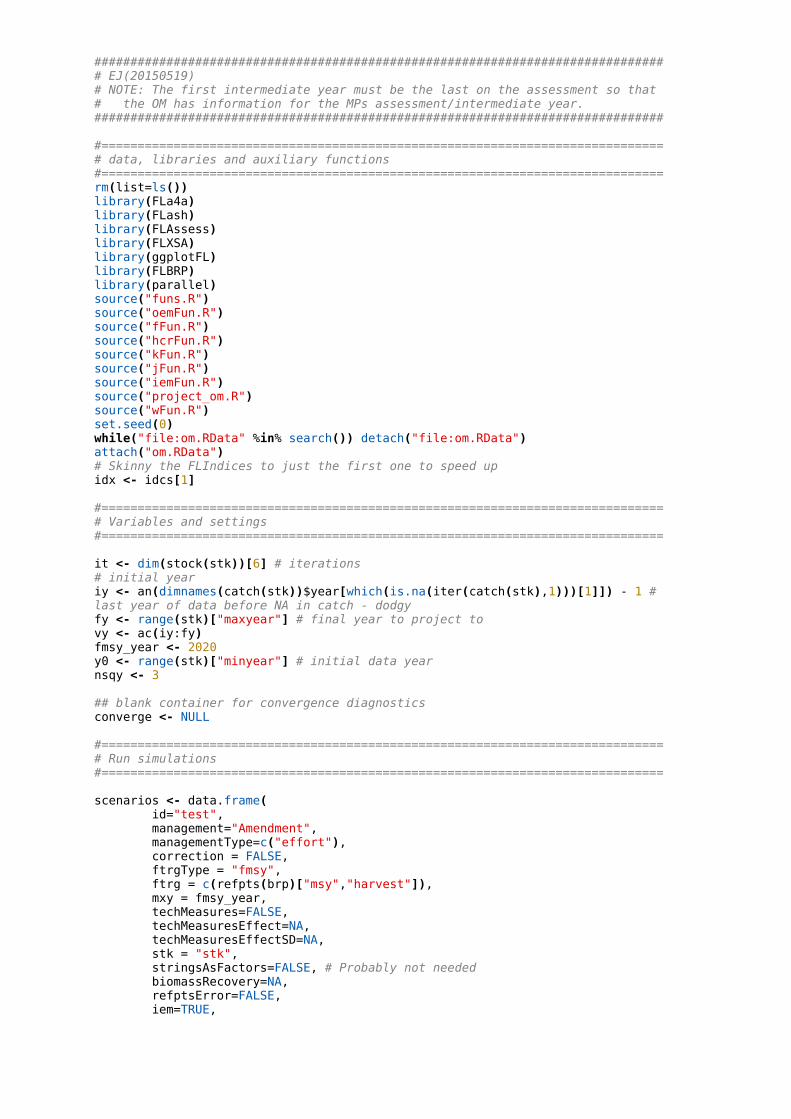
################################################################################ EJ(20150519)# NOTE: The first intermediate year must be the last on the assessment so that# the OM has information for the MPs assessment/intermediate year.############################################################################### #==============================================================================# data, libraries and auxiliary functions#==============================================================================rm(list=ls())library(FLa4a)library(FLash)library(FLAssess)library(FLXSA)library(ggplotFL)library(FLBRP)library(parallel)source("funs.R")source("oemFun.R")source("fFun.R")source("hcrFun.R")source("kFun.R")source("jFun.R")source("iemFun.R")source("project_om.R")source("wFun.R")set.seed(0)while("file:om.RData" %in% search()) detach("file:om.RData")attach("om.RData")# Skinny the FLIndices to just the first one to speed upidx <- idcs[1] #==============================================================================# Variables and settings#============================================================================== it <- dim(stock(stk))[6] # iterations# initial yeariy <- an(dimnames(catch(stk))$year[which(is.na(iter(catch(stk),1)))[1]]) - 1 # last year of data before NA in catch - dodgyfy <- range(stk)["maxyear"] # final year to project tovy <- ac(iy:fy)fmsy_year <- 2020y0 <- range(stk)["minyear"] # initial data yearnsqy <- 3 ## blank container for convergence diagnosticsconverge <- NULL #==============================================================================# Run simulations#============================================================================== scenarios <- data.frame(
id="test",management="Amendment",managementType=c("effort"),correction = FALSE,ftrgType = "fmsy",ftrg = c(refpts(brp)["msy","harvest"]),mxy = fmsy_year,techMeasures=FALSE,techMeasuresEffect=NA,techMeasuresEffectSD=NA,stk = "stk",stringsAsFactors=FALSE, # Probably not neededbiomassRecovery=NA,refptsError=FALSE,iem=TRUE,
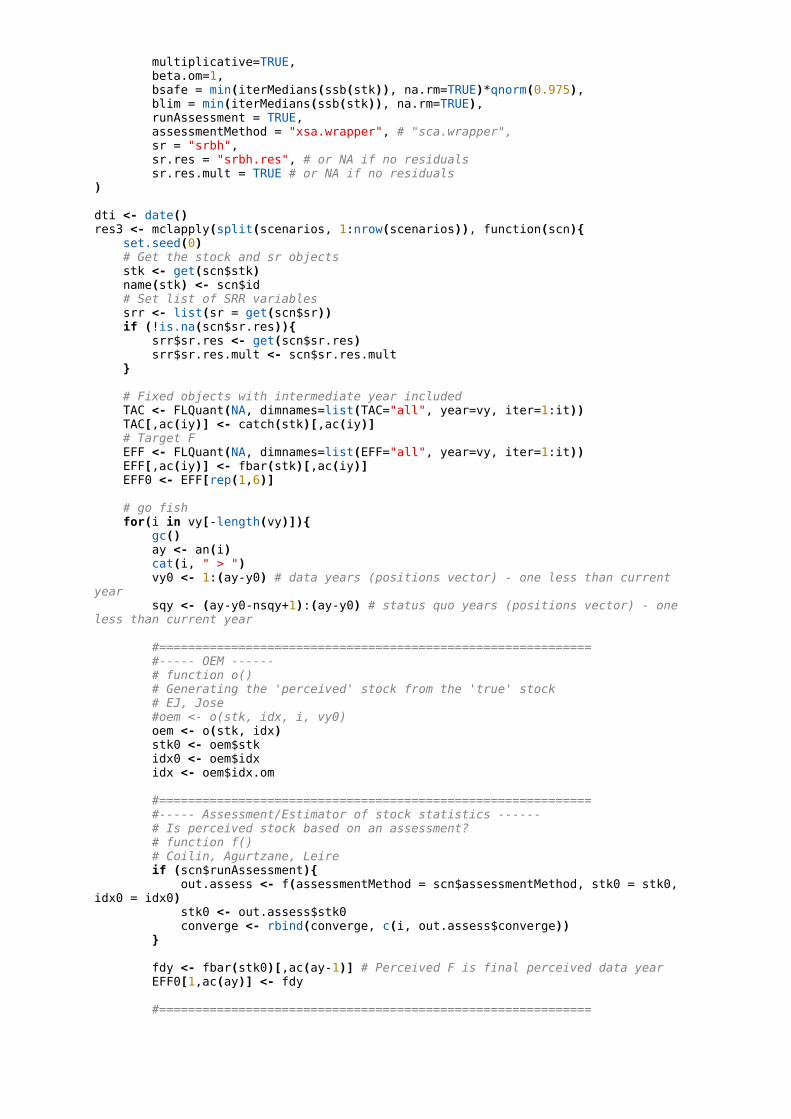
multiplicative=TRUE,beta.om=1,bsafe = min(iterMedians(ssb(stk)), na.rm=TRUE)*qnorm(0.975),blim = min(iterMedians(ssb(stk)), na.rm=TRUE),runAssessment = TRUE,assessmentMethod = "xsa.wrapper", # "sca.wrapper",sr = "srbh",sr.res = "srbh.res", # or NA if no residuals
sr.res.mult = TRUE # or NA if no residuals) dti <- date()res3 <- mclapply(split(scenarios, 1:nrow(scenarios)), function(scn){ set.seed(0) # Get the stock and sr objects stk <- get(scn$stk) name(stk) <- scn$id # Set list of SRR variables srr <- list(sr = get(scn$sr)) if (!is.na(scn$sr.res)){ srr$sr.res <- get(scn$sr.res) srr$sr.res.mult <- scn$sr.res.mult } # Fixed objects with intermediate year included TAC <- FLQuant(NA, dimnames=list(TAC="all", year=vy, iter=1:it)) TAC[,ac(iy)] <- catch(stk)[,ac(iy)] # Target F EFF <- FLQuant(NA, dimnames=list(EFF="all", year=vy, iter=1:it)) EFF[,ac(iy)] <- fbar(stk)[,ac(iy)] EFF0 <- EFF[rep(1,6)]
# go fishfor(i in vy[-length(vy)]){
gc()ay <- an(i)cat(i, " > ")vy0 <- 1:(ay-y0) # data years (positions vector) - one less than current
yearsqy <- (ay-y0-nsqy+1):(ay-y0) # status quo years (positions vector) - one
less than current year
#============================================================#----- OEM ------# function o()# Generating the 'perceived' stock from the 'true' stock# EJ, Jose#oem <- o(stk, idx, i, vy0)oem <- o(stk, idx)stk0 <- oem$stkidx0 <- oem$idxidx <- oem$idx.om
#============================================================#----- Assessment/Estimator of stock statistics ------
# Is perceived stock based on an assessment? # function f() # Coilin, Agurtzane, Leire
if (scn$runAssessment){out.assess <- f(assessmentMethod = scn$assessmentMethod, stk0 = stk0,
idx0 = idx0)stk0 <- out.assess$stk0
converge <- rbind(converge, c(i, out.assess$converge))}
fdy <- fbar(stk0)[,ac(ay-1)] # Perceived F is final perceived data yearEFF0[1,ac(ay)] <- fdy
#============================================================
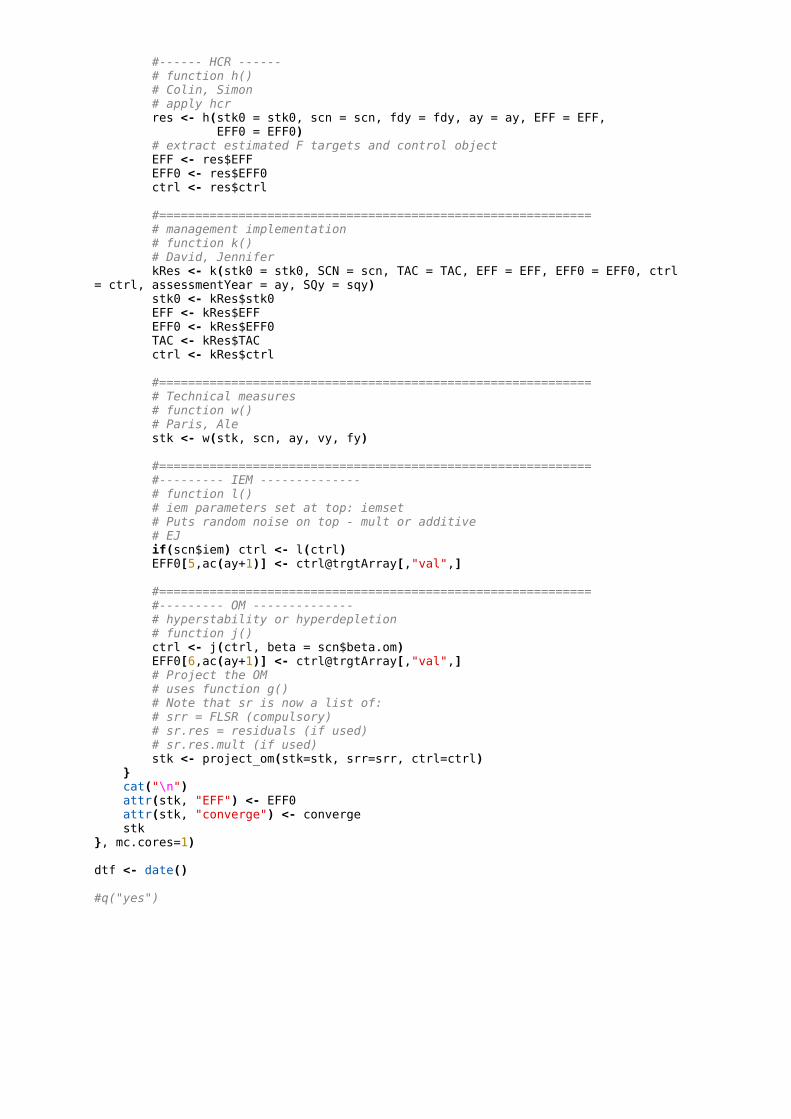
#------ HCR ------ # function h() # Colin, Simon # apply hcr res <- h(stk0 = stk0, scn = scn, fdy = fdy, ay = ay, EFF = EFF, EFF0 = EFF0) # extract estimated F targets and control object EFF <- res$EFF EFF0 <- res$EFF0 ctrl <- res$ctrl
#============================================================ # management implementation
# function k()# David, JenniferkRes <- k(stk0 = stk0, SCN = scn, TAC = TAC, EFF = EFF, EFF0 = EFF0, ctrl
= ctrl, assessmentYear = ay, SQy = sqy)stk0 <- kRes$stk0EFF <- kRes$EFFEFF0 <- kRes$EFF0TAC <- kRes$TACctrl <- kRes$ctrl
#============================================================
# Technical measures# function w()# Paris, Alestk <- w(stk, scn, ay, vy, fy)
#============================================================#--------- IEM --------------# function l()
# iem parameters set at top: iemset # Puts random noise on top - mult or additive
# EJif(scn$iem) ctrl <- l(ctrl)EFF0[5,ac(ay+1)] <- ctrl@trgtArray[,"val",]
#============================================================#--------- OM --------------# hyperstability or hyperdepletion# function j()ctrl <- j(ctrl, beta = scn$beta.om)EFF0[6,ac(ay+1)] <- ctrl@trgtArray[,"val",]
# Project the OM # uses function g() # Note that sr is now a list of: # srr = FLSR (compulsory) # sr.res = residuals (if used) # sr.res.mult (if used) stk <- project_om(stk=stk, srr=srr, ctrl=ctrl)
} cat("\n") attr(stk, "EFF") <- EFF0 attr(stk, "converge") <- converge stk}, mc.cores=1) dtf <- date() #q("yes")

List of figures
Figure 1. Management procedure loop implemented in the a4a MSE , including the in-put/output for each module. The functions in each module map with thefunctions described in the Annex. . . . . . . . . . . . . . . . . . . . . . . . . 3
18

GETTING IN TOUCH WITH THE EU
In person
All over the European Union there are hundreds of Europe Direct information centres. You can find the address of the centre nearest you at: http://europea.eu/contact
On the phone or by email
Europe Direct is a service that answers your questions about the European Union. You can contact this service:
- by freephone: 00 800 6 7 8 9 10 11 (certain operators may charge for these calls),
- at the following standard number: +32 22999696, or
- by electronic mail via: http://europa.eu/contact
FINDING INFORMATION ABOUT THE EU
Online
Information about the European Union in all the official languages of the EU is available on the Europa website at: http://europa.eu
EU publications You can download or order free and priced EU publications from EU Bookshop at:
http://bookshop.europa.eu. Multiple copies of free publications may be obtained by contacting Europe
Direct or your local information centre (see http://europa.eu/contact).

KJ-N
A-2
8705-E
N-N
doi:10.2760/18924
ISBN 978-92-79-71290-6