Embed Size (px)
Citation preview
Oil Refining Fitness Check
Preliminary results
Robert Marschinski
European Commission
Joint Research Centre (JRC)

Content
• Economic impact on refinery sector of directives analysed in Fitness Check
• International competitiveness of EU refining: trends 2000 to 2012
2
Associated capital
investments
Associated operating costs
Cost per barrel of
throughput
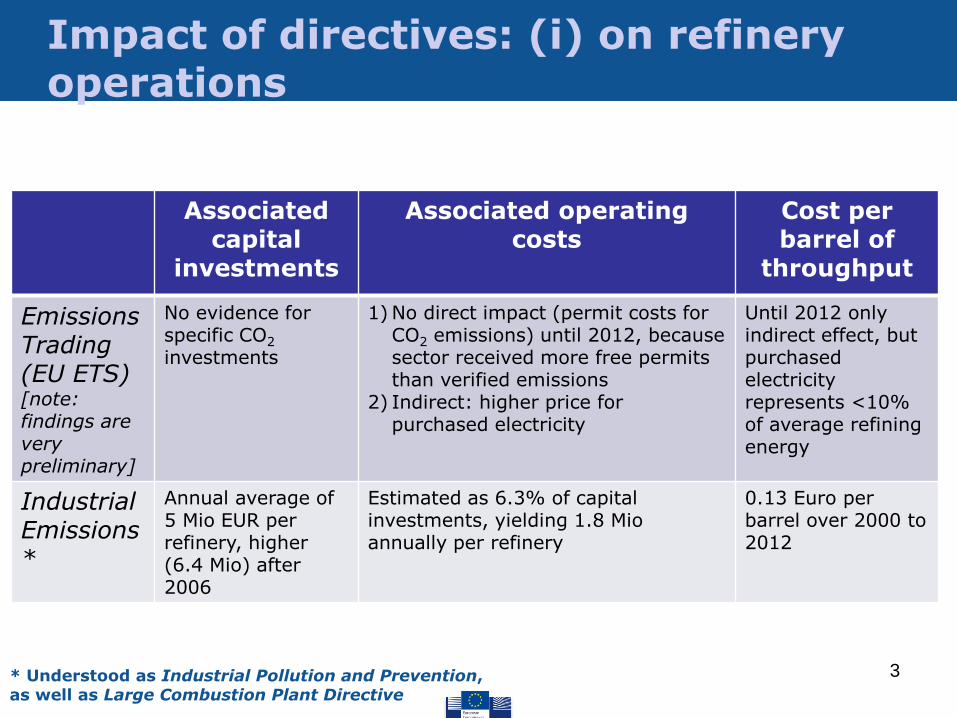
Emissions Trading (EU ETS) [note: findings are very preliminary]
No evidence for specific CO2 investments
1) No direct impact (permit costs for CO2 emissions) until 2012, because sector received more free permits than verified emissions
2) Indirect: higher price for purchased electricity
Until 2012 only indirect effect, but purchased electricity represents <10% of average refining energy
Industrial Emissions*
Annual average of 5 Mio EUR per refinery, higher (6.4 Mio) after 2006
Estimated as 6.3% of capital investments, yielding 1.8 Mio annually per refinery
0.13 Euro per barrel over 2000 to 2012
* Understood as Industrial Pollution and Prevention, as well as Large Combustion Plant Directive
Impact of directives: (i) on refinery operations
3
Associated capital
investments
Associated operating
costs
Cost per barrel of
throughput
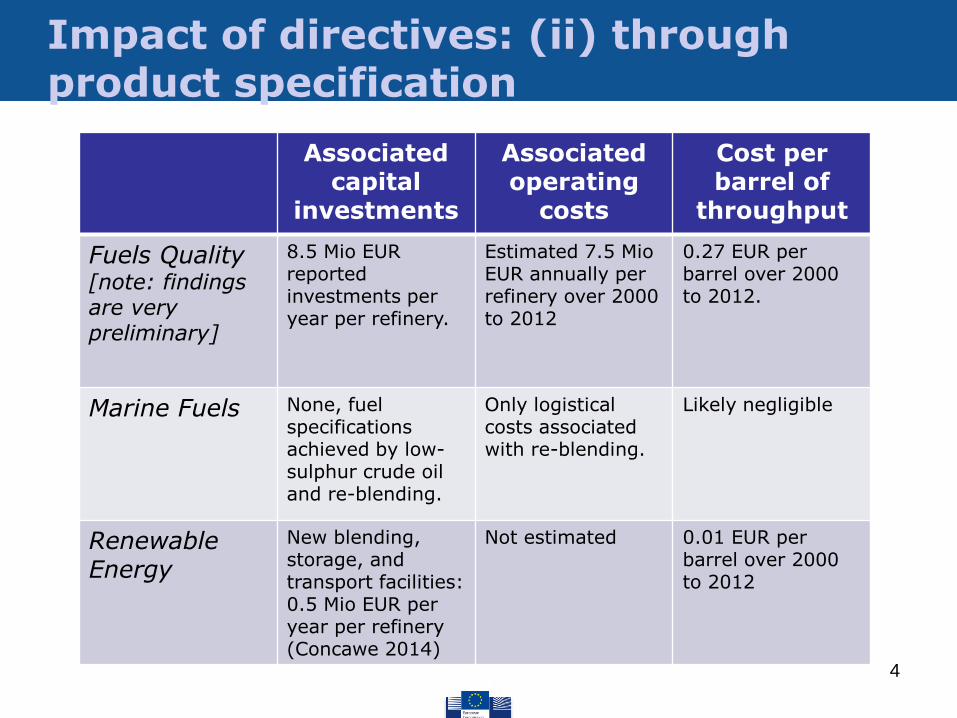
Fuels Quality [note: findings are very preliminary]
8.5 Mio EUR reported investments per year per refinery.
Estimated 7.5 Mio EUR annually per refinery over 2000 to 2012
0.27 EUR per barrel over 2000 to 2012.
Marine Fuels None, fuel specifications achieved by low-sulphur crude oil and re-blending.
Only logistical costs associated with re-blending.
Likely negligible
Renewable Energy
New blending, storage, and transport facilities: 0.5 Mio EUR per year per refinery (Concawe 2014)
Not estimated 0.01 EUR per barrel over 2000 to 2012
Impact of directives: (ii) through product specification
4

Impact of directives: (iii) demand reduction
Demand impact
Contributed to 'Dieselsation' ?
Impact on refineries
Renewable Energy
-1% gasoline demand reduction during 2000-12, -3% in 2012
No (but has helped to reduce EU diesel deficit)
In 2012 up to 3 percentage points of utilization rate reduction. Further assessment with OURSE model.
Energy Taxation [note:
findings are very preliminary]
Estimate of 0.1% demand reduction for gasoline, 0.2% for diesel
No (but neither did it help to work against it)
Likely negligible (verification with OURSE model)
Industrial Emissions
Reduction of fuel oil demand from power sector
Not yet quantified
5

Impact of directives: total cost impact (preliminary finding)
Note: preliminary finding, under
discussion
6
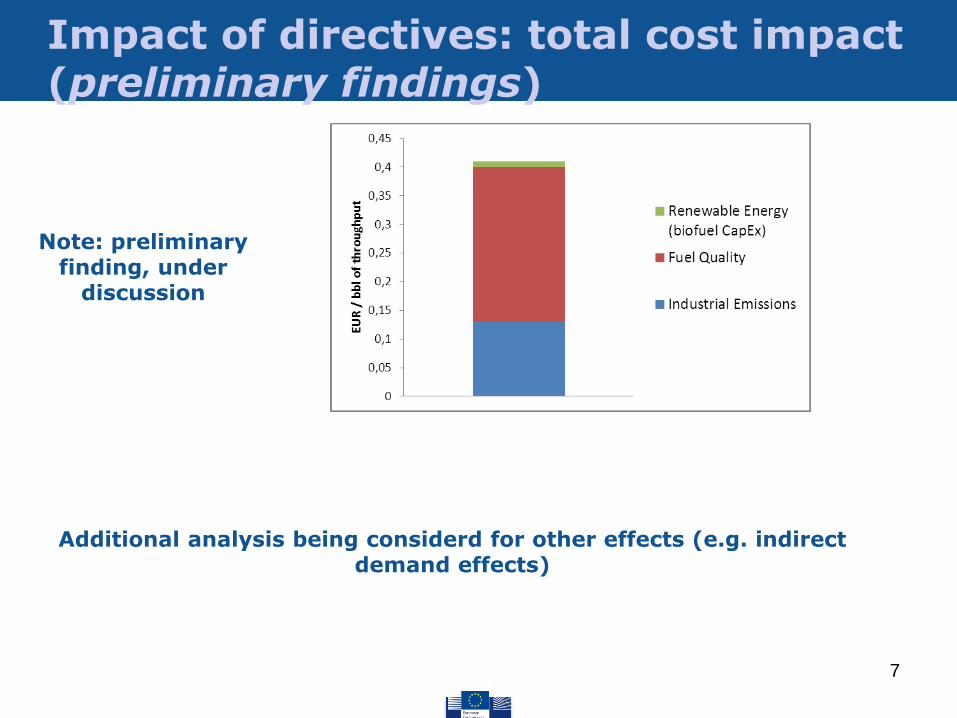
Impact of directives: total cost impact (preliminary findings)
Additional analysis being considerd for other effects (e.g. indirect demand effects)
7
Note: preliminary finding, under
discussion
Content
• Economic impact on refinery sector of directives analysed in Fitness Check
• International competitiveness of EU refining: trends 2000 to 2012
8

9
Refining margins in EU28 vs. US/ME/Russia/South Korea & Singp.
By 2006 average EU28 net margins have fallen below those of the competitor regions.
Source: own estimates based on Solomon Associates (2014,2014a) data
Difference between average refining net margins in EU28 and average refining net margins in 5 competitor regions.

10
Refining margins in EU28 vs. US/ME/Russia/South Korea & Singp.
EU28 net margins have lost 1.5 USD/ton per year against the competitors', i.e. 2.5 USD/bbl over 2000-12.
Source: own estimates based on Solomon Associates (2014,2014a) data

11
Difference between gross margins in EU28 and average gross margins in 5 competitor regions.
Difference between operational costs in EU28 and average operational costs in 5 competitor regions.
Source: own estimates based on Solomon Associates (2014,2014a) data
Operational costs: EU28 increasing
Gross margins: no trend, EU28 consistently above others
Refining margins in EU28 vs. US/ME/Russia/South Korea & Singp.

12
The relative descent of EU net margins* is due to the relative
increase of operational costs in the EU
Difference between gross margins in EU28 and average gross margins in 5 competitor regions.
Difference between operational costs in EU28 and average operational costs in 5 competitor regions.
Source: own estimates based on Solomon Associates (2014,2014a) data
Gross margins: no trend, EU28 consistently above others
Operational costs: EU28 increasing
* NET margins = GROSS margins – Operating Costs
Refining margins in EU28 vs. US/ME/Russia/South Korea & Singp.

13
More specifically, it is due to the relative increase of energy costs in the EU
Difference between energy costs in EU28 and average energy costs in 5 competitor regions.
Average energy costs in EU28 and 5 competitor regions.
Source: own estimates based on Solomon Associates (2014,2014a) data
Refining margins in EU28 vs. US/ME/Russia/South Korea & Singp.

14
More specifically, it is due to the relative increase of energy costs in the EU
• Nearly 4-fold increase in EU vs. less than 2-fold increase for competitors • US Gulf and East Coast: costs in 2012 lower than in 2000 • Middle East: slight increase (1.6-fold), low absolute level • Russia: doubled from 2004 to 2012, but at the same time EU tripled • Korea/Singapore: similar as EU, worse in 2012
Difference between energy costs in EU28 and average energy costs in 5 competitor regions.
Average energy costs in EU28 and 5 competitor regions.
Source: own estimates based on Solomon Associates (2014,2014a) data
Refining margins in EU28 vs. US/ME/Russia/South Korea & Singp.

15
Energy costs in Europe may have increased because: 1) Decreasing – relative to competitors – energy
efficiency (= use of energy per throughput)
Explaining EU energy cost deterioration

16
Source (left): own estimate based on IHS (2014)
Energy costs in Europe may have increased because: 1) Decreasing – relative to competitors – energy
efficiency (= use of energy per throughput)
Source (right): Solomon Associates (2014)
Difference between average refining energy per throughput (barrels of fuel oil equivalent per barrels of throughput) in
Europe and 5 competitor regions.
Solomon Energy Intensity IndexTM (EIITM) for EU28, re-indexed to year 2000 value. [caveat: other regions even more improved?]
Explaining EU energy cost deterioration

17
Energy costs in Europe may have increased because: 1) Decreasing – relative to competitors – energy
efficiency (= use of energy per throughput)
2) Cost increase in Europe – relative to the competitor regions – of 1 unit of energy
i. due to price increases
ii. due to composition effect, i.e. switch towards more costly forms of energy (e.g. purchased electricity rather than fuel oil)
Explaining EU energy cost deterioration

18
• Slight appreciation of fuel oil prices in Europe vis-à-vis competitors
(against background of 4-fold increase in int'l crude oil prices).
• Natural gas prices increased almost 4-fold in Europe, while in the US the price of 2011 equals that of 2001. But prices in Asia are even higher than in Europe.
Data source: IHS (2014)
Difference between fuel oil prices in Europe and 4 competitor regions (blue); and between natural gas prices in Europe and US (red) and Europe and Asia (green).
EU with higher natural gas prices than US
EU with lower natural gas prices than Asia
Explaining EU energy cost deterioration
19
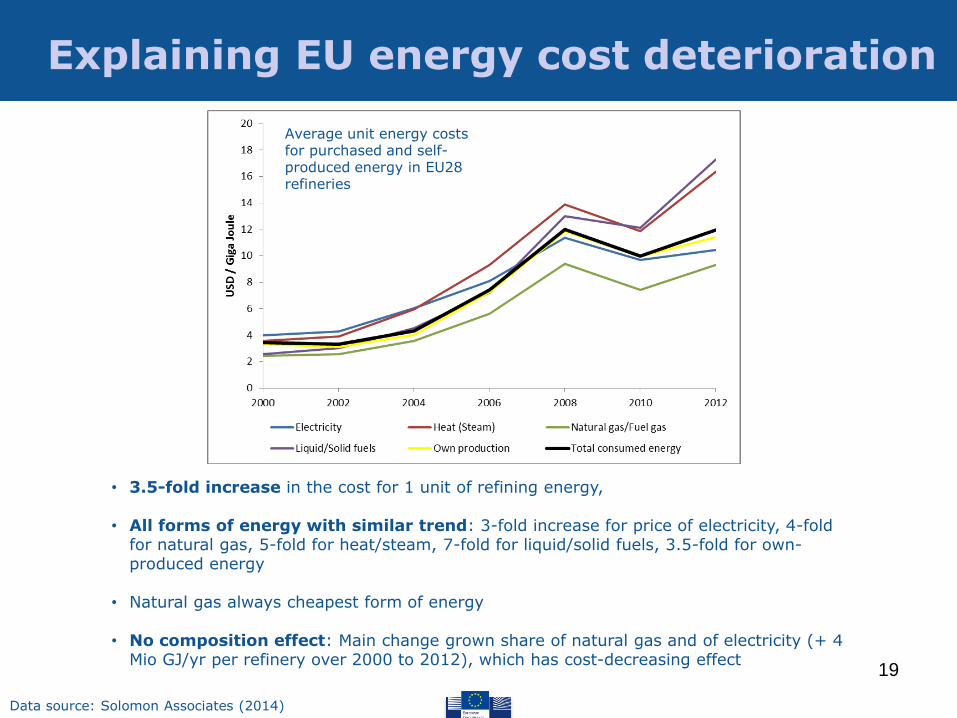
• 3.5-fold increase in the cost for 1 unit of refining energy,
• All forms of energy with similar trend: 3-fold increase for price of electricity, 4-fold for natural gas, 5-fold for heat/steam, 7-fold for liquid/solid fuels, 3.5-fold for own-produced energy
• Natural gas always cheapest form of energy
• No composition effect: Main change grown share of natural gas and of electricity (+ 4 Mio GJ/yr per refinery over 2000 to 2012), which has cost-decreasing effect
Data source: Solomon Associates (2014)
Average unit energy costs for purchased and self-produced energy in EU28 refineries
Explaining EU energy cost deterioration

20
Energy costs in Europe may have increased because: 1) Decreasing – relative to competitors – energy efficiency (=
use of energy per throughput)
2) Cost increase in Europe – relative to the competitor regions – of 1 unit of energy
i. due to price increases
ii. due to composition effect, i.e. switch towards more costly forms of energy
Explaining EU energy cost deterioration

21
Energy costs in Europe may have increased because: 1) Decreasing – relative to competitors – energy efficiency (= use of energy per
throughput)
2) Cost increase in Europe – relative to the competitor regions – of 1 unit of energy
i. due to price increases
ii. due to composition effect, i.e. switch towards more costly forms of energy
• The nearly 4-fold increase in EU energy costs is by 97% due to the increased cost of 1 unit of energy, and by 3% due to increased usage of energy per throughput.
• In terms of competitiveness, the data suggests that only the first effect matters, because the increase in energy use per throughput has been similar to that of the other regions.
• The increased costs for 1 unit of energy are related to the strongly increased prices of all forms of refining energy in the EU.
• EU energy prices appear to be closely tied to international crude prices, meaning that the dramatic increase of oil prices over 2000 to 2012 had strong impact. Less strong in other regions which benefited from abundant domestic fossil resources (Middle East, Russia) or use of unconventional resources (US Gulf and East Coast).
Explaining EU energy cost deterioration

22
Variation within EU28 refining sector
Difference of average refining net margins in EU28 and average refining net margins in 5 competitor regions.
Average EU28 net margins have fallen below those of the
competitor regions.
Source: own estimates based on Solomon Associates (2014,2014a) data

23 Source: own estimates based on Solomon Associates (2014,2014a) data
Difference of average refining net margins in EU28 and average refining net margins in 5 competitor regions.
Bottom 25% percentile of EU28 refineries vs. average of competitor regions
Top 25% percentile of EU28 refineries vs. average of competitor regions
Variation within EU28 refining sector

24
Difference of average refining net margins in EU28 and average refining net margins in 5 competitor regions.
Bottom 25% percentile of EU28 refineries vs. average of competitor regions
Top 25% percentile of EU28 refineries vs. average of competitor regions
The top 50% refineries are on average still better than the average of the competitors
The bottom 50% refineries have fallen far behind the average of the competitors
Source: own estimates based on Solomon Associates (2014,2014a) data
Variation within EU28 refining sector

25
EU Performance in terms of net margins has become more variable – especially in the
bottom 50%
4 USD/bbl difference between top 25% percentile and bottom 25% percentile.
Source: own estimates based on Solomon Associates (2014,2014a) data
Variation within EU28 refining sector
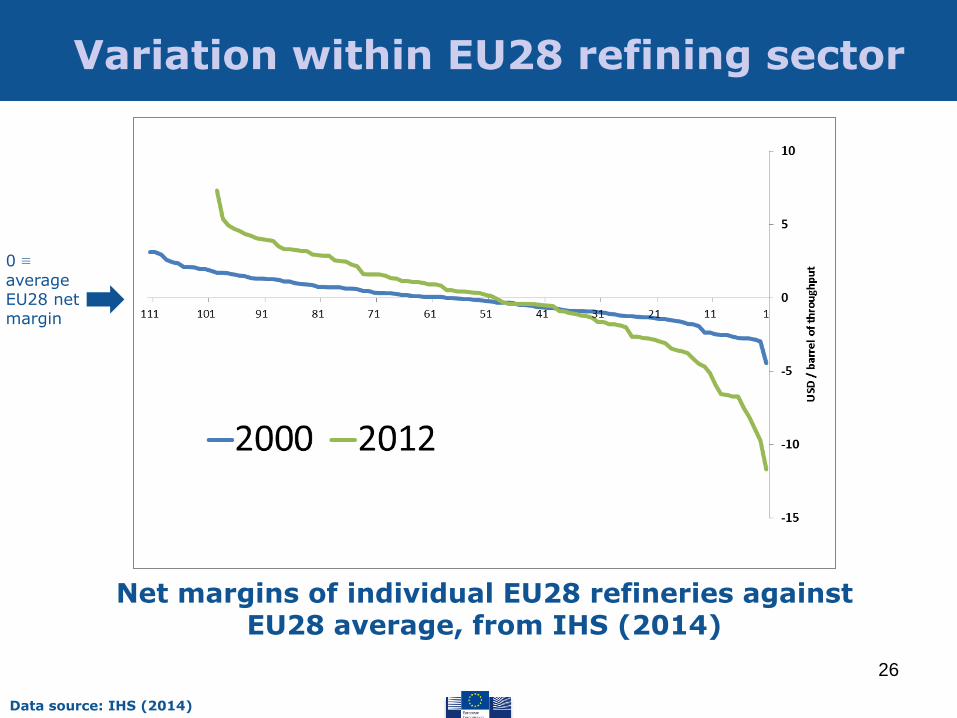
26
Data source: IHS (2014)
Net margins of individual EU28 refineries against EU28 average, from IHS (2014)
Variation within EU28 refining sector
0 ≡
average EU28 net margin

27
Data source: IHS (2014)
Net margins of individual EU28 refineries compared to EU28 average, from IHS (2014)
Top 20 refineries
Bottom 20 refineries
Variation within EU28 refining sector

28
EU28 top vs. bottom refineries (2012)
Data source: IHS (2014)
Top 20 refineries Bottom 20 refineries
204.000 barrels/day + 80.0000 vacuum 8.1 Nelson complexity
124.000 barrels/day + + 34.000 vacuum 7.9 Nelson complexity
Replacement costs* Annual revenues*
Annual OpEx*
3.2 8.1
0.38
2.2 5.2
0.28
* in billion USD
Residuals Residuals
29
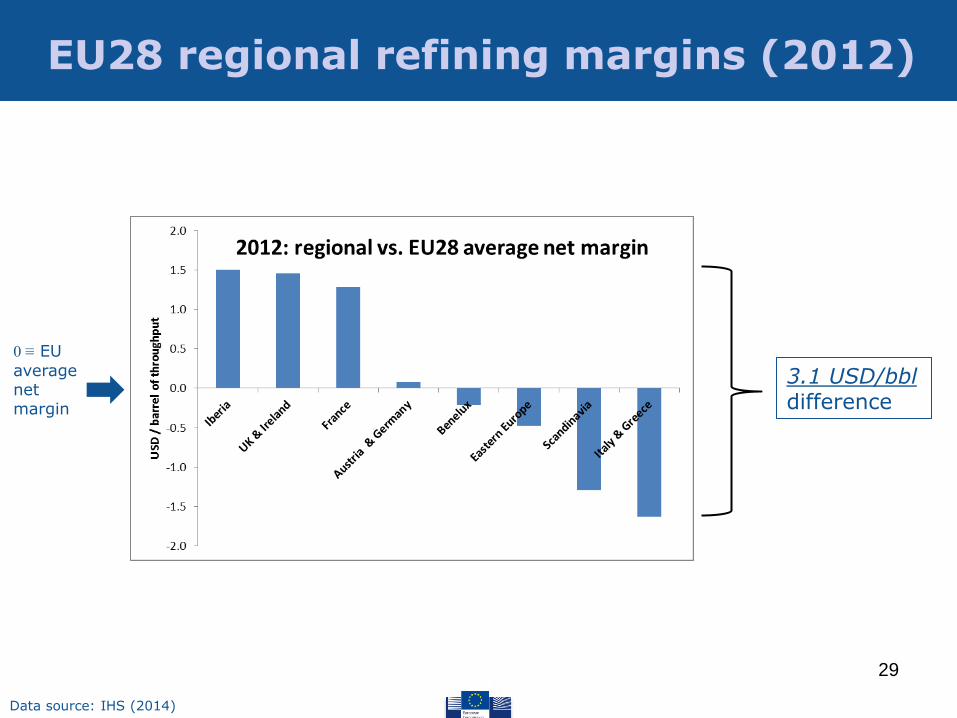
Data source: IHS (2014)
3.1 USD/bbl difference
EU28 regional refining margins (2012)
0 ≡ EU
average net margin
30
Competitiveness analysis: conclusions
EU28 international competitiveness vis-à-vis US PADD 1 & 3, Middle East, Russia, S.Korea & Singapore: 1) Loss of competitiveness: EU margin decrease of 2.5
USD/bbl against competitor regions over 2000-2012
2) Due to relative increase in energy costs in EU
3) In absolute terms, energy costs per barrel have increased almost 4-fold over 2000-12, while on average less than 2-fold in competitor regions
4) All forms of energy experienced similar strong cost increases
5) Related to 4-fold increase in crude oil price over same period
6) EU has no abundant domestic energy source, as e.g., US with non-conventional resources

31
Competitiveness analysis: conclusions
Variation of competitiveness and performance within EU: 1) International competitiveness of bottom 50% of EU
refineries has suffered far more than that of top 50%
2) The performance gap between EU28 refineries has widened: spread between 25% percentile and 75% percentile has increased 3-fold from about 1.3 to 4.0 USD/bbl
3) Top 20 EU refineries • have 65% higher capacity than bottom 20 EU refineries • are geared more strongly toward mid-distillates
4) Regional net margins differ significantly • Some regions consistently have above EU average
margins, others consistently below

• Loss of EU28 competitiveness due to relative increase of per barrel energy costs
• Has EU legislation contributed to increased refining energy costs? Some working hypotheses for how this might occur:
1. EU ETS increases costs of purchased electricity
2. Increased energy consumption due to FQD
3. Switch to low-sulphur crude oil for refinery energy due to pollution legislation (IED/LCPD/IPPCD)
4. Demand impacts (RED, ETD, IED) reduce utilization rate, which can negatively affect refineries' energy efficiency
Regulatory impact on competitiveness?
32
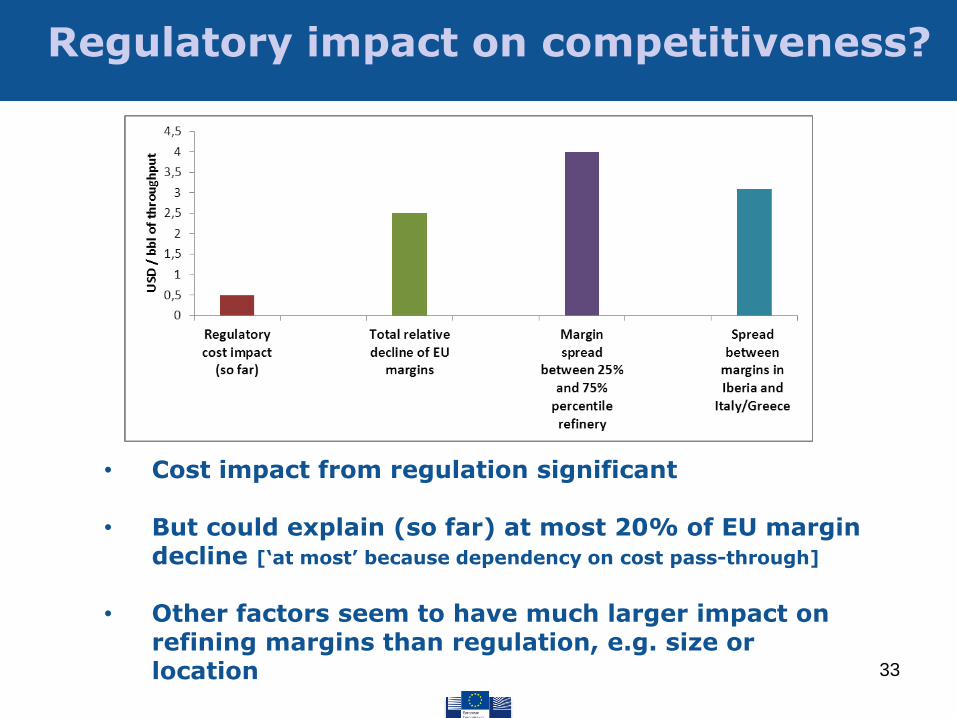
Regulatory impact on competitiveness?
• Cost impact from regulation significant
• But could explain (so far) at most 20% of EU margin decline [‘at most’ because dependency on cost pass-through]
• Other factors seem to have much larger impact on
refining margins than regulation, e.g. size or location 33
34
Thank you Robert MARSCHINSKI European Commission Joint Research Centre (JRC) Institute for Prospective Technological Studies (IPTS) [email protected] JRC Seville Refining Fitness Check team: Dilyara Bakthieva, Luis Delgado, Peter Eder, Ruslan Lukach, Marian Mraz, Robert Marschinski, Umed Temurshoev
References CONCAWE (2014). Survey of European refineries on costs related to pollution control and biofuels. Communication to JRC. IHS (2014). EU Refinery Fitness Check Data Set. Assembled for JRC. Solomon Associates (2014). Data of EU refining industry, years 1998 to 2012. Compiled for Fuels Europe and the ENTR Directorate of the European Commission. September 2014. Solomon Associates (2014a). Operating Expenses and Margin Analysis of the European Union (EU28) Refineries vs Regional Peers. Prepared by Solomon Associates for CONCAWE. January 2014.