Embed Size (px)
Citation preview

J.P. Morgan 10th Annual Homebuilding and Building
Products ConferenceM a y 1 8 , 2 0 1 7
J.P. Morgan I May 2017 2
Forward‐Looking Statements
This presentation may include “forward‐looking statements” as defined by the Private Securities Litigation Reform Act of1995. Although D.R. Horton believes any such statements are based on reasonable assumptions, there is no assurancethat actual outcomes will not be materially different. Factors that may cause the actual results to be materially differentfrom the future results expressed by the forward‐looking statements include, but are not limited to: the cyclical nature ofthe homebuilding industry and changes in economic, real estate and other conditions; constriction of the credit markets,which could limit our ability to access capital and increase our costs of capital; reductions in the availability of mortgagefinancing provided by government agencies, changes in government financing programs, a decrease in our ability to sellmortgage loans on attractive terms or an increase in mortgage interest rates; the risks associated with our land and lotinventory; home warranty and construction defect claims; the effects of a health and safety incident; the effects ofnegative publicity; supply shortages and other risks of acquiring land, building materials and skilled labor; the impact of aninflationary, deflationary or higher interest rate environment; reductions in the availability of performance bonds;increases in the costs of owning a home; the effects of governmental regulations and environmental matters on ourhomebuilding operations; the effects of governmental regulations on our financial services operations; our significant debtand our ability to comply with related debt covenants, restrictions and limitations; competitive conditions within thehomebuilding and financial services industries; our ability to effect our growth strategies, acquisitions or investmentssuccessfully; the effects of the loss of key personnel; and information technology failures and data security breaches.Additional information about issues that could lead to material changes in performance is contained in D.R. Horton’sannual report on Form 10‐K and our most recent quarterly report on Form 10‐Q, both of which are filed with theSecurities and Exchange Commission.
J.P. Morgan I May 2017 3
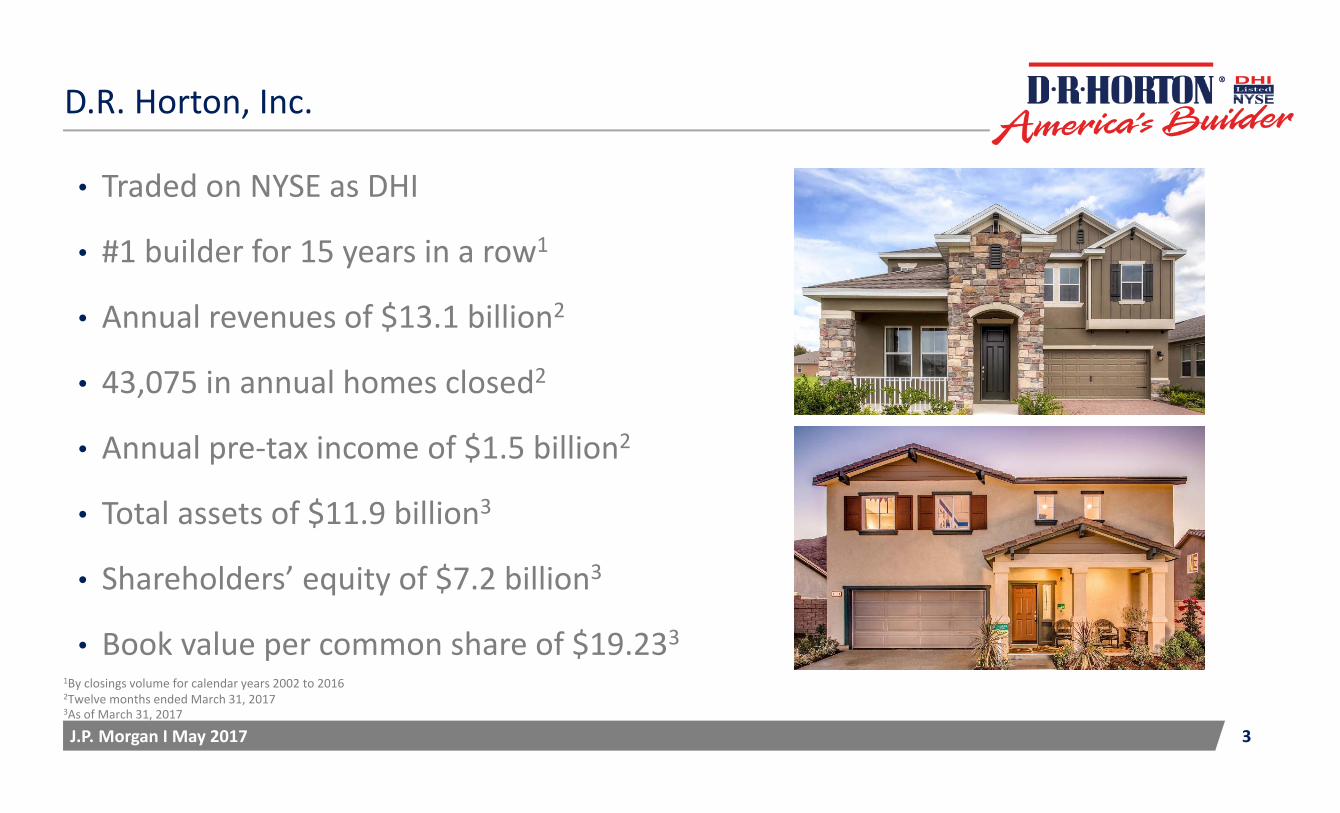
1By closings volume for calendar years 2002 to 20162Twelve months ended March 31, 20173As of March 31, 2017
• Traded on NYSE as DHI
• #1 builder for 15 years in a row1
• Annual revenues of $13.1 billion2
• 43,075 in annual homes closed2
• Annual pre‐tax income of $1.5 billion2
• Total assets of $11.9 billion3
• Shareholders’ equity of $7.2 billion3
• Book value per common share of $19.233
D.R. Horton, Inc.

J.P. Morgan I May 2017 4
Broad National Footprint
HB Revenue1
Region States
East Delaware, Maryland, New Jersey, North Carolina, Pennsylvania, South Carolina, Virginia
Midwest Colorado, Illinois, Minnesota
Southeast Alabama, Florida, Georgia, Mississippi, Tennessee
South Central Louisiana, Oklahoma, Texas
Southwest Arizona, New Mexico
West California, Hawaii, Nevada, Oregon, Utah, Washington
Inventory2
South Central
25%
Southwest4%
West24% Midwest
5%
Southeast30%
Midwest5%
South Central
25%Southeast
26%
East12%
West27%
Southwest5%
78 Markets | 26 States
1Twelve months ended March 31, 20172As of March 31, 2017
East12%

J.P. Morgan I May 2017 5
Diverse Product Offerings
Homes for entry‐level, move‐up, active adult and luxury buyers
$200k to $250k
$250k to $300k
$300k to $500k
24%
24% 19%
26%
Represents homes closed for the trailing twelve months ended 3/31/17
< $200k
$500k+
7%

J.P. Morgan I May 2017 6
Family of Brands
• The heart of our business• Offered across all 78 markets and 26 states we
operate in• 67% of homes closed and 70% of home sales
revenue• Average selling price of $311,000
• Introduced in July 2016 as carefree affordable living for active adults
• Currently in 10 markets and 8 states• Low‐maintenance lifestyle• Expect to have available in approximately 1/3
of our 78 markets by the end of the year
• Introduced in 2014, targeted at the true entry‐level buyer
• Currently in 55 markets and 18 states• 29% of homes closed and 22% of home sales
revenue• Average selling price of $220,000
• Introduced in 2013, focused on the higher‐end move up and luxury buyer
• Currently in 43 markets and 18 states• 4% of homes closed and 8% of home sales
revenue• Average selling price of $617,000
Based on Q2 FY 2017 results
J.P. Morgan I May 2017 7
Management Tenure & Experience
Average employee tenure:
• Executive Team and Region Presidents – over 20 years
• Division Presidents and City Managers – over 13 years
J.P. Morgan I May 2017 8
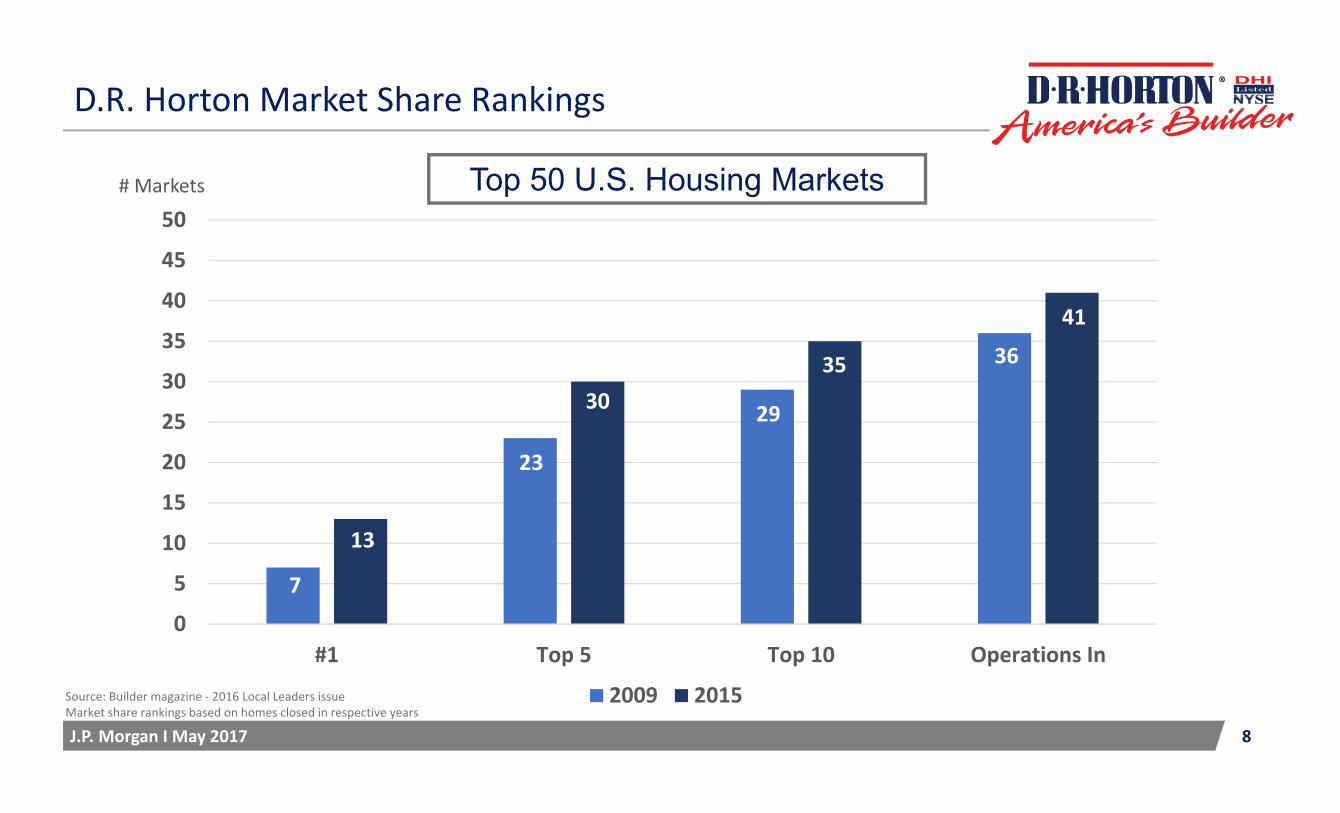
D.R. Horton Market Share Rankings
7
23
29
36
13
3035
41
0
5
10
15
20
25
30
35
40
45
50
#1 Top 5 Top 10 Operations In
2009 2015Source: Builder magazine ‐ 2016 Local Leaders issueMarket share rankings based on homes closed in respective years
# Markets Top 50 U.S. Housing Markets

J.P. Morgan I May 2017 9
Operational Focus
• Maximize returns by managing inventory levels efficiently and consistently balancing sales pace and pricing in each community
• Generate consistent positive annual cash flow from operations
• Maintain a land and lot portfolio sufficient to support double‐digit annual growth in both revenues and profits
• Underwriting criteria for land and lot purchases and operational expectations for each community across all brands:
• Minimum 20% annual net return on inventory investment (ROI)
• Initial cash investment returned within 24 months or less
• Control SG&A costs while ensuring our infrastructure supports growth

J.P. Morgan I May 2017 10
Homebuilding ROI is calculated as homebuilding pre‐tax income for the year divided by average inventory. Average inventory in the ROI calculation is the sum of ending inventory balances for the trailing five quarters divided by five.
Emphasis on Return on Inventory (ROI)
11.1%
12.8%
13.8%
15.4%
16.0%
0.0%
5.0%
10.0%
15.0%
20.0%
FY 2014 FY 2015 TTM 3/31/16 FY 2016 TTM 3/31/17
Steady improvement in Homebuilding ROI
J.P. Morgan I May 2017 11$ in billions
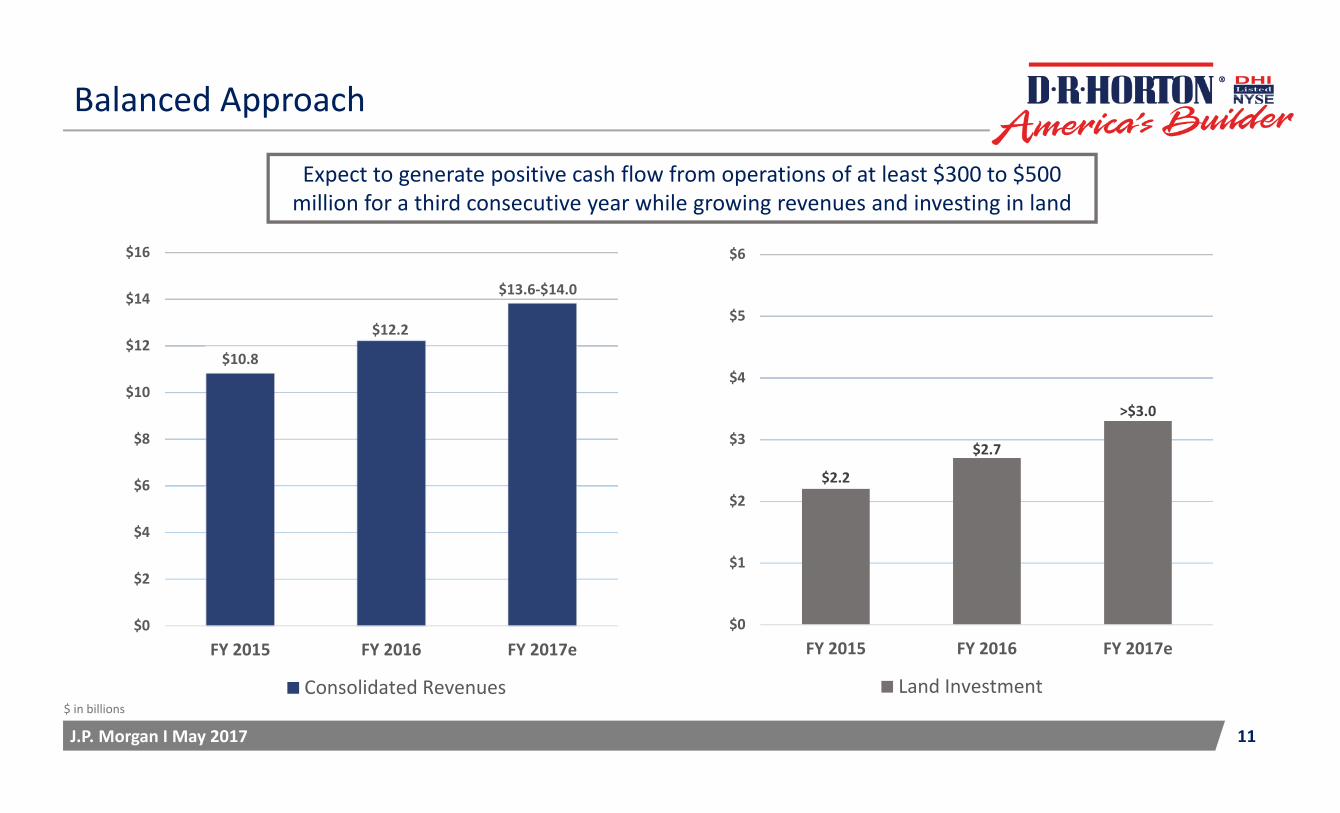
Balanced Approach
$10.8
$12.2
$0
$2
$4
$6
$8
$10
$12
$14
$16
FY 2015 FY 2016 FY 2017e
Consolidated Revenues
Expect to generate positive cash flow from operations of at least $300 to $500 million for a third consecutive year while growing revenues and investing in land
$2.2
$2.7
>$3.0
$0
$1
$2
$3
$4
$5
$6
FY 2015 FY 2016 FY 2017e
Land Investment
$13.6‐$14.0

J.P. Morgan I May 2017 12
Capital & Cash Flow Priorities
• Flexible, opportunistic and disciplined• Invest in homebuilding business where opportunities to generate acceptable returns exist, including acquisitions to further consolidate market share
• Pay off debt at maturity• Repaid $350 million of senior notes at maturity in May 2017 with existing cash
• Consistent dividends to shareholders• Expect annual cash dividends of approximately $150 million at current rate
• Share repurchases to partially offset dilution • Repurchased 1.85 million shares quarter to date (as of 5/16/17) for a total of $60.6 million
J.P. Morgan I May 2017 13
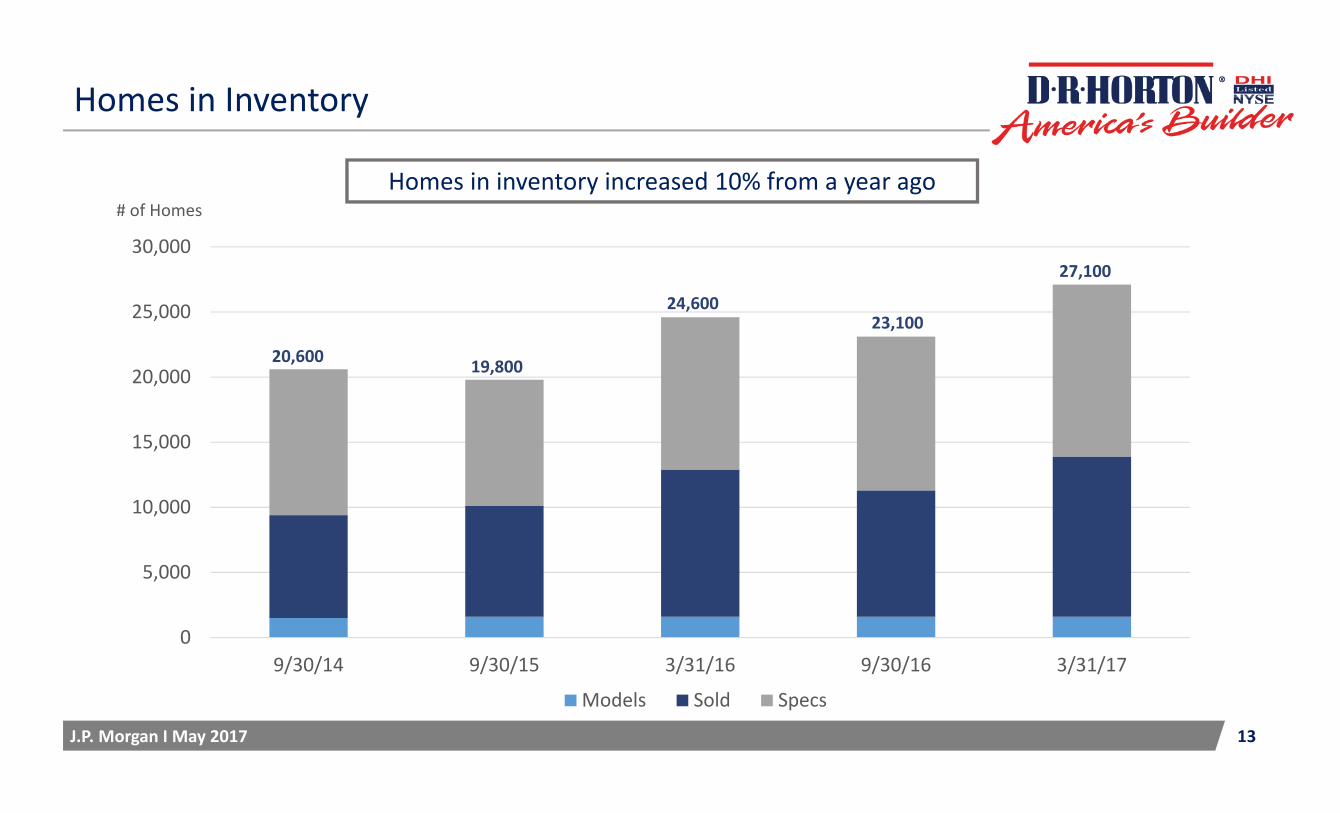
Homes in Inventory
0
5,000
10,000
15,000
20,000
25,000
30,000
9/30/14 9/30/15 3/31/16 9/30/16 3/31/17
Models Sold Specs
24,600
19,80020,600
27,100
23,100
# of HomesHomes in inventory increased 10% from a year ago
J.P. Morgan I May 2017 14
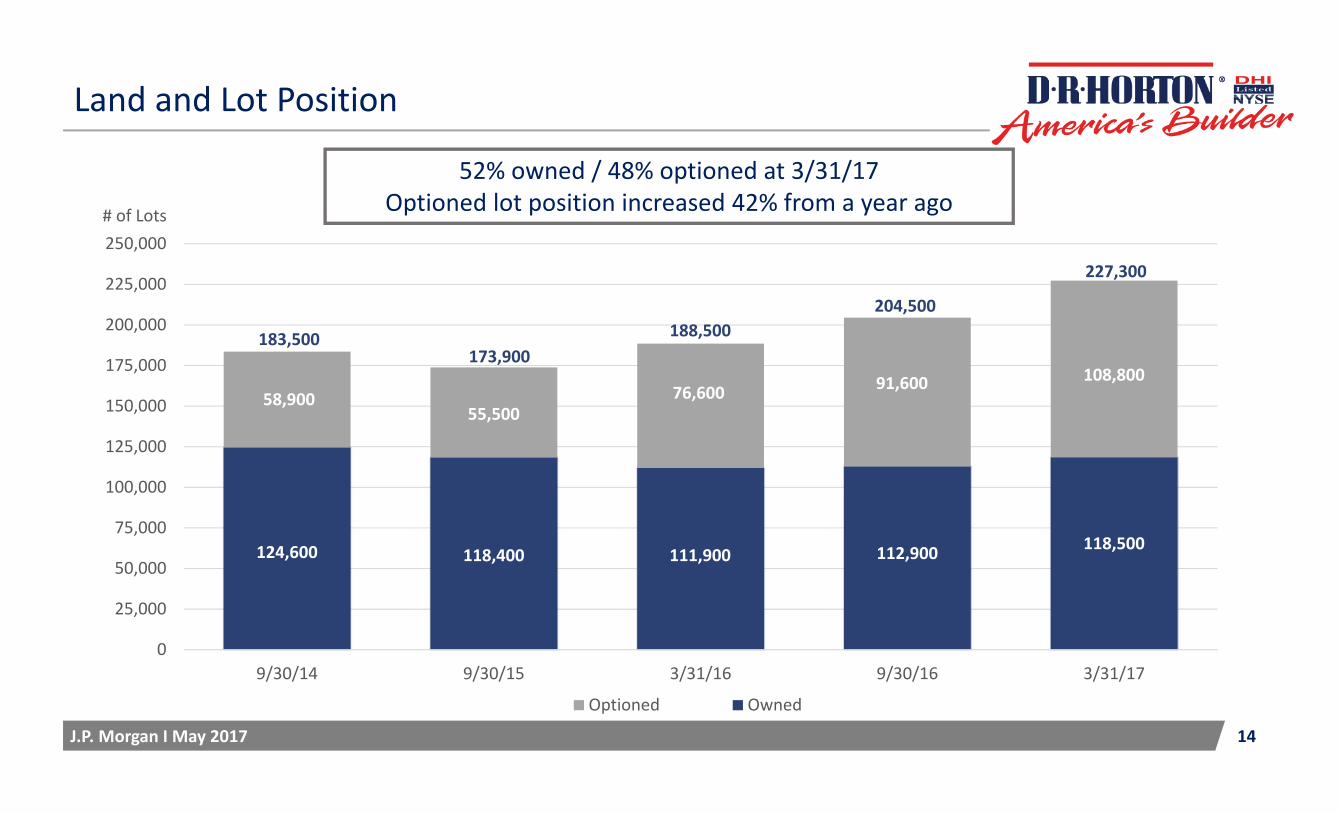
Land and Lot Position
52% owned / 48% optioned at 3/31/17Optioned lot position increased 42% from a year ago
124,600 118,400 111,900 112,900 118,500
58,90055,500
76,600 91,600 108,800
0
25,000
50,000
75,000
100,000
125,000
150,000
175,000
200,000
225,000
250,000
9/30/14 9/30/15 3/31/16 9/30/16 3/31/17
Optioned Owned
183,500173,900
188,500204,500
# of Lots
227,300

J.P. Morgan I May 2017 15
FY 2017 Expectations*
• Consolidated pre‐tax profit margin of 11.2% to 11.5%• Consolidated revenues between $13.6 billion and $14.0 billion• Homes closed between 44,500 homes and 46,000 homes• Home sales gross margin around 20%, with potential quarterly fluctuations from 19% to 21%
• Homebuilding SG&A expense of 8.8% to 9.1% of homebuilding revenues• Financial Services operating margin of approximately 35%• Income tax rate of approximately 35.5%• Diluted share count of approximately 380 million shares • Cash flow from operations in the range of $300 to $500 million
*Based on housing market conditions as noted on the Company’s conference call on 4/20/17