Embed Size (px)
Citation preview

Joy and fear of Christmasbaking ...
Determination of mycotoxins inbakery products
The new IRSpirit
makes infrared spectroscopyeasier than ever before
Behind the scenes
Users’ insights on working with CLAM-2000

Pharmaceutical
Plastics and Rubber
CONTENT
Clinical
Chemical, Petrochemical,Biofuel and Energy
Sandfish and teeth: the power of bionics – UV-2600 and ISR-2600Plus:analysis of nanospikes 6
Fast GC without a handbrake – Filter time constant and sampling frequency improve the signal-to-noise ratio 10
Joy and fear of Christmas baking ...Determination of mycotoxins in bakery products using LC-MS 16
Small but powerful! – Small columns accelerate conventional USP methods for medical use andsave solvents, time and money 20
Just paper, isn’t it? – Analysis of paper-based food packagingmaterials using infrared ATR spectroscopy 23
APPLICATION
Climate research in the ocean – An alternative method for the deter-mination of CO2 in seawater 8
Behind the scenes – Users’ insightson working with CLAM-2000 afterone year in duty 15
Time-efficient method for beer analysis – derivatization and quantification of Glyphosate andAMPA 25
New solutions to complex problems – Global Innovation Summit –World-leading research meets cutting-edge technology 29
LATEST NEWS
MARKETS
Ultra-small footprint meets excep -tional ease-of-use and functionality –IRSpirit makes infrared spectroscopyeasier than ever before 2
Compliance made easy – TOC determination in a regulatedlaboratory environment 4
Optimal handling of analytical data in regulated laboratories – How to deal with stricter require-ments of cGMP 12
PRODUCTS
SHIMADZU NEWS 3/2017
Food, Beverages, Agriculture
Environment
Automotive
Ultra-small footprintmeets exceptional ease-of-use and functionalityIRSpirit makes infrared spectroscopy easier than ever before
Figure 1: IRSpirit size versus A3 paper
size. The A3 paper size is represented by
the gray rectangle.
T he new IRSpirit series com-plements Shimadzu’s well-known FTIR instruments
line. Designed for high specifi -cation on a small footprint,IRSpirit series adds new possibil-ities combined with the robust-ness of its higher-class familymembers. With the new dedicat-ed software IRPilot, IRSpirit setsa new standard in terms of easeof use. This provides outstandingefficiency in infrared spectrosco -py and helps users to save timeduring analysis developmentpro cedures.
spaces, such as glove boxes. Infact, the start button and thehumidity indicator are accessibleand visible from both set ups.Moreover, IRSpirit is especiallydesigned to offer an user easyaccess of sample compartmentfrom two sides.
Despite this small size, the sam-ple compartment width is thesame as on higher-end models:200 x 140 x 100 mm (WxDxH).This makes the IRSpirit seriescompatible with many Shimadzuand other commercial accessoriesand usable for a wide variety ofapplications.
High reliability through technology inherited fromhigh-end models
Based on Shimadzu’s long andin-depth experience with theFTIR interferometer, the IRSpiritseries optical system is constitut-ed by a Michelson interferometerwhich is well-known for its highperformance associated with aceramic light source. Efficient
Space-efficient and flexible
In modern laboratories, effectivespace planning is a permanentchallenge. Aware of this prob-lem, IRSpirit has been developedto be as small as possible. Thus,the footprint of the IRSpiritseries is smaller than an A3 sheetof paper.
The design of the IRSpirit seriesalso allows to conduct measure-ments with the unit positionedhorizontally or vertically inorder to adjust to the smallest
Fourier Transform Infrared Spectrophotometer IRSpirit

PRODUCTS
3SHIMADZU NEWS 3/2017
Figure 4: Overview of LabSolutions IR Macro programming
features like the dynamic align-ment and the high brightness ofthe light source support the opticalsystem. With its DLATGS detec-tor with temperature control func-tions [1], the IRSpirit series isdeclared the best of its class with asensitivity up to 30,000 : 1 (with aKBr-window). This system showshigh stability and through put inorder to generate reliable results.
High flexibility is ensured by thedifferent window materials avail-able as well as different detectorvariations. [2] Even though theinstru ment is small and compact, it is fully controlled the same wayas higher-end versions. Statusmonitoring is also available as wellas the diagnostic function. IRSpirithas an automatic accessory recog-nition which is able to assist usersduring the parameter selectionneeded for a specific accessory.
LabSolutions IR: more than a software
In addition to the accessory auto-matic recognition, LabSolutions IRsoftware is able to control all thedifferent parameter settings formeasurement and analysis.
In order to minimize the usersworkload, LabSolutions IR pro-vides IRPilot, an assistant softwarefor standard analysis. Guidingthrough parameter settings, sup-porting the measurement and end-ing in the final result – nearly one-stop analysis.
With its 23 integrated applications,IRPilot makes sample analysiseasy, even for operators with mini-mal FTIR experience.
LabSolutions IR will help to solvethe specific demands of an infrared
spectrum. A part of this softwareis, for example, dedicated to the“Identification Test Program” andthe “Contaminant Analysis Pro -gram”. Both tools testify the abili-ty of the IRSpirit series to identifypure or contaminated samples. Ofcourse, LabSolutions IR is also ableto utilize quantitative analysis.
LabSolutions IR has an additionalmacro-function helping operatorsto create more personalized auto -mation for the analysis. Some soft-ware options, like specific librariesor kinetic studies, are integrated toprovide for all user wishes. Finally,the exclusive optional softwareEDXIR is available, which over-laps EDX and IR measurements toidentify contaminants.
The compliance with ER/ES regulations is granted with theShimadzu LabSolutions DB or CS platform. These tools provide a project management functionsuited to tasks and system opera-tions. This function enables equip-ment and user management, secu-rity policy, and data processing to
be set on a project-by-project ba -sis, thereby improving the efficien-cy of data searches and manage-ment tasks.
Conclusion
The IRSpirit series defines a newstandard in the world of compactIR spectrometers. The combina-tion of its small size and high per-formance makes it an ideal solu-tion for many different applica-tions. IRspirit series is then a valu-able system for quality controleven in highly regulated fields, e.g.the pharmaceutical industry. Thesespectrometers also help to solvesophisticated problems, such asthe identification of solid, liquidand gaseous materials. The sim -plici ty of software and instrumenthandling also make IRSpirit a per-fect support for education purpos-es.
Literature[1] Available on IRSpirit-T.
[2] IRSpirit-T: DLATGS-detector with
temperature control function ;
IRSpirit-L: LiTaO3 detector.
Figure 2: Examples of hardware options for the IRSpirit series: QATR-S (left)
single-reflection ATR measurement attachment and DRS-8000A (right) for Diffuse
Reflectance Spectroscopy (DRS).
Figure 3: IRPilot diagram and workflow
Figure 5: LabSolutions DB/CS Database Management System

PRODUCTS
4 SHIMADZU NEWS 3/2017
S ince the American and Euro -pean Pharmacopeia require-ment of TOC determination
for testing ultrapure water (waterfor injection, highly purifiedwater), TOC measuring systemshave been used extensively in thepharmaceutical industry. In addi-tion to the ultrapure water analy-sis application, TOC determina-tion is used for cleaning validationand in the testing of plastic pack-aging and its materials. This iswhy TOC instruments are used ina regulated laboratory environ-ment and why these systems aresubject to various regulations thatapply particularly to instrumentsoftware, which is focused in thisarticle.
volved in the planning, implemen-tation and monitoring of laborato-ry studies and testing as well asthe recording and reporting ofanalytical results. This means thatthe instrument software authoriz-es access to the system and fullydocuments data and parameterchanges as well as events andresults.
FDA 21 CFR Part 11 covers the use of electronic records
In 1997, the American Food andDrug Administration initiallydeveloped guidelines on the use ofelectronic records and electronicsignatures, in order to drastically
GLP/GMP refers to the organizational process
One of these regulations is “GoodLaboratory Practice” (GLP),which refers to the organizationalprocess and the conditions in -
Compliance made easyTOC determination in a regulated laboratory environment
Figure 1: LabSolutions splash screen
Figure 2: Audit trail

PRODUCTS
5SHIMADZU NEWS 3/2017
Further information
on this article:
• Whitepaper:
“Compliance of
Shimadzu Total
Organic Carbon (TOC) analyzer with
FDA 21 CFR Part 11 regulations on
electronic records and electronic
signatures – TOC-Control L Ver. 1 /
LabSolutions DB/CS Ver. 6”
reduce the necessity for paper-work. As electronic information is easier to falsify, 21 CFR Part 11defined criteria under whichapplications and documentationmust be digitally filed and elec-tronic signatures can be recog-nized. This is to guarantee thatelectronic documents are as trust-worthy and reliable as paperrecords.
Control mechanisms and direc-tions on procedures must safe-guard data authenticity – and ifnecessary also data integrity. MostPart 11 regulations involve safetymeasures against illegal systemaccess, user management, datasecurity, data archiving and theelectronic signatures themselves.The TOC-Control L softwarerunning the TOC-L series pro-vides full support for complyingwith CFR 21 Part 11, while stillremaining extremely user-friendly.
TOC-Control L software supports analysis work anddata reliability assurance
Already during software installa-tion, the operating criteria of thesoftware are defined. The parame-ters selected cannot be deactivatedafterwards. The TOC-Control Lsoftware provides a wealth offunctions to fully support analysiswork and to support data reliabili-ty assurance.
User administration
Software utilization is enabled viauser access rights. It offers indi-vidual accounts on four differentlevels, each protected throughown passwords. The administratorcan change access rights for eachuser. TOC-Control L allows
changing of login during ongoingoperations. This is especially im -portant for laboratories workingin multiple shifts. User adminis-tration is carried out in an externalmanagement software, whereparameters for passwords likeminimum length, complexity andvalidity period can be specified.To prevent illegal access, it is pos-sible to set lockout functions andautomatic email transmissions incase of specified events.
Audit Trail for documentationpurposes
All software operations are storedautomatically in the audit trail(figure 2) which operates in thebackground. Entering of a com-ment can be set as mandatorywhen parameters are modified.Data storage takes place in a rela-tional database. Through targetedqueries specific operations caneasily be referred to. It is possibleto sort data according to timeperiods as well as user names ortopics such as maintenance, ad -ministration or sample measure-ment. It is possible to manuallyenter maintenance operations thatare not recognized by the soft-ware (e.g. replacement of the cata-lyst).
Raw data management provides data acquisition security
In a regulated laboratory environ-ment, data acquisition security is particularly important. Dataacquired may not be altered byusers not recognized by the soft-ware. TOC determination startswith peak integration, which can-not be influenced by the user. The peak area obtained is subse-quently converted into a concen-tration value via a calibrationcurve. Recalculation applying a
Figure 3: Template for EP/USP calibration
curve
Figure 5: Template for the system
suitability test
Figure 4: Executed system suitability test with automatic calculation
different calibration curve is pos-sible, if permitted by the adminis-trator.
All data is stored automatically,and the respective data files con-tain all important information: the system utilized, the user, themethods and calibration curvesapplied, the measured results(areas and concentrations) and thepeak profile. For data protectionand backup, these data files can beexported into a database directlyafter creation. Output is possiblein human-readable form in .txt or .pdf file format.
LabSolutions: cross-functionaldata management
For solid data security and im -proved management efficiency,Shimadzu offers the LabSolutionssoftware platform. LabSolutions is a cross-functional data manage-ment concept for FDA 21 CFRPart 11 compliance and is applica-ble across the entire laboratory.Using LabSolutions, all data gen-erated by various Shimadzu sys-tems can be administered, signedand archived centrally in a rela-tional database. This enormousamount of data can be structuredproject-wise to enable easy searchand management.
The possibility to create custom -izable multi-data reports from dif-ferent types of analysis simplifiesreporting to decision-makers andcontractors. Support for comput-erized system validation (CSV)and predefined validation tem-plates within TOC-Control L,facilitate easy system validationwhile minimizing possibilities oferror. The LabSolutions platformcan be set up on a single-PC base(LabSolutions DB) for smallerlaboratories or in a company-wideclient server network system(LabSolutions CS).
Support for TOC determinationaccording to EP 2.2.44
The TOC-Control L softwaresimplifies the implementation oftests with integrated templates forthe creation of calibration curves(figure 3) and measurement ofcontrol samples.
The system suitability test is pre-defined in a method template (figure 5). Following measurementof the control sample (benzo-quinone), recovery is calculatedautomatically, compared with thepredetermined limits (85 -115 %)and documented (figure 4).
Conclusion
The TOC-Control L softwarecombines all necessary functionsfor secure data handling whilesupporting user-friendly compli-ance with existing regulations inthe pharmaceutical industry.

nm.
Abs.
0.520
1.000
1.500
2.000
2.352
200.000 500.000 1,000.000 1,357.400
W hat has a reptile thatswims through sand gotin common with paint?
Both are linked through bionics,an interdisciplinary science whichapplies biological methods andsystems found in nature to designmodern technologies. A well-known application is the so-calledlotus effect imitating the nanosco -pic properties of plants for coat-ings, paints, and roof tiles to sup-port self-cleaning features.
Paint whiteners and dental im -plants based on Titanium mightseem a world away from theworld of the desert sandfish
(Scincus scincus), a little reptilethat swims through sand likethrough water. But advances inthe world of bionics makes thereptile’s skin and the surface ofthe dental implants share the samesecret: nanospikes.
The skin of the desert sandfish hasevolved spiky nanostructureswhich produce a virtually friction-less surface, offering only a tinyfraction of the normal surface areaof the creature in contact with thehard grains of dry sand. [1] In thedental implant world, the nano -spikes exploit almost the exactopposite of this property, provid-
APPLICATION
6 SHIMADZU NEWS 3/2017
Sandfish and teeth: the power of bionicsUV-2600 and ISR-2600Plus: analysis of nanospikes from TiO2 and sodium on surfaces from dental materials
Figure 1: Nanospiking on surface
Desert Sandfish ( Scincus scincus )
Foto: Wilfried BernsTiermotive.de
Figure 2: UV-VIS-NIR spectra from nanospikes (Na dark blue line, Titanium Dioxide orange
line)

7SHIMADZU NEWS 3/2017
APPLICATION
ing a very large contact area forthe implant to establish contactwith the soft surface of the tissues.
This application discusses theanalysis of TiO2-based nanospikematerial for dental purposes.
New approach: nanostructureson surfaces related to or withTiO2
For decades, TiO2 has been a wellknown substance for differentareas of application. Very typicalis its use as a whitener, based onexcellent reflectance properties.Nanospiking opens up additionalapplications for TiO2. Nanospi -king is an approach generatingthin active surfaces with TiO2 toget the antibacterial properties ofthe TiO2 into very small areas.Nanospiking also produces a highsurface reflectance composed ofmany tens of thousands of tinyspikes. The illustration on page 6depicts titanium nanospikes athigh magnification using ScanningElectron Microscopy (SEM) (fig-ure 1). This spiking gives the sur-face a very high intense and brightwhite appearance.
However, the unusual surfacestructure when presented in thenanospiked form can alter thereflectivity. Titanium Dioxide alsoexhibits fluorescence. For medicaluse, it is usually advantageous touse as little material as possible. A new approach is to use nano -structures on surfaces related to or with TiO2. The nature of thenanospikes represents that of afield of needles which, in princi-pal, is an ideal diffuse reflector.Hence, the expectation is thatsuch surface has a higher diffusereflectance level than a normal un-spiked surface.
Application
Several samples were measuredwith UV-VIS-NIR spectroscopyin reflectance mode. [2, 3] Therewere Na and TiO2 nanospikedsamples, one blue-grey and onebrown-beige shiny material. Dueto the nature of the material, anintegrating sphere was used tocollect as much diffuse reflectanceas possible. These samples were
These traces are recorded in ‘nor-mal’ specular excluded mode, sothe specular reflectance of thesample is rejected. (The sample isilluminated at near-normal angleand mounted in a way that specu-lar reflectance is lost through thesphere transmission port.)
With materials which do notreflect an image at anything butvery shallow viewing angles, thismeasurement is generally the mostaccurate as the specular compo-nent is minimal. In the event thatthe sample is somewhat specular,an additional measurement can bemade using the ‘specular included’reference port which illuminatesthe sample at eight degrees fromnormal, allowing specular reflec -tance to be reflected back to thesphere wall and thus included inthe measurement.
Reviewing these results, theinstrument clearly delivers accu-rate results for the entire 200 -1,400 nm range. The results are allobtained using barium sulfate as a reference material. This is a verygood neutral reflector. All Inte -grat ing Sphere measurements haveto be made in Percent of Refer -ence mode as there is no way ofmeasuring diffuse reflectance as anabsolute value. [2, 3] The instru-ment normalizes all the reflectancevalues for the barium sulfate to100 % (0 Abs) during backgroundacquisition, but considerationshould be given to the reflectivityof the reference material.
Literature[1] The Sandfish of the Sahara – A Model
for Friction and Wear Reduction, Ingo
Rechenberg, Abdullah Regabi El Khyari,
Technische Universität Berlin, Bionik und
Evolutionstechnik, 2/2004.
[2] Standards in Absorption Spectrometry,
Burgess and Knowles
( ISBN 0-412-22470-4).
[3] Fundamentals of Molecular
Spectroscopy, Banwell and McCash
(ISBN 0-07-707976-0).
small in size, so in order to mountthe samples on the reflectanceport of the ISR-2600Plus integrat-ing sphere, a background mountwas made with BaSO4 white stan-dard. The sample was largeenough for the beam image of theinstrument to fall only onto thesample.
The sample was mounted on awhite reflector, so that the reflec-tion losses from the sphere wereminimized. Scans were made from220 to 1,400 nm using the uniquedual detector integrating spherewith the sample mounted at thediffuse reflectance port, which isat a zero degree incident angle toreject any specular reflectancecomponents of the measurement.
Summary
The nanospike traces show highabsorbance (low reflection) atshort wavelengths; it is likely thatthe trace at 200 nm is limited bythe reflectivity of the inside coat-ing of the sphere: (Barium sulfate)which mainly falls in the regionbetween 220 and 200 nm. Even inthis region however, the resultsshow that the instrument was stilloperating within range as the dataremains smooth. If the limit ofdetection had been reached, thetrace would have become ‘noisy’in the region below 220 nm.
The remainders of the traces arewell within the photometric rangeand the stray light range of thesystem. The reflectance traces arevery clear with minimal noise.
Figure 3: Brown-beige material (paler trace) and blue-grey material
(darker trace)
nm.
Abs.
0.155
1.000
0.500
1.500
1.980
200.000 500.000 1,000.000 1,400.000

LATEST NEWS
8 SHIMADZU NEWS 3/2017
An alternative method for the determination of carbon dioxide in seawater
Climate research in the ocean
T he world’s oceans have beencarbon dioxide sinks sinceeons. CO2 from the air is
permanently bound in the sea bycreatures that use calcium carbon-ate to build their skeleton. AnAmerican scientist team conduct-ed a long-term experiment withcorals at the Leibniz Center forMarine Tropical Research (ZMT)in Bremen, Germany. The TOCanalyzer based DIC (DissolvedInorganic Carbon) method de -monstrated its suitability as a safe,exact and fast alternative methodfor the investigation of seawater.
One of the world’s greatest chal-lenges today is the containment ofanthropogenic global warming.The agreement ratified at the ParisClimate Summit stipulates, interalia, to limit global warming tobelow 2 °C of the pre-industriallevel. Hopes are that the effects ofclimate change such as weatherextremes, glacier melting or rising
sea level can be reduced signifi-cantly.
One of the main causes of climatechange is presumed to be theemission of so-called greenhousegases. The gas most emitted byindustrialized countries is carbondioxide, and it is generated byburning fossil fuels. By way ofcomparison: In the 1960s, theaverage volumetric carbon dioxidecontent of the air was approx. 280 ppm, today it is over 400 ppm.
Coral in the climatic cycle
Two thirds of the Earth’s surfaceare covered by water. The world’soceans have functioned as impor-tant CO2 sinks for millions ofyears. A part of the carbon diox-ide contained in the atmosphere isfirst dissolved in seawater until itfinally dissociates and reaches thechemical carbonic acid equilibri-um. Within the pH-environment
of the oceans (pH approx. 8.2), itis present as almost 100 % hydro-gen carbonate. Much of these car-bon deposits are permanentlybound by organisms that use cal-cium carbonate to build theirskeleton, such as stony corals.
Climate changes and the increas-ing concentration of carbon diox-ide in the atmosphere have severaleffects on the oceans and the seas.On one hand, increases in CO2concentration lead to the so-calledacidification of the oceans. On the
Figure 1: Prof. Dr. Justin Ries from the Northeastern University (USA) uses stony corals for
experiments in the test facility of the ZMT Bremen, Germany.

LATEST NEWS
9SHIMADZU NEWS 3/2017
other hand, the solubility of CO2decreases as sea temperature rises.
Corals in various climatic environments
Particularly in tropical latitudes,corals which are important for the global carbon cycle grow andthrive. In the marine water re -search facility (MAREE) of theLeibniz Center for Marine Tropi calResearch (ZMT) in Bremen, Ger -ma ny, a tropical marine environ-ment can be simulated and eco-physiological tests can be per-formed.
In order to study the possible ef -fects of warming and increasedCO2 concentration of seawater on corals, a series of experimentswere undertaken where coralswere observed in different envi-ronments. Varying temperatureswere set in the test tanks, and pre-industrial, present, and future CO2concentrations were investigatedusing a gas mixing system. Thisway, growth rates of the coralswere determined over many weeks.
Various corals
The experiments were carried outon the tropical stony corals Stylo -phora pistillata, Pocillopora dami-cornis and Seriatopora hystrix, aswell as on the cold-water coralLophelia pertusa. They are part ofthe scientific studies of Prof. JustinRies of the “Northeastern Univer -sity” (Boston, Massachu setts,USA). For this purpose, Prof. Riesand his team visited the ZMT forseveral months to conduct andevaluate the experiments.
In order to characterize the waterconditions in the test tanks, tem-perature, pH, alkalinity (aciditybuffering), salinity (salt content)and DIC (dissolved inorganic car-bon) were used. During theseexperiments, especially the alkalin-ity and the DIC were analyzedcontinuously.
DIC determination
A coulometric reference methodhas been established as an interna-tional standard to determine theDIC. In this process, an aliquot ofthe seawater sample is acidifiedwith phosphoric acid. The result-
ing CO2 is introduced into themeasuring cell of a coulometer bymeans of a stripper gas and isabsorbed in a reaction solution(ethanolamine in dimethyl sulfox-ide). The CO2 reacts with theethanolamine to form hydroxy -ethylcarbamic acid and leads to a decoloration of the indicatorcontained in the reaction solution.The resulting hydroxyethylcar-
bamic acid is neutralized by theelectrochemical formation of OHions. The current consumed isused to calculate the concentrationof the DIC.
Analysis of a seawater sample(single determination) typicallytakes about 15 minutes by meansof the reference method. Addi -tional time is consumed for tem-pering the samples and the longequilibration of the analysis sys-tem. About ten samples can beanalyzed during an 8-hour work-ing day. In Prof. Ries’ experi-ments, 36 seawater samples perday had to be analyzed for DIC.
An alternative analytical methodwas therefore proposed whichwould provide comparable results,have high reproducibility, beautomatable and offer shorteranalysis times. In addition, the useof smaller sample quantities wasrequested (25 mL instead of 100 mL in the reference method).
Alternative measuring methodusing TOC/TIC-analyzers
One procedure established in theenvironmental sector to detect theorganic load of water is TOC-Determination (Total OrganicCarbon). An aliquot of the watersample is injected onto a 680 °Cheated platinum catalyst. The car-bon dioxide arising during thecombustion is guided by a carriergas to an NDIR detector and there -by detected. With this method, itis necessary to remove the inor-ganic carbon fraction completelybefore combustion or to deter-
Figure 2: TOC-L
Figure 3: Comparison of the two methods for the determination of CO2 in seawater
Coulometer
Shimadzu DIC (NDIR)
DIC Determination:Comparison of Shimadzu Analyzer and Coulometer
(in µmol/L)
y = 1.0239x - 23.677
R2 = 0.9991; N = 12
0
500
1,000
1,500
2,000
2,500
3,000
3,500
0 500 1,000 1,500 2,000 2,500 3,000 3,500
mine it separately and to take itinto account (subtraction).
The ZMT uses a highly sensitiveShimadzu TOC analyzer capableof determining DIC separately.An aliquot of the sample is inject-ed into a phosphoric acid receiver.The resulting CO2 is conducted toan NDIR detector by means ofcarrier gas and quantified. Thesingle determination of a DICconcentration takes about 3 min-utes. The time advantage of thismethod was obvious. How ever,before it could be used, equiva-lence to the reference meth od hadto be demonstrated.
For this purpose, both methodsshould have consistent accuracyand correctness. In addition,reproducibility should be < 1%.ZMT Development engineer,graduate engineer MatthiasBirkicht and his colleague DieterPeterke carried out a large meas-urement range to ensure equiva-lence. Synthetic standard solutionsof the “Dickson Sea Water Refer -ence Standards” as well as seawa-ter and tap water were measuredwith both methods at differentconcentration levels. Values ofboth methods were plotted againsteach other in a diagram (figure 3;concentration in µmol/L).
Evaluation
Evaluation of the equivalenceassessment showed a clear con-formity between the two methods.They showed good reproducibili-ty (± 6 µmol/L) and excellentaccuracy (± 4 µmol/L) for thistype of experiment. Moreover, thealternative DIC method did notconsume expensive and toxicreagents compared to the refer-ence method. Consumption costsfor an analysis could be reducedto 20 % while saving valuableanalysis time. It can be fully auto-mated when used with an auto -sampler.
Conclusion
In order to be able to assess therisks and effects of climate change,many scientific studies are neededrequiring fast, accurate, reproduc -ible and cost-effective analysismethods. The OSPAR interna-tional treaty dealing with the pro-tection of the North Sea and theNorth Atlantic also describes thedetermination of CO2 in seawaterin its guidelines for the Study ofSea Water ( JAMP Guidelines forMonitoring Chemical Aspects ofOcean Acidification [2014]). DICmeasurement using a TOC ana-lyzer represents a safe, accurateand fast alternative method.
AcknowledgementsThe author thanks Matthias Birkicht and
Dieter Peterke (ZMT) for valuable data.
Read for you in GIT Labor-Fachzeitschrift 6/17

APPLICATION
10 SHIMADZU NEWS 3/2017
Filter time constant and sampling frequency improve the signal-to-noise ratio
Fast GC without a handbrake
T he fast response time ofdetectors used in gas chro-matography is often charac-
terized solely by the maximumsampling frequency. However, thelatest techniques using short-dura-tion signals require noise filtering(filter time constant) to be adjust-ed as well. If this parameter re -mains unchanged, the responsetime of the detector is too slowand the mapped signal is falsified.
The ratio between the signaland the noise is decisive
In analytical applications, the ratiobetween the signal height and thebaseline noise generally deter-mines the achievable limit of de -tection. Developments in gaschromatography thus lead to eversharper and thus higher signals.The sharpness of a signal is ex -pressed by the full width at halfmaximum (FWHM) or the signalbase width (W; see figure 1). Thesharper the expected signals are,the faster the response time of thedetector must be set up in order
to correctly map the signals in thechromatogram.
In this case, the first step is toadjust the sampling frequency.Shimadzu recommends calculatingwith around 25 measuring pointsper signal so that even asymmetri-cal signals (e.g. due to tailing) areshown correctly. A sampling fre-quency of 10 Hz is sufficient forsignal base widths > 2.5 s. Thebaseline measured by the detectoris thus an extrapolation overmeasuring points that were allsampled at 0.1 s. Since unneces-sarily high sampling frequenciesincrease baseline noise, the fre-quency should be suitable for thesignal widths but not unduly high.
Fast GC techniques can achievesignal base widths of < 1 s. If thesignal width approaches one sec-ond, the sampling frequency mustbe increased to 25 Hz. However, a second parameter also becomesessential: the noise reduction.
Electronic noise filters in a gaschromatograph reduce detectornoise. In principle, high-frequencycomponents in the baseline areattenuated by the filter in such away that the measured signalsshould remain unaffected as far aspossible. If the signals becomesharper, noise filtering has to beadjusted via the filter time con-stant. However, this has the disad-vantage that reducing the filtertime constant also lowers noisereduction and thus baseline noiseincreases. Nevertheless, all theeffort is worthwhile if sharp sig-nals are mapped correctly, thusyielding a better signal-to-noiseratio.
When signals disappear due to noise reduction
The Nexis GC-2030 allows a max-imum sampling frequency of 500Hz for each detector in combina-tion with a minimum filter timeconstant of 2 ms. Theoretically,
Figure 2: Decrease in the signal height for incremental increases of the filter time
constant from 2 to 200 ms. The measured signal heights for the predefined signals
with FWHMs of 0.1 - 0.5 s are depicted. The sampling frequency was kept constant
at 500 Hz.
Figure 1: Definition of full width at half maximum (FWHM) and base width (w) of a signal
Minutes
02,5005,0007,500
10,00012,50015,00017,50020,00022,50025,00027,50030,000
0.97 0.98 0.99 1.00 1.01 1.02 1.03
uV
Signal height [µV]
0
5,000
10,000
15,000
20,000
25,000
30,000
35,000
2 ms 4 ms 10 ms 20 ms 50 ms 100 ms 200 ms

11SHIMADZU NEWS 3/2017
APPLICATION
this allows correct mapping of sig-nals with a base width of 0.05 s,which is more than enough for allcurrent techniques.
To determine how importantadjustment of the filter time con-stant is, signals were generatedwith five different FWHMs usingthe integrated peak generator ofthe Nexis GC-2030. These weresubjected to noise filtering justlike any normally measured sig-nal. With respect to effects due tothe sampling frequency, it must bepointed out that the artificial sig-nals are highly symmetrical andcan thus be mapped reasonablywell even at low sampling fre-quencies.
The influence of the filter timeconstant and sampling frequencyon five signals generated withFWHMs of 0.1, 0.2, 0.3, 0.4, and0.5 s was determined. The result-ing base widths are 0.39, 0.76,1.09, 1.59, and 2.04 s. All five signals have a fixed height of30,000 µV. Any deviations fromthis value are mapping errors aris-ing from the response behavior ofprocessing the detector signals.
In the first series of measure-ments, these five signals weremeasured at a constant samplingfrequency of 500 Hz using differ-ent filter time constants. Figure 2shows the effect on the signalheight. All signals remain virtuallyunaffected up to a filter time con-stant of 10 ms. As the filter timeconstant increases, sharper signals
become increasingly smaller. From100 ms upwards, signals with aFWHM of 0.5 s are then alsoaffected by the noise filter anddecrease in size. For a filter timeconstant of 200 ms, only 10% ofthe actual signal height of 30,000µV remain for the sharpest signal(FWHM of 0.1 s).
Figure 3 shows how the increasingfilter time constants (10, 50,100 ms) affect the shape of the sig-nals. For a filter time constantgreater than 10 ms, the signalwidth is affected if noise filteringis increased even further. For a fil-ter time constant of 200 ms, theFWHM of the signal increases bya factor of ten from the original0.1 s to 0.96 s; the base width ofthe signal increases even more
strongly from the original 0.39 sto 5.43 s.
Smaller effects on changing the sampling frequency
So what effect does changing thesampling frequency have underthe same conditions? Once again,five signals are generated withFWHMs of 0.1, 0.2, 0.3, 0.4, and0.5 s. In this case, the filter timeconstant is kept constant at 2 ms,whereas the sampling frequency is reduced incrementally from 500 Hz to 10 Hz. The result (fig-ure 4) shows a less drastic effectthan that of changing the filtertime constant (figure 2). Up to 50 Hz, only a slight decrease inthe signal height is observed forthe signal with a FWHM of 0.1 s.
Decreasing the sampling frequen-cy even further decreases theheight of the signal from the origi-nal 30,000 µV to about 20,000 µV.
Summary
An experiment that can be carriedout on any Nexis GC-2030 showsthat when using the latest chro-matography techniques it is notenough to adjust only the sam-pling frequency to the resultingsignal sharpnesses. On the con-trary, time constants as well as thesampling frequency leads to thebest signal-to-noise ratio, whichultimately defines the achievablelimit of detection and thus allowsfast GC – without a handbrake.
LiteratureJ. V. Hinshaw, LCGC (2002), volume 15,
page 152.
Figure 4: Decrease in the signal height with decreasing sampling frequency from 500 Hz
to 10 Hz for the predefined signals with FWHMs of 0.1-0.5 s. The filter time constant was
kept constant at 2 ms.
Minutes
0
5,000
10,000
15,000
20,000
25,000
30,000
0.25 0.50 0.75 1.00 1.25
uVa)
Figure 3: In (a), triplets of the five signals with FWHMs of 0.1 to 0.5 s are shown. The colors within a triplet represent the different filter time constants (green 10 ms, blue 50 ms,
red 100 ms). In general, increasing the filter time constant leads to broadening and loss of signal height, which is exhibited particularly clearly by the sharpest signal with a FWHM
of 0.1 s (see zoom in b).
b)
Minutes
0
5,000
10,000
15,000
20,000
25,000
30,000
0.250 0.255 0.260 0.265 0.270 0.275
uV
Signal height [µV]
20,000
21,000
22,000
23,000
24,000
25,000
26,000
27,000
28,000
29,000
30,000
500 Hz 250 Hz 125 Hz 100 Hz 50 Hz 25 Hz 10 Hz

PRODUCTS
12 SHIMADZU NEWS 3/2017
Optimal handling of analyticaldata in regulated laboratoriesHow to deal with stricter requirements of cGMP
T he increase in digital evalua-tion and approval of meas-ured data in recent years has
led to data integrity – i.e. the un -alterability of data - becomingmore and more important. Elec -tronic data processing enables datato be modified intentionally orunintentionally, e.g. changes toevaluations or substitution ofdatasets. For example, if these dataare used for the release of medici-nal products or active substances,such manipulation could lead toserious consequences for thehealth of the patient. Regulatoryauditors therefore pay particularattention to data integrity meas-ures during audits.
Controls by the US FDA (Foodand Drug Administration) haverevealed a number of instances in
which companies could not de -monstrate compliance regardingdata integrity, prompting the FDA to publish a guideline in
April 2016. “Data Integrity andCompliance with cGMP” empha-sizes that the FDA regards dataintegrity as a key quality topic.
As a result, numerous measureshave been published in recentyears, e.g. “warning letters”. Theydiscuss the most common prob-lems regarding Guideline 21 CFR211 & 212 as well as the principlesof electronic record keepingaccording to Guideline 21 CFRPart 11. In other cases, importbans were imposed as a conse-quence of contraventions.
The Guideline also includes pre-cise explanations of commonlyused terms such as data integrity,audit trails and metadata. Evenwhere meeting of requirements isnot specified in detail, the topicsthe FDA regards as most impor-tant are discussed in 18 questionsand answers.
Data integrity is not a new con-cept; it is an integral part ofcGMP requirements such as:
• § 211.68 requiring that backupdata is exact and complete, andsecure from alteration, inadver-tent erasures or loss
• § 212.110(b) requiring that databe stored to prevent deteriora-tion or loss
Figure 1: Schematic workflow for acquisition and processing of data using the example of an HPLC analysis
Shimadzu Laboratory World in Duisburg
Sample preparation
Login Logout
Check StorageApproval
Checker Approver
(Print-out)
Execution of theanalyses
Set up of analytical conditions
Instrument parameters
Peak integrationparameters
Batchsettings
Basic supposition:Security settings, such as user accounts and passwords, settings of the audit trails and appropriate user privileges that prevent deletion of data have already been set up in accordance with the applicable regulations
Generation and storage ofanalytical data
Chromatogram reports

PRODUCTS
SHIMADZU NEWS 3/2017 13
• § 211.100 and § 211.160 requiringthat certain activities be docu-mented at the time of perform-ance and that laboratory con-trols be scientifically sound
• § 211.180 requiring true copiesor other accurate reproductionsof the original records; and
• § 211.188, § 211.194, and § 212.60(g) requiring completeinformation, complete dataderived from all tests, completerecord of all data and completerecords of all tests performed.[1]
ALCOA – good data handling practice
The “ALCOA” principle appliesto good data handling practice.The acronym stands for Accurate,Legible, Contemporaneous, Ori -ginal and Attributable (to therespective person). This principlecan be applied to the entire lifecycle of the data.
• “Accurate” refers, for example,to the validation of instrumentsto prove that the measured dataare recorded correctly, the dataare approved by a laboratorymanager using the four-eyesprinciple and that the softwareand electronic systems are vali-dated to verify that data are alsostored correctly.
• “Legible and permanent” prima-rily concerns the security meas-ures to protect data againstchange. Handwritten data mustbe recorded legibly in indelibleink, and corrections to the datamust be carried out in an appro-priate manner. Furthermore, alldata must have a change historyby means of an audit trail.
• “Contemporaneous” refers toacquisition of the data. Thismust be carried out immediatelyafter the respective process, forexample, a measurement in thelaboratory, and must not be predated or backdated. In elec-tronic systems, it must not bepossible to change the time orthe date, and every change to the dataset must be savedimmediately after it has beenentered.
• Since the “original” data mustalso be available, the respectiveset of raw data from every meas-urement must be kept andremain archived, and anychanges must be traceable.
• The last item, “attributable tothe respective person”, meansthat all the previously men-tioned processes must be attrib-utable to the person who carried
it out. Anyone who records orprocesses data must identifythemselves with a dated personalsignature. If electronic systemsare used, this means that a per-sonalized access as well as elec-tronic signature control areabsolutely essential.
For further information, pleaserefer to “Data Integrity andCompliance with cGMP”. [1]
Instrument manufacturers support the integrity of measured data
Due to the many contraventionsin recent years, FDA auditorsmeanwhile apply a “guilty untilproven innocent” approach duringtheir inspections, meaning thatthey assume non-compliance withthe regulations. As a consequenceof this change compared to previ-ous audits, end-to-end proof ofthe integrity of measured data hasbecome essential in a controlledenvironment. [2]
Suppliers of chromatography datasystems, i.e. software for acquisi-tion, processing, administrationand storage of data arising fromanalytical measurements have alsoadapted to these changed circum-stances by implementing dedicatedfunctions for data integrity tosupport companies operating in acontrolled environment withregard to data integrity and FDAcompliance. �
Figure 3: Problems associated with printed analysis reports
Sample preparation
Login Logout
Logout
Logout
Login
Login
Check
Approval
Approver
Checker
Execution of the analyses
Set up of analytical conditions
Linking of data and theReport Set
Electronic signature
Electronic signature
Components of the Report Set
Batch reports
Operationallog reports
Other reports
Chromatogramreports
Report SetInstrument parameters
Peak integration parameters
Batchsettings
Further components (Other reports) of the Report Set:• Instrument parameters• Data evaluation parameters• Calibration curves
Generation and storage of analytical data
Controlled environment inside the LabSolution Database
Problem 1 associated with printing outPrinting, summing, checking, and archiving takes considerable time
Problem 2 associated with printing outAn increasing number of binders is required to archive the hard copies, which may cause problems with available space
Problem 3 associated with printing outAnalysis results can be substituted or destroyed
Substitution Destruction
Figure 2: Compliant data integrity using the LabSolutions DB/CS Report Set
PRODUCTS
14 SHIMADZU NEWS 3/2017
raphy parameters or evaluation ofanalytical data, and making themeasily recognizable as manualsteps. By making every manualchange visible, any inadmissibleprocesses, such as modification orsubstitution of data, can be easilyidentified.
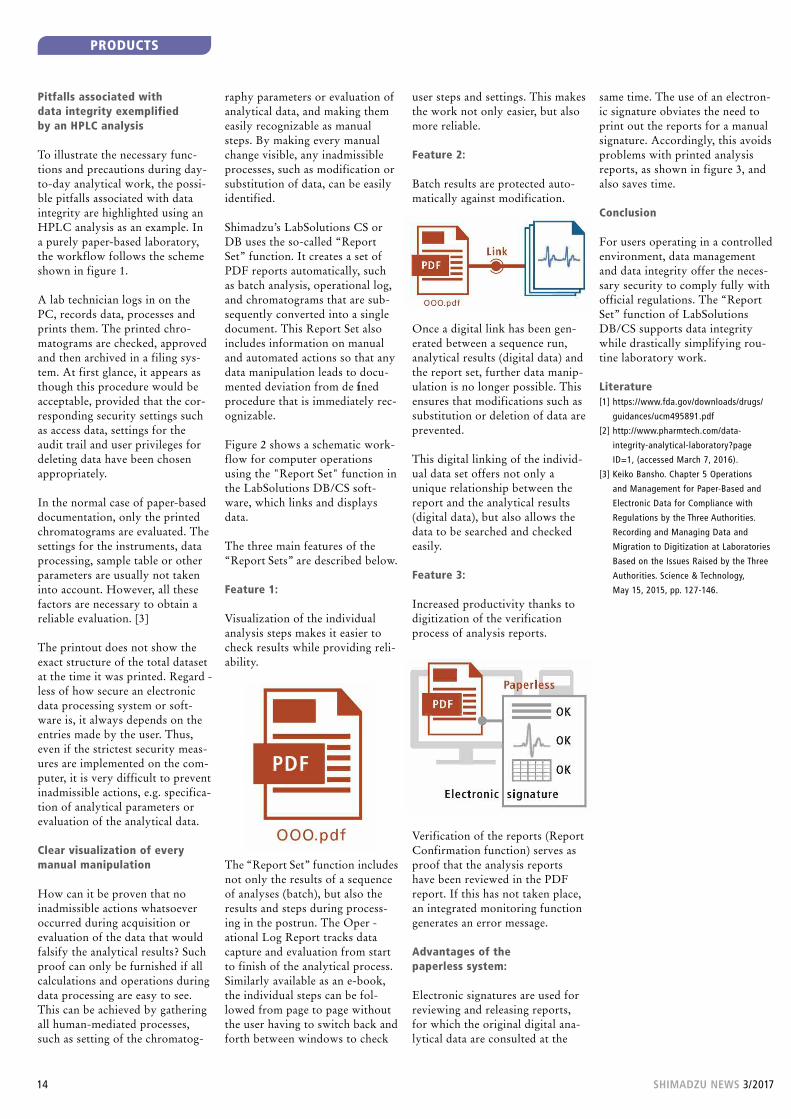
Shimadzu’s LabSolutions CS orDB uses the so-called “ReportSet” function. It creates a set ofPDF reports automatically, suchas batch analysis, operational log,and chromatograms that are sub-sequently converted into a singledocument. This Report Set alsoincludes information on manualand automated actions so that anydata manipulation leads to docu-mented deviation from de finedprocedure that is immediately rec-ognizable.
Figure 2 shows a schematic work-flow for computer operationsusing the "Report Set" function inthe LabSolutions DB/CS soft-ware, which links and displaysdata.
The three main features of the“Report Sets” are described below.
Feature 1:
Visualization of the individualanalysis steps makes it easier tocheck results while providing reli-ability.
The “Report Set” function includesnot only the results of a sequenceof analyses (batch), but also theresults and steps during process-ing in the postrun. The Oper -ational Log Report tracks datacapture and evaluation from startto finish of the analytical process.Similarly available as an e-book,the individual steps can be fol-lowed from page to page withoutthe user having to switch back andforth between windows to check
Pitfalls associated with data integrity exemplified by an HPLC analysis
To illustrate the necessary func-tions and precautions during day-to-day analytical work, the possi-ble pitfalls associated with dataintegrity are highlighted using anHPLC analysis as an example. Ina purely paper-based laboratory,the workflow follows the schemeshown in figure 1.
A lab technician logs in on thePC, records data, processes andprints them. The printed chro-matograms are checked, approvedand then archived in a filing sys-tem. At first glance, it appears asthough this procedure would beacceptable, provided that the cor-responding security settings suchas access data, settings for theaudit trail and user privileges fordeleting data have been chosenappropriately.
In the normal case of paper-baseddocumentation, only the printedchromatograms are evaluated. Thesettings for the instruments, dataprocessing, sample table or otherparameters are usually not takeninto account. However, all thesefactors are necessary to obtain areliable evaluation. [3]
The printout does not show theexact structure of the total datasetat the time it was printed. Regard -less of how secure an electronicdata processing system or soft-ware is, it always depends on theentries made by the user. Thus,even if the strictest security meas-ures are implemented on the com-puter, it is very difficult to preventinadmissible actions, e.g. specifica-tion of analytical parameters orevaluation of the analytical data.
Clear visualization of everymanual manipulation
How can it be proven that noinadmissible actions whatsoeveroccurred during acquisition orevaluation of the data that wouldfalsify the analytical results? Suchproof can only be furnished if allcalculations and operations duringdata processing are easy to see.This can be achieved by gatheringall human-mediated processes,such as setting of the chromatog-
same time. The use of an electron-ic signature obviates the need toprint out the reports for a manualsignature. Accordingly, this avoidsproblems with printed analysisreports, as shown in figure 3, andalso saves time.
Conclusion
For users operating in a controlledenvironment, data managementand data integrity offer the neces-sary security to comply fully withofficial regulations. The “ReportSet” function of LabSolutionsDB/CS supports data integritywhile drastically simplifying rou-tine laboratory work.
Literature[1] https://www.fda.gov/downloads/drugs/
guidances/ucm495891.pdf
[2] http://www.pharmtech.com/data-
integrity-analytical-laboratory?page
ID=1, (accessed March 7, 2016).
[3] Keiko Bansho. Chapter 5 Operations
and Management for Paper-Based and
Electronic Data for Compliance with
Regulations by the Three Authorities.
Recording and Managing Data and
Migration to Digitization at Laboratories
Based on the Issues Raised by the Three
Authorities. Science & Technology,
May 15, 2015, pp. 127-146.
user steps and settings. This makesthe work not only easier, but alsomore reliable.
Feature 2:
Batch results are protected auto-matically against modification.
Once a digital link has been gen-erated between a sequence run,analytical results (digital data) andthe report set, further data manip-ulation is no longer possible. Thisensures that modifications such assubstitution or deletion of data areprevented.
This digital linking of the individ-ual data set offers not only aunique relationship between thereport and the analytical results(digital data), but also allows thedata to be searched and checkedeasily.
Feature 3:
Increased productivity thanks todigitization of the verificationprocess of analysis reports.
Verification of the reports (ReportConfirmation function) serves asproof that the analysis reportshave been reviewed in the PDFreport. If this has not taken place,an integrated monitoring functiongenerates an error message.
Advantages of the paperless system:
Electronic signatures are used forreviewing and releasing reports,for which the original digital ana-lytical data are consulted at the
LATEST NEWS
15SHIMADZU NEWS 3/2017
S ince its launch at the 2016Analytica trade exhibition inMunich, CLAM-2000 has
been a whirlwind during tradeevents such as MSACL shows andEuroMedLab, and revolutionizedthe world of clinical analysis al -lowing easier access to the use ofLC-MS/MS.
The CLAM-2000 (Clinical Labo -ratory Automated sample prepa-ration Module) automates the pre-treatment of blood or other bio-logical samples before LC-MSanalysis. It has been designed forpharmaceutical departments, med-ical departments or biologicalanalysis laboratories dealing withrisk of human error in samplepreparation or infection risk.
In September 2016, CLAM-2000made its official debut in a privatesector laboratory in Cologne,Ger many. After one year of ser -vice in different places acrossEurope, it is time to share theexperience how CLAM-2000 isbreaking the wall between theworld of clinical analyzers and the associated technology of LC-MS/MS liquid chromatographycoupled to tandem mass spectro -metry.
the up to 1,000 high-throughputsequences running each day donot have to be interrupted. Dr. Kröner describes the use oftheir own in-house method as thesystem’s main benefit. “We canput all methods of other systemson the CLAM system. Changingparameters of a method is no prob -lem as we can do all programmingon our own.”
For the clinical research depart-ment at University Hospital inGöttingen, Germany, CLAM-2000is the ideal tool for measuringsamples even if the staff lacks anyspecific chromatographic andmass-spec experience.
CLAM-2000 is controlled viaVPN (Virtual Private Network)which enables method develop-ment also from other places. Dr.Frank Streit, Department Head,says that “accuracy and precisionfor the determination of the ana-lytes is better than using an LC-MS system and offline samplepreparation.”
Prof. Paolo Brambilla, Head ofClinical Chemistry Laboratory,DESIO hospital, Milan, Italy, alsoappreciates the higher accuracyespecially at lower concentrations,and the increased sensitivity.According to him, CLAM-2000avoids a lot of interferences. Hesays: “The system is exactly whatwe need in clinical analysis.”
The brief experts’ reviews onCLAM-2000’s benefits are avail-able in full length through the QR code.
dation in clinical laboratory envi-ronments, toxicology analysis, and private sector laboratories.Cutting-edge scientists and re -searchers provide insights intotheir daily routine applicationswith CLAM-2000.
Prof. Franck Saint-Marcoux, FullProfessor of Toxicology at Uni -versity of Limoges, France, de -scribes CLAM-2000’s automatedsample pretreatment as the newrevolution. Its main advantage isthe increased speed of the work-flow: it can be fully programmed,which reduces the need of expla-nation towards the staff or thetechnicians. “The global capabilityof LC-MS/MS is no longer a prob -lem,” he says.
“CLAM-2000 is a kind of fire &forget system: it does all the workfor you,” explains Dr. LarsKröner, department of toxicologyof the Cologne, Germany basedDr. Wisplinghoff laboratory. Thecompany is specialized on fullservice of clinical toxicology andclinical analysis for different dis-eases. The lab works for over 40hospitals, and applies CLAM-2000particularly for the 50 - 100 emer-gency samples per day. This way,
Shimadzu’s Clinical Bio Divisionhas a long-standing history inproducing clinical analyzers mar-keted as OEM equipment byother well-known suppliers, suchas Werfen Group, Sekisui andAbbott. At the same time, theMass Spectrometry Division fromShimadzu made an importantbreakthrough in the LC-MS/MSmarket by introducing Ultra-FastTechnologies, sensitivity androbustness for highly demandingapplications like therapeutic drugmonitoring in whole blood orplasma. The benefit of couplingboth divisions’ technologies tosimplify access to LC-MS/MS inthe clinical field became obviousin order to fill the gap, becausethe main restriction for the pene-tration of mass spectrometry isthe sample preparation prior toLC-MS analysis.
Cutting-edge scientists’ andresearchers’ insights
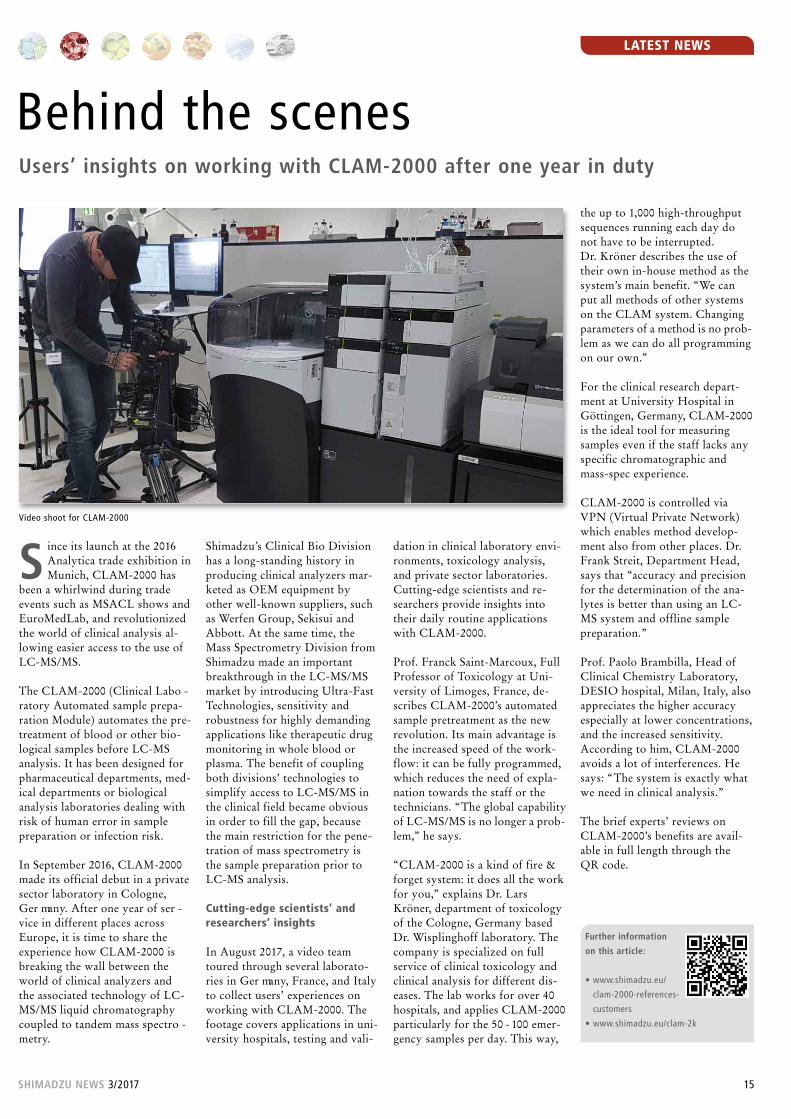
In August 2017, a video teamtoured through several laborato-ries in Ger many, France, and Italyto collect users’ experiences onworking with CLAM-2000. Thefootage covers applications in uni-versity hospitals, testing and vali-
Behind the scenesUsers’ insights on working with CLAM-2000 after one year in duty
Further information
on this article:
• www.shimadzu.eu/
clam-2000-references-
customers
• www.shimadzu.eu/clam-2k
Video shoot for CLAM-2000

APPLICATION
16 SHIMADZU NEWS 3/2017
organisms, mycotoxin-formingmold fungi are distributed world-wide. The toxins, which are con-tained in certain higher fungi (e.g.amanita), are not included among
O utside it is dark, wet, andcold, indoors warm andcozy, with coffee or tea
and homemade biscuits – quitetraditional. As much as cookieswarm the soul, within their ingre-dients may lurk invisible dangers:mold fungus toxins, also calledmycotoxins. In addition to grainproducts, these ingredients in -clude nuts and almonds, dairyproducts, spices, fruit, and cocoa.For example, aflatoxins are fre-quently found on fat-rich veg-etable products such as nuts, al -monds, and corn, while ochratox-in A, fumonisins, deoxynivalenol,and zearalenone can often be de -tected in cereals and also in corn.
Mycotoxins represent, besidesantibiotics, the second largestgroup of active ingredients syn-thesized by microorganisms. Aswell as antibiotic-forming micro -
But what exactly are mycotoxins?
These secondary metabolic prod-ucts of mold have different chemi-cal structures; they can neither beseen nor smelled. They are largelyheat-stable and are therefore notdestroyed during frying, cooking,or baking. They can lead to differ-ent diseases in humans, the so-called mycotoxicoses – in contrastto mycoses, i.e. diseases triggeredby fungi themselves. In addition,mycotoxins promote the develop-ment of cancer, damage of the kid-neys and liver, affect the immunesystem, or cause diarrhea andvomiting.
Joy and fear of Christmas baking ...Determination of mycotoxins in bakery products using LC-MS
Figure 1: Shimadzu Nexera X2 with LCMS-8060

17SHIMADZU NEWS 3/2017
APPLICATION
the mycotoxins in the narrowersense. [1]
Contamination and transfer of mycotoxins
Mycotoxins are usually producedwhen a fungus finds particularlyfavorable growth conditions, suchas moist, warm weather condi-tions. A distinction is made be -tween primary and secondarycontamination. Primary contami-nation is the direct infestation ofthe plant on the field with so-called field fungi (Fusarium). This
leads to plant diseases and to alower harvest yield. Unfavor ablestorage can also lead to mold fun -gi, the so called storage fungi (As -pergillus and Penicillium species).
Secondary contamination, on theother hand, is referred to whenthe already finished food becomesmoldy due to being stored toolong or incorrectly. This is easilyrecognizable by the well-knownmold growth.
Mycotoxins can also enter ourfood products by transfer (carry-
over). Via their feed, productivelivestock are contaminated withmycotoxins, and from there thesecan reach (partly in metabolizedform) food products obtainedfrom animals, such as meat, eggsand dairy products.
Puzzling turkey and trout death
The year 1960 was of central im -portance for mycotoxin research.That year, 100,000 young turkeysin England and one million youngtrouts in the United States perished
from the mysterious “Turkey XDisease”. The feeding of the re -sidues of peanut pressing, origi-nating from the processing ofmoldy peanuts, could be identi-fied as a trigger for this mass mor-tality. The aspergillus flavus,which had grown, had formed sofar unknown mycotoxins in highconcentrations, the so-called Afla -toxins. [2] �
Table 1: Measurement results (in µg/kg) of all samples tested – results highlighted in red exceed the maximum permissible quantities.
Concentration
19 20
Area
0.000e04.000e58.000e51.200e61.600e62.000e62.400e62.800e63.200e63.600e64.000e64.400e64.800e65.200e65.600e66.000e66.400e66.800e67.200e67.600e68.000e6
0 1 2 3 4 5 6 7 8 9 10 11 12 13 14 15 16 17 18
Concentration
19 20
Area
0.000e0
4.000e5
8.000e5
1.000e6
1.400e6
1.800e6
2.000e6
2.400e6
2.800e6
4.400e6
3.200e6
3.600e6
4.000e6
4.400e6
0 1 2 3 4 5 6 7 8 9 10 11 12 13 14 15 16 17 18
Concentration
19 20
Area
0.000e01.000e52.000e53.000e54.000e55.000e56.000e57.000e58.000e59.000e51.000e6
1.200e61.100e6
1.300e61.400e61.500e61.600e61.700e61.800e61.900e62.000e6
0 1 2 3 4 5 6 7 8 9 10 11 12 13 14 15 16 17 18
Concentration
19 20
Area
0.000e05.000e41.000e51.500e52.000e52.500e53.000e53.500e54.000e54.500e55.000e6
6.000e65.500e6
6.500e67.000e67.500e68.000e69.000e69.500e61.000e6
0 1 2 3 4 5 6 7 8 9 10 11 12 13 14 15 16 17 18
Aflatoxin B1
Aflatoxin G1
Aflatoxin B2
Aflatoxin G2
Figure 2: Calibration curves of aflatoxins B1 and B2 as well as G1 and G2, concentration range 0.1 µg / kg for B1 and G1 resp. 0.2 µg / kg for B2 and G2 – 20 µg / kg
Aflatoxin B1
Aflatoxin B2
Aflatoxin G1
Aflatoxin G2
Total Aflatoxins
Ochratoxin A
Fumosinin B1
Fumosinin B2
HT-2 Toxin
T-2 Toxin
Zearalenone
< LOQ
--
--
--
--
--
--
--
--
--
--
0.31
--
--
--
0.31
--
--
--
--
--
--
--
--
< LOQ
--
--
--
--
--
--
--
--
--
--
< LOQ
--
--
--
--
--
--
--
--
--
--
--
--
--
--
--
--
--
--
--
1.65
0.46
2.74
--
4.85
--
--
--
--
2.39
< LOQ
< LOQ
--
--
--
--
--
--
--
--
--
--
--
--
--
--
--
--
--
--
--
--
< LOQ
--
--
--
--
--
--
--
--
< LOQ
--
< LOQ
--
--
--
--
--
6.77
--
--
< LOQ
--
6.35
--
--
--
--
--
--
--
--
--
--
--
--
--
--
--
--
0.64
--
--
--
--
< LOQ
--
--
--
--
--
--
--
--
--
5.70
--
--
--
--
--
--
< LOQ
--
--
9.80
3.32
< LOQ
--
--
--
--
--
0.14
--
--
24.59
23.05
< LOQ
--
--
--
--
--
< LOQ
--
--
6.01
2.80
< LOQ
Sample 1almond
Sample 2almond
Sample 3walnut
Sample 4walnut
Sample 5peanut
Sample 6hazelnut
Sample 7cashew
Sample 8wheatflour
Sample 9wheatflour
Sample 10wheatflour
Sample 11wheatflour
Sample 12speltflour
Sample 13speltflour
Sample 14oat flakes
Sample 15oat flakes
Sample 16oat flakes

APPLICATION
18 SHIMADZU NEWS 3/2017
Good agricultural practice, good manufacturing practice,and limits
Since food and animal feed conta -minated with mycotoxins can nolonger be purified and thereforeshould not be used, it is importantto prevent fungal attack and thusmold in the first place by adheringto good agricultural and manufac-turing practices.
The final consum er should makesure that the food is stored in adry and cool location and that dis-colored nuts with an unpleasantsmell are not consumed. Cuttingoff the moldy areas of the affectedfood often does not help becausethe fungus has already spread outinvisibly.
In case of doubt, moldy goodsshould no longer be consumed.
0.0e0
2.0e4
4.0e4
6.0e4
8.0e4
1.0e5
1.2e5
Q 313.00 > 285.20 (+) 1.33e5
6.2 6.4 7.06.6 6.8
Aflatoxin B1
0.0e0
2.0e3
4.0e3
6.0e3
8.0e3
1.0e4
1.2e4
Q 315.00 > 287.10 (+) 1.31e4
6.0 6.2 6.86.4 6.6
Aflatoxin B2
0.0e0
1.0e4
2.0e4
3.0e4
4.0e4
5.0e4
6.0e4
Q 329.00 > 243.20 (+) 6.89e4
5.8 6.4 6.66.0 6.2
0.0e0
5.0e2
1.0e3
1.5e3
2.0e3
2.5e3
Q 331.00 > 245.10 (+) 2.59e3
5.2 5.4 6.05.6 5.8
Aflatoxin G1 Aflatoxin G2
0.0e0
2.0e2
4.0e2
6.0e2
8.0e2
1.0e3
1.1e3
1.4e3
Q 722.20 > 352.40 (+) 1.48e3
6.4 7.06.6 6.8
0.0e0
1.0e3
2.0e3
3.0e3
4.0e3
Q 706.30 > 336.30 (+) 4.64e3
6.8 7.47.0 7.2
Fumonisin B1 Fumonisin B2
0.0e0
2.5e2
5.0e2
7.5e2
1.0e3
1.3e3
1.5e3
1.8e3
Q 446.90> 345.05 (+) 1.90e3
6.8 7.4 7.67.0 7.2
0.0e0
0.5e2
1.0e3
1.5e3
2.0e3
Q 403.90 > 239.05 (+) 2.18e3
7.4 8.0 8.27.6 7.8
HT-2 Toxin Ochratoxin A
0.0e0
5.0e2
1.0e3
1.5e3
2.0e3
Q 484.10> 305.20 (+) 2.18e3
7.2 7.8 8.07.4 7.6
0.0e0
2.0e3
1.0e3
4.0e3
3.0e3
5.0e3
6.0e3
Q 317.10 > 131.05 (-) 6.00e3
7.4 8.0 8.27.6 7.8
ZearalenoneT-2 Toxin
Figure 3: Mycotoxins in a hazelnut sample
Minutes Minutes
1,000.000
900.000
800.000
700.000
600.000
500.000
400.000
300.000
200.000
100.000
06.75 7.00 6.75 7.00
Because of the risk of mycotoxins,the European Union and manyother countries have set limits. In the European Union, this isdone by regulations of the EUCommission setting the maximumlevels for certain contaminants infood products (Regulation [EC]no. 1881/2006 and supplements).[3] Aflatoxins in nuts, for exam-ple, are limited to a maximumcontent of 2 µg for aflatoxin B1per kg and 4 µg for the sum ofaflatoxins B and G per kg or 50 µg of zearalenone per kg inbread, pastry, and biscuits.
It is therefore desirable to be ableto determine as many of the my co -toxins to be controlled as possible,using only one analytical meth od,independent of concentrationrange and sample matrix. The anal -ysis of such multi-analytical sam-ples is facilitated by the increasinguse of liquid chromatography,coupled to a triple quadrupolemass spectrometer (LC-MS/MS).
Sensitive detection of mycotoxins by means of LC-MS
The following application exampleshows a process which allows al -
Figure 4: The figure shows MRM chromatograms for aflatoxin B1, one recorded with the
usual 2 fragment ions, and compared with a method with higher number (11) of fragment
ions which, despite this fact, have the same sensitivity.
most all relevant mycotoxins forbaking ingredients to be deter-mined with only one method. (In case of deoxynivalenol, a mod-ified extraction method must beperformed due to the polarity ofthe molecule.)
The sample preparation was car-ried out using a simple “catch-and-release” solid phase extraction(SPE) method.
5 g of the ground sample (nuts,almonds, flour, etc.) were mixedwith 20 mL of a water/acetonitrilemixture (50/50 v/v) and treated inan ultrasonic bath for 5 minutes.The sample was then shaken for30 minutes at room temperaturebefore a part of the supernatantwas further processed after cen-trifugation.
The supernatant was diluted withwater and, after appropriate con-ditioning of the solid phase car-tridge (ISOLUTE® Myco, Bio -tage, Cardiff, UK), transferred,washed and eluted with solvent.The eluate was completely evapo-rated and reconstituted with 300 µL of a 20 % acetonitrile/methanol + 0.1 % formic acidsolution. Before the sample is

19SHIMADZU NEWS 3/2017
APPLICATION
injected into the LC-MS/MS sys-tem, it is recommended to filter it through a filter vial (0.45 µmPTFE).
For the analysis of the extractedsamples, a Nexera X2 UHPLCsystem was used, coupled to anLCMS-8060 Triple QuadrupoleMass Spectrometer (bothShimadzu; figure 1, page 16).
The LC conditions used originat-ed from an already describedmethod. [4] A detailed descriptionof the method can be downloadedusing the QR code at the end ofthis article. In the case of thedescribed measurements, a MastroC18 chromatography column (150 x 2.1 mm, 3 µm, ShimadzuGLC Ltd.) was selected, which isable to produce excellent peak-shape due to its internal structure(figure 6), even in chelate-formingsubstances such as fumonisins.
Thanks to the described method,the limits required by the EU reg-ulation were easily met for allmycotoxins analyzed. Figure 2(page 17) shows the calibrationcurves of aflatoxins B1 and B2 aswell as G1 and G2 extracted fromground almonds.
Analysis of Real Samples
16 commercial samples of variousbaking ingredients (wheat flour,spelt flour, oat flakes, almond,hazelnut, peanut, walnut, andcashew nut) from various localshops were examined for commonmycotoxins. In some samples,mycotoxins could be detected(table 1, page 17; figure 3, page 18).In two samples the maximum lev-els recommended by the Euro peanUnion for individual mycotoxinswere even exceeded.
In addition, the so-called “MRMspectrum mode” was used for
Figure 5: Result of the library search, presented with LabSolutions Insight Screening software
analysis. Here, not only the frag-ments of the quantifier and thequalifiers are determined, but alsoa higher number (typically 6 -10)of MRM fragment ions. Using thisMRM spectrum mode, conven-tional MRM quantification iscombined with a high-qualityMRM product ion spectrum,which can be used in a librarysearch routine, thus increasing thespecificity and verification ofresults (figures 4 and 5).
Conclusion
The manufacturer is responsiblefor the safety of food products.They must ensure by internalchecks that the food productsproduced do not have any nega-tive impact on the health of theconsumer. [3] In order to ensurethis and to ensure the maximum
levels for certain contaminants,rapid and sensitive multi-analyti-cal methods are essential for foodanalysis. This begins with moni-toring the raw materials andshould help to make sure thatcontaminated food does not enterthe market in the first place.
Nevertheless, some, almost un -avoidable, contamination withmycotoxins could be demonstrat-ed in the examined samples. Twosamples even exceeded the appli-cable EU limits for individualmycotoxins.
In spite of these exceptions, every -body should enjoy baking andeating their own cookies. If exces-sive consumption threatens health,then it is most likely due to weightgain!
Literature[1] Berger, M., Rapp, M.: Bavarian State Office
for Health and Food Safety, Mykotoxine –
Giftige Stoffwechselprodukte von Schim -
melpilzen
[2] Weidenbörner, M.: Lebensmittel-Mykolo -
gie, Behr’s publisher, Hamburg, 1999
Figure 6: Structure of MastroTM column
[3] Federal Office for Consumer Protection
and Food Safety, Schimmelpilzgifte in
Lebensmitteln
http://www.bvl.bund.de/DE/01_Lebensmitt
el/03_Verbraucher/09_InfektionenIntoxika
tionen/09_Schimmelpilzgifte/lm_Pilzgifte_
Bakterien_node.html
[4] Baker et al, Shimadzu Application News
No. C138, LAAN-A-LM-E109.
Further information
on this article:
• Application note:
Multi-Residue Analysis
of 18 Regulated Myco-
toxins by LC/MS/MS

APPLICATION
20 SHIMADZU NEWS 1/2017
Small but powerful!Small columns accelerate conventional USP methods formedical use and save solvents, time, and money
I n order to increase productivi-ty and efficiency in laborato-ries, high-throughput analyses
have become very important inrecent years. Especially in thepharmaceutical industry, fastmethods are an advantage as thisindustry faces many challenges:cost-cutting measures in theEuropean and American health-care sector limit growth and profitpotential. The development ofnew drugs has become increasing-ly difficult and expensive. [1, 2]
Therefore, it is important to re -duce costs in other ways. Forexample, by performing analysesas quickly as possible and moreeconomically. This can beachieved in liquid chromatogra-phy (LC) by using a smaller col-umn. Using examples from theofficial pharmacopoeia of theUnited States Pharmacopeia
These USP application parame-ters, such as retention time, reso-lution, or plates, have certain tar-get values, which must be met byapplications modified from theoriginal method. Table 1 showsthe parameters, which may bechanged in reference to USP 621.Additionally, the permitted rangeswithin these LC parameters arelisted.
In the following, isocratic, con-ventional analyses of differentmedicines were modified whileobserving the permitted adapta-tion criteria of the USP. As shownin the example, the investigationsof acetaminophen, ibuprofen, and
GC parameters in order to obtainfaster methods.
Chapter USP <621> is focusedon chromatography
This chapter of the USP is of ageneral scope and contains infor-mation on all types of chromatog-raphy, such as gas, thin-layer,paper, and liquid chromatography.The principles of chromatography,including the basics as well as theequipment, and procedures usedfor the analyses are listed here. In addition, all important parame-ters which are necessary whenanalyzing a chromatogram areexplained.
Table 1: Permitted range of changes of the LC parameters in accordance with USP <621>
Table 2: Instruments and parameters used
(USP), the possibilities wereinvestigated. The pharmacopoeiacontains general chapters on testsas well as individual monographs.A monograph consists of tests onactive ingredients and their speci-fications.
In particular, the chapter “Chro -matography” [3] (USP 621) isparamount, since the pharmaco -poeia has been adapted for the useof smaller column dimensions andnow allows, to a certain extent,the modification of HPLC and
Minutes
mAU
0.0 2.5 5.0 7.5
0
5
10
15
20220 nm, 4 nm
1
Figure 1a: Chromatogram of acetaminophen (0.01 mg/mL) obtained through the original
USP method. Column: (a) Shim-pack GIS C18 (250 x 4.0 mm, 10 µm).
Figure 1b: Chromatogram of acetaminophen (0.01 mg/mL) obtained through the accelerated
USP method. Column: (b) Shim-pack GIS C18 (100 x 3.0 mm, 3 µm).
Minutes
mAU
0.0 1.0 2.0 3.0 4.0
0
5
15
10
25
20
30 220 nm, 4 nm
1
*F2 = F1 x [(dc22 x dp1)/(dc1
2 x dp2)] · F1 and F2 are the flow rates of the original and
the modified method; dc1 and dc2 are the column diameters according to these methods;
dc1 and dc2 are the particle size.
Particle size (L/dp)
Column length (L)
Columns ID (dc)
Flow rate
Injection volume
Column temperature
Constant L/dp ratio or number of theoretical plates:
- 25 to + 50 %
Any, as long as the linear speed
remains constant
Combination* of dp and dc: ± 50 %
Can be varied, but must match precision
and detection limits
± 10 °C
Method
Instrument
Detection
Oven temperature
Acetaminophen, Glibenclamide
LC-2040C 3D (Shimadzu)
PDA: D2 at 190 - 350 nm
40 °C
Ibuprofen
Nexera X2 (Shimadzu)
SPD-M30A at 254 nm
40 °C
Shimadzu Nexera X2 SPD-M30A

APPLICATION
21SHIMADZU NEWS 3/2017
glibenclamide could be carried outfaster than described in the origi-nal monograph.
Advantages of shorter analysistimes – achieved with smallercolumn dimensions
When replacing standard columns(250 or 150 x 4.6 mm) with small-er equivalents (e.g. 100 x 3 mm)packed with 2 - 3 µm instead of 5 µm particle sizes, different ef -fects occur: the efficiency of theseparation performance increases,resulting in narrower signals, andthe analytes elute faster from thecolumn. At the same time, theflow rate must be reduced, other-wise the pressure increase in thesystem would be too high. Thisprovides two major improve-ments: a much shorter analysistime, which results in a highersample throughput and a higherworkload of the device, as well asa lower consumption of solvents.
With the saving of time and sol-vents, the down-scaling offers twoadvantages, which in turn greatlyreduce expenses.
Adaptation of USP methods in accordance with the guidelines
The permitted ranges withinwhich the analytical conditionsmay be modified can be found inUSP chapter <621> Chromato -graphy. By changing the analyticalconditions in accordance with theguidelines, the analysis time canbe significantly shortened. Here, a shorter column with a smallerinner diameter was selected andthe flow rate was correspondinglyreduced in order to maintain thelinear velocity. In order to main-tain the resolution of the separa-tion, the length and the particlesize of the column may be modi-fied as long as the ratio of the col-umn length (L) to the particle size
Figure 2a: Chromatogram of ibuprofen (peak 1) (12 mg/mL) obtained through the
original USP method. Column: (a) Shim-pack GIST C18 (250 x 4.6 mm, 5 µm).
Peak 2: vale-rophenone (0.35 mg/mL), peak 3: 4 isobutylacetophenone (0.012 mg/mL).
Minutes
mAU
0.0 5.0 10.0 15.0
0
50
100
150
200
250 254 nm, 4 nm 1 2
3
Minutes
mAU
0.0 1.0 2.0 3.0 4.0
0
100
200
300254 nm, 4 nm 1 2
3
Figure 2b: Chromatogram of ibuprofen (peak 1) (12 mg/mL) obtained through the
accelerated USP method. Column: (b) Shim-pack GIST C18 (100 x 2.1 mm, 2 µm).
Peak 2: Valerophenone (0.35 mg/mL), peak 3: 4 isobutylacetophenone (0.012 mg/mL).
Figure 3a: Chromatogram of glibenclamide (peak 1) (0.44 mg/mL) obtained through
the original USP method. Column: (a) Shim-pack GIST C8 (250 x 4.6 mm, 5 µm).
Peak 2: progesterone (0.2 mg/mL).
(dp) remains within the specifiedrange (permissible range: - 25 %to + 50 %).
Reduction of analysis time
Various medicines, which can beidentified by LC methods de -scribed in the USP, have been test-ed. The original methods weremodified by using smaller col -umns and lower flow rates accord-ing to USP guidelines. All analy-ses were measured under isocraticconditions.
Used medicines
To demonstrate how much fasterthis new approach is, compared tothe conventional methods of thepharmacopoeia, three differentmedicine analyses were chosen:
• Acetaminophen, better knownas paracetamol, is a medicationto treat fever and pain. [4]
Minutes
mAU
0.0 2.5 5.0 7.5
0
100
200
300
400
600
500
220 nm, 4 nm
1
2
• Ibuprofen is a non-steroidalanti-inflammatory drug. Thedrug is used to relieve fever,inflammation, and pain. [5]
• Glibenclamide acts as an antidia-betic agent. The active substancebelongs chemically to the groupof the sulphonylureas. The drugincreases insulin release from thepancreas in order to lower bloodsugar. [6] �
Minutes
mAU
0.0 1.0 2.0 3.0 4.0
0
100
200
300
220 nm, 4 nm 1
2
Figure 3b: Chromatogram of glibenclamide (peak 1) (0.44 mg/mL) obtained through
the accelerated USP method. Column: (b) Shim-pack GIST C8 (100 x 2.1 mm, 2 µm).
Peak 2: progesterone (0.2 mg/mL).

APPLICATION
22 SHIMADZU NEWS 3/2017
tR fast method
tR original method
Time savingFlow rate fast method
Flow rate original method
Eluent saving
0.7 min
3.1 min
77 %0.5 mL/min
1.5 mL/min
67 %
1.6 min
4.8 min
67 %0.6 mL/min
2.0 mL/min
70 %
1.9 min
4.9 min
61 %0.5 mL/min
2.0 mL/min
75 %
Acetaminophen Ibuprofen Glibenclamide
Table 4: Retention times and flow rates of the accelerated, as well as the original USP methods including calculated savings
Measurement parameters and methods
The measurement parameters aswell as the methods are shown inTables 2 and 3.
Results
The results are shown in figures 1 - 6 and in table 4. These indicateshorter retention times. The origi-nal USP methods have been great-ly accelerated by changing thelength, the internal diameter, andthe particle size of the col umns.The flow rate was adjusted tokeep the linear velocity alwaysconstant. The retention times werethus shortened, resulting in timesavings of 77 % for acetamino-phen, 67 % in the analysis ofibuprofen and 61 % for gliben-clamide. The solvent consumptionof the three analyses was also sig-nificantly reduced: 67 % for acet-aminophen, 70 % for ibuprofen,and 75 % for glibenclamide.
Conclusion
The USP methods for acetamino-phen, ibuprofen, and gliben-clamide have been significantlyimproved by using smaller col -umns compared to the originalUSP methods. All analysis timesare shorter, and less solvents areconsumed. As a result, the costsper analysis are significantlyreduced. The method transferfrom larger columns to smallcolumns offers a lot of advantagesaltogether, hence the headline:small but powerful!
Literature[1] Gehrke, von Haaren-Giebel,
Branchenanalyse Pharmaindustrie, Study
305, Dezember 2015.
[2] Dohrmann, M., Biecheler, P., Hosseini,
M., Nyctelius, H. (2012): Pharma’s fight for
profit-ability. Lifecycle-based operating
models.
[3] United States Pharmacopeia (USP) 39,
<621> Chromatography, August 2016.
[4] Anderson B.J. Paracetamol (Acetamino -
phen): mechanisms of action. Paediatr
Anaesth, 2008, 18(10), 915-21.
[5] Melzer, M.: Ibuprofen: Wirkung,
Anwendung, Nebenwirkungen.
Apotheken Umschau 2017.
[6] Davidson J.A., Scheen A.J.,
Howlett H.C. Tolerability profile
of metformin/glibenclamide
combination tablets (Glucovance):
a new treatment for the manage-
ment of type 2 diabetes mellitus.
Drug Saf, 2004, 27(15), 1205-16.
Shimadzu LC-2040C 3D
Column
Mobile phase
Flow rate
Injection volumes
Concentrations
Shim-pack GIS C18 (250 x 4 mm, 10 µm)
Shim-pack GIS C18 (100 x 3 mm, 3 µm)
A: Methanol; B: Water; A/B = 1/3 v/v
1.5 mL/min
0.5 mL/min
10 µL
5 µL
Acetaminophen (0.01 mg/mL)
Shim-pack GIST C18 (250 x 4.6 mm, 5 µm)
Shim-pack GIST C18 (100 x 2.1 mm, 2 µm)
A: 1 % chloroacetic acid solution; pH 3.0;
adjusted with ammonium hydroxide
B: acetonitrile; A/B = 40/60
2.0 mL/min
0.6 mL/min
5 µL
1 µL
Ibuprofen (12 mg/mL),
Valerophenone (0.35 mg/mL),
4-Isobutylacetophenone (0.012 mg/mL)
Shim-pack GIST C8 (250 x 4.6 mm, 5 µm)
Shim-pack GIST C8 (100 x 2.1 mm, 2 µm)
A: 2.6 g Ammonium dihydrogen
phosphate in water/acetonitrile =
450/550 mL
2.0 mL/min
0.5 mL/min
10 µL
1 µL
Glibenclamide (0.44 mg/mL),
Progesterone (0.2 mg/mL)
Acetaminophen Ibuprofen Glibenclamide
conventional
accelerated
conventional
accelerated
conventional
accelerated
Table 3: Columns and method parameters used

23SHIMADZU NEWS 3/2017
APPLICATION
packaging foods are constructedof several layers. The outermostlayer contains fillers such as ka -olin (SiO2/Al2O3) and talcum (a magnesium-containing sheet silicate) as well as titanium dioxideas a white pigment. These providesmooth, white surfaces that aremore suitable for printing than the rough untreated board layer.[1, 2]
ATR determines the main components of packaging surfaces
In the following, ATR-FTIR spec-troscopy is used to quickly deter-mine the main components in thesurfaces of packagings. The acro -nym ATR stands for “AttenuatedTotal Reflection”, which describesthe applied measuring principle:IR radiation is passed through anoptical element, e.g. a diamondcrystal, before it reaches the sam-
ple. Most of theincident radia-tion is reflectedby the interfacebetween the sam-ple and the ATRcrystal, whereasa small fractionpenetrates thesample and inter-acts with it. The
resulting attenuation of the totalreflection is measured.
The penetration depth of the IRradiation depends on the angle of incidence and, in the presentex perimental setup, it is approx. 2 µm. However, multilayer systems cannot be analyzed ad -equately in this way, because thelayers are often only a few mi -crons thick and cannot be separat-ed from each other. IR micros -copy, however, can be used tomake ATR measurements of thecut edge of a multilayer system.
The measurements shown herewere carried out with an
IRTracer-100 with a diamond ATR(Quest). Several components canbe identified in the infrared spec-trum (figure 2a) of the outer sur-face of a cardboard box for choco-late bars.
The first database search identifiesa copolymer composed of styreneand allyl alcohol monomers.These are constituents of the col-ored print. By generating a differ-ence spectrum between that of thesample and that of the identifiedcomponents, it was also possibleto identify kaolin and calcium car-bonate (figure 2b - 2d).
Paper packagings are stabilizedagainst moisture by laminatingthem with PE (polyethylene) lay-ers, which extends the applicationrange for paper packagings. Ex -
Just paper, isn’t it?Analysis of paper-based food packaging materials using infrared ATR spectroscopy
A nyone working with foodpackagings cannot do with-out one basic constituent:
cellulose. This is a polymer com-posed of cellobiose units, whichare glucose molecules linked to -gether with �1,4-glycosidic bonds(figure 1). Cellulose is obtainedfrom wood and is commonlyknown as (card)board or paper.Paper makes up the largest pro-portion of packaging materials. Its advantages are clear: not onlyis it a cheap, renewable raw mate-rial, but waste paper can be recy-cled and used in the production of new packaging materials.
Food-safe paper is available, forexample, as wrapping paper fordirect contact with foods such asfresh cold cuts or as laminatedpaper as drinking cups for bever-ages. The range of applications canbe illustrated with the followingkeywords: bio-, to-go, and fast-food packagings. The use of paper-based packagings in the form ofcardboard is limited to secondarypackaging or for dry foods such asflour, sugar, pasta, and muesli.
On its own, paper does not pro-vide a barrier against moisture andoxygen. Cardboards used for
amples of this include milk car-tons and coffee cups.
Further more, the PE film makesthe packaging more tear-resistant.How ever, since PE is permeableto CO2 and O2, its use is limitedto fresh foods that are consumedwithin a short time. [3]
Packaging carries advertisingand creates reputation
The use of paper in packagingscan contribute to shaping itsimage and also boost the reputa-tion of the food itself. For exam-ple, the FSC logo can be awardedfor using wood from “sustainablesources”. This logo characterizesthe product as being particularlyenvironmentally friendly. [4] �
Figure 1: Cellobiose unit of a cellulose
polymer
IRTracer-100
cm-14,000 3,600 3,200 2,800 2,400 2,000 1,800 1,600 1,400 1,200 1,000 800 600
0.0
0.5
1.0
Abs
cm-14,000 3,600 3,200 2,800 2,400 2,000 1,800 1,600 1,400 1,200 1,000 800 600
0.0
0.5
1.0
Abs
cm-14,000 3,600 3,200 2,800 2,400 2,000 1,800 1,600 1,400 1,200 1,000 800 600
0.0
0.5
1.0
Abs
cm-14,000 3,600 3,200 2,800 2,400 2,000 1,800 1,600 1,400 1,200 1,000 800 600
0.0
0.5
1.0
Abs
2a
2b
2c
2d
Figure 2a to 2d: Spectrum of a cardboard box (2a) and the constituents identified in it:
styrene/allyl alcohol copolymer (2b), kaolin (2c), and calcium carbonate (2d)

APPLICATION
24 SHIMADZU NEWS 3/2017
Paper is also often used as a com-ponent of packagings for high-quality products. Only a very fewof our purchasing decisions arebased on logic; neurological re -search has even shown that alldecisions are driven by emotions.[5] In addition to the copy text ofads, visual and haptic effects alsoplay a major role in influencingpurchasing behavior, and thisleads to the use of packaging sys-tems with a complex composition.
Figure 4: Red: micro-ATR spectrum of the purple surface (nitrocellulose);
black: micro-ATR spectrum of the white fibers (cellulose).
cm-1
Abs
4,500 3,500 2,500 1,750 1,250 750-0.015
-0.005
0.005
0.015
0.025
0.035
0.045FTIR analyzes several layers of the packaging
Examination of a bag used forEm-eukal throat lozenges (see fig-ure 3) revealed that both the yel-low lozenge as well as the “Em-eukal” lettering on the packaginghad a smooth shiny surface. AnFTIR analysis showed that thiswas due to a PP (polypropylene)film. Furthermore, the inside ofthe bag is coated with an ethyl-ene/acrylic acid copolymer, whichis used as an adhesion promoteror for sealing packaging films. In addition, nitrocellulose, whichis a typical constituent of printinginks, was found on the printedouter surface of the bag.
Thus, this simple ‘paper bag’ wascomposed not only of cellulose,
but also three other materials,which gives the consumer theimpression of a high-quality prod-uct. [3]
IR microscopy analyzes components
IR microscopy can also be used to analyze the components ofpackagings, for example, usingShimadzu’s infrared microscopeAIM-9000 with a germanium-based ATR objective. The germa-nium crystal is used as the opticalelement. A cut is made throughthe layers of the Em-eukal bag.This reveals fibers close to thepurple surface and a plastic film.The ATR crystal can be used torecord spectra of 100 µm2 areas ofthe corresponding layers. Theinvestigated object and two of themeasured spectra are shown infigure 4.
Summary
Paper is a popular material forpackaging foods. Many differentmaterials are used in combinationwith paper, and each of these canbe identified quickly and nonde-structively with FTIR spectros -copy. As demonstrated here, somepaper packagings consist of sever-al layers as a combination of poly-mer coatings around the paper.The infrastructure of such a multi-layer system can be investigatedby means of infrared microscopy,which can be used to analyzelayer thicknesses in the µm range.
Literature[1] www.papierunion.de/starterkit/servlet/
segment/papierunion_index/Service/Papier
Praxis_BlueBooks/252/Papierherstellung.
html
[2] www.verbraucherzentrale.de/papier-
karton-pappe
[3] Dr. H. Saechtling: Kunststoff Taschenbuch.
31. Ausgabe, Carl Hanser Verlag, München
2013.
[4] www.fsc-deutschland.de/de-de
[5] Christian Scheier: Wie Werbung wirkt:
Erkenntnisse des Neuromarketing,
2. Ausgabe, Haufe Lexware, 2012
[6] http://www.soldan.com/presse/bilddaten/
Figure 3: Paper bag for throat lozenges
whose components were investigated
with FTIR. [6]
AIM-9000

LATEST NEWS
25SHIMADZU NEWS 3/2017
Time-efficient method for beer analysisFully automated derivatization and quantification of Glyphosate and AMPA using a standard LC-MS/MS system
B y using a standard LC-MS/MS system set-up, theanalysis of Glyphosate and
AMPA in beer could be simpli-fied, without requiring an addi-tional instrument, e.g. a liquidhandling system for sample pre-treatment. By staggering the pre-treatment and the LC-MS/MS
analysis, the method is very time-efficient. Calibration curvesshowed excellent precision andaccuracy, and even in a complexmatrix such as beer, Glyphosateand AMPA can be quantified at or below 5 ng/mL, which is belowthe EU maximum residue levels(MRL). 60 % of all tested beer
samples contained traces of Gly -phosate, but all of them were farbelow MRL.
Introduction
Glyphosate is currently one of the most common pesticides usedworldwide. In spite of its approval
by regulatory bodies all over theworld, the concern about its harmto humans and the environmentpersists. [1, 2] Therefore, the strictcontrol of Glyphosate and its me -tabolite aminomethylphosphonicacid (AMPA) in food and environ-ment is mandatory. �

Temps (min)
LATEST NEWS
established method that includes a derivatization step with 9-fluo-renylmethyl chloroformate(FMOC) [4] followed by LC-MSanalysis. FMOC derivatizationleads to a decreased polarity allow -ing chromatography on a standardreversed-phase column. The de -rivatization requires several pipet-ting steps. They can be executedmanually, which is tedious andprone to errors, or automatically,which requires dedicated addi-tional hardware.
This article reports a fully auto-mated derivatization followed byLC-MS/MS analysis of beer sam-ples. The instrumental set-up doesnot require any additional hard-ware for sample pretreatment, butuses the built-in pretreatmentfunction of the autosampler.
Heat block temperature: 400 °CCID gas: 270 kPaInterface voltage: 4 kV/-3 kV
Results and discussion
Method development for automated derivatization
The highly polar Glyphosate aswell as its degradation productAMPA are very well soluble inwater, but not soluble in othersolvents like methanol, isopropa -nol or acetonitrile. In contrast tothat, the non-polar FMOC is notsoluble in water but can be solvedeasily in organic solvents. Bring -ing together the analyte and thederivatization agent in an environ-ment that allows solubility forboth of them is crucial for thewhole analysis.
One way to achieve this is incuba-tion at a higher temperature. Thisincreases the solubility of FMOCin water and is therefore appliedvery often for the analysis. [5] Foran automated approach, this re -quires a dedicated instrumentalsetup enabling heated incubation.
In this report, a good solubilitycould be achieved for FMOC,
Experimental
Sample preparationA beer sample of 500 µL wasmixed with 500 µL methanol inorder to precipitate proteins.After vortexing, the samples werecentrifuged (15 minutes, 12,000 g)and set into the autosampler,which handled all further samplepretreatment steps fully automati-cally.
Pretreatment steps:
UHPLC methodInstrument: Nexera UHPLC,ShimadzuColumn: Gemini 5 µm C18, 150 x 2 mmMobile phase A: 2 mmNH4HCO3, pH 9.5 Mobile phase B: acetonitrileInjection vol.: 50 uLColumn temperature: 35 °C
MS conditionsInstrument: LCMS-8060,ShimadzuIonization: pos/neg ESINebulizing gas: 3 L/minHeating gas: 15 L/minDrying gas: 5 L/minInterface temperature: 325 °CDL temperature: 150 °C
In 2016, the year of the 500th an -niversary of the German BeerPurity law, Glyphosate has gaineddubious fame after being found inmany German beers. [3] Whilethere are defined maximum resi -due levels (MRL) for drinkingwater and some food products,there is no dedicated MRL forbeer. [4] In this case, the MRL of the individual ingredients ap -ply, e.g. the MRL for barleywhich is used for malt production(20 mg/kg) or for hops (0.1 mg/kg).These values are far above theMRL for drinking water (0.1 µg/L).
Fully automated derivatization followed by LC-MS/MS analysis
The quantification of glyphosateand AMPA is very challenging.On the one hand, both moleculesare highly polar which does notallow enough retention onreversed-phase columns. On theother hand, there are not manytransitions for LC-MS analysisavailable for these molecules dueto their small molecular weight.Additionally, beer is a complexmatrix that requires good chro-matography.
In order to overcome the low re -tention of Glyphosate on reversed-phase columns, there is a well-
26 SHIMADZU NEWS 3/2017
15 min 15 min 15 min 15 min
InjectionInjectionInjection
LCMS analysis LCMS analysis
DerivatizationDerivatizationDerivatization
LCMS analysis
Figure 2: Overlapping sample pretreatment and analysis done by SIL-30AC. Total time per sample is reduced
to 15 minutes.
Table 1: UHPLC method
0.00
2.50
5.00
7.00
7.01
12.00
12.01
14.00
14.01
15.00
5
50
95
95
5
5
5
5
0.4
0.4
0.6
0.6
0.6
0.6
0.4
0.4
to waste
to MS
to waste
% B Flow rate Valve position
Figure 1: Workflow of sample pretreatment. Addition of internal standard as well as
all remaining derivatization steps are done by the autosampler.
Proteinprecipitation
Internalstandard
Derivati-sation
Stopreaction
Automated injection to LCMS/MS
• Add 5 µL formic acid
• Add 5 µL EDTA-Borate• Add 15 µL FMOC
• Transfer 75 µL sample to a new vial• Add 3 µL internal standard
Done by SIL-30ACautosampler
within 15 minutesincluding incubation
• Mix 500 µL beer with 500 µL MeOH• Vortex thoroughly• Centrifuge 15 min, 12,000 RPM, RT

LATEST NEWS
27SHIMADZU NEWS 3/2017
Glyphosate and AMPA in a solu-tion with 50 % methanol (datanot shown) without heating thesample during incubation. Thisallowed a fully automated pre-treatment of the samples by usingthe pretreatment function of theautosampler. The only manualpretreatment required was adding500 µL methanol to 500 µL beer,vortexing the sample and centrifu-gation.
The supernatant was set into theautosampler, which executed allfollowing steps (adding FMOCand internal standard, stoppingthe reaction) automatically (fig -ure 1). After derivatization thesample was injected directly to the LC-MS/MS and analyzedaccordingly. The time required for all derivatization steps is only15 minutes.
The following chromatographyalso requires 15 minutes. Due tothe overlapping sample pretreat-ment functionality, the next sam-ple was already pretreated duringthe on-going analysis in order tomaximize sample throughput (fig-ure 2). Except for the first and thelast sample, the total time persample for automated pretreat-ment and analysis can be reducedto 15 minutes.
Figure 3 shows typical chromato -grams for LOQs of Glyphosate-FMOC (2.5 ng/mL) and AMPA-
FMOC (5 ng/mL) and their cali-bration curves (Glyphosate 2.5 -100 ng/mL; AMPA 5 - 100 ng/mL).The method shows excellent lin-earity for Glyphosate-FMOC (R2 = 0.9986) and AMPA-FMOC(R2 = 0.9995). By analyzing QCsamples in three different concen-trations (3 ng/mL, 15 ng/mL and75 ng/mL), the accuracy of themethod was proven to be veryhigh.
The relative standard deviationwas below 10 % for all QC exceptthe smallest QC for AMPA-FMOC, which was extrapolated asit was below LOQ (table 1).
Quantitative analysis of 40 beer samples
After the successful developmentof a fully automated method, atotal of 40 commercially available
beer samples were analyzed.Among these samples, there were21 samples of beer brewed accord-ing to Pilsener style, three samplesof organic beer, ten samples ofother types of beer, and six sam-ples of alcohol-free beers or non-alcoholic beer mix drinks.
All samples were analyzed induplicate in two consecutive runs.While Glyphosate was detected in60 % of all samples, its metaboliteAMPA was below LOQ in allsamples (table 2).
There is no correlation betweenthe kind of beers (Pilsener style,alcohol-free and others like wheatbeer) and the detection of Glypho -sate, as there were samples con-taining Glyphosate among allkinds of beers. Only the threeorganic beers tested were com-pletely free of Glyphosate. Buteven for the beers tested positive-ly, the amount was far below theMRL so that none of the beers is a health hazard – at least withregard to Glyphosate levels. �
Table 2: QC sample results
Results beer
(x 1,000)
Glyphosate-FMOCm/z 390 > 168 (-) · 2.5 ng/mL
AMPA-FMOCm/z 334 > 156 (+) · 5 ng/mL
5,390.10 > 168.05 (-)
(x 1,000)
3,334.00 > 156.10 (+)
0.0 0.00
0.25
0.50
0.75
1.00
1.25
1.50
1.75
2.00
2.25
2.50
2.75
0.5
1.0
1.5
2.0
2.5
3.0
3.5
4.0
2.75 3.00 3.25 3.75 4.00 4.25
Figure 3: Chromatograms of Glyphosate-FMOC (2.5 ng/mL) and
AMPA-FMOC (5 ng/mL)
Batch
A
A
A
B
B
B
C
C
C
D
D
D
Mean
SD
RSD (%)
Conc.
2.60
2.87
3.41
2.81
3.20
3.46
2.82
2.73
3.27
3.19
3.33
3.23
3.08
0.2915
9.5
Acc.%
86.5
95.7
113.5
93.7
106.7
115.3
93.9
91.1
109.0
106.2
110.9
107.6
Conc.
14.89
14.96
15.14
16.00
16.08
15.42
14.94
15.67
15.87
16.42
16.00
17.14
15.71
0.6816
4.3
Acc.%
99.3
99.7
100.9
106.7
107.2
102.8
99.6
104.5
105.8
109.5
106.7
114.3
Conc.
74.14
81.22
77.94
79.18
76.19
83.74
67.88
76.89
84.87
82.82
85.29
84.74
79.57
5.2735
6.6
Acc.%
98.9
108.3
103.9
105.6
101.6
111.6
90.5
102.5
113.2
110.4
113.7
113.0
Conc.
4.76
2.71
3.15
4.11
3.49
3.02
3.48
3.25
3.38
2.73
3.31
3.55
3.41
0.5676
16.6
Extrapolated
Acc.%
158.5
90.3
105.0
137.0
116.2
100.8
115.9
108.3
112.6
90.9
110.4
118.3
Conc.
15.66
16.16
15.99
15.33
15.20
15.66
15.48
16.55
16.87
16.85
14.35
15.50
15.80
0.7306
4.6
Acc.%
104.4
107.7
106.6
102.2
101.3
104.4
103.2
110.3
112.5
112.3
95.7
103.3
Conc.
80.80
85.65
81.38
78.40
82.23
84.15
83.97
79.72
82.65
75.46
72.06
75.97
80.20
4.0615
5.1
Acc.%
107.7
114.2
108.5
104.5
109.6
112.2
112.0
106.3
110.2
100.6
96.1
101.3
Glyphosate-FMOC AMPA-FMOCQC 3 ng/mL QC 15 ng/mL QC 75 ng/mL QC 3 ng/mL QC 15 ng/mL QC 75 ng/mL
IMPRINT
Shimadzu NEWS, Customer Magazine of Shimadzu Europa GmbH, Duisburg
PublisherShimadzu Europa GmbHAlbert-Hahn-Str. 6 -10 · D-47269 DuisburgPhone: +49 - 203 - 76 87-0 Fax: +49 - 203 - 76 66 [email protected]
Editorial TeamUta SteegerPhone: +49 (0)203 76 87-410 Ralf Weber, Maximilian Schulze
Design and Productionm/e brand communication GmbH GWADuesseldorf
Circulation German: 6,050 · English: 3,920
CopyrightShimadzu Europa GmbH, Duisburg, Germany – December 2017.
Windows is a trademark of Microsoft Corporation. ©2017
Apple Inc. All rights reserved. Apple, the Apple logo, Mac OS and iOS are trademarks of Apple Inc.

LATEST NEWS
28 SHIMADZU NEWS 3/2017
Conclusion
The reported method is able toderivatize Glyphosate and AMPAwith FMOC fully automaticallywithin 15 minutes. The only man-ual pretreatment required is pro-tein precipitation. No additionalhardware is required as all pre-treatment steps are performed bythe autosampler of a standard LCconfiguration. The method isrobust and reliable for samples
Pils
Sample 1
Sample 2
Sample 3
Sample 4
Sample 5
Sample 6
Sample 7
Sample 8
Sample 9
Sample 10
Sample 11
Sample 12
Sample 13
Sample 14
Sample 15
Sample 16
Sample 17
Sample 18
Sample 19
Sample 20
Sample 21
Organic Beer
Sample 22
Sample 23
Sample 24
Others
Sample 25
Sample 26
Sample 27
Sample 28
Sample 29
Sample 30
Sample 31
Sample 32
Sample 33
Sample 34
Non alcoholic
Sample 35
Sample 36
Sample 37
Sample 38
Sample 39
Sample 40
<LOQ
8.37
20.85
<LOQ
6.78
11.34
<LOQ
8.61
4.74
<LOQ
10.81
13.95
33.06
20.29
25.28
3.23
3.66
5.25
2.67
3.87
<LOQ
<LOQ
<LOQ
<LOQ
2.79
4.61
<LOQ
<LOQ
2.52
<LOQ
<LOQ
8.06
11.19
<LOQ
4.75
16.05
<LOQ
<LOQ
<LOQ
2.50
<LOQ
8.95
20.28
<LOQ
6.57
12.08
<LOQ
9.41
4.63
<LOQ
12.03
14.65
27.61
18.68
22.09
2.93
3.48
5.65
2.93
4.39
<LOQ
<LOQ
<LOQ
<LOQ
3.26
4.15
<LOQ
<LOQ
<LOQ
<LOQ
<LOQ
7.27
11.57
<LOQ
4.47
15.71
<LOQ
<LOQ
<LOQ
2.85
8.7
20.6
6.7
11.7
9.0
4.7
11.4
14.3
30.3
19.5
23.7
3.1
3.6
5.4
2.8
4.1
3.0
4.4
7.7
11.4
4.6
15.9
2.7
0.4087
0.4038
0.1549
0.5240
0.5706
0.0834
0.8627
0.4943
3.8509
1.1377
2.2578
0.2171
0.1308
0.2807
0.1881
0.3698
0.3323
0.3260
0.5621
0.2737
0.1952
0.2454
0.2482
4.7
2.0
2.3
4.5
6.3
1.8
7.6
3.5
12.7
5.8
9.5
7.1
3.7
5.2
6.7
9.0
11.0
7.4
7.3
2.4
4.2
1.5
9.3
<LOQ
<LOQ
<LOQ
<LOQ
<LOQ
<LOQ
<LOQ
<LOQ
<LOQ
<LOQ
<LOQ
<LOQ
<LOQ
<LOQ
<LOQ
<LOQ
<LOQ
<LOQ
<LOQ
<LOQ
<LOQ
<LOQ
<LOQ
<LOQ
<LOQ
<LOQ
<LOQ
<LOQ
<LOQ
<LOQ
<LOQ
<LOQ
<LOQ
<LOQ
<LOQ
<LOQ
<LOQ
<LOQ
<LOQ
<LOQ
<LOQ
<LOQ
<LOQ
<LOQ
<LOQ
<LOQ
<LOQ
<LOQ
<LOQ
<LOQ
<LOQ
<LOQ
<LOQ
<LOQ
<LOQ
<LOQ
<LOQ
<LOQ
<LOQ
<LOQ
<LOQ
<LOQ
<LOQ
<LOQ
<LOQ
<LOQ
<LOQ
<LOQ
<LOQ
<LOQ
<LOQ
<LOQ
<LOQ
<LOQ
<LOQ
<LOQ
<LOQ
<LOQ
<LOQ
<LOQ
Glyphosat-FMOC AMPA-FMOCConc. ng/mL
Conc. ng/mL Mean SD % RSD Conc.
ng/mLConc. ng/mL
Table 3: Analysis of beer sample
even in a complex matrix like beer,which makes it suitable for high-throughput analysis. Additionally,the throughput was doubled byusing the overlapping sample pre-treatment functionality. Thisallows sample pretreatment whilethe previous sample is analyzed.
Literature[1] Conclusion on the peer review of the pes-
ticide risk assessment of the active sub-
stance glyphosate, EFSA Journal,
13 (11):4302, 2015.
[2] www.dw.com/en/independent-scientists-
warn-over-monsanto-herbicide/a-
18886833
[3] www.umweltinstitut.org/fileadmin/
Mediapool/Downloads/02_Mitmach-
Aktionen/11_Rettet_das_Reinheitsgebot/
Glyphosat_Untersuchung_Umweltinstitut_
2016.pdf
[4] ec.europa.eu/food/plant/pesticides/eu-
pesticides-database/public/?event=
homepage&language=EN
[5] www.iso.org/obp/ui/#iso:std:iso:21458:
ed-1:v1:en
Read for you in ChromatographyToday 11-12/17

Innovation Center in the United States
29SHIMADZU NEWS 3/2017
LATEST NEWS
W orking with scientistsand academia to explorenew grounds for provid-
ing advanced technological sys-tems has been a long and goodtradition within Shimadzu tobecome a worldwide-leading man-ufacturer of analytical instrumen-tation and medical technology.
customer-focused service is thenext step towards these partner-ships. Meanwhile, there are Inno -vation Centers in the UnitedStates, China, and Singapore. In 2017, the European InnovationCenter was opened in Duisburg,Germany. It applies a decentral-ized structure to be close to �
emphasis on strengthening its cur-rent academic partnerships andestablishing new ones.
The establishment of ShimadzuInnovation Centers combining scientific and technological know-how in order to use Shimadzu’sexpertise to provide even more
Many industry-firsts have todayturned into standards and normsof a well-equipped laboratory andunderline Shimadzu’s approach of“Excellence in Science”.
To maintain itself as a globalleader and expand its technology,Shimadzu has placed an increasing
New solutions to complexproblems Global Innovation Summit – World-leading research meets cutting-edge technology
Mass Spectrometry Center in China

LATEST NEWS
scientists and related markets, andis a strong statement by Shimadzuabout its commitment to workingwith academic institutes. Theresult is faster response times forthe development of technologiesthat meet its partners’ needs.
“We have many good scientistsand engineers. However, it is noteasy to develop solutions, so wemust collaborate with more re -searchers. Only then can we con-tinue to offer outstanding tech-nologies, products, and services,”said Shuzo Maruyama, generalmanager of the Analytical andMeasuring Instruments Divisionat Shimadzu Corporation.
Shimadzu has invested tens ofmillions of dollars into projectswith universities around the world.Examples include the ShimadzuCenter for Advanced AnalyticalChemistry (SCAAC) at the Uni -versity of Texas at Arlington(Uni ted States), the Shimadzu
between key opinion leaders(KOL), Shimadzu scientists, engi-neers, and executives, and manyemerging thought leaders (ETL).In July 2017, the Summit brought11 KOLs to the Shimadzu globalheadquarters in Kyoto to speakabout their research in medicalinnovation, environmental issues,and food evaluation, for example.
The Summit’s aim was to facilitatecollaborations among scientistsusing similar techniques but rarelyhaving the opportunity to interactwith one another. The researchthemes presented focused onglobal issues of human health,food safety, and environmentalconservation, and highlighted theimportance of analytical technolo-gies for solving these problems.
Most representatives attending theSummit came from universities ornational research institutes. TheSummit was deliberately keptsmall, with just over 100 partici-
Analytical Innovation ResearchLaboratory at Osaka University(Japan), and the HMSTrustAnalytical Laboratory at MonashUniversity (Australia). ThroughShimadzu instruments, theseopen-access, non-profit laborato-ries provide not only advancedresearch, but also high-level train-ing to students and future scien-tists at the beginning of theircareers.
Initiatives like these are the reasonwhy nearly 40 % of Shimadzu’s11,000 employees and nearly 50 %of its customers are located over-seas.
Global Innovation Summit onhuman health, food safety, andenvironmental conservation
Apart from this new generation of collaboration with scientists,the Shimadzu Global InnovationSummit was born, a conference-style multilateral engagement
30 SHIMADZU NEWS 3/2017
Innovation Center in Laboratory World Europe, Duisburg, Germany
Dr. McIntosh in her lab at the Monash
Institute of Pharmaceutical Sciences

LATEST NEWS
31SHIMADZU NEWS 3/2017
pants, but was internationallydiverse, as scientists from 16 dif-ferent countries participated. Thereason for the small size was toencourage as much interaction aspossible between the attendees.Following the academic model,along with KOL presentations,ETL were welcomed to presenttheir data at a poster session, andseveral open-panel discussionswere held to facilitate interactionbetween ETL and KOL.
“The conferences I attend aremostly on pharmaceuticals andrarely about food science. Thetalk I heard at the Summit aboutextractables and leachables in foodpackaging described the same is -sues we encounter with pharma-ceutical products and packaging. I exchanged business cards afterthe talk to discuss potential col-laborations,” said Monash Univer -sity Associate Professor MichelleMcIntosh from Melbourne, Aus -tra lia.
Hope for new mothers: new treatment of postpartumhemorrhage
Dr. McIntosh’s talk is a perfectexample of how Shimadzu hopesto see its technology bring solu-tions to some of the world’s crises.
Each year, 100,000 women will diefrom postpartum hemorrhage,most of them in developing coun-tries. The gold standard for pre-venting and treating postpartumhemorrhage is oxytocin, a drugthat costs only a few cents. De -spite this cost, access to oxytocinis not extensive. The reason is thedrug’s storage and delivery. Be -cause it is a peptide, oxytocin mustbe stored under controlled tem-peratures and must be injected,which requires qualified medicalstaff. However, in poorer nations,it has been estimated that nearly90 % of mothers in the lowestincome brackets give birth athome and do not have access topristine oxytocin or adequatelytrained professionals.
As an alternative, Dr. McIntoshhas been researching aerosolizedversions of oxytocin. Althoughsystemic drug delivery via thelungs has remained a challenge,
the light intensity that maximizesthe cytotoxic effect.
The latest Shimadzu NIR technol-ogy was also presented at theSum mit. In this system, indocya-nine green (ICG) is injected intothe patient. NIR light is shoneonto the patient to fluoresce ICG,illuminating blood perfusion andlymph vessels in real time for thedoctor conducting the surgicalprocedure under ambient light.This technology is currently usedat Japanese hospitals in an experi-mental setting on patients.
New diagnostics for prostate cancer
KOL Dr. Alex J. Rai, associateprofessor at the Columbia Uni -ver sity College of Physicians andSurgeons (United States), seesthese and other talks as a bigboost to his research on new diag-nostics for prostate cancer.
One major challenge in cancerrelates to the heterogeneity of thedisease process, which demandsanalytical tools that can revealbiomarkers for molecular stratifi-cation. These biomarkers can beused to assist in diagnosis, predic-tion of therapeutic response, andfor monitoring purposes. Fromwhat doctors currently know,there is no single gene that is re -sponsible for the majority ofprostate cancers. Thus, it is ofgreat interest to identify biomark-er signatures that can provide in -sight into the disease process, tounderstand how genetic mutationsare translated into dysfunctionalproteins that result in aberrantsignaling in tumor cells.
Prostate cancer is the second lead-ing cause of cancer death. Dr. Raiis searching the constituents ofexosomes for biomarkers that canstratify patients for better diagno-sis and treatment plans. Thisresearch has not only benefitedfrom Shimadzu technology butalso from Shimadzu educationprograms like ‘lab4you’, which in -vites graduate students and otherscientists to Shimadzu facilitiesand provides quick access toequipment for experiments. �
Dr. Kobayashi has been develop-ing a new anti-cancer therapyknown as near-infrared photoim-munotherapy (NIR-PIT). NIR-PIT uses conjugates of fluorescentdyes and antibodies to attack thecancer cells. These conjugates areinjected into the patient and willbind to the surface of the cancercell. A NIR stimulus causes areaction in the dye to activate the antibody. This activation per-meabilizes the cell membrane and triggers necrosis. NIR-PIT
achieves extraordinarily highspecificity for cancer cells. It isscheduled for Phase 2 clinical tri-als and soon will proceed to theregistration trial.
Shimadzu analytical equipmentsupports Dr. Kobayashi in thisresearch by providing data on thephotosynthetic reaction that re -leases the antibody. The antibodymust transition from a hydro -philic to hydrophobic environ-ment to cause the necrosis.Shimadzu mass spectrometryequipment is being used to under-stand the chemical mechanism ofthe reaction in order to optimize
drug absorption and onset ofaction can be equivalent to injec-tions. She therefore investigates adry powder version of oxytocin,which removes the need for refrig-erated storage and simplifies theadministration of the drug. A ma -jor piece of this work is under-standing the degradation of oxy-tocin, for which Dr. McIntoshuses a number of Shimadzu instru-ments. These studies include un -derstanding how the liquid andsolid versions of oxytocin respond
to the high temperatures commonin the regions most in need of theaerosolized form. Through thisresearch, she and her team nowconduct Phase 2 clinical trials.
New anti-cancer therapy known as near-infrared photo -immunotherapy (NIR-PIT)
Another KOL who spoke was Dr. Hisataka Kobayashi, SeniorInvestigator at the Center forCancer Research, National Insti -tute of Health in the United Sta -tes, within easy reach of where the first Shimadzu InnovationCenter was established. There,
Dr. Schug (right) at the University of Texas at Arlington

32
Car Symposium
Bochum, GermanyFebruary 2 - 8, 2018www.car-symposium.de
JEC
Paris, FranceMarch 6 - 8, 2018www.jeccomposites.com
Laborama
Brussels, BelgiumMarch 15 - 16, 2018www.expo.laborama.be
analytica
Munich, GermanyApril 10 - 13, 2018www.analytica.de
ISCC
Riva del Garda, ItalyMay 13 - 18, 2018www.iscc42.chromaleont.it
Print version: If you would like to receive theShimadzu News on a regular basis, please email us yourpostal address via: [email protected]
You can also subscribe to our newsletter via:www.shimadzu.eu/newsletter@ShimadzuEurope
Also as App: the Shimadzu NEWS is also availa-ble as WebApp via www.shimadzu-webapp.eu
Shimadzu live NEWS – print and digital
Environmental conservation:potential impact of hydraulicfracking
Also, key opinion leaders study-ing environmental issues and having long relationships with
Shimadzu University Laborato -ries presented their research. Onewas Shimadzu DistinguishedProfessor of Analytical Chemis -try Kevin A. Schug of the Uni -ver sity of Texas at Arlington.
His lab researches the potentialimpact of hydraulic fracturing, orfracking, on the en vironment inthe State of Texas. The SCAAChas allowed the Schug lab to con-duct some of the largest studieson groundwater contamination,providing invaluable informationfor policies that will establishbest practices for this increasing-ly common energy extractionmethod.
While his own talk was technicaland focused on advances in theanalysis of intact proteins, Dr.Inês C. Santos, an ETL in theSchug lab, presented an award-winning poster about changes inthe microbiome in groundwaterwells near fracking sites.
Evaluation of complicated food function
Professor Eiichiro Fukusaki ofOsaka University also gave atechnical talk, which was aboutmetabolic fingerprinting and itsapplication to food evaluation.
“It is very difficult to evaluatefood function using conventionalreductionism. The metabolomicstechnique is very useful to evalu-ate complicated food function,particularly flavor,” he explained.
By creating a metabolic matrixusing mass spectroscopy data, Dr.Fukusaki showed that metabolic
fingerprinting can predict thescoring of various attributes, suchas aroma, flavor, and appearanceof different foods by expert tastetesters. These fingerprints can beused by companies to modify fla-vors for different markets.
The future
The Global Innovation Summit isthe latest example of Shimadzu’srecognition that to continue toinnovate groundbreaking tech-nologies, it must work closelywith scientific leaders in analyti-cal research of different fields.The Summit was a naturalgrowth from the relationships thecompany had forged through itsmany laboratories and centersaround the world. These facilitieshave allowed Shimadzu scientistsand engineers to work closely
with KOL, establishing a level oftrust that could not be attainedotherwise.
“Shimadzu is starting to commu-nicate much more, especially in my field,” said Prof. ErichLeitner, a professor at Graz Uni -versity of Technology (Austria)and a KOL at the Summit, whospoke about his research on foodaroma and food contamination.“It makes a difference. They giveus great opportunity for meas-urements. It’s really nice to gothere. Nice to work there. Theyreally try to speed up things.”
LATEST NEWS
Further information
on this article:
• www.shimadzu.com/
an/gis/
Dr. Santos during her presentation at the
Global Innovation Summit
Prof. Erich Leitner (right), University of Technology, Graz, Austria