Embed Size (px)
Citation preview

JOURNAL PROPOSAL / CALL FOR PAPERS
JOURNAL OF ASIAN ECONOMICS, ACCOUNTING AND FINANCEEditior-in-Chief: Prof. V. K. Gupta, Indian Institute of Management, Indore
Publisher: Academic Research Foundations, New Delhi (India)
(Accounting)• Auditing and assurance services• Audit quality, audit fees, auditor ’s tenure and auditor ’s
independence• Audit report lag• Auditors’ reporting decisions for accounting estimates• Audit evidence• Pricing initial audit engagements• Audit committees• Effectiveness of of international standards for auditing (ISA)• Internal audit effectiveness and information technology• Effectiveness of external auditor reports• Auditdata analytics• Artificial intelligence and its impact on accounting• Role of auditors in risk assessment• Big data analytics and auditing and accounting• Continuous auditing and role of Big Data• Auditing and accounting in the age of digitalization• E-commerce and auditing• ERP audits• Impact of Blockchain accounting on accountants and auditors‘
skills and practices• Impact of Crypto currencies on accounting and auditing• Information systems and computer auditing• Issues and challenges created by Fintech in auditing procedures• Financial Accounting and reporting• Impact of technology in financial reporting• Financial reporting users and their needs• The future of reporting and its relevance, including digital
reporting• International Accounting• Impact of convergence of International Financial Reporting
Standards(IFRS)• IFRS and cost capital• Capital market research• Earnings management in family versus non family firms
AIMS OF THE JOURNALJournal of Asian Economics, Accounting and Finance (JAEAF)is double blind reviewed international journal that publishes research,intensive articles, and scientific manuscripts focusing on all aspectsof Economics, Accounting and Finance topics.Publication Frequency: QuarterlyTopics of Research Interests(Economics and Finance)• Macroeconomcis• International Economics• Econometrics• Business Economics• Growth and Development• Regional Economics• Tourism Economics• International Trade• Finance• International Finance• Macroeconomic Aspects of Finance• General Financial Markets• Financial Institutions• Behavioral Finance• Public Finance• Asset Pricing• Financial Management• Options and Futures• Taxation, Subsidies and Revenue• Corporate Finance and Governance• Money and Banking• Markets and Institutions of Emerging Markets• Public Economics and Public Policy• Financial Economics• Applied Financial Econometrics• Financial Risk Analysis• Risk Management• Portfolio Management• Financial Econometrics

• Earnings management and corporate governance• Fraud, ethics and corruption• Compliance and value approaches for accounting ethics• Accounting and human rights• Accounting, information technology, and corporate governance• Impact of Fintech on corporate financing decisions• Accounting communication • Public Sector Accounting• Corporate social and environmental accounting and reporting• Integrated and sustainability development and reporting• Carbon accounting and climate change• Ethical issues in accounting and financial reporting• Measurement and reporting of Risks• Sustainability and corporate governance• Measurement and valuation of intellectual capital• Role of professional bodies in the development of accounting
standards• Political issues, political linked companies and accounting practices• Islamic accounting• Accounting and Financial Education• Cost and Managerial accounting and control practices• Strategic managerial accounting• Behavioural accounting• Budgeting practices and their behavioural implications• Contemporary performance measurement and management (PMM)• Environmental cost management and reporting• Accounting information systems• Taxation and tax avoidanceReview Process and Acceptance of manuscriptsJAEAF follows a double blind review process of all the manuscripts.The review process time may take between 8 to 12 weeks. Thejournal follows a review form for the reviewers. Reviewers may alsoadd their comments in the second section of the Review Form.Having reviewed the paper, the reviewers will be requested to makeany of the following decisions:• Accept as it is• Accept with minor revisions• Accept with major revisions• Send me the revised paper• RejectJAEAF publishes original and unpublished manuscripts. All themanuscript submitted to the journal should be the original work ofthe authors and the manuscript should not be under review of anyother journal.
GUIDELINES TO THE AUTHORS
JAEAF: publishes research articles only in English language. It followsHarvard style of citation in the text (e.g. Joshi, 2018). For preparingthe manuscript, authors should use the following guidelines:• When single author is used, the author’s name (without initials)
and the year of publication• When two authors are used: both authors’ names and the year of
publication, and• When three or more authors are used: first author’s name followed
by et al. and the year of publication.• Authors are advised to see that every reference cited in the text
should be presented in the reference list (and vice versa).Reference to a journal articleAll references should be listed in alphabetical orders. The style of
reference at the end should be in the following way:Joshi, P L., (2001) Diffusion of new management accounting practices:
the case of India, Journal of Asian Economics, Accounting andFinance, 10 (1), pp. 85-109.
More than one reference from the same author(s) in the same yearmust be identified by the letters ‘a’, ‘b’, ‘c’, etc., placed after theyear of publication.
Reference to a BookStrunk, Jr., W., White, E.B.,( 2000) The Elements of style, fourth ed.
New York: Longan.ProofsIt is the responsibility of the first author or corresponding author tocorrect theproofs of the accepted article which will be sent electronically.The same should be returned within three weeks of the receipt.Corrections should be restricted to typesetting errors only; Anyadditional changes will be charged to the authors. No late or last-minutecorrections will be entertained.Reprints: A copy of the the published paper in PDF file will be sent tothe authors which will be reprint copy of the published article.Copyright: Once the manuscript is accepted, it will be the responsibilityof the corresponding author to send the copyright form, signed byeach author and co-authors.Prepation of manuscript• The size of the manuscripts submitted to JAEAF should be between
3,000 to 6, 000 words.• The title page should include title of the manuscript, all authors
names, institutional affiliation, full address, email addresses.• Title of the manuscript should be appealing and concise. Do not
include any mathematical sign in it.• An Abstract of not more than 200-300 words should be prepared.• All pages in the manuscripts should be properly paged.• If any footnotes are used, they should appear at the bottom of the
text page where they are quoted.• All tables and figures should be included at the end, just after the
references. All tables and figures should be numbered consecutively.• All acknowledgements should be included just before the
refrencences.
Electronic Submissions should be sent in MS Word format to:[email protected]

CONTENTS
1. International Humanitarian Principles and its Extension ..................... 1-21Derived from Local Cultural Traditions in Conflict Situations
Md. Abdul Alim
2. Growth Effect of Investments Made By Insurance Firms in ............23-33the Private Sector: Evidence from Cameroon
Guivis Zeufack Nkemgha & Armel Peuwo Djouaka
3. Fiscal Policy Disturbance in India: An Application of ........................35-43SVAR Model
A. Abdul Raheem and Ibrahim Nurudeen
4. Productivity Analysis of Manufacturing Industry: ...............................45-60Lesson Learn from Japan
Vanxay Sayavong
5. Sustainability Practices and Performance of Sierra Leonean .......... 61-118Deposit Money Banks
Alpha Bernard Bangura
JOURNAL OF ASIAN ECONOMICS,ACCOUNTING AND FINANCE
Volume 1 • Number 1 • 2020

INTERNATIONAL HUMANITARIAN PRINCIPLES ANDITS EXTENSION DERIVED FROM LOCAL CULTURALTRADITIONS IN CONFLICT SITUATIONS
Md. Abdul Alim
Professor, Department of Law, University of Rajshahi, Rajshahi 6205, BangladeshE-mail: [email protected]
Received: 12 January 2020; Revised: 25 February 2020; Accepted: 27 February 2020; Online: 22 June 2020
Abstract: This article is to highlight the operational aspects of IHL in situations of armed andnon-armed conflict. It would like to examine the means of a extending cardinal principles of theIHL law to address issues of humanity in conflict situations. It discussed the scope of IHL,developments, challenges, and the possible expansions of IHL principles in the area of fosteringreconciliation to war-affected societies and communities. IHL aims to achieve social justice throughretributive and restorative justice systems, extending the notion of humanity as the underpinningconcept in all the decisions, actions, and programs initiated in helping the victims of conflict andaffected communities and rebuilding the aggrieved society. This article tries to draw attention inHuman Rights law are inherent entitlements that belong to every person as a consequence ofbeing a human what so ever his identity and claim certain behavior or benefits from governmentsas well as from the International Community.
Key Words: Humanitarian Law, Geneva Convention, Genocide, Religious View, Armed Conflict,Non-armed Conflict.
1.1. PRELUDE
A novelist named Leo Tolstoy had developed his own opinions of warhistory in his novel “War and Peace” with universality and the role of thehuman being during the invasion of Russia in 1812. Napoleon’s invasionof Western Europe is just beginning to blend fears in Russia. The Russiantroops are assembled in the coalition with the Austrian empire, which iscurrently resisting Napoleon’s blitz. Both Andrew and Nicholas go to thefront. Andrew is wounded at the Battle of Austerlitz, and though hesurvives, he is long assumed dead.1 During the war there must have someindividual rights and obligations of belligerent parties in performing ofoperations and to some limit the choice of means in destruction. This lawproclaims laws concerning to the means and methods of warfare andscrutinizes the issue of the military entity. In peacetime, human rightsapplied for the citizens and conflict time this same can translate to thehumanitarian aspect. So, the expression “humanitarian” is used in a wider
Journal of Asian Economics, Accounting and FinanceVol. 1, No. 1, 2020, 1-21© ESI Publications. All Right ReservedURL : www.esijournals.com

2 Journal of Asian Economics, Accounting and Finance © 2020 ESI
sense in this modern world, and can be confused with the term “humanrights”.
Humanitarian law aimed to make a border line on the sufferingoriginated by war and control how military procedures are conducted.International Humanitarian Law (IHL) often try to refer as the law of war,the laws and customs of war, or the law of armed conflict. The laworiginated and comprises with the Geneva Conventions and the HagueConventions as well as subsequent treaties, case law, and customaryinternational law. Every State has some responsibility to investigate and, ifappropriate, prosecute all war crimes allegedly committed by its nationalsor armed forces, or on its territory, as well as other war crimes over whichit has jurisdiction. So, State must require its military commanders to preventgrave breaches and other war crimes and to take action against those undertheir control who commit ethnic cleansing or violence against humanity.
1.2. RESEARCH QUESTIONS
For doing the research work, the researcher has to fix some importantquestions which will be answered or solved throughout the research work.The research questions which greatly shake the mind of the researcher areas follows:
a) From where the ideas and principles are originated in modernhumanitarian law treaties regarding IHL?
b) What were the local cultural traditions to take action to endgenocide?
c) How has the IHL originated and developed from different schoolsof thought, religious teaching?
d) How far the international conventions regarding IHL andmechanisms are effective for the modern State?
1.2.1. Principles of Humanitarian Law
The fundamental principles of humanitarian law are to limit the miserycaused by war by forcing parties engaged in a conflict to connect in limitedmethods and means of warfare.2 Its aim is to differentiate between thecivilian population and combatants, and work to protect the civilianpopulation and property. Humanitarian law also tried from harming orkilling an adversary who surrenders or who can no longer take part inthe fighting. That the hostile group must not torture physically or mentallyor performing cruel punishments on adversaries. The manner and
International Humanitarian Principles and its Extension Derived from Local Cultural... 3
responsibilities of belligerent has identified by the internationalhumanitarian law, it may be an entity of individual, group, country, orother entity that operates in a aggressive manner. Sometimes nations,neutral nations, and entities connected in combat relating to bothsupplementary and to protected individuals, typically indicatingcivilians.3
1.2.2. Objectives of IHL
Humanitarian law is the division of public international law comprisingwith some standard rules, which is applicable during the armed conflictand should not include unnecessary destruction to civilian people.Primarily armed conflicts are classified as falling into two categories asinternational and noninternational armed conflicts.4 Meron5 illustrates thatcategories as “… a crazy quilt of norms that would be applicable in thesame conflict, depending on whether it is characterized as internationaland non international…” The fundamental aim of IHL is to maintain acompromise between two conflicting interest namely between militarynecessity and humanity. Again, Rousseau delineated in his remarkablescholarly book on ‘The Social Contract’:
… war was not a relationship of man with man but a relationship between statesin which individuals are only enemies by accident, not as men but as soldiers, oncethey lay down their arms, they once again become mere men, and their lives must bespared.6
IHL principles are mainly contained in international treaties and legallybinding customs on the international community.7 It has two main branchesand it illustrate their names from the cities where each was initially codified:namely Geneva law and Hague law. The two Additional Protocols of 1977combine both branches of law to a great extent. The humanitarian lawworks for seeking to protect persons who are not or are no longer takingpart in the hostilities and the prohibition to attack those hors de combat8,and restrict the methods and means of warfare employed, and resolvematters of humanitarian concern resulting from the war. No war is ablessing and so hostilities should be brought to stop as promptly as feasible.The people who should be protected against unnecessary destruction andhardship are particularly women and children, and property includingnational heritage that didn’t contribute to the war effort. The law of warfareis obligatory upon States and also on folks and, in particular, the affiliatedarmed forces. The belligerent parties are bound by the prescribed rules ofwar to the degree that such acquiescence does not obstruct with achievingjustifiable armed forces goals.

4 Journal of Asian Economics, Accounting and Finance © 2020 ESI
1.3. IHL DOCTRINE FROM ANCIENT ERA
The humanitarian thoughts and concepts are formalized in humanitarianlaw treaties and shared by many diverse forms in schools of thought,religious teaching, and cultural traditions. These international aspectsof IHL should never be underestimated or forgotten: very often admirationfor and implementation of the rules will in fact depend on the establishmentof a clear correlation between the pertinent treaties and local traditions orcustoms. This directs to aware that humanitarian principles are commonto all human communities wherever they may be. When miscellaneouscustoms, ethics, and philosophies are gathered for appraisal, and whenthey are liquefied down, their particularities eliminated and only what isuniversal extracted, one is left with a clean heart which is the legacy of allmankind.9 Though the term ‘humanitarian law’ or ‘law of war’ or ‘law ofarm conflict’ is originated from the medieval ages, to some extent a recentone, the concept of law of war’ has the basis in ancient time. The customaryrules of war have not developed in a night. But it is barely feasible to findany documentary proof of when and where the first legal rules of ahumanitarian natural world emerged and it would be even more difficultto sketch the architect of IHL. Almost in all faiths, there were certainminimum humanitarian rules to be maintained during war. For example,there was a certain rule that war would seize in the open field only betweenthe militant. Another rule was that it was not uncommon for the parties tothe conflict to reach in a treaty regarding the fate of the prisoners whichalso existed and still exists with no written heritage.
In short prominent Lords and religious figures, wise men, and warlordsfrom all continents have since time immemorial challenge to border theconsequences of war by ways of commonly binding rules. Such isolatedmilder practices by and by became usages, so called uses in hello, mannerof warfare. These customs through rituals and treaties became legal rules.
Hinduism
The Laws of Manu portrays a beautiful Hindus mind on the ways to behaveduring the war. It says to show respect and mercy and must not attack theelderly, women, or children.10 Manu demonstrates who are asleep or whohave surrendered should not attack them. Some Hindus believe theMahabarata teaching itself from the Lord Krishna. Lord Krishna articulatesthe Hindu thoughts to war and tranquility through the story of thehorrifying predicament faced by Arjuna. Krishna gave Arjuna the guidancethat this battle is not against his cousins rather it is a fight for a just war toovercome evil forces. Krishna reminds Arjuna that to fight for peace, justice,

International Humanitarian Principles and its Extension Derived from Local Cultural... 5
and truth is to fulfill the law of God.11 Many Hindu trustworthy texts containhumanitarian provisions to be filled in war whether the war is a Dharmajuddha or Adharma juddha. Some of the provisions are
The Code of Manu informs the king: “when he fights with his foes inbattle, let him not strike with weapons concealed (in wood), nor with (suchas are) barbed, poisoned, or the points of which are blazing with fire.”12
Whether the king himself fights or connected others to fight for him, theking must guarantee that the battle will be an honest combat. Again, thecode of Manu proclaims: “let him not strike one who (in flight) has climbedon an eminence, nor a eunuch, nor one who joins the palms of his hands(in supplication) nor one who (flees) with flying hair nor one who sitsdown nor one who says, ‘I am thine’. No one who is sleeping, nor one whohas lost his coat of mail, nor one who is naked nor one who is disarmednor one who looks on without taking part in the battle nor one who isfighting with another foe.”13 Great importance was attached todistinguishing between combatants and noncombatants during the war.According to Manu, persons walking on the road, not participating in theconflict, or simple travelers, or those who are engaged in eating anddrinking or following their special avocations or activities or diplomatictasks and of course the Brahmins, unless they are engaged in war, werenot to be killed. Hinduism is the spirit of all that wisdom handed down togenerations after generations. These thoughts have shaped and guidedthe Hindu socioreligious life for centuries. The quintessence of dharma isthe distinction between the good, supporting the celestial order, and evil,which poses a threat to this arrangement. Consequently, the preservationof good at the cost of a war was justified in ancient Vedic society.14 Vedicand Upanishadic literature flourishes in thoughts that broadcast universaloneness and universal wellbeing. ‘No one is superior or inferior; all arebrothers; all should strive for the interest of all and progress collectively’.15
Buddhist teachings
The principle of nonviolence is central to Buddhist teachings. Buddhismwas established in about 500 BC. Buddhism began with a prince calledSiddhartha Gautama. Siddhartha belonged to an aristocratic family. As aprince, he had a lot of wealth. He never left his palace. At some point,Siddhartha began to abscond his palace and behold for the first time poverty,sickness, and misery. After seeing this Siddhartha misplaced interest in hisspoiled life and left his palace forever and gave his rich individualbelongings to the needy. He joined a grouping of ascetics who weresearching for enlightenment. People who do not achieve their attractivepassions in their lives will be born over again to this life circle which is full

6 Journal of Asian Economics, Accounting and Finance © 2020 ESI
of suffering and so will faraway they from the world of no suffering Nirvana. Nirvana, one has to follow the eightfold path that is to believeright, desire right, think right, live right, do the right efforts, think theright thoughts, and behave right and to do the right meditation.16 ProfessorGananath Obeyesekere at Princeton University said17, “in the Buddhistdoctrinal tradition... there is little evidence of intolerance, no justificationfor violence, no conception even of ‘just wars’ or ‘holy wars.’ ... one canmake an assertion that Buddhist doctrine is impossible to reconcile logicallywith an ideology of violence and intolerance”.
Moreover, Dalai Lama said18, “Buddha always teaches us aboutforgiveness, tolerance, compassion. If from one corner of your mind, someemotion makes you want to hit, or want to kill, then please rememberBuddha’s faith. We are followers of Buddha”. He said that19 “All problemsmust be solved through dialogue, through talk. The use of violence isoutdated, and never solves problems.” It is experimental that Buddhismeducates that life is dear to every human being20 and that the taking ofthe life of even the meanest thing is to be avoided.21 However, Buddhismhas pressured on the settlement of disputes by peaceful means. One ofBuddha’s sermons puts this very clearly with an influential instance thatstresses the need to love your opponent no matter how cruelly he treatsyou22: “Even if thieves carve you limb from limb with a doublehandedsaw, if you make your mind hostile you are not following my teaching.”The religion has respected the environment with the statement that evenbirds and beasts have equal rights to live as has it to the people.23 It hascategorically condemned the arms trade. Protection of civilians, right toasylum, and treatment of prisoners of war is also protected. So, in thecontinuing development and universal principles of IHL, Buddhism hasa great impact.
Judaism
Judaism has some principles of its religion relating to warfare. The Rabbisof Talmud observed that war is an avoidable evil. Jews have always hatredwars and Shalom expresses the hope for peace. The permissibility of waris limited and a requirement is that one always seeks a just peace beforewaging war.24 Jewish spirituality teaches Jews people to leave revenge toGod.25 Jewish law prohibits the use of outright vandalism in warfare. Itforbids the destruction of trees as a tactic of war. It also prohibits killing ananimal carelessly or offering poisoned water to livestock. It also makes aninjunction on the innocent people killing in the time of a justifiable militaryrendezvous. Deuteronomy lays down several constraints to be observed inthe pursuit of “normal” war:

International Humanitarian Principles and its Extension Derived from Local Cultural... 7
• “ the war is to be fought only by those who are courageous,possessing faith in God, and who do not have a commitment suchas a new house, vineyard or wife”26;
• “an offer of peace is to be made to any city which is besieged,conditional on the acceptance of terms of tribute”;27
• should the city decline the “offer of peace the males are put to thesword, the females and small children are taken captive, and thecity plundered”28;
Christianity
The Bible says that man is created in the image of God (Genesis 1:27).Because of this, man has a certain dignity and was given dominion overthe rest of creation (Genesis 1:26). The image of God in humans also meansthat murder is a most heinous crime. “Whoever sheds the blood of man, /by man shall his blood be shed; / for in the image of God / has God mademan” (Genesis 9:6). Christians should work to struggle with human rightsabuses and to encourage the welfare of all people. Christianityrecommended us to keep away from retaliation and vengeance and toextend our love even to our enemies. Jesus said, “Put your sword back intoits place; for all those who take up the sword shall perish by the sword.” 29
Many of Jesus’ apostles and other followers were also martyred for theirloyalty but never used violence to defy their fate.
The sermonize of the Gospel around the world, they are digging wells,planting crops, giving clothes, dispensing medicine, and providingeducation for the destitute.30 This is as it should be. There is a sense inwhich the Christian has no “rights” of his own because he has surrenderedhis life to Christ. Christ “owns” the believer. “You are not your own; youwere bought at a price”
Islamic Teaching
The companion of the Prophet Mohammad (570632AD) and followinggenerations of jurists take hold of the logic not to hit noncombatants. Theprohibition is against targeting five categories of people and provided noncombatant immunity for other categories of people as well, such as the sick,the blind, the incapacitated, the insane, farmers, traders, and craftsmen.31
According to the Qur’ān 2: 190: “And fight in the way of God those whofight against you and do not transgress, indeed God does not liketransgressors.” 32 According to the Qur’ān 5: 32: “For that We have decreedupon the children of Israel that whosoever kills a human soul except inretribution of committing fasād (destruction, damage) in the land, it shall be

8 Journal of Asian Economics, Accounting and Finance © 2020 ESI
as if he killed all of humanity, and whosoever saves it [a human soul] it shallbe as if he saved all of humanity.”33 The first caliph Abu Bakr (d. 634) instructedhis army commander thus: “do not cut down fruitbearing trees; do notdestroy buildings; do not slaughter a sheep or a camel except for food; donot burn or drown palm trees.”34 The eighthcentury jurist AlAwzai (d. 774)declared: “it is prohibited for Muslims to commit any sort of takhrīb, wantondestruction, [during the hostilities] in enemy territories”.35 The idea of respectfor the dignity and integrity of the human person is central to the Islamicconcept of humanitarian law. According to Islamic teachings Allah gavepreference to man over all other creatures. Islam forbids Muslim combatantsto torture their enemies. There is a saying by the prophet that does not committreachery and do not mutilate, even never mutilate a dog. Again, Islamopposes inflicting inhuman treatment on captive persons. So, some conceptsof humanitarian law are derived from Islamic texts.36
1.4. GENOCIDE IN WORLD HISTORY INITIATES IHL
In the past 150 years, tens of millions of men, women, and children havelost their lives in genocide or mass atrocities. A Million peoples have beentortured, raped, or forced to leave from their homes. Every peaceful mindedpeople must remember and take action to end genocide. The ancients, theknights of the middle age, and also the jurists of the early modern periodall bear witness to the evidence of this apprehension.37 Nor is it just aWestern concern. Other cultures and civilizations like as China, Japan, India,and the Islamic world, have their customs of rules of warfare.38
Between the years 1915 to 1923, more than 1.5 million ethnic Armenianshave killed by the government of the Ottoman Empire.39 In 1933 theHolocaust was planned by the Nazi Party in Germany which was killedsix million Jews and others aimed at ethnically “purifying” Germany byAdlof Hitler.40 In Cambodia, Khmer Rouge took power in 1975 and started a“reeducation” movement targeting political rebellious. In between 1975to 1979 citizens including doctors, teachers, students more than 1.7 and 2million Cambodians died by the notorious Khmer Rouge.41 In the year of1990 a civil war broke out in Rwanda that exacerbating tensions betweenthe Tutsi minority and the Hutu majority. The Republic of Bosnia andHerzegovina (Bosnia) declared sovereignty in 1992. In between 1992 to1995, the Serbs targeted Bosniak and Croatian civilians in areas under theircontrol in a campaign of ethnic cleansing. The war in Bosnia declared thelives of an estimated 100,000 people.42 The world also has witnessed theGovernment of Sudan approved out genocide against Darfuri civilians,murdering 300,000 and displacing over 2 million people.
International Humanitarian Principles and its Extension Derived from Local Cultural... 9
The Battle of Solferino in 1859 as a critical instant in the history ofmodern humanitarian law.43 Henry Dunant, a Swiss citizen, happened tobe present. The shocked sufferings of injured soldiers, he was inspired tofound the Red Cross movement,44 which was to become ‘a promoter andcustodian of the humanitarian idea and the primary instigation for itsevolution into international humanitarian law’.45 Dunant also promptedthe adoption in 1864 of the Geneva Convention for the Amelioration of theCondition of the Wounded and Sick in Armed Forces in the Field.46 ThisConvention symbols the start of the Geneva tradition of humanitarian law.The conventional history goes on to list the following catalog ofhumanitarian instruments: the 1907 Hague Convention,47 the 1949 GenevaConventions and the 1977 Additional Protocols.
1.5. IHL PRINCIPLES IN HAGUE AND GENEVA CONVENTION
At present, humanitarian law is principally a conventional law, which isvibrantly laid down in more than 70 international instruments in the formof conventions and protocols. IHL is as old as armed conflict. Itsdevelopment lies in customs and usages of war, performs of states forcenturies to minimize the miseries of war and can be found in all the ancientcivilizations. The ancient scriptures and sagas are replete with detailedrules of waging a war; the rules relating to the area where the war will takeplace, methods of warfare, the proportionality of the use of force, kinds ofarmed forces, and weapons to be used were precisely laid down andfollowed. The respect for human beings and considerations of humanityhas always remained the basis of these rules. This is evident from the majorcivilization s and religion s of the world. Liebers Code characterized thefirst endeavor to gather the laws, local customs, and usages of war intoone manuscript. It became known as the Lieber Code significantlyorganized later into foreign military codes. The influence draws a panoramaespecially in Europe, and also became incorporated into numerousinternational humanitarian treaties.48
IHL comprises the Geneva Conventions and the Hague Conventions,as well as succeeding treaties, case law, and customary international law.It characterizes the conduct and responsibilities of aggressive nations49,neutral ‘nations, and individuals engaged in warfare, in relation to eachother and to protected persons, usually meaning noncombatants’.50 It isintended to poise humanitarian concerns and military necessity, and fromwarfare to the rule of law. Everyone knows its destructive effect and sonecessary to mitigate human suffering. Grave violations of internationalhumanitarian law are called war crimes.51

10 Journal of Asian Economics, Accounting and Finance © 2020 ESI
1.5.1. The Law of The Hague
The Hague Conventions incorporated with two international treatiesapproved at international peace conferences at The Hague in theNetherlands. The First Hague Conference was held in 1899 and the SecondHague Conference was held in 1907. Besides the Geneva Conventions, theHague Conventions were among the first official statements of the laws ofwar and war crimes in the promising body of secular international law. Athird international conference was intended for 1914 and later rescheduledfor 1915. It was impossible to organize due to the start of World War I. TheGerman international law intellectual and neoKantian pacifist WaltherSchücking identified the gathering of the international union of Hagueconferences.52 The good news was a major effort in both the conferences tocreate a binding international court for compulsory arbitration to resolveinternational disputes. Most of the enormous powers, including the UnitedStates, Britain, Russia, France, and China, favored a binding internationalarbitration, but the circumstance was that the vote should be unanimous.After that a few countries, it was led by Germany, prevented the idea. Themain consequence of the Convention was to ban the use of certain types ofmodern technology in war: bombing from the air, chemical warfare,and hollow point bullets. 53 The Convention also set up the PermanentCourt of Arbitration.
A body of law concerning acceptable justifications to engage in warand that is called jus ad bellum. Jus ad bellum refers to the conditions underwhich States may resort to war or to the use of armed force in general. Theprohibition against the use of force amongst States and the exceptions54 toit, set out in the United Nations Charter of 1945, are the core ingredients ofjus ad bellum. Whereas the limits to satisfactory wartime conduct is jus inbello. It normalizes the conduct of parties engaged in an armed conflict.IHL is synonymous with jus in bello; it seeks to minimize suffering in armedconflicts by protecting and assisting all victims of armed conflict to thegreatest extent if possible. Now modern laws of war is addresseddeclarations of war, acceptance of surrender and the behavior of prisonersof war. 55 Moreover, the world should know when military necessities arerequired and when unnecessary along with distinction and proportionality.Regulating laws, which may causes unnecessary suffering and theprohibition of certain weapons.
1.5.2. The Geneva Convention
The Geneva Conventions comprise rules regarding hostilities in thesemodern times. The Geneva laws are appropriate on the issues of armed

International Humanitarian Principles and its Extension Derived from Local Cultural... 11
conflict and the objects of the Convention are to protect civilian peoplefrom war sufferings. The people who are not or are no longer taking partin hostilities they should have some human rights, for example:
• the combatants who are wounded or sick fighters
• captives of war
• civilians who are mostly vulnerable
• the health professionals and religious or spiritual persons.
Additionally, laws of war are proposed to alleviate the evils of war byprotecting both combatants and noncombatants from avoidable suffering.It is needed certain fundamental human rights of any person who fall intothe hands of the adversary, particularly prisoners of war, the woundedand sick, and civilians. Laws of war are the result of a development thatdeveloped in several numbers of stages between 1864 and 1949 whichfocused on the protection of civilians and the civilians who are not a partof fighting group in an armed conflict. Moreover, the World War II, all fourconventions were amended based on earlier revisions. The 1907 HagueConventions are readopted by the international community in 1949 throughGeneva Convention. Afterward conferences have added provisionsprohibiting certain methods of warfare and addressing issues of civil warswithin a territory. Geneva Convention comprises four treaties and threeadditional protocols. It establishes the principles in international law forthe humanitarian behavior of the victims of war.
• First Geneva Convention56 “for the Amelioration of the Condition of theWounded and Sick in Armed Forces in the Field”.
• Second Geneva Convention57 “for the Amelioration of the Condition ofWounded, Sick and Shipwrecked Members of Armed Forces at Sea”
• Third Geneva Convention58 “relative to the Treatment of Prisoners of War”
• Fourth Geneva Convention59 “relative to the Protection of Civilian Personsin Time of War”
• Protocol I60 (1977): Protocol Additional to the Geneva Conventions of 12August 1949, and relating to the Protection of Victims of InternationalArmed Conflicts.
• Protocol II61 (1977): Protocol Additional to the Geneva Conventions of 12August 1949, and relating to the Protection of Victims of NonInternational Armed Conflicts.
• Protocol III62 (2005): Protocol Additional to the Geneva Conventions of12 August 1949, and relating to the Adoption of an Additional DistinctiveEmblem.

12 Journal of Asian Economics, Accounting and Finance © 2020 ESI
1.6. IHL RELATED ISSUES AND PROBLEMS
The following presentation identifies and presents a view of some majorissues and problems that is regarded as central in the implementation ofIHL relating to, in particular, the employment of means and methods ofcombat. A clear understanding of the issues and problems is of utmostimportance for any effort to prescribe more appropriate standards andpolicies for the world community and apply them in particular situations.Their understanding is also necessary to qualify and analyses the existingmeasures realistically within the context of means and methods of warfare.63
(i) Direct Attacks on Civilian: One of the cornerstones of IHL is thatall potential measures are taken to distinguish between civilian personsand objects from the combatants and military targets. But in all wars,civilians have suffered the most. In fact, the civilian population is nowsuffering from the scourge of war greater than ever before. The ratiobetween belligerent and civilian war victims has come to be reversed inmodern conflict s. According to Human Rights Watch, US soldiers usedexcessive force. Amnesty International also reported the killing of Iraqi,Syrian, Afghan civilians which is the violation of IHL standards andundermines the rule of law.
Indiscriminate use of Modern weapons is being used increasingly suchas—
a) Cluster Bombs
b) Antipersonnel Landmines
c) Disproportionate attacks
d) Chemical in the form of gas
e) Thermo nuclear weapons64

International Humanitarian Principles and its Extension Derived from Local Cultural... 13
The first one is a cluster bomb and the second one is a land mine.65
(ii) Reprisal Attacks: Such Attacks are not permitted under the rulesof IHL or customary international law. But, some states that have ratifiedProtocol I, including UK, have entered reservation s on this point, allowingthat they may attack civilian s in reprisal for prohibited Attacks by theother party. During the Gulf war 1991, Iraq launched ballistic missiles atcivilians objects in Israel and Saudi Arabia in retaliation for airstrikes byUS and it allies in Iraq.66
(iii) Precautions in Attacks: Failure of armed forces to take necessaryPrecautions in the conduct of military operations in acc ordnance withArticle 57 of Protocol I have resulted in civilian casualties.
(iv) Human Shields67: The invasion of Kuwait and until December 1990,Iraq held hundreds if foreign hostages to persuade against theirgovernments from participating in an attack against Iraq. The civilianpeople were held at likely military targets as human shields. They werereleased before to the start of military action. Reportedly, Syrian troopsused children as human shields to protect themselves from tanks.
(v) Chemical and Biological Weapons68
Chemical weapons (Source: wikipedia.org)
The international law prohibited the use of Chemical and BiologicalWeapons. They are inherently indiscriminate Weapons, incapable of beingused in a manner that affects both civilians and combatants at the same

14 Journal of Asian Economics, Accounting and Finance © 2020 ESI
time violates IHL standards and causes superfluous injury and unnecessarysuffering.
(vi) Prisoners of the War: States have failed to honor their obligationsas regards the status and treatment of persons captured during the war.International human rights law and humanitarian lea applicable todetainees is not fully adhered to. Thus, the violation of the human rightsof the people in US custody in Guantanamo Bay is another serious problem.
(vii) Environment: War in Modern time s has a terrible fallout on theenvironment and ecology. Greater the environmental destruction inModern warfare and the development of technological capacity for greaterdestruction of environment in the modern age are two dangerous trends.So, the issue is: How we can save our environment neat and clean in thebattlefield?69
(viii) Contemporary Challenges70: Without the abovementioned issues,there are some Contemporary problems relating to the application of therules of IHL ,
a) Applicability challenge in case of
1) The IHL applicability from the commencement of war and to theend
2) The IHL applicability irrespective of geographical locations
3) The applicability of IHL to terrorism and counterterrorism withina territory
b) What will be the rules of application of IHL standards in case ofmultinational forces?
c) Protection problems in respect of
1) Humanitarian access and assistance
2) The specific protection of medical and health personnel and theircars must not be an object
d) How far it will be permissible to use force under international humanrights law and humanitarian law.
e) Problems in respect of means and methods of warfare in case of
1) The invention of modern and uptodate technologies of warfare
i) Cyber warfare through internet
ii) Autonomous weapon systems

International Humanitarian Principles and its Extension Derived from Local Cultural... 15
2) The use of explosive and dangerous weapons in populatedneighborhood
3) Responsible arms transfers
4) Any kinds of nuclear weapons
Nuclear weapon
(Source: Wikipedia.org)
1.7. CONCLUSION
Humanity or humanitarian considerations are very catchy words in anycontext. Which law will protect the civilian in the present conflictsituation? Is it a national armed conflict law or law of war or humanrights law? Where the atrocities and policies of discrimination havedevastated by the State and its effects shouted humanity is of utmostsignificance. In these situations, human rights law complements andreinforces the protection afforded by International Humanitarian Law.The goal of international humanitarian law is to limit the effects of waron people and property and to protect particularly vulnerable people inthe world. Bharot Chando Roygunakor was an ancient poet in Indian subcontinent and his speech was “When the city burns, what else the templeavoids?”
We should analyze Article II of the Genocide Convention71 and thereare differences between ethnic cleansing and genocide. Ethnic cleansingmay be mere dissolution of a group from their houses without physicaldestruction. The eviction of a group or part of a group does not in itselfsuffice for genocide. The fundamental difference between crimes againsthumanity72 and genocide is like Crimes against humanity indicates on thekilling of large numbers of individuals. The preplanned systematic group

16 Journal of Asian Economics, Accounting and Finance © 2020 ESI
killing of a huge number of individuals will represent a crime againsthumanity. On the other hand genocide has a different focal point. Genocidefocuses not on the killing of individuals, but on the destruction of groups,rage or caste on the basis on religion or belief. In other word, it is a largenumber of individuals who are form part of a single group. The twoconcepts have different intentions. The first one is seeks at protecting theindividual; the other intends at protecting the group. As examples, Rohingyapeople who reside in Myanmar are targeted group destruction as becauseof a part of the ethnic community also are collectively denied citizenship.Anyone identifying or recognized as Rohingya – pursue claims to be nationalraces or taingyintha to respond the community and denied by theGovernment.73 Thus, the human rights of Rahingya in these situations werehighlighted by the ICJ in 2004. The Court affirmed that there are threesituations pertaining to the affiliation between two bodies of law: “somerights may be exclusively matters of International Humanitarian Law;others may be exclusively matters of Human Rights Law; yet others maybe matters of both these branches of International Law.”74 States have alwayslimited power in which they conduct to protect armed conflicts. It is neededregional bilateral treaties to protect against terrorism observing of timehonored customary rules. Nevertheless, throughout the human history,restrictions on warfare varied greatly among conflicts and were eventuallydependant on time, place, and the countries involved. In the Case DemocraticRepublic of Congo v. Uganda the ICJ reemphasized the interrelationshipbetween HRL and IHL and observed “to take all measures necessary tocomply with all of their obligations under international law and also toensure full respect for fundamental human rights and the applicableprovisions of humanitarian law.”75 The differences between the applicationof IHL and HRL principles in war situations have become very muchamalgamated, and thus some rights violations in armed conflict can beconsidered as matters under both legal regimes. Again, with the end ofhostilities, the obligations of the responsible authority to rebuild thesocieties should be coupled with an undeniable obligation on thepreservation and upholding of humanity in wartorn societies. These certainnorms are inviolable under any circumstance which is undisputed andhas long been accepted by the international community as a whole. Theentire world should protect and promote some norms that are binding onall States and cannot be modified by even an international treaty and arenot subjected to any derogation. Therefore, based on this argument we canbuild due regard to humanity in postwar programs of any nature that isof utmost importance since it the erga onmes of the States.76 To save humanityand the rights of the people is above all the law.

International Humanitarian Principles and its Extension Derived from Local Cultural... 17
Notes
1. Leo Tolstoy, War and Peace, edit by Henry Gifford (London:Vintage Classics ed, 2008),pp. 1215.
2. ICRC, “What is International Humanitarian Law?” retrieved from https://www.icrc.org/en/doc/assets/files/other/what_is_ihl.pdf accessed 12 September, 2020.
3. JeanMarie Henckaerts and Louise DoswaldBeck, Customary International HumanitarianLaw, Vol. 1 (Cambridge: Cambridge University Press, 2005), p.4959.
4. International humanitarian law is applicable when different rules concerning with anarmed conflict in international or non international. Lotta Harbom and PeterWallensteen, ‘Armed Conflict and Its Fundamental Humanitarian Dimensions’ inJournal of Peace Research, Vol 42, No 5 ( Sep., 2005) pp. 623635.
5. Theodore Meron, ‘The Humanization of Humanitarian Law’ in American Journal ofInternational Law, p. 242.
6. JeanJacques Rousseau, ‘Ideal Empires and Republics’ in The Social Contract accessedfrom http://oll.libertyfund.org/titles/2039> on 12 December 2017.
7. The ICRC Study on Customary IHL applicable in Armed Conflicts has codified widelydispersed legally binding customary rule that regulate international and noninternational armed conflict situations. The study contains the customary rules of IHLwith a short commentary, as well as indications of treads in practice where no clearrule of customary international law has yet emerged.
8. Hors de combat is a French word means “out of combat”. The sick, wounded, detained,or otherwise disabled persons are normally granted as hors de combat for specialprotections according to the laws of war, sometimes including prisonerofwar status,and therefore officially become noncombatants.
9. Pictet Jean, “Humanitarian Ideas Shared by Different Schools of Thought and CulturalTraditions”, in International Dimensions of Humanitarian Law, Geneva, Dordrecht, HenryDunant Institute, M. Nijhoff, 1988, pp. 34
10. Surya P. Subedi, The Concept in Hinduism of ‘Just War’in Journal of Conflict and SecurityLaw, Volume 8, Issue 2, (Oxford: Oxford University Press, 2003)1Pages 339–361.
11. BBC News, Hinduism: attitudes towards fighting and warfare, http://www.bbc.co.uk/schools /gcsebitesize/rs/war/hinduismrev2.shtml dated on 23 March 2018.
12. V Nagarajan, Manusmriti , Sociopolitical Constitution, retrieved from <http://www.geocities.com/ vnagarajana402/manusmrti1.htm> dated on 22 March 2018.
13. Ibid.
14. Subedi Surya P., “The Concept in Hinduism of ‘Just War’”, in Journal of Conflict andSecurity Law, Vol. 8/2, October 2003, pp. 339361.
15. RigVeda, Mandala5, Sukta60, Mantra5
16. The Eightfold Path, retrieved from https://www.buddha101.com/p_path.htm datedon 12 September, 2020.
17. Neusner, Chilton & Tully, Just War in Religion and Politics, UPA Publishers 2013, p. 181.
18. 14th Dalai Lama (10 December 2012). ”Buddhist Leaders Respond To Violence AgainstMuslims In Myanmar” The Huffington Post, Retrieved on huffingtonpost.com datedon 19 June 2015.
19. Ibid.

18 Journal of Asian Economics, Accounting and Finance © 2020 ESI
20. Dhammapada X, 2.
21. Ibid, Kill not for pity’s sake, lest ye slay, the meanest thing upon its upward way.
22. Buddhist Views On War, retrieved from https://prezi.com/8nwbb8d2qmbo/buddhistviewsonwar/ accessed on 11 September, 2020.
23. The Madhavaram, chap. XIV.
24. Deut 20: 10.
25. Judaism and warfare, retrieved from https://en.wikipedia.org/wiki/Judaism_and_warfaredated on 10 August 2020.
26. Deuteronomy, verses 1–10.
27. Ibid, 10, 11.
28. Norman Solomon, “The Ethics of War in Judaism” in the Ethics of War in AsianCivilizations: A Comparative Perspective, edit. Torkel Brekke, ( Newyork: Routledge, 2006),p.40.
29. NAS, Matthew 26:5253
30. “Dignity of Man Meaning” retrieved from http://saipantribune.com/site/journal/dignityofmanmeaning58cc99 dated 10 August 2020.
31. Sultan Hamed, “The Islamic Concept” in International Dimensions of Humanitarian Law,Geneva, Henry Dunant Institute, UNESCO, 1988, p. 32.
32. Al Qur’ān, Surah Bakara verse 190.
33. Al Qur’ān, Surah Meyeda verse 32.
34. Ahmed Al Dawoody, “Islamic law and international humanitarian law: An introductionto the main principles” in International Review of the Red Cross, ICRC (2017), 99(3), 9951018.
35. Ibid.
36. Mani,V.S, Oxford Handbook of IHL in South Asia (New Delhi: Oxford University Press,2010),p.39
37. SassoÌli, M & A.A. Bouvier, How Does Law Protect in War? (UK: Cambridge UniversityPress, 2006), p.124–125
38. Ibid.
39. Don Melvin, CNN News, April 27, 2015, things to know about the mass killings ofArmenians 100 years ago Accessed from http://edition.cnn.com/2015/04/23/world/armenianmasskillings/index.html visited on 5 October 2017.
40. Vladimir Solonari, Purifying the Nation: Population Exchange and Ethnic Cleansing inNaziAllied Romania (Washington: Johns Hopkins University Press, 2010), p.12.
41. Patrick Heuveline,‘ ‘Between One and Three Million’: Towards the DemographicReconstruction of a Decade of Cambodian History (1970–79)’ in A Journal of Demography,Volume 52, 1998 Issue 1
42. Gearóid Ó Tuathail & John O’Loughlin, ‘After Ethnic Cleansing: Return Outcomes inBosniaHerzegovina a Decade Beyond War’ in Annals of the Association of AmericanGeographers, Volume 99, 2009 Issue 5, 10 Nov 2009.
43. Ibid.
44. Ibid.
45. Meyer M.A. and H. McCoubrey, Reflections on Law and Armed Conflicts: The SelectedWorks on the Laws of War (1998), p.69.

International Humanitarian Principles and its Extension Derived from Local Cultural... 19
46. J.M. Henckaerts, & L.D. Beck, Customary International Humanitarian Law ( UK:Cambridge University Press, 2005), p. 11.
47. W.A. Solf, ‘Protection of Civilians against the Effects of Hostilities under CustomaryInternational Law and under Protocol I’,in American University Journal of InternationalLaw and Policy, 1986, p.117
48. Development of International Humanitarian Law, American Red cross: January 2013
49. A belligerent (lat. bellum gerere, “to wage war”) is an individual, group, country, orother entity that acts in a hostile manner, retrieved from https://en.wikipedia.org/wiki/Belligerent dated on 11 January 2018
50. N Melzer, International Humanitarian Law A Comprehensive (Geneva: ICRC, 2016), p.20.
51. A war crime is an act that constitutes a serious violation of the laws of war that givesrise to individual criminal responsibility. As per ICC statute (Article 5) war crimes are
(a) The crime of genocide;
(b) Crimes against humanity;
(c) War crimes;
(d) The crime of aggression.
52. Stephen Barcroft, “The Hague Peace Conference of 1899,” Irish Studies in InternationalAffairs, Vol. 3 Issue 1, pp. 5568.
53. As it was not mentioned in The Hague, the Geneva Protocol to the Hague Conventionis considered an addition to the Convention. Signed on June 17, 1925 and enteringinto force on February 8, 1928. The Convention permanently bans the use of all formsof chemical and biological warfare in its single section, entitled Protocol for theProhibition of the Use in War of Asphyxiating, Poisonous or Other Gases, and ofBacteriological Methods of Warfare. The protocol grew out of the increasing publicoutcry against chemical warfare following the use of mustard gas and similar agentsin World War I, and fears that chemical and biological warfare could lead to horrificconsequences in any future war. The protocol has since been augmented bythe Biological Weapons Convention (1972) and the Chemical WeaponsConvention (1993) (Wikipedia, 2017).
54. The exception is on right to selfdefense and UN authorization for the use of force.
55. International Committee of the Red Cross, Introduction to the Law of Armed Conflict,accessed from https://www.icrc.org/eng/assets/files/other/law1_final.pdf dated on 15December 2017.
56. The Convention was first adopted in 1864, last revision in 1949.
57. It was first adopted in 1949, successor of the 1907 Hague Convention X.
58. It was first adopted in 1929, last revision in 1949.
59. It was first adopted in 1949, based on parts of the 1907, Hague Convention IV.
60. As of 12 January 2007, it had been ratified by 167 countries.
61. As of 12 January 2007, it had been ratified by 163 countries.
62. This Protocol came into force on 14 January 2007 and it had been approved by 77countries and signed but not yet ratified by an additional 21 countries.
63. Jambholkar, L. & Joyraj, ISIL Yearbook of International Humanitarian Law and RefugeeLaw, (New Delhi: The Indian Society of International Law, Vol. V, 2005), p.13.
64. Ibid, p. 1417

20 Journal of Asian Economics, Accounting and Finance © 2020 ESI
65. This picture is taken from the website http://www.stopclustermunitions.org/engb/clusterbombs/whatisaclusterbomb.aspx.
66. Ibid, p. 18
67. Article 51(7) of API prohibits the use of such tactic.
68. The Chemical Weapons Convention, 1993 prohibits the development, production andstockpiling of such weapons.
69. V.S. Mani, Oxford Handbook of IHL in South Asia (New Delhi: Oxford University Press,2010), p.22.
70. Retrieved from https://www.icrc.org/eng/warandlaw/contemporarychallengesforihl/overviewcontemporarychallengesforihl.htm dated on 01 May 2018
71. Convention on the Prevention and Punishment of the Crime of Genocide,1948. ArticleII: In the present Convention, genocide means any of the following acts committedwith intent to destroy, in whole or in part, a national, ethnical, racial or religious group,as such: (a) Killing members of the group; (b) Causing serious bodily or mental harmto members of the group; (c) Deliberately inflicting on the group conditions of lifecalculated to bring about its physical destruction in whole or in part; (d) Imposingmeasures intended to prevent births within the group; (e) Forcibly transferring childrenof the group to another group.
72. Article 7 of Rome Statute of the International Criminal Court, 1998 says, “crime againsthumanity” means any of the following acts when committed as part of a widespreador systematic attack directed against any civilian population, with knowledge of theattack:
(a) Murder;
(b) Extermination;
(c) Enslavement;
(d) Deportation or forcible transfer of population;
(e) Imprisonment or other severe deprivation of physical liberty in violation offundamental rules of international law;
(f ) Torture;
(g) Rape, sexual slavery, enforced prostitution, forced pregnancy, enforced sterilization,or any other form of sexual violence of comparable gravity;
(h) Persecution against any identifiable group or collectivity on political, racial,national, ethnic, cultural, religious, gender as defined in paragraph 3, or othergrounds that are universally recognized as impermissible under international law,in connection with any act referred to in this paragraph or any crime within thejurisdiction of the Court;
(i) Enforced disappearance of persons;
(j) The crime of apartheid;
73. Nick Cheesman, ‘How in Myanmar “National Races” Came to Surpass Citizenshipand Exclude Rohingya’ in Journal of Contemporary Asia, Vol 47, 2017, p. 461483.
74. ICJ, Advisory Opinion, para, 106. It was decided by the ICJ in this Case that Israel’saction is illegally constructing this wall has legal consequences not only for Israelitself, but also for other States and for the United Nations and determined that Israelhas a legal obligation to bring the illegal situation to an end by ceasing forthwith theconstruction of the wall in the Occupied Palestinian Territory.

International Humanitarian Principles and its Extension Derived from Local Cultural... 21
75. Democratic Republic of Congo v. Uganda, judgment of 19 December 2005, ICJ reports2005, para. 216219.
76. Jus cogens norms coupled with erga onmes include piracy, genocide, slavery and racialdiscrimination. The ICj recognized the right to self determination as an inviolablenorm in the Case concerning East Timor. The ICTY has also recognized the concept oferga onmes, noting that the prohibition on torture has that character, in Prosecuto v.Anton Furundzija decision in 1998.
To cite this article:
Md. Abdul Alim. International Humanitarian Principles and its Extension Derived fromLocal Cultural Traditions in Conflict Situations. Journal of Asian Economics, Accountingand Finance, Vol. 1, No. 1, 2020, pp. 121

GROWTH EFFECT OF INVESTMENTS MADE BYINSURANCE FIRMS IN THE PRIVATE SECTOR:EVIDENCE FROM CAMEROON
Guivis Zeufack Nkemgha1, a, *, Armel Peuwo Djouaka1, b
1Faculty of Economics and Management, University of Dschang, Cameroona He had a Ph.D in Mathematical EconomicsbHe is a Ph.D Student in Economics*Corresponding Author E-mail: [email protected]
Received: 24 January 2020; Revised: 23 March 2020; Accepted: 27 April 2020; Online: 22 June 2020
Abstract: The studies of the impact of insurance on the economy in African countries are stillscarce. There is a definite limitation in the little research that exists on the relationship betweenthe two variables: it is about the unexplored impact of the investments made in the private sectorby insurance firms on the economy. However, most of these companies make short, medium andlong run investments in private sector or in the financial market. The empirical evidence showsthat the investments made in the private sector by insurance firms foster economic growth inCameroun.
Keywords: insurance, private sector, economic growth
JEL Classification: G22, E22, O40,C22
1. INTRODUCTION
A private investment increases the stock of capital and to this end, it is oneof the essential means to generate an increase in productivity. This is whythe various development strategies resort mainly to interventions on privateinvestment in order to raise the rate of economic growth which is anecessary but not sufficient condition for ensuring social wellbeing. Thedynamism of a private sector is also characterized by the presence of solidinsurance companies. For example, a fire in an industry, a severe flood or adrought in a crop field can deprive a household of income. When theserisks are covered by insurance, individuals and firms gain peace of mindand can more easily make decisions affecting their productivity and investin the long run. By protecting them against loss of property, damage ordifficulty repaying a loan, it helps to reduce credit risk. In addition,insurance companies generally invest the premiums collected and backtheir insurance liabilities with assets of the same duration. Health insurancepremiums are frequently invested in shortrun assets, while life insurancepremiums or retirement products can be used to finance long run
Journal of Asian Economics, Accounting and FinanceVol. 1, No. 1, 2020, 23-33© ESI Publications. All Right ReservedURL : www.esijournals.com

24 Journal of Asian Economics, Accounting and Finance © 2020 ESI
investments rather than shortrun investments (Arena, 2008).The supplyof insurance helps to increase the overall efficiency of the financial sector,in particular by facilitating the provision of credit to the private sector.Thus, insurance is a factor of stability and resilience to extreme events forlocal economies and households. Insurance spending is an important leverfor the global economy as it represents 6.23% of world GDP (Sigma SwissRe, 2016). This highlights the fact that insurance is a necessary factor inincreasing economic growth. Empirically, several studies have shown thatthere is empirical evidence between the development of the insurance sectorand economic growth (Kugler and Ofoghi, 2005; Kjosevski, 2011 Mojekwuet al, 2011; Ghimire, 2014;Alhassan and Fiador, 2014; Olayungbo and Akinlo,2016 and Lee et al. 2018). These studies have some limitations. First, nostudy on the relationship between insurance and economic growth hasfocused in Cameroon. Next, none of them sought to verify whether theinvestments made in the private sector by insurance companies can affectthe economy. This paper aims to fill this gap in the economic growthinsurance literature.
The remaining part of the paper is constructed as follows. Section 2provides the crosscutting evolution of the main variables in Cameroon,literature review is presented in section 3 and section 4 presents variableand definitions. Section 5 presents the methodology and the estimationresults and discussions is reported in Section 6 while Section 7 providesconclusion.
2. CROSSCUTTING EVOLUTION OF THE MAIN VARIABLES INCAMEROON FROM 2002 TO 2017
The crossed evolution of life insurance and nonlife insurance is recordedin figure 1. This figure shows that the insurance activity in Cameroon isdominated by nonlife insurance with regard to expansion of its turnovercompared to that of life insurance, the trend of which is growing but notin the same proportions. This result can be explained by the fact that thelevel of income does not allow the large number of citizens to subscribeto life insurance because it is a country where 35% of the population livesbelow the poverty line according to World Bank statistics (2017). Inaddition, cultural habits such as the practice of insurance in meetings,which are mostly informal, hamper the emergence of life insurance. Asfor nonlife insurance, its expansion can be explained by the fact that it isbinding through regulations in sectors like transport and also becausesome investors would like to cover their activities with uncertainties.However, if life insurance seems to be a “luxury” for Cameroonians, itdoes not seem to be for nonlife insurance, which has grown remarkably

Growth Effect of Investments Made by Insurance Firms in the Private Sector 25
in recent years. Despite this expansion, it should be noted that theinsurance penetration rate in Africa is very low since it represents only1% of world insurance. In this 1%, South Africa and Morocco occupy 70%and 6% respectively, the other 52 African States occupy the remaining24% (FANAF, 2017).
While the insurance sector is in its expansion phase, the developmentof private investment and economic growth doesn’t seem to follow thistrend. Figure 2 represents the crossover evolution between privateinvestment and growth in Cameroon during the period 20022017. Thisfigure shows the growing trend of private investment in Cameroon. Thisexpansion is the result of the accumulation of the capital stock. Despitethis increase in investment, growth does not follow because between 2002and 2012, annual growth rates are less than 5% and from 2013 to 2017,they oscillated in the interval from 5 to 5.8%. This situation can beexplained by the fact that after the end of the HIPC initiative, the subprimecrisis of 2008 and the security crises (“Boko Haram” in 2010 and theAnglophone crisis of 2016) succeeded each other and affected theCameroonian economy.
Figure 1: Crosscutting evolution between life and non life insurance inCameroon during the period 20022017
Source: Authors from data collected.

26 Journal of Asian Economics, Accounting and Finance © 2020 ESI
3. LITERATURE REVIEW
Very few studies have analyzed the effect of insurance on economic growthin Africa. Among the authors who have studied this relationship in Africancountries, some have found a positive relationship (Mojekwu et al., 2011;Alhassan and Fiador, 2014; Olayumgbo and Akinlo, 2016 and Alhassan,2016), others found a negative relationship(Olayungbo and Akinlo,2016)while others found no relationship (Omoke, 2012 ).
Mojekwu et al. (2011) analyzed the impact of the contribution ofinsurance on economic growth in Nigeria during the period 19812008 usinga dynamic factor method. The results of this study reveal that there is apositive relationship between the contribution of insurance as measuredby the volume of the premium and economic growth in Nigeria.Omoke(2012) follows suit by also analyzing the influence of the insurance sectoron economic growth in Nigeria. The use of an error correction vector andJohannsen’s cointegration approach shows that insurance measured by theper capita premium had no significant effect on economic growth duringthe period 19702008. Alhassan and Fiador (2014) examined the causalrelationship between the penetration of insurance and economic growthin Ghana during the period 19902010. The authors use the Autoregressivestaggered delay (ARDL) approach of Pesaran et al. (2001). This study
Figure 2: crosscutting evolution between private investment andeconomic growth from 2002 to 2017
Source: Authors from data collected.

Growth Effect of Investments Made by Insurance Firms in the Private Sector 27
demonstrates the existence of a positive relationship between insurancepenetration and long run economic growth. In addition, a unidirectionalcausality ranging from the penetration of insurance towards economicgrowth on the one hand and from the penetration of life and nonlifeinsurance towards economic growth on the other hand has been revealed.Olayungbo and Akinlo (2016) assessed the effect of insurance penetrationon economic growth in eight African countries during the period 19702013. By using a Bayesian Time Varying Parameter Vector Autoregression(TVPVAR), the authors found a positive relationship between the twovariables in Egypt while in Kenya, Mauritania and South Africa, the authorsfound a negative and positive relationship in the short and long runrespectively. However, the negative effect has been observed in Algeria,Nigeria, Tunisia and Zimbabwe. Alhassan (2016) analyzed the causalrelationship between insurance penetration measured by life and nonlifeinsurance premiums and economic growth in eight selected countries. Byapplying the ARDL bounds approach to cointégration on time series datafrom 1990 to 2010 to test the causal relationship between the two variables,the results of the bound test shows a long run relationship betweeninsurance market activities and economic growth in Kenya, Mauritius,Morocco, Nigeria and South Africa. Moreover, causality analysis withinthe vector error correction model indicates a unidirectional causality frominsurance market development to economic growth except Morocco wherethere is evidence of bidirectional causality. Causality analysis within thevector autoregressive framework also provides a unidirectional causalityfor Algeria and Madagascar while mixed causality was found for Gabon.
In conclusion, it is clear that studies on the relationship betweeninsurance and economic growth in Africa are scarce. To our knowledge,no known study has been made in Cameroon in one part and in anotherpart, no author has thing to verify the indirect relationship between thetwo variables.Our paper, therefore, fils this gap in the insurancegrowthliterature by seeking to verify the effect of investments made in the privatesector by insurance companies on the economy. More specifically, it willfirst be a question of estimating the share of private investment generatedby insurance and then a second will be a question of assessing thecontribution of the latter to economic growth.
4. VARIABLES AND DEFINITIONS
This study uses quarterly data covering the period 2002 Q1 to 2017Q4. Thechoice of the period of study is related to the availability of data on interestvariables such as insurance. The dependent variable is economic growth,measured as the rate of the gross domestic product (GDP). We also include

28 Journal of Asian Economics, Accounting and Finance © 2020 ESI
a set of control variables in the growth equations. The trade opennessvariable is measured in this study as the sum of exports and imports as ashare of GDP (trade). According to Jouini (2015), there is a positiveassociation between trade openness and economic growth. The foreigndirect investment variable (FDI) is measure as foreign direct investment asshare of GDP. It’s positively and significantly impact the economic growth(Cambos and Kinoshita, 2002). Financial development variable is measurein this study by domestic credit to private sector in percentage of GDP(DCPS). Puatwoe and Piabuo (2017) have found that financial developmentpositively and significantly affects economic growth.The share of privateinvestment generated by insurance (priins) is used in this study as a proxyof insurance. To obtain this indicator, we will first regress the insurancevariable to that of private investment. The residual from the estimation ofthis model represents all the variables (except insurance) which influenceprivate investment in Cameroon but which were not taken into account inthe model. Suppose that the number of the variables that help explainprivate investment are “n”. If we subtract the insurance variable because itis present in the model, there remain “n1” to variables. The “n1” variablesare concentrated in the residual of the regression. This residual can thenbe used to measure the marginal contribution of insurance to privateinvestment. Used in this way, the residual takes the name of “usableresidual”. The authors as Mojekwu et al. (2011) have demonstrated thatinsurance influences significantly economic growth. All the variables ofthis study are coming from African Development Indicators ADI (2017)except the insurance variable which is coming from Federation of AfricanNational insurance companies FANAF (2017). All the variables of this studyare initially in the year period. Indeed, we used the Deaton method toquarterlyse them. The descriptive statistics are reported in table 1.
Table 1 : Descriptive Statistics
Variables Obs Mean Std. dev Min Max
PRINV 61 20.64 4.46 16.67 35.77TRADE 61 51.74 4.99 41.19 61.98DCPS 61 12.18 2.35 9.15 15.28FDI 61 1.72 1.01 0.089 5.53GDP 61 4.09 1.25 1.93 5.93INSURANCE 61 99666.52 23450.65 68797 141703
Source: Authors from data collected.
5. METHODOLOGY
There are two main equations in this section: the first relates to the privateinvestment equation and the second refers to the growth equation.

Growth Effect of Investments Made by Insurance Firms in the Private Sector 29
To determine the share of private investment generated by insurance,we specified the following private investment equation:
Prinvt = �
0 + �
1 Insurance
t + μ
t(1)
Where Inprt, Insurance
t and μ
t represent private investment, insurance
and the error term respectively at time t. The residual of equation (1) willbe considered as a proxy for the share of private investment generated byinsurance (Priins
t). Since equation (1) is a simple linear regression model,
GLS estimators are BLUE estimators because it is robust to autocorrelationand heteroskedasticity problems.
Taking into account the variable of interest (private investmentgenerated by insurance) and other control variables, the growth modelcan be expressed as follows:
1k p
t p p t t tY X priins (2)Where Y
t is GDP at time t, X is the vector of control variables, including
foreign direct investment, financial development and trade openness. �t is
an error term, and � represents a constant. Given the fact that the Priinsvariable represents the residual from the regression of insurance on privateinvestment, it is likely to be endogenous in the growth equation. To thisend, only the instrumental variable methods make it possible to solve thistype of problem. In addition, these methods are robust to heteroske dasticityand autocorrelation without forgetting that they are also a solution for theproblems of omitted variables and measurement errors in a model. It is forthese different reasons that the instrumental variable methods (GMM andTSLS) are used in this work to estimate the coefficients of the variables ofmodel 2.
6. EMPIRICAL RESULTS
The presentation of the results of this paper will be done in two stages. Itwill first be a question of estimating the share of private investmentgenerated by insurance companies, which is captured in this work by theturnover of nonlife insurance. In a second step, it will be a question ofregressing the variable share of private investment generated by insuranceon economic growth. The estimation of the share of private investmentgenerated by insurance is reported in table 2.
Table 2: Regression of insurance variable on private investment
Variable Coefficient tStatistic Prob
Insurance 0.0001375 2.41 0.019C 7.251915 1.52 0.133R2 = 0.3392 Prob (Fstat) = 0.0193
Source: Authors by software Stata 12.

30 Journal of Asian Economics, Accounting and Finance © 2020 ESI
The estimation of the private investment model by the GLS (throughthe prais command with the robust option) method shows that insurancemeasured by the turnover of nonlife insurance has a positive andsignificant effect on private investment in Cameroon. This result can beexplained by the fact that insurance companies use part of their turnoverto make investments in certain private companies. As we explained at themethodology level, the residual from of the estimation of this model isused to measure the marginal contribution of insurance to privateinvestment (priins). However, before proceeding to estimate the growthmodel, it is important to have an idea of the property of the variables. Theresults of the unit root tests of the variables are reported in Table 3.
Table 3 : Unit root tests
Variables ADF test PP test Integration order Decision
At level 1st difference At level 1st difference
PRIINS 0.0116 / 0.0108 / I(0) Yes
TRADE 0.5104 0.0054 0.4175 0.0033 I (1) No
DCPS 0.9370 0.0184 0.9970 0.132 I(1) No
FDI 0.0887 0.0054 / / I(0) Yes
GDP 0.6658 0.0066 0.8296 0.0039 I (1) No
Source : Authors from Eviews 9.
The unit root tests show that the Trade, DCPS and GDP variables arestationary in first difference while the FDI and PRIINS variables are ratherstationary at level. This result shows that the variables of our model arecointegrated. The estimation of the growth model by instrumental variablemethods is shown in Table 4.
Table 4: Estimation of the growth model
Variables GMM (I) 2SLS (II)
PRIINS 0.0960** 0.0960**
TRADE 0.0255* 0.0255
DCPS 0.4327*** 0.4327***
FDI 0.0542 0.0542
CONS 0.2403 0.2403
RSQUARED 0.6754 0.6754
WALD CHI2 441.42*** 128.90**
STOCK AND YOGO STATISTIC 955.32 1314.11
CHI2/ Prob (WUHAUSMAN) 0.032 0.0365
Nb. Obs 61 61
***p < .01, **p < .05, *p < .1, respectively. Source: Authors from Stata 12.

Growth Effect of Investments Made by Insurance Firms in the Private Sector 31
The estimation of the growth equation by generalized momentmethods robust to autocorrelation, heteroskedasticity and endogeneityproblem shows that the R2 equals to 67.54% and the Wald statistic issignificant at 1%. This means that the model is well specified. Theprobability of the WuHausman test (or CHI2) shows that the variable shareof private investment generated by insurance (PRIINS) is an endogenousvariable at the 5% threshold. We have chosen private investment as theinstrument for this endogenous variable. For this purpose, the statistic ofthe Stock and Yogo test (955.32) is higher than that of the critical value ofthe Wald test at 5% (10%, 16.38; 15%, 8.96; 25%, 5.53), which means that ourintrument is not weak. The Table 4 also shows that the share of privateinvestment generated by insurance has a positive and significant effect oneconomic growth.Thus, a 1% increase in the investments made in the privatesector by insurance firms leads to a 0.09% increase in economic growth.This result validates the hypothesis that insurance contributes to economicgrowth through private investment. This result is consistent with the workof Alhassan and Fiador (2014).In order to verify the robustness of this result,we regressed the same growth model by the 2SLS method with instrumentalvariables. This estimate shows results similar to those of GMMs except forthe Trade variable which is significant in the GMM estimate and notsignificant in the 2SLS estimate.
7. CONCLUSION
The studies of the impact of insurance on the economy in African countriesare still scarce. There is a definite limitation in the little research that existson the relationship between the two variables: it is about the unexploredimpact of the investments made in the private sector by insurancecompanies on the economy. However, most of these companies make short,medium and long term investments in private companies or in the financialmarket.It is in this context that we explored the existence of an indirectrelationship between insurance and economic growth through the channelof private investment in Cameroon. Using the GLS method allowed us todetermine the share of private investment generated by insurance.Thisvariable was then used in the growth model as an insurance proxy. Theuse of the GMM method indicates that insurance has a positive impact oneconomic growth in Cameroon, thus materializing that private investmentis a transmission channel between insurance and economic growth. Theuse of the Two Stages least squares method to test the robustness helped toconfirm this result. Therefore, the Cameroonian government mustimplement effective economic policies to stimulate the increase in the levelof income, which will lead to greater underwriting of insurance products.

32 Journal of Asian Economics, Accounting and Finance © 2020 ESI
It must put in place mechanisms to further encourage private investment.Insurance companies should also and above all make citizens more awareor educate them about the importance of taking out insurance.
References
ADI, (2017). African Development Indicators. https://datacatalog.worldbank.org/dataset/africadevelopmentindicators.
Alhassan, A. L., (2016). ”Insurance market development and economic growth: Exploringcausality in 8 selected African countries”, International Journal of Social Economics, Vol.43, No.
3, pp. 1–26.
Alhassan, A. L. and V. Fiador, (2014). “Insurancegrowth nexus in Ghana: An autoregressivedistributed lag bounds cointegration approach”, Review of Development Finance, Vol. 4,pp. 8396.doi:10.1016/j.rdf.2014.05.003.
Arena, M., (2008). ”Does insurance market promote economic growth? A crosscountrystudy for industrialized and developing countries”, Journal of Risk and Insurance, Vol.75, pp. 921–946.
Cambos, N. and Y. Kino Shita, (2002). “Foreign direct investment and technologytransferred: some panel evidence from the transition economies”, Manchester School,Vol. 70, No. 3, pp. 398–419.
FANAF, (2017). “La Fédération des Sociétés d’Assurances de Droit NationalAfricaines”.http://fanaf.org/article/actualites1/documentassembleegeneraledelafanaf2017marrakechdu13au16fevrier2017556/.
Ghimire, R., (2014). ”Contribution of insurance industries in economic development ofNepal”, Reflection, 5 . Retrieved from http://papers.ssrn.com/sol3/papers.cfm?abstract_id=2399986.
Jouini, J., (2015). ”Linkage between international trade and economic growth in GCCcountries: empirical evidence from PMG estimation approach”, Journal of InternationalTrade and Economic Development, Vol. 24, No. 3, pp. 341–372.
Kjosevski, J., (2011). ”Impact of insurance on economic growth: The case of Republic ofMacedonia”, European Journal of Business and Economics, Vol. 4, pp. 34–39.
Kugler, M. and R. Ofoghi, (2005). “Does Insurance Promote Economic Growth? Evidencefrom the UK”, Paper presented at the Money Macro and Finance (MMF) ResearchGroup Conference. United Kingdom.
Lee, H., Z. Yong and Q. LIM, (2018). ”Insurance development and economic growth”,Financial Statistical Journal, Vol 1, No. 2018, pp. 117.
Mojekwu, J. N., S.O.N., Agwuegbo and F. F. Olowokudje, (2011). “The impact of insurancecontribution to economic growth in Nigeria”, Journal of Economics and InternationalFinance, Vol. 3, pp. 444–451.
Olayungbo, D. O. and A. E. Akinlo, (2016). ”Insurance penetration and economic growthin Africa: Dynamic effects analysis using Bayesian TVPVAR approach”, CogentEconomics & Finance, Vol. 4 , No. 1 , pp. 119. http://dx.doi.org/10.1080/23322039.2016.1150390.
Omoke, P. C., (2012). ”Insurance market activity and economic growth: Evidence fromNigeria”, Asian Economic and Financial Review, Vol. 1, pp. 245–253.

Growth Effect of Investments Made by Insurance Firms in the Private Sector 33
Puatwoe, J. T. and S. M., Piabuo, (2017). “Financial sector development and economicgrowth: Evidence from Cameroon”, Financial Innovation, Vol 3, No. 25, pp. 125.
SwissRe, S., (2016). ”World insurance in 2015: Steady growth amid regional disparities”.Retrieved from: Switzerland. http://www.tsb.org .tr/images/Documents/sigma_3_2016_en.pdf.
World Bank, (2017). World Development Indicators. Washington DC: World Bank.
To cite this article:
Guivis Zeufack Nkemgha & Armel Peuwo Djouaka. Growth effect of Investments madeby Insurance Firms in the Private Sector: Evidence from Cameroon. Journal of AsianEconomics, Accounting and Finance, Vol. 1, No. 1, 2020, pp. 2333

FISCAL POLICY DISTURBANCE IN INDIA:AN APPLICATION OF SVAR MODEL
A. Abdul Raheem and Ibrahim Nurudeen1Associate Professor, Department of Economics, The New College (Autonomous), Chennai-14E-mail: [email protected] Professor, Department of Economics and Business Studies, Usman Danfodio University,Shehu Shagari College of Education, P.M.B: 2129, Sokoto, Sokoto state, NigeriaE-mail : [email protected]
Received: 10 April 2020; Revised: 17 May 2020; Accepted: 20 May 2020; Online: 22 June 2020
Abstract: This paper Investigate an Impact of fiscal policy shock on unemployment and growthin India using a structural vector autoregressive model. A recursive restriction is employed(suggested by Sims, 1980) for identifying restrictions under the Keynesian framework. Accordingto Keynes, government intervention will instantaneously affect unemployment which in turn createdemand and subsequently lead to growth and development of a nation. To find this fact, we usegovernment expenditure as policy variable, unemployment and GDP as response variables. Theresult reveals that, a shock from government expenditure does not affect unemploymentinstantaneously, but has an instantaneous impact on GDP. Looking at the impulses of the structuraldecomposition, we observe that the fiscal policy shock to unemployment exhibit a long and lastingdeclining effect. Similarly, the response of GDP to fiscal policy shock shows positive behavior.
1. INTRODUCTION
The fiscal policy deals with the taxation and expenditure duties of thegovernment. The monetary policy deals with the supply of money in theeconomy and the rate of interest. These are the main policy approachesused by policy makers in driving the affairs of the economy. (Supriyo 2012)
Government influences economy either through monetary and fiscalpolicies. Keynes during the great depression of 1930, expatriates on theimportance of government intervention in the economy. According to him,government influences the economy through revenue collection (taxes)and expenditure (spending) to stabilize the economy. During greatdepression most existing theories failed and could not provides an answerto the economic hullabaloo that was experienced throughout the world,most of the great economy collapsed, businesses closed down.
Keynes argued that inadequate overall demand could lead toprolonged periods of high unemployment. An economy’s output of goodsand services is the sum of four components: consumption, investment,
Journal of Asian Economics, Accounting and FinanceVol. 1, No. 1, 2020, 35-43© ESI Publications. All Right ReservedURL : www.esijournals.com

36 Journal of Asian Economics, Accounting and Finance © 2020 ESI
government purchases, and net exports (the difference between what acountry sells to and buys from foreign countries). Any increase in demandhas to come from one of these four components. But during a recession,strong forces often dampen demand as spending goes down. For example,during economic downturns uncertainty often erodes consumer confidence,causing them to reduce their spending, especially on discretionary purchaseslike a house or a car. This reduction in spending by consumers can result inless investment spending by businesses, as firms respond to weakeneddemand for their products. This puts the task of increasing output on theshoulders of the government. According to Keynesian economics, stateintervention is necessary to moderate the booms and busts in economicactivity, otherwise known as the business cycle. (Sarwat Jahan 2004).
In the Indian context, the role of the fiscal policies cannot be overemphasis, the preliminary years of India’s planned development strategywere characterized by a conventional fiscal policy whereby deficits werekept under control. The tax system was meant to transfer resources fromthe private sector to fund the large public sector driven industrializationprocess and also cover social welfare schemes.
However, growth was feeble and the system was prone to inefficiencies.In the 1980s some attempts were made to reform particular sectors. But thepublic debt increased, as did the fiscal deficit.
India’s balance of payments crisis of 1991 led to economic liberalization.The reform of the tax system commenced. The fiscal deficit was broughtunder control. When the deficit and debt situation again threatened to goout of control in the early 2000s, fiscal discipline legalizations wereinstituted. The deficit was brought under control and by 200708 a benignmacrofiscal situation with high growth and moderate inflation prevailed.During the global financial crisis, fiscal policy responded with countercyclical measures including tax cuts and increases in expenditures. Thepostcrisis recovery of the Indian economy is witnessing a correction ofthe fiscal policy path towards a regime of prudence. (Supriyo 2012).
This main contribution of this research work is to find out thedisturbances fiscal policy exerts in the Indian Economy, according to keynesgovernment spending will impact the economy, on this note, our policyvariable is the government spending, and its impact has been studied onunemployment and GDP of India.
Fiscal Trends and Fiscal Stabilization in India
The government budget is an itemized accounting of the payments receivedby the government through (taxes and other fees) and the payments made

Fiscal Policy Disturbance in India: An Application of SVAR Model 37
by government through (purchases and transfer payments). A budget issaid to be a deficit when the government spending more than the paymentsit received.
The trends of the government fiscal outfits before liberalization.During this period the India economy was somehow conservative innature, between 19801981, the gross fiscal deficit was around 5.55 andthe revenue deficit was as much as 1.36, it kept soaring year by year, itbecame worse during 19841985 when gross deficit grew to 6.7 andrevenue deficit was 1.65 due to the withdrawer of investment fund fromthe economy and the hike in the price of petroleum products. The situationbecame worse with the Golf war which led to the rise in oil prices. Thecountry foreign exchange faces downward trends and the reserves couldonly finance the import for few weeks. During this period India has nochoice left than to solicited for the fund from IMF to avoid default in itsresponsibilities. The then prime minister Narasimha Rao brings to thelight of the day in which liberalization of the economy became a realityand the economy was open to the foreign investment and trades, theprivate sector was given a chance and the system of quota and licenceswere eroded. Also, both direct and indirect taxes were brought underreview and disinvestment was introduced.
The new economic policy of 1991 could be classified into three majorcategories namely, Liberalisation, Privatisation and Globalisationrespectively. Liberalisation depicts many industries were free from rigorouslicencing requirements. Free determination of investment rate bycommercial banks and eradication of restrictive trades practices. In thearea of privatisation, most of the government investment was left in thehands of the private sector to manage. In the area of globalisation,favourable tariffs and an increase in the limit of foreign investment wereintroduced. During this time government introduced tax reform in taxstructure and also reduced subsidies simultaneously to the barest minimum.The reforms were calibrated to bring about revenue neutrality in the shortterm and to enhance revenue productivity of the tax system in the mediumand long term. The main idea was to decrease the share of trade taxes intotal tax revenue, increase the share of domestic consumption taxes bytransforming the domestic excises into a VAT and increase the relativecontribution of direct taxes. the overall trade deficit for April May 201718is estimated at US$ 21408.91 million as compared to US$ 5392.77 millionduring AprilMay 201617 (Sonika, Kalpana 2016).
The new tax reform that was recently announced by the governmentof India, the introduction of goods and services tax (GST) which replaced
38 Journal of Asian Economics, Accounting and Finance © 2020 ESI
multiple cascading taxes levied by the central and state government. Itwas introduced as the Constitution (One Hundred and First Amendment)Act 2017, following the passage of Constitution 122nd Amendment Bill. Mosteconomists are of the view that the fiscal policy will strengthen the Indiaeconomy in the long run though will spike the prices of goods and servicesin the short run and it’s believed that introduction of goods and servicestax would enhance the country tax structure.
The introduction of GST would make India more business friendlyand it would promote competition among business owners which maydish out some benefits to the consumers. It may lead to increase ingovernment revenue which may, in turn, promote infrastructuraldevelopment in the country. Goods and services tax may potentially makethe export from India more competitive in international market and mayhelp India to have a common unified market as this will enhance the freeflow of goods and services across the country.
2. EMPIRICAL LITERATURE REVIEW
There are two very important issues in the literature of fiscal policy. One isthe effectiveness of fiscal policy in terms of stabilizing the economy. Seefor example, a debate (Monetary Vs fiscal policy, 1968) between MiltonFriedman and Walter Heller. Walter who was a proponent of fiscal policysees it as an effective tool for stabilizing the economy, he cited manyexamples which prove that the fiscal policy is indeed an effective tool thatcan be used to stabilize the economy, he argues among others that the US1964 tax cut was a good example of how it helped in stabilizing the economicactivities. Moreover, Keynes also shared the same view in the sense that,when there was great depression in 1930’s, keynes advocated for agovernment intervention in order to restore economy back to its normalshape.
Secondly, most of the economists believe that there is no exact knownimpact of fiscal policy on macroeconomic variables, hence the need to checkfor the dynamic effect of the fiscal policy empirically. Many works havebeen carried out related to the second aspect. Similarly, many of the workstried to find out the dynamic effect using Vector auto regressionmethodology. For example Fatas and Mihov (1998), studied the dynamicimpact of fiscal policy on macroeconomic variables, using the vectorautoregression. the paper find that, positive innovation in governmentspending are followed by strong and persistent increase in consumptionand employment. In the same vein, Perroti (2004), conducted a similar studyusing the same methodology conducted for OECD countries which include

Fiscal Policy Disturbance in India: An Application of SVAR Model 39
Germnay, UK, Canada, US, and Australia. Some of the findings of thatpaper reveal that, the estimated effect of fiscal policy in GDP is small. Again,the effect of government spending shock and tax cuts on GDP and itscomponents have become substantially weaker over time.
The main significance of government expenditure is to createemployment and consequently increase in consumption. To some economist(while some view the opposite), thus a positive shock in governmentspending is expected to have an instantaneous impact on employment andconsumption, this coincided with the findings of Fatas and Milhov (1998).While this study find a positive correlation that exist between governmentspending, consumption and employment, some studies find the oppositefor example (Attahir, 2016).
Other contributions related to the dynamic effects of fiscal policyinclude, the works of Ramey and Shapiro (2005), Blanchard and Perotti(1998), Burnside, Eichenbaum, and Fisher (2001), Gali, Salido, and Valles(2004), Rebei (2004), Gavallo (2005), Ramey (2006), Ramey (2007), and Yangi,Fidrmuc and Ghosh (2015).
This reserch work contributed to the literature of the second argument.it discusses the fiscal policy disturbances in India, according to keynesgovernment spending will impact the economy, on this note, our policyvariable is the government spending, and its impact has been studied onunemployment and GDP of India.
3. METHODOLOGY
This paper uses annual data of GDP, unemployment, and governmentexpenditure of India, spanning from 1980 to 2015. The research employeda structural vector autoregressive Model (SVAR) for the analysis. Arecursive restriction procedure is hereby used suggested by Sims (1980).Matrix A measures the instantaneous responses of the series within thesystem and is made a diagonal matrix so as to retrieve the response of theseries individually. The B matrix is made as an upper triangular in termsrestrictions.
Theoretically, the model is explained as below. Consider the followingSVAR equation.
� � ettLt ������ � (1)
Where A is NxN contemporaneous impact matrix which measures thesimultaneous response of the variables within the system, B is also an NxNmatrix and it represent the instantaneous impact of the structural shocks.

40 Journal of Asian Economics, Accounting and Finance © 2020 ESI
Yt is Nx1 vector of endogenous variables. The term �(L)Yt represent thedynamics component of the explanatory variables and et is an Nx1 vectorof structural shocks. Diving both side of equation (1) by A gives the reducedform of equation
t� � � (L) Utt �� (2)
Above is the reduce form equation and Yt is a 4x1 vector ofendogenous variables which contain unemployment, GDP andGovernment Expenditure. Now we need to equate reduced form equationwith structural form equation, this will enable us to retrieve the structuralform shock from the form shock. In this way we need to imposerestrictions to either make our equation either over identified or exactlyidentified. We therefore need 9 restrictions to make the model exactlyidentified.
���
�
�
���
�
�
333231
232221
131211
aaa
aaa
aaa
�����
�
�
�����
�
�
gt
ut
gvt
u
u
u
=���
�
�
���
�
�
333231
232221
131211
bbb
bbb
bbb
���
�
�
���
�
�
g
t
ut
gt
e
e
e
(3)
���
�
�
���
�
�
100
010
001
���
�
�
���
�
�
g
g
t
ut
t
u
u
u
=���
�
�
���
�
�
333231
2221
11
0
00
bbb
bb
b
���
�
�
���
�
�
gt
ut
gt
e
e
e
(4)
Equation 4 contains the restriction imposed on equation 3. Andtherefore, now, we equate reduced form shock with the structural formshock. The following is the resultant matrix.
gvtu = 11b g
te (5)
utu = 21b g
te + 22b ute (6)
gtu = 31b ++ (7)
Government expenditure is assumed to respond to its selfcontemporaneously in the first equation. In uquation (6), we assumegovernment expenditure as well as unemployment tp respond immediatewhile GDP to respond with lags. In equation (7), all variables are expectedto respond instantaneously.

Fiscal Policy Disturbance in India: An Application of SVAR Model 41
Table 1: A Contemporaneous Response of Government Expenditure,Unemployment and GDP
1 0 0
0 1 0
0 0 1
C(1) 0 0
C(2) C(4) 0
C(3) C(5) C(6)
Coefficient Std. Error zStatistic Prob.
C(1) 231.9938 32.17175 7.211103 0.0000
C(2) 0.544666 0.514157 1.059337 0.2894
C(3) 0.727025 0.384158 1.892514 0.0584
C(4) 2.593256 0.359620 7.211103 0.0000
C(5) 0.287466 0.368543 0.780006 0.4354
C(6) 1.868181 0.259070 7.211103 0.0000
Table 1 presents a contemporaneous response of the series. The orderingof the variables is thus, Government expenditure, unemployment, and GDP.In the first equation we assume that a government expenditure respond toits self contemporaneously, while unemployment and GDP respond withlag. Similarly, in the second equation we assume that government expenditureand unemployment respond to a shock to unemployment, whileunemployment, government expenditure and GDP respond to a shock ingovernment expenditure contemporaneously. All responses are significantexcept the contemporaneous response of unemployment to governmentexpenditure and unemployment to GDP. Since we have seen thecontemporaneous responses of the variables, we are going to see the dynamicresponses by forecasting the future through the structural decomposition ofthe impulses. The figure below presents the impulses.
The above figure presents the impulses generated through a structuraldecomposition. A ten period horizon has been forecasted. The mainobjective of this paper is to find out the fiscal policy shock which thegovernment expenditure on unemployment and GDP. The first box of thesecond row measures how unemployment react to governmentexpenditure. As seen in the diagram the dynamic action of the governmentexpenditure makes unemployment go down. The unemployment waspositive at the beginning but after a second horizon it turned out to benegative, meaning that unemployment has gone down. Similarly, GDP’sresponse exhibit a backward behavior meaning that GDP initially tends togo down but has been negative.

42 Journal of Asian Economics, Accounting and Finance © 2020 ESI
4. CONCLUSION
This study tries to find out the impact of fiscal policy on unemploymentand GDP. We first observe the contemporaneous responses of thesevariables where we find that, unemployment does not respond togovernment expenditure contemporaneously, while GDP respondsinstantaneously. In the forecasted horizon, unemployment did very well.It shows a downward slopping behaviour which means that unemploymentdecreases after a shock comes from the government expenditure. GDPwhich is the end target does not seem to increase but shows a sign of risingat the 10th horizon. To this end, government expenditure in India is notjobless expenditure, unemployment is affected after certain lags thereforegovernment should identify more priority sectors and invest plus, checkout corrupton and mismanagement of public funds so that unemploymentcould have an immediate impact rather taken lag.
References
Blanchard O., and Perroti R. (1998). “An empirical characterization of the dynamic effectsof changes of government spending and taxes on output.
Figure 1.1: Impulses Response Functions

Fiscal Policy Disturbance in India: An Application of SVAR Model 43
Ramey V. A. and Shapiro M.D. (1998). “Costly Capital reallocation and the effects ofgovernment spending.
Burnside C., Eichenbaum M., Fisher J.D.M. (2001). “Assessing the Effects of Fiscal Shocks”.
Perroti (2002). “Estimating the Effects of Fiscal policy in OECD countries” InternationalSeminer on macroeconomics.
Richard H., Michael K. and Selma M. (2002). The effectiveness of fiscal policy in stimulatingeconomic activity – A review of the literature.
Gali J, Salido J. D. L. (2004). “Understanding the effects of government spending onconsumption” International Research forum on monetary policy. Working paper Seriesno.339/April 2004
Reibei N. (2004). “Characterization of the effects of Fiscal policy Shocks in an openeconomy”.
Huw Dixon (2004). Reflections on new Keynesian economics; The role of imperfectioncompetition.
Cavello M. (2005). “Government employment expenditure and the effects of fiscal policyShocks”.
Ramey V. A. (2006, 2007). “Identifying Government Spending Shocks: It’s all in the timing.
Vladimir V. and Maria N. (2008). The stabilizing role of fiscal policy: Theoretical backgroundand empirical evidence.
Seema Sharma (2012). Impact of fiscal policy shocks on the Indian economy.
Yang W. Fidrmuc J. and Ghosh S. (2015). “Using Military Build ups to capture Fiscal Shocks:A reassessment. CEsifo Area conference on Macro, Money and International Finance.
Antonio F. and Ilian M. (2015). The effect of fiscal policy on consumption and employmenttheory and evidence.
Sonika G. and Kalpana S. (2016). Fiscal Deficit and its trends in India.
Tony Makin (2016). The effectiveness of federal fiscal policy: A review of literature.
To cite this article:
A. Abdul Raheem and Ibrahim Nurudeen. Fiscal Policy Disturbance in India: AnApplication of SVAR Model. Journal of Asian Economics, Accounting and Finance, Vol.1, No. 1, 2020, pp. 3543

PRODUCTIVITY ANALYSIS OF MANUFACTURINGINDUSTRY: LESSON LEARN FROM JAPAN
Vanxay Sayavonga
aNational Institute for Economic Research (NIER), Vientiane, Laos.*Correspondence Address: Vanxay Sayavong, KaysonePhomvihane Street, Km 5, Sivilay Village,Saythany District, Vientiane Capital, Laos, E-mail: [email protected]
Received: 24 January 2020; Revised: 22 March 2020; Accepted: 27 May 2020; Online: 22 June 2020
Abstract: This study aims to assess the productivity of the Japanese manufacturing industrybased on the panel data of 871 firms throughout 1985-2007. With panel data and the use of theData Envelopment Analysis (DEA) method, the sources of productivity growth for Japanesefirms can be decomposed and analyzed. The finding reveals that although firms made technologicalprogress boosting the growth of productivity they wereless efficient overtime during the studyperiods, which implies that such technologies were underutilized. The case study of Japan indicatesthat the availability of statistics is essential to improve research on productivity analysis of industriesin other developing countries. Therefore, the statistics on manufacturing industries need to beimproved especially the enterprise survey or Economic Census Survey in developing countries.
Keywords: Japanese economy, manufacturing industry, productivity, efficiency, and scale efficiency
1. INTRODUCTION
The success of Japanese high economic growth after World War II is wellknown in the literature. As a result, Japan becamethe position of the highincome country by taking a short period.According to the World BankDatabase, income per capita of Japan increased for more than 45 timeswithin 30 years or jumped up from 610 US dollars in 1962 to 30,190 USdollars in 1992.Later on, the Japanese growth model had passed to theother East Asian economies (Ito, 1996). Many countries in SoutheastAsianincluding Thailand, Malaysia, Indonesia, Vietnam, Cambodia, andLaoshave also followedthe Japanese growth model. Even though Japan isnow not as used to be, but its past success is worthy to learn. This leads tothe main purpose of this section that reviews Japanduring peak timeespecially the postperiod of World War II to draw out the lesson learnedas well as the drawback for other developing economies.
Japan had enjoyed high economic growth since the late 1950s untilthe1970s with 9 percent annually (Figure 1). The economy of Japan was led bythe manufacturing sector as the productivity growth of this sector in termsof labor productivity was as high as 6.5 percent during 1960s–92, higher
Journal of Asian Economics, Accounting and FinanceVol. 1, No. 1, 2020, 45-60© ESI Publications. All Right ReservedURL : www.esijournals.com

46 Journal of Asian Economics, Accounting and Finance © 2020 ESI
than any other sectors. During this period, the economic structure of Japanhad been changed from basic manufacturing (textiles and toys)to advancedmanufacturing(electronics, steel, and ships) in the 1970s; and moreadvanced manufacturing industries (automobiles and semiconductors) inthe 1980s (Ito, 1996:p.227). Accordingly, the share of the manufacturingsector in GDPbecame larger from 28 percent in 1955 to 38 percent in 1975.In addition, it had contributed about 2.5 percent points to the total economicgrowth of the Japanese economy during 1956?1973. The robust ofmanufacturing industries had alsoenabled the other sectors such asdistribution service, finance, energy, transportation, and construction togrow as well (Takada, 1999).Therefore, it is fairly to conclude that themanufacturing sector is fundamentally central tothe economic growth ofJapan.
The success of the Japanese economy especially manufacturing wasconditional to some favorable conditions. One of them is the Korean Warwhere the exports of Japan had expanded rapidly during the Korean Warin mid of the 1950s to facilitate the US military (Ellington, 2004). This hadencouraged the growth of Japanese manufacturing industries during thistime. The exports included ships, tanks, jeeps, aircraft, textile, metal,chemical, transportation, machinery, and electricity (Sugita, 2003:p.99).Secondly, the competition policy rather than the industrial policy wasbelieved to strengthen the productivity of domestic industries especiallythe automobile and electronics (Hatta, 2017). The competition policies, theestablishment of Fair Trade Commission in 1947 and trade liberalization
Figure 1: Real GDP Growth of Japan (%)
Source: Statistics Bureau, Statistics Japan, Ministry of Internal Affair and Communication. http://www.stat.go.jp/english/data/chouki/03.htm

Productivity Analysis of Manufacturing Industry: Lesson Learn from Japan 47
in the 1960s for instance, had shaped the ways of doing business of privatecompanies to be more competitive internationally. The internaldevelopment of industries such as lifetime employment and the main banksystem wasregarded as main factors for that shape and the expansion ofindustries(Ito, 1996). During the period of economic boom,for instance,Japanese firms formed a longterm relationship withthe guarantee of a jobfor life and rewards in the forms of return and position to their workers.Therefore, workers were willing to work harder. Because of hard work,the productivity of the firms had improved gradually.Similar to the mainbank system where the banks were not just being the lenders but played arole in monitoring the performance of firms as a part of investors.Thesuccessful industries include electronics, automobiles, electrical equipment,and textiles. Whereas industrial policies provided by the Ministry ofInternational Trade and Industry (MITI) such as selective industries andsubsidiesare doubtful because some targeted industries such as coal,petrochemical, oil refining, and aluminum had failed to grow as expected(Ito, 1996: p.226). Other favorable conditions such as high saving rate,education, and monetary policy are also considered but less significant.Therefore, the details for these favorable conditionsare not investigated.
Based on the availability of data since the 1970s, Table 1 indicates thatcapital investment and productivity are the main two sources of Japaneseeconomic growth. After the crisis of oilʹs price in 1973, the economy hadbeen a slowdown and did so productivity. The economy got even worseafter the bubble economy in the early 1990s. The demand shock was claimedas one of the main factors that lead to the slowdown of productivity growthof Japan after 1991, which consequently resulted in labor hoarding, idlingof capital stock, and a decline of return rate on capital (Fukao, 2013). Lateron, the outward of Japanese investment or shifting their production sitesto oversee such as China, Thailand and other countries in Southeast Asia
Table 1: Sources of Growth by Factors (%)
Factor 197080 198090 19902000 20002012
Manhours Growth 0.3 0.4 0.6 0.5
Labor Quality Growth 0.9 0.6 0.5 0.5
Capital Quantity Growth 2.2 1.6 1.0 0.1
Capital Quality Growth 0.5 0.4 0.1 0.1
TFP Growth 1.7 1.3 0.0 0.5
Real GDP Growth 4.6 4.3 1.1 0.7
Source: The Japan Industrial Productivity Database 2015 (JIP Database 2015), Research Instituteof Economy, Trade and Industry (RIETI), Japan. http://www.rieti.go.jp/en/database/JIP2015/index.html.

48 Journal of Asian Economics, Accounting and Finance © 2020 ESI
region was also believed to back upthe decline of Japanese productivity(Saito, 2015). As a result, the spillovers of R&D from large firms to smallerfirms got smaller in Japan since not only their supply chains and factorieswere relocated but also the R&D activities. Fortunately, the productivityand quality of labor had strongly kept the economic growth in recent yearsthanks to the productivity improvement made by large firms.
2. LITERATURE REVIEW
Many studies on industrial and firm productivity were carried in the pastand some are ongoing especially the research program initiatedbyResearchInstitute of Economy, Trade and Industry (RIETI). One of the studies thatis directly related to the area of this research which is the study ofʹExplaining Japanʹs unproductive two decadesʹ byFukao (2013). This studytried to unveil the reasons behind the slowdown of the productivity of theJapanese economy particularly in the manufacturing and nonmanufacturing sectors in the last two decades. The result found that theproductivity (TFP) growth of both sectors had declined after 1991 due todemand shocks leading to labor hoarding and idling of capital stock, adecline of return rate on capital. This is because that capital ratio to GDPhad accelerated but the return rate of capital had dropped at the sametime. The author also claims that the United States had enjoyed highergrowth of return rate of capital and did so the productivity mainly becauseof the acceleration of ICT investment which is contrasted to Japanesecounterpart. Another interesting analysisis that large firms had improvedin productivity in recent years whereas small and medium firms were stillfar behind. Therefore, the gap between the two was getting wider. Thisincidence was explained by the different accumulation of ICT and intangibleinvestment between two groups and fewer spillovers of R&D from largefirms to smaller firms since many large firms have expanded and relocatedtheir supply chains, factories and their R&D activities to oversee. To raiseproductivity in the manufacturing sector, the author suggests that easingthe regional logistics, enhancing tree trade agreement and reducingcorporate tax especially for new Japanese and multilateral businesses areessential.
Similarly, Saito (2015)assesses the current state of the productivity ofthe Japanese manufacturing industry. He found that although theproductivity of the Japanese manufacturing sector (labor productivity) isstillamong top countries in the front stage comparing to other OECDcountries based on the recent report in 2012but the position is not as itused to be in the 1990s.He highlights three causes for the decline of laborproductivity in the manufacturing sector, namely; (1) outward investment

Productivity Analysis of Manufacturing Industry: Lesson Learn from Japan 49
or shifting production sites abroad, (2) high cost of the nonmanufacturingsector, (3) low usage of ICT capital and (4) low turnover rate of unproductivefirms or low rate of introduction of new business a poor indicator of doingbusiness especially starting a business.
Fortunately, the Japanese manufacturing industry is still moreproductive in terms of TFP when compared to Korea and China althoughKorean firms have improved their productivity dramatically during thestudy periods (Fukao et al., 2008). It is because Korean firms especiallynew entries of small and medium firms had overinvested intangible fixedassets and R&D resulting in low return rate to capital and R&D (Kim &Keiki, 2013). When comparing Japanese labor productivity with the UnitedStates, (Fukao, 2007) found that the productivity of the manufacturingindustry in Japan took only onefifth of the United States. The lowproductivity in laborintensive industries such as textileswasclaimed asone of the main reasons attributed to such low labor productivity.
Although the studies reviewed above are informative on Japaneseproductivity analysis, however; the sources of productivity growthareunclearly identified. Unlike, this study attempts to explicitly decomposethe sources of productivity growth for the Japanese manufacturing sectorinto three sources, namely; (1) technological change, (2) efficiency changeand (3) scale efficiency change based on the panel data compiled from thedatabase of EALC 2010.
3. METHODOLOGY
3.1. Theoretical Concept
The aim of this section is to understand the concept of productivity andsources of its change. To do so, this section is principally built on theliterature of Coelli et al. (2005) and Balk (2001). Accordingly, productivityis measured by output per unit of input such as output per worker or aworking hour or per hectare. However, such measurement has limitationssince not only a unit of labour or single input is used to produce theoutputbut, in reality, it also involves factors of capital and materials (Coelliet al., 2005:p. 62). Therefore, output per single unit could lead tomisinterpretation of productivity analysis. Therefore, multifactorproductivity (MFP) or total factor productivity (TFP) are more desirable inuse as an indicator ofproductivity analysis. TFP or MFP is where all inputsare taken into account in measuring productivity. According to (Coelli etal., 2005: p. 62), total factor productivity (TFP) is defined by "a ratio ofaggregate output produced relative to aggregate input used". For instance,

50 Journal of Asian Economics, Accounting and Finance © 2020 ESI
a simple calculation of TFP is via the profitability ratio of a firm by a ratioof revenue (real term) to input cost (real term). Other methods includeHicksMoorsteen TFP (HM TFP) Indexand growth accounting where theformer is to compareoutput growth to input growth.Therefore, when outputgrowth is higher than input growth or HMTFP index is greater than 1 wouldsignal the evidence of productivity improvement. The latter method ispopularly and widely used to separate the sources of output growthnormally into three sources that are from labour growth, capital growthand TFP growth. Nevertheless, thesecalculations are without limitationswhen a further analysis of sourcing the productivityor TFP growth overtimeis made.
Fortunately, followingto Balk (2001), the change of productivitybetween two periods can be breakdown into four sources. These sourcesare (1) technological change (TC), (2) efficiency change (EC), (3) scaleefficiency change (SEC) and (4) output mixed effect (OME) or input mixedeffect (IMO). Since the fourth has to deal with the prices of multiple outputand inputs, onlythe former three are considered as seen in equation 1.
TFP Change = Technical Change * Efficiency Change* Scale Efficiency Change (1)
Where,
• Technological change (TC) refers to the shift in productiontechnology between two periods.
• Efficiency change (EC) exists when a firm can improve productionefficiency between two periods or the ability to use availabletechnology or more efficient use of inputs closer to the technologyfrontier.
• Scale efficiency change (SEC) refers to the improvement (scaleefficiency) in the scale of operations of the firm and its movetowards the technologically optimum scale of operation betweentwo periods.
• Note that the changing productivity and its component are in theform of Malmquist index.
The implicit form of mathematic formulacan be found as:
, 0.5( , ) ( , ) ( , )( , , , )
( , ) ( , ) ( , )
t t ts t o s s o t t o t t
s t s t s s so s s o t t o s s
d x q d x q d x qTFPC x x q q
d x q d x q d x q
0.5[ ( , , ) ( , , )s to s t s o s t sSEC x x q SEC x x q (2)

Productivity Analysis of Manufacturing Industry: Lesson Learn from Japan 51
Where
• TFPCs,t (xs, x
t, q
s, q
t) is TFP change between period S and T
•0.5( , ) ( , )
( , ) ( , )
t to s s o t ts so s s o t t
d x q d x q
d x q d x q is a technological change or
technological progress between period S and T
•( , )
( , )
to t tso s s
d x q
d x q is efficiency change between period S and T
• 0.5[ ( , , ) ( , , )]s to s t s o s t sSEC x x q SEC x x q refers to the scale efficiency
change between period S and T
The explanation of a change foreach componentis given in Figure 2.Figure 2 explains the production function of a firm as an example in twoperiods (S and T) where the vertical axis presents output (q) and thehorizontal axis refers to the input (x). F1 is defined as the production frontieror production technology for the first period (S) and F2 refers to theproduction frontier for the second period (T).
At first, a firm produces an actual output of qs in the first period (S) at
point D by using an input of xs with technology (F1). Similarly, in the second
period (T), an actual output of qt is produced at point E using an input of x
t
Figure 2: Measuring Productivity Change
Source: edited Coelli et al. (2005, p. 71) and Balk (2001, p. 169)
q
qc
qt
qb
qa
qs
xS
xt
x

52 Journal of Asian Economics, Accounting and Finance © 2020 ESI
with technology (F2). Since the actual outputs produced at both periods bythe firm arebelow the potential outputs on productionfrontiers (F1 andF2), output losses due to inefficiency occurin both periods. Then, theefficiency can be measuredin period S and T for the firm. The efficiency
level denoted by ( , )So S Sd x q in period S is
S
a
q Dor
q A and the efficiency
level denoted by ( , )So S Sd x q in period T is .t
c
q Eor
q C Note that the
efficiency lies between 0 and 1 where 1 refers to full efficiency. Thus, theefficiency change (EC) is the ratio of efficiency level in period T to period
Sor .
t
c
s
a
Next, the change of technological progress can be identified as the
change of output due to any changes in technology is b
a
q
q under the choice
of using input xs. If the choice of using input x
t is selected, then productivity
gain due to the technological change can be calculated as .c
b
q
q The
technological change b
a
q
q under the choice of input xs is denoted as
( , )
( , )
to S SSo S S
d x q
d x q and technological change c
b
q
q under the choice of input xt is
denoted as ( , )
.( , )
to t tSo t t
d x q
d x q Since it is difficult to select the choice of using
inputs, an average of these two choices is considered. Therefore,technological change is defined as
0.5 0.5( , ) ( , )
( , ) ( , )
t to S S o t t cbS So S S o t t a b
d x q d x q q qor
d x q d x q q q

Productivity Analysis of Manufacturing Industry: Lesson Learn from Japan 53
For the scale efficiency change, according to (Coelliet al., 2005:p.77),the concept is that "the scale efficiency of a given firm is then measuredusing the output distance of the observed inputoutput vectors relative tothe variable returnstoscale (VRS) frontier and from the cone technologyor the constant returnstoscale (CRS) technology that is generated fromthe observed VRS technology". Under the CRS technology, a firm has fullscale efficiency or equal to 1.
The scale level of efficiency change 0tSEC based on frontier 2 as a
reference defines as
00
0
( , )( , , )
( , )
tt t
t x tS
SE x qSEC x x q
SE x q
*
0
( , )
( , )t t
t
E x qSE
E x q
The scale level of efficiency SoSEC based on frontier 1 as a reference
defines as
00
0
( , )( , , )
( , )
SS t
t S SS
SE x qSEC x x q
SE x q
*
0
( , )
( , )S t
t
E x qSE
E x q
Where,
SE is scale efficiency index
E* is efficiency level under the VRS whereas E is efficiency level under CRSproduction function.
Then, the change of scale efficiency is the average of changes for twomethods as below.
0.5[ ( , , ) ( , , )]S to S t S o S t SSEC x x q SEC x x q
Two approaches are widely applied to estimate the production frontierand components of total factor productivity (TFP) namely DataEnvelopment Analysis (DEA) and Stochastic Frontiers Analysis (SFA).While DEA uses linear programming, the stochastic frontier is dependenton the econometric methodology. In this study, DEA method is used for

54 Journal of Asian Economics, Accounting and Finance © 2020 ESI
the analysis since it provides no requirement of econometric estimation,no need to specify a functional form for the production function, and noneed to conduct a conventional test of hypotheses for the distance functionor frontier (Coelli et al., 2005). Moreover, the estimation can be simplycarried out by DEAP version 2.1. The details of DEA methodcan be referredto as the paper byCoelli (1996) as well as the discussion of differencesbetween two methods on Coelli et al. (2005).
3.2. Data Source
The study applies the panel data of Japan manufacturing firms during 1985–2007 constructed from the East Asian Listed Companies (EALC) Database2010, called EALC 2010. Note that panel data is when several firms (identicalfirms) excluding the existing and new entries are observed over time. EALC2010 is the updated version constructed by a study group comprised ofJapan center for economic research (JCER), Hitotsubashi university centerfor economic institutions (CEI), CENU center for China and Asian Studies,and the center for corporate competitiveness of Seoul National University.The first version is the EALC 2007. The database of EALC 2010 includesJapanese, Chinese, South Korean and Taiwanese firmslisted on the stockexchanges in each country covers different industries includingmanufacturing. It contains the annual capital stock, labor cost, intermediateinput, and production in both real and nominal terms of local currency(Japanese Yen). Note that the real term value is adjusted by the price indexof 2000.Also, labor input in manhours is incorporated. This database ispurposely used to compute the productivity database for internationalcomparison. Fukao et al. (2008)is one of the international comparativestudies that used EALC 2007 to construct and compare TFP levels at theindustrial levels for Japan, South Korea, and China from 1985–2005.
Based on the aim of this study, data on manufacturing industries fromEALC 2010 for Japan is only considered for productivity analysis. The paneldata is constructed for 871 firms over 23 years or during 1985 to 2007. So,there are 20,033 observations in total. Unluckily, the efficiency model cannot be executed due to the unavailable information related to a firmʹscharacteristics and environmental conditions. The statistics on key variablesare summarized in Table 2.
4. EMPIRICAL RESULTS
With richer data of panel, the change of productivity and its componentsat the firm level can be easily estimated. Table 3 shows the result of thegrowth of productivity, technology, efficiency, and scale efficiency. In

Productivity Analysis of Manufacturing Industry: Lesson Learn from Japan 55
general, the total factor productivity of firms had improved by 1.1 percentannually during the study periods. Such improvement was mainly fromthe contribution of technological progress whereas the technical efficiencybrought the productivity downturn and not much contribution from scaleefficiency. In particular, the contribution from technologywasextraordinarily high during the period of 2001?2007 with more than 5percentage points. This should imply that firms had invested more in newtechnologies or innovation such as information communication oftechnology (ICT) or R&D during this period. Following Inoue and Koguchi(2017) and Fukao (2013), the Japanese manufacturing sector especially largefirms had achieved high productivity during 1995?2015 due to theinvestment of ICT capital and intangible investmentinnovative property,software and database.
Table 3: Growth of Productivity and its Components (Mean) in Subperiods
Subperiod Technologies Efficiency Scale Efficiency Total FactorProductivity (TFP)
19861990 0.1% 0.5% 0.2% 0.8%
19911995 1.1% 0.8% 0.2% 0.1%
19962000 1.0% 0.3% 0.4% 1.2%
20012007 6.2% 3.6% 0.2% 2.0%
Mean 2.4% 1.3% 0.0% 1.1%
Note that the annual change is reported in Table 6 in Appendix
Source: Authorʹs estimation
In contrast, firms did poorly in utilizing the technologies, which leadsto a decline of contribution fromthe efficiencycomponent toproductivitygrowth. Such decline was due to low investment in human developmentand organizational structure Fukao (2013). This prevents firms tocatch upto the pace of technological progress.It suggests that to utilize the
Table 2: Statistics Summary for EALC 2010
Variable Obs Mean Std. Dev. Min Max
Output (million Yen) 20,033 158,000,000 479,000,000 132,455 12,400,000,000
Capital (million Yen) 20,033 64,400,000 188,000,000 11,443 3,060,000,000
Material (million Yen) 20,033 127,000,000 395,000,000 294,618 9,910,000,000
Labor (manhours) 20,033 4,972,257 12,000,000 11,052 165,000,000
Source: East Asian Listed Companies (EALC) Database 2010, the Japan Center for EconomicResearch, the Hitotsubashi University Center for Economic Institutions, the CENUCenter for China and Asian Studies, and the Center for Corporate Competitiveness ofSeoul National University

56 Journal of Asian Economics, Accounting and Finance © 2020 ESI
Table 4: Efficiency Level (Mean) by Firms in Subsector during 2003?2007
No. Subsector No. Efficiency Std. Err.Sample Score (TE)
1 Electrical and electronic machinery 78 0.817 0.004
2 Miscellaneous manufacturing 19 0.706 0.018
3 Nonelectrical machinery 26 0.705 0.004
4 Petroleum and coal products 4 0.698 0.041
5 Instruments 5 0.668 0.009
6 Printing, publishing, and allied products 17 0.653 0.015
7 Food and kindred products 9 0.649 0.006
8 Furniture and fixtures 130 0.633 0.011
9 Transportation equipment and ordnance 7 0.624 0.008
10 Lumber and wood products 1 0.622 0.021
11 Apparel 43 0.621 0.010
12 Chemicals 74 0.616 0.004
13 Fabricated metal 45 0.614 0.007
14 Motor vehicles 133 0.614 0.006
15 Rubber and miscellaneous plastics 124 0.612 0.006
16 Leather 68 0.611 0.027
17 Stone, clay, and glass products 19 0.599 0.006
18 Textile mill products 27 0.590 0.015
19 Paper and allied products 31 0.550 0.009
20 Primary metal 11 0.541 0.006
Source: Authorʹs estimation
technologies efficiently, there is a call for firms to invest more in humandevelopment and organizational structure. Figure 5 displays that theefficiency level had declined explicitly from 80 percent in late 1980 to 68percent in the 2000s.The most decline in efficiency during the study
Figure 3: Efficiency Level (Mean) during 19852007
Source: Authorʹs estimate

Productivity Analysis of Manufacturing Industry: Lesson Learn from Japan 57
periodswere firms in industries of wood product, leather, paper and allied,textile mill products, printing and publishing products, primary metal, andinstruments.
Since the decline of technical efficiency is the drawback for productivitygrowth, further informationon efficiency for firms in subsectors shouldbe useful to what extension. Table 4 delivers the report of efficiency levelby ranking for firms in subindustries during 2003–2007. Interesting to knowthat firms in the industries related to electrical and electronic,miscellaneous, nonelectrical machinery, petroleum and coal, instrument,printing and publishing, food, furniture and wood, and transportequipment were among the top ten most efficient. In contrast, firms in theindustries of textile, metal, leather, stone, and glass were the least efficientfirms. Firms in electrical and electronic, miscellaneous, nonelectricalmachinery industries are used to be at the bottom ten of the least efficiencyduring the late 1980s, which implies that firms in these industries hadimproved their managerial and organizational efficiency over time.
Table 5: List of Industries on EALC Database 2010
Indus Code Industry Name
1 Agriculture
2 Coal mining
3 Metal and nonmetallic mining
4 Oil and gas extraction
5 Construction
6 Food and kindred products
7 Textile mill products
8 Apparel
9 Lumber and wood products
10 Furniture and fixtures
11 Paper and allied products
12 Printing, publishing and allied products
13 Chemicals
14 Petroleum and coal products
15 Leather
16 Stone, clay, and glass products
17 Primary metal
18 Fabricated metal
19 Nonelectrical machinery
20 Electrical and electronic machinery
21 Motor vehicles
22 Transportation equipment and ordnance
23 Instruments
contd. table 5

58 Journal of Asian Economics, Accounting and Finance © 2020 ESI
24 Rubber and miscellaneous plastics
25 Miscellaneous manufacturing
26 Transportation
27 Communications
28 Electrical utilities
29 Gas utilities
30 Trade
31 Finance, insurance, and real estate
32 Other private services
33 Public service
Source: East Asian Listed Companies (EALC) Database 2010, the Japan Center for EconomicResearch, the Hitotsubashi University Center for Economic Institutions, the CENUCenter for China and Asian Studies, and the Center for Corporate Competitiveness ofSeoul National University
Table 6: Technology, Efficiency, Scale Efficiency and ProductivityChange (Mean) during 19862007
Year Technological Efficiency Change Scale Efficiency TFP ChangeChange (TC) (EC) Change (SEC) (TFPC)
1985
1986 0.7% 0.4% 1.0% 2.1%
1987 3.1% 2.0% 2.1% 1.0%
1988 0.1% 1.8% 0.5% 2.4%
1989 1.9% 0.0% 0.2% 1.7%
1990 2.2% 1.1% 0.2% 0.8%
1991 0.7% 0.2% 0.4% 0.1%
1992 1.1% 2.1% 0.7% 1.7%
1993 5.9% 4.9% 1.4% 0.6%
1994 0.5% 0.3% 1.5% 1.3%
1995 1.6% 3.0% 0.1% 1.5%
1996 0.7% 1.8% 0.8% 1.9%
1997 3.3% 1.5% 0.9% 0.9%
1998 4.9% 6.5% 0.1% 1.9%
1999 1.1% 2.0% 1.3% 2.2%
2000 1.2% 2.9% 1.1% 2.9%
2001 6.0% 7.3% 0.4% 1.3%
2002 8.6% 5.6% 0.1% 2.7%
2003 1.1% 5.5% 0.1% 4.2%
2004 9.1% 4.1% 1.5% 3.2%
2005 5.0% 2.8% 0.2% 2.3%
2006 6.6% 4.2% 1.0% 1.1%
2007 9.0% 6.8% 0.5% 2.1%
Mean 2.4% 1.3% 0.0% 1.1%
Source: Authorʹs estimation
Indus Code Industry Name

Productivity Analysis of Manufacturing Industry: Lesson Learn from Japan 59
5. CONCLUSION
The experience of Japan shows the manufacturing industry had been theleading driver of economic growth since the early 1950s.Economic reformssuch as competition policy and trade openness were believedto strengthenthe manufacturing industry to become more productive. With rich data,at macro level, the sources of Japanese economic growth could beclassified into (1) labor quantity growth, (2) labor quality growth, (3)capital quantity growth, (4) capital quality growth, and (5) TFP growth.With panel data, at micro level or firmʹs level, the sources of productivitygrowth for Japanese firms can be decomposed and analyzed. The resultindicates that the slowdown of productivity growth was mainly fromthe deterioration of efficiency meaning that Japanese firms were lessefficient since the late 1980s.However, there wasa strong contributionfrom the technological progress made by firms.The most efficient firmsduring 20032007 were in the industries of electrical and electronic,miscellaneous, nonelectrical machinery, petroleum and coal, instrument,printing and publishing, food, furniture and wood, and transportequipment.The case study of Japan has an implication for otherdeveloping countries, to improve research on productivity analysisof themanufacturing industry in their countries in the future, the statistics needto be improved especially the Economic Census Survey and macro data.For instance, the panel data should be developed and more quantitativeinformation on investment in hardware such as machinery, software suchas information communication of technology (ICT), a human resourcesuch as skills of labor, and research & development (R&D) should becaptured in the survey questionnaire.
Acknowledgement
This work is carried out under the Nikkei Asia Scholarship aided by Nikkei Inc. and JapanCenter for Economic Research (JCER). Any views expressed in this paper are those of theauthor only.
Notes
1. The ongoing research program on raising industrial and firm productivity is duringFY 20162019. The competed research program was during FY 20112015. There areseveral research topics under the research program. More details can be found onhttp://www.rieti.go.jp/en/projects/program/pg05/.
2. Note that the notation of technical change is used to refer the technological change insome literature. In this study, they are used interchangeable.
3. Industrial codes of 6 to 25 are only considered. The list of industrial codes can befound in Table 15 in Appendix.

60 Journal of Asian Economics, Accounting and Finance © 2020 ESI
References
Balk, B.M. (2001). Scale efficiency and productivity change. Journal of Productivity Analysis.15, 159183.
Coelli, T.J. (1996). A guide to DEAP Version 2.1: a data envelopment analysis (computer)program.
Coelli, T.J., Rao, D.S.P., Oʹ Donnel, C.J. & Battese, G.E. (2005). An Introduction To Efficiencyand Productivity Analysis. Second. Springer Science and Business Media, Inc.
Ellington, L. (2004). Learning from the Japanese Economy. [Online]. Available from: https://fsilive.s3.uswest1.amazonaws.com/s3fspublic/digest15.pdf.
Fukao, K. (2007). A Longterm Comparison of Productivity in the Manufacturing Industriesof the United States and Japan.
Fukao, K. (2013). Explaining Japanʹs unproductive two decades.
Fukao, K., Inui, T., Kabe, S. & Liu, D. (2008). An international comparison of the TFP levelsof Japanese, South Korean, and Chinese Listed Firms. Seoul Journal of Economics. 21(1).
Hatta, T. (2017). Competition Policy vs. Industrial Policy as a Growth Strategy. [Online].Available from: https://www.eria.org/ERIADP201640.pdf.
Inoue, T. &Koguchi, T. (2017). Japanʹs Nonmanufacturing Sector must seek to utilizeAI&IoTTechnologicaiesbreaking away from Existing Operations is crucial. [Online].Available from: https://www.jcer.or.jp/eng/research/policy.html.
Ito, T. (1996). Japan and the Asian Economies: A "Miracle" in Transition. [Online]. Availablefrom: https://www.brookings.edu/wpcontent/uploads/1996/06/1996b_bpea_ito_weinstein.pdf.
Kim, Y. & Keiki, I. (2013). R&D investment and productivity: a comparative study ofJapanese and Korean firms.
Saito, J. (2015). How productivity is the Japanese manufacturing sector? [Online]. Availablefrom: https://www.jcer.or.jp/eng/research/pdf/saito20150703e.pdf.
Sugita, Y. (2003). Pitfall or Panacea: The Irony of US Power in Occupied Japan 19451952.
Takada, M. (1999). Japanʹs economic miracle: underlying factors and strategies for thegrowth. [Online]. Available from: http://www.lehigh.edu/~rfw1/courses/1999/spring/ir163/Papers/pdf/mat5.pdf.
To cite this article:
Vanxay Sayavong. Productivity Analysis of Manufacturing Indusry: Lesson Learn fromJapan. Journal of Asian Economics, Accounting and Finance, Vol. 1, No. 1, 2020, pp. 4560

SUSTAINABILITY PRACTICES AND PERFORMANCEOF SIERRA LEONEAN DEPOSIT MONEY BANKS
Alpha Bernard Bangura
Department of Accounting, Babcock University, Ilisan-Remo, Ogun State, NigeriaE-mail: [email protected]
Received: 18 May 2020; Revised: 20 May 2020; Accepted: 2 June 2020; Online: 22 June 2020
1. INTRODUCTION
In recent times, firms are faced with heightened demand from regulatorybodies to demonstrate social and environmental responsibility and areexpected to report such information about how they manage social andenvironmental issues. Also, there has been an increased demand onorganizations from the stakeholders to widen the focus of businessperformance beyond financial performance. The major aspects of focus fora bank are profitability and risk; while some banks are interested in fastgrowth and attaining long term objectives, others prefer gradual growthby taking minimal risk that produces returns to shareholders. If the changein stock value does not meet the shareholders expectations, existingshareholders might sell their shares and potential investors might bereluctant to invest making it hard for the bank to raise capital. Banks arethe major players in the financial sector and play the role of facilitatingfinancial activities by creating interaction between borrowers and lenderswithin the economic unit of a nation. The efficiency of a financial system isevident in its level of profitability, the transactions it facilitates betweenlenders and borrowers and the quality of its services to customers overtime. As financial intermediaries, banks play an important role in theoperation of an economy which is equally the case in Sierra Leone whereall other sectors have to interact with banks to carry out their functionseffectively either as a debtor or creditor.
According to Pamane and Vikpossi (2014) the financial system providesthe platform for flow of funds or savings from individuals and companiesto enterprises as well as individuals in need of capital for productiveinvestment. An efficient financial system positions resources to activitiesthat will provide maximum rate of return for the use of the funds. Theseresources enhance economic growth; provide enterprises with the ability
Journal of Asian Economics, Accounting and FinanceVol. 1, No. 1, 2020, 61-118© ESI Publications. All Right ReservedURL : www.esijournals.com

62 Journal of Asian Economics, Accounting and Finance © 2020 ESI
to produce more goods and services and generate jobs. Well performedand formal financial market offer to investors a variety of short and longterm investment instruments by providing qualified financialintermediaries that enable individuals to make reasonable and adequatedecisions about the risks and rewards of investing their funds. Theseinstruments combine risk and returns effectively so that the investors whowish to participate in a wellstructured and appropriate market can do so.
According to International Finance Corporation (2007), sustainabilityis increasingly recognized as central to the growth of emerging marketeconomies. For the private sector, this represents both a demand for greatersocial and environmental responsibility as well as a new landscape ofbusiness opportunity. The financial sector delayed in responding to thistrend but is now emerging as a major driver across all sectors in an economy.In the banking sector, new standards and codes of conduct enhancescorporate accountability, transparency, and consideration of impacts onenvironment and society. The most appropriate means to sustainabilityshould be such that the needs of stakeholders are met while enhancing abusiness’ own operations and bottom line. Identifying and measuring thebenefits of sustainability as a competitiveness strategy is an important partof ensuring longterm commitment from shareholders and otherstakeholders. The focus area for financial institutions in the current businessworld has expanded to include safeguarding the environment,accommodation of underprivileged groups and taking cognizance of othersocial issues that relates to labor practices, protection of indigenouspopulations, and upholding cultural heritage. In order to create sustainablevalues, it is expected of banks to create a system that effectively managessocial and environmental issues and the associated risk as there is need forbanks to adopt sustainable strategies given that risk consideration by itselfdoes not enhance value creation in terms of profit and new market coverage.
According to Jeucken and Bouma (1999) banks are major players inenhancing sustainable development and their intermediary role can bequalified as both qualitative and quantitative while they fostersustainability by improving inhouse environmental and socialperformance, they also do so by weighing risks and attaching prices tothese risks through efficient credit approval system and also by developingsustainable products such as investing funds in socially responsibleopportunities. On the other hand, the use of resources such as energy, waterand paper in banks and for operations also impacts in no small way becausebanks often operate extensive network of branches hence have significantimpact on carbon footprint based on nonrenewable energy consumptions.As a consequence of this reality, the financial sectors in few African, Asian

Sustainability Practices and Performance of Sierra Leonean Deposit Money Banks 63
and South American countries have come up with sustainability policiesregulating or guiding the activities of banks within their territories. Thecountries are Sierra Leone and Kenya in Africa, China, Bangladesh,Indonesia, Mongolia and Vietnam in Asia, as well as Brazil, Peru andColombia in South America (International Finance Corporation, 2016).
The development of sustainability is seen because banks are now beingheld accountable for the impacts of their activities particularly the effects ofloans and investments in the society (Coulson, 2009) thereby influencing theenvironmental influence of businesses on one hand and on the other fosteringsustainable development through inclusion (Klein & Mayer, 2011). This alignswith the strategy of sustainable financing as it pertains to the effect of capitalthrough which loans are created and investments are made (Sachs & SchmidtTraub, 2014). This development highlights the fact that funds made availableby financial institutions of which banks are key players, acts as a correctivetool for better sustainability through the formulation of appropriate policiesor regulations that govern its provision and flow.
Equally addressed by these sustainability policies is to show howimpactful the channeling of funds for sustainable activities can be ratherthan just for speculative, precautionary or transaction motives. Financialinstitutions particularly banks could face consequences for both internaland external environmental issues as well as social issues. While internalenvironmental and social sustainability issues could increase costs ofoperations and litigation costs respectively based on law cases against themby staff, external environmental issues leading to damage of collateralsused to secure credit facilities pose as a source of systematic credit risk(Weber, 2012) that goes a long way in affecting a bank’s profitability andimpacts heavily on investors owing to reduced return on investment (ROI)due to increased provisioning for bad loans. Given their nature as financialintermediaries, responsible enterprise takes on a specific form for banks.The impact of banks is not only measured through direct operations inoffices and branches, but also through investments, which can lead toinvolvement in unsustainable practices. As banks often provide the majorityof external finance to companies, they can require firms to embracesustainable business models. Bank lending potentially has more impacton sustainable business practices compared to the stock market (Scholtens,2006).
Akingunola, Adekunle and Adedipe (2013) stated that the performanceof banks is evident in their operations, activities and management. Also,beyond the services and products of the bank, performance depends on itsoperational environment. Bank performance means the adoption of a set

64 Journal of Asian Economics, Accounting and Finance © 2020 ESI
of indicators which are pointers of the bank’s current status and the extentof its ability to achieve its desired objectives. This is important as the bankingsector efficiency is considered a vital segment of a modern economy andshould be thoroughly evaluated and scrutinized to safeguard thecontinuous survival of the financial system and the economy as a whole.Banks provide and render a range of products and services to theircustomers, both individuals and business concerns with little or nodifferentiation in the products and services offered by the various banksas the products and services are similar. Therefore, it is imperative toevaluate the performance and determine the contribution of banksindividually as compared to the contribution of the banking sector as awhole to business development as it is inevitable for banks to continue toattract significant attention from the public and scrutiny by financialregulators. Sustainability of banks is a focus area not just to the regulatorybodies but the management and clients of the banks as well as the societyat large (Rengasamy, 2012).
This study is focused on providing empirical evidence as to the extentto which the commitment to sustainable practices affects the performanceof banks.
1.1. Statement of the Problem
The research problem of this study is coined from the adoption of the SierraLeonean Sustainable Banking Principles (NSBPs) by banks. The earningsand profitability profile of a bank reflect its ability to carry out present andfuture operations, absorb future contingent shocks and strengthen resiliencecapacity. More specifically, this determines the capacity to absorb losses,finance its expansion and pay adequate dividends to its shareholders.Although there are various indicators of earning and profitability, the mostwidely used indicator is return on assets (ROA) alongside return on equity(ROE) and net interest margin (NIM) (Islam, Siddiqui, Hossain, & Karim,2014). Despite the commitment of banks to sustainability, there are no keysuccess factors in place to evaluate the impact of their sustainable bankingefforts. The main challenges for sustainable banking are budget limitations,the struggle of linking realized benefits with sustainable banking activitiesand also the challenge of limited execution of sustainable banking due toinadequate budget and competing internal priorities (Deloitte 2017).
The return on equity (ROE) is a measure of shareholders returns basedon the performance of a firm. Banks that depend more on deposits andborrowings are likely to achieve a higher ROE than banks that rely moreon shareholders’ funds. The rate of return on equity is a measure of the

Sustainability Practices and Performance of Sierra Leonean Deposit Money Banks 65
profit shareholders earn from employing their investment in the capital ofan organization (Gibson, 2013). Weber and Oni (2015) stated that the mainargument for integrating sustainability into financial sector regulations isthat addressing sustainability issues increases the financial stability andfinancial success of the banking sector. One of the top sustainabilitypriorities for banks is financial inclusion given their inherent strategy ofincreasing their number of banking customers. Financial inclusion is knownto have implications for monetary and financial stability that form the coreof central banking and is being considered as a critical element that makesgrowth inclusive as access to finance can enable economic agents to makelonger term consumption and investment decisions, participate inproductive activities, as well as cope with unexpected short term shocks(Park and Mercado, 2015).
Lassala (2017) stated that in some industries, return on asset (ROA) is aconcern for companies with leverage to reduce cost of debt resulting fromtheir sustainability profile. Companies who show responsibility towardsenvironmental and social issues tend to be at an economic advantage. Oneof the top sustainability initiatives is women empowerment which is believedto enhance gender equality, poverty reduction and economic growth.Mckinsey (2007) opined that gender diversity helps brings employees,shareholders and customers closer which potentially improves employeemotivation, customers satisfaction and corporate brand image. Aside fromthe legislative pressure, since as a norm most of the businesses are in theprocess of incorporating sustainability reporting, this has created a peerpressure on the other companies operating in the industry as research hasshown that the stakeholders could while rewarding the corporations thatdisclose sustainable activities, corporations that do not disclose will be at adisadvantage on a social perspective (Hewapathirana, 2014).
Net interest margin (NIM) stems mainly from deposits and loans whichare the traditional activities of banks. Nguyen (2012) argued that banksincrease in nontraditional activities is associated with reduction in netinterest margin and decrease in nontraditional activities is associated withincrease in net interest margin. A number of banks declined clients’ accessto funds because of the potential E & S risk while some banksimposedcriteria to minimize the potential risk before granting access to funds whichshows that banks have a high level of commitment towards E & S issues.External environmental and social issues can also lead to litigation and actas reputational risks to the bank. Lubber (2013) opined that with theeconomic risks of climate change, water scarcity and other sustainabilityissues rising, and the opportunities in solutions and adaptation growing,investors must begin to include climate and other sustainability risks into

66 Journal of Asian Economics, Accounting and Finance © 2020 ESI
investment analysis if they are to meet their obligations to futurebeneficiaries. Contrary to general view, returns do not have to be cut downin order to achieve sustainability when investing; many funds have met orexceeded their targets over time. However, while some experiencedimproved performance others had a decline but many investors haveconcluded and generalized wrongly that sustainability and maximalperformance cannot be achieved at the same time.
Though, there have been quite a number of studies focusing onsustainability practices and performance of banks, most of it focused onbanks outside Sierra Leone and the few done in Sierra Leone did notconsider how the sustainability practices affects bank performance. Hence,there is need for extensive study of how sustainability practices affectperformance in Sierra Leonean deposit money banks which is what thisstudy is set out to achieve.
2. REVIEW OF LITERATURE
2.1. Conceptual Review
2.1.1. Performance Evaluation
There is increasing focus on sustainable business practices and performancein banks and a corresponding interest among investors and regulatorybodies. European Central Bank (2010) stated that irrespective of the growingcomplexity in the banking sector, their key performance indicators remainearnings, efficiency, risktaking and leverage. As much as a bank is expectedto generate earnings, it is also imperative to consider the associated volatilityof those earnings. Efficiency is the bank’s ability to generate revenue froma given amount of assets and to make profit from a given source of incomewhile risktaking is reflected in the necessary adjustments to earnings forthe undertaken risks to generate them (e.g. creditrisk cost over the cycle).Wigwe (2016) stated that sustainability is about responsible businesspractices and community investment with primary focus on health, arts,sports, education, gender empowerment and the environment. SierraLeonean banking industry’s attitude towards the adoption of sustainabilityis progressive and evolving. Most institutions are showing commitment tosustainability as a strategy, practice or set of activities, offering opportunitiesto manage risks, explore opportunities and adapt to changing business.For a successful and genuine commitment to sustainability, society at largehas to provide an enabling environment in which it can thrive.
According to Oh, Hong and Hwang (2017), the global advancementexperienced in the business world and the growing demand of stakeholders

Sustainability Practices and Performance of Sierra Leonean Deposit Money Banks 67
for social commitment and transparency, has resulted in the adoption ofsocial, environmental, and economic actions on the part of the companies;which are activities perceived to result in improved reputation, corporateimage and are considered to be key consideration for companies in responseto society’s demands. Given the dynamic and complex nature of today’sbusiness environment, it is very likely that business sustainability derivedfrom the practice of its social responsibility will influence financialperformance. According to Aggarwal (2013), the inclusion of sustainabilityassessment in the main strategies of companies can generate strategicbenefits that contribute to value creation. Deloitte (2017) stated thatsustainable banking integrates environmental, social and governance (ESG)criteria into historical banking, and sets ESG benefits as a key objective.He further stated that capital market decisions used to be based on a twodimensional risk and return analysis but within the new era of sustainablebanking, they are now based on three dimensions: risk, return andimpacts. Banking institutions implement sustainable banking both in theirinternal daily operations (in terms of how they manage their physicalbranches/locations, human capital, costs, opportunities, risks exposures)and their activities relating to external interactions with their clients andthe types of projects they fund. Studies by the International FinanceCorporation (IFC) have revealed that that there are several benefits bankshave obtained from incorporating sustainability into their strategy andbusiness practices, ranging from improved reputation to improved investorconfidence.
According to United Nations Environment Programme (2015),sustainable development requires changes in the deployment and relativevalue of financial assets and their relationship to the creation, stewardshipand productivity of real wealth. A sustainable financial system is, therefore,one that creates, values, and transacts financial assets, in ways that shapereal wealth to serve the longterm needs of an inclusive, environmentallysustainable economy. Also, the sustainability of the banking sector isreflected in the quality and value of customers’ products and services. Byincorporating sustainability principles into corporate strategy financingdecisions and product/service creation processes, banks can be outstandingin providing support and promoting environmentally and sociallyresponsible projects and enterprises. Innovative products and services thattarget certain populations (e.g. women) or that encourage purchase of greenproducts (e.g. green credit cards) go a long way to promoting sustainablepractices. Sustainability is a commitment to economic wellbeing for boththe present and the future, balancing society’s needs today with thedemands of tomorrow; it encompasses behaviors, processes, tools and

68 Journal of Asian Economics, Accounting and Finance © 2020 ESI
technologies that can be perpetuated and replicated in ways that achieveeconomic, social or environmental benefits (Stanley, 2015).
2.1.2. Performance Measures for Financial Institutions
According to Ebrahim, Abdullah and Faudziah (2014), there are a numberof performance measures for banks used by academics and practitionersalike, which can be divided into traditional, economic and marketbasedmeasures of performance.
2.1.2.1. Traditional Measures of Performance
These are performance measures applied across industries and sectors.These include; return on assets, return on equity and costtoincome ratiowhich are the most commonly used. Given the unique intermediationfunction for banks, net interest margin is equally monitored. The returnon assets (ROA) is the net income for the year as a percentage of totalassets in that same year. Return on equity (ROE) is a performance measureof shareholders value used internally, and it is the most widely usedmeasure of performance given that:
(i) it gives a direct evaluation of the financial return on shareholders’investment;
(ii) it is readily available for analysts who rely solely on publicinformation; and
(iii) it is comparable among companies and different sectors of theeconomy.
2.1.2.2. Economic measures of performance
According to Kimball (1998), the economic performance measures takesinto cognizance the creation of shareholders value and is used to assessthe economic value generated by a company from its economic assets (aspart of its balance sheet) in a particular year. These measures focus moreon efficiency as the major element of performance and generally requirehigh levels of information. There are two major indicators of economicperformance among others:
(i) Economic value added (EVA) developed by Stern and Stewart in1991. It is an indicator that relates to the total return of an investmentand takes into account the opportunity cost of shareholders holdingequity in a bank by measuring and comparing the economic rategenerated by a company and the cost of capital invested in orderto increase the market value of the company.
Sustainability Practices and Performance of Sierra Leonean Deposit Money Banks 69
(ii) For a bank to be successful in its operations, managers mustevaluate the intrinsic tradeoffs between growths, return and risk;favoring the adoption of riskadjusted metrics (RAROC) whichallows banks to allocate capital to specific business units accordingto their specific business risk.
2.1.2.3. Marketbased measures of performance
According to European Central Bank (2010) these are measures ofperformance that characterize the way the capital markets value the activityof any given company, compared with its estimated accounting or economicvalue. The most commonly used measures include:
(i) Total share return which is dividends as a ratio of the differencebetween share value and market share price
(ii) Priceearnings ratio (P/E) is the ratio of a company’s earnings overits share price;
(iii) Pricetobook value (P/B) which relates the market price ofshareholders’ equity to its book value;
(iv) Credit default swap (CDS) which is the cost of insuring theunsecured bond of an institution for a given period of time.
2.1.3. Sustainability
Upon the creation of the concept sustainable development by Brundtlandcommittee in 1987, they came up with the main objective of this concept,which is to meet the needs and demands of the present society withoutaffecting the energy of the next community when it comes to securing itsneeds and requirements. Sustainability is defined as the ability of aninstitution to engage in additional activities that drives it towards adaptingto events and changes relating to economic, social and ecologicalenvironment, and the management of resulting risk. This ability is evidentin the public image and presence of the institution, as well as its acceptanceand utilization of opportunities, which enhances creativity, innovation andits ability to cope with the flow of internal and external environment (Bansal& Ivey, 2013). A number of international institutions have definedsustainable development; Organization for Economic Cooperation andDevelopment (OECD) sees sustainable development as an economicadvancement based on realizing net returns and profits through activitiesthat preserve environmental and social systems in an interrelated manner(OECD, 2002). Researchers and specialists in the field of sustainability haveagreed that sustainable development is based on three dimensions thatare considered essential pillars of sustainability (United Nations GeneralAssembly, 2005). These dimensions are:

70 Journal of Asian Economics, Accounting and Finance © 2020 ESI
Environmental dimension: this aspect deals with preserving thenatural environment within which operations and activities are carriedout (Smouts, 2005).
Economic dimension: this aspect focus on economic activities such asthe sourcing and use of funds in an efficient manner in working towardssustainability (Godard, 2010).
Social dimension: this aspects deals with meeting the needs of thesociety within which operations are carried out and putting intoconsideration the values upheld by different communities and those thatsustains the society at large (Smouts, 2005).
Okeke (2018) stated that sustainability for every corporate entity isreliant on three areas; the economic, environmental and social, making upthe triple bottom line.
2.1.4. Sustainable Financial Sector
Case (2012) outlines the starting point of sustainable financial services sectorto have been based on philanthropy, gradually progressing to investing insustainable businesses which entails refraining from business concernswhose operations impacts negatively on the society and; growth and valuecreation which focus on managing risk sustainably and utilizingopportunities in a sustainable manner to attain lasting improvedperformance. The sustainability of financial sectors depends on the qualityof its products and services and the value created to meet the needs of itsshareholders as well as taking responsibility for the needs of otherstakeholders and the society at large, not necessarily preserving the naturalenvironment; and maintaining transparency in reporting (Eccles &Serafeim,2013).
Rogers (2013) opined that there is little or no trust in banks and thefinancial sector as a whole compared to other sectors which has led to themergers and acquisitions in the sector to help failing firms while somefailed completely owing to their lack of transparency. Wolk (2012) suggeststhat environmental, social, and governance (ESG) issues should be the majorareas of focus for financial institutions as practiced globally. Eccles andSerafeim (2013) and Rogers (2013) opined that evaluating the sustainabilitydimensions of a firm is beyond the financial evaluation and should extendto the nonfinancial aspect. In the financial sector, sustainability is expectedto be evident in the process, design, operations and in fact reflect every oftheir activities. Sustainability in banking should entail creating a balanceof corporate culture, an endeavor for improved business operation and

Sustainability Practices and Performance of Sierra Leonean Deposit Money Banks 71
optimal performance as well as social considerations and customersatisfaction which entails more than the adoption of sustainabilityguidelines.
2.1.5. Role of Banks in Sustainability
Banks play a key role in an economic system as a result of their intermediaryfunction between people with shortage and surplus of funds. In this context,the activities of banks do not impact directly on the environment whencompared to the chemical, mining, health/drug, petroleum or textile sectorhence, it can be stated that the banking sector has a minimal direct impacton the environment.
The activities of financial institutions has an impact on individuals,organizations, the economy and the world at large as there is a need to interactwith this sector in carrying out their functions and meeting personal,corporate and global demands hence, there is need for the financial sector toconsider the how their operations and activities affects the environment andsociety as this impacts on sustainable development (OnerKaya, 2010).
Financial institutions are faced with environmental and social issuesboth internally and externally. The internal aspect is in relation to theprocesses of carrying out their operations and the impact on E&S issues isminimal in relation to what is obtainable in other sectors; although whenaggregated, the internal activities of the financial sector has a significantimpact on E&S issues. The external environment relates to the productsand services of the banks which by itself do not impact E&S issues but itsusers impacts the environment through their activities which means thatthe external aspect of the banks impacts on E&S issues indirectly (Jeucken&Bouma, 1999).
According to Jeucken (2001), a bank advances through four phasesbefore attaining sustainability. These are defensive banking, preventivebanking, offensive banking and sustainable banking. The defensive bankingphase is the point when the banks are focused on profitability and growth,totally avoiding sustainability and the associated cost. In the preventivebanking phase, banks focus on cost savings areas in their operations andonly consider sustainability in internal operations. In the offensive phase,banks start to see opportunities in the sustainable development process(e.g. sustainable financial products, new markets, financing sustainableenergy) and take into account sustainability in the external operations aswell as internal operations. In the sustainable banking phase, all operationsof banks become sustainable and environmental, social and economicsustainability take the place of maximum financial return.

72 Journal of Asian Economics, Accounting and Finance © 2020 ESI
The intermediary function of the bank to individuals, organizations andthe society as a whole is an outstanding role that can clearly show its driveor otherwise towards sustainability. Banks facilitate the flow of fundsirrespective of time, volume, distance and risk; while the resulting impact isseen in the economic development of the nation. The value of impact is bothquantifiable and qualitative as it is evident in the progression of the economicadvancement. (Jeucken, 2001). The bank has a responsibility towards theusers of its services on one hand and the economy as a role on the otherhand as its customer rely on their functions and the economy feels the impactgiven that the bank is a major facilitator in economic growth (EY, 2013). Case(2012) banks are expected to proactively manage their exposure to riskespecially in environmental and socially sensitive opportunities because ofthe potential legal, regulatory and/or reputational damage it might cause.IFC (2017) stated that looking across emerging practices; four key indicatorsappear to be useful to track green banking. First is banking commitmentswhich entail the adoption and implementation of green finance principles,standards, and practices by banks; financial flows in terms of the volumeand distribution of bank assets to green investment priorities; financial riskwhich impacts on the reliability of financial product and services; and lastly,the environmental and social outcomes which is avoidance of negative E&Simpacts and achievement of positive impacts in core financing activities.
2.1.6. Sustainable Banking
According to Imeson and Sim (2010), sustainable banking is a principlethat should characterize every activity of the banking sector as a bank’soperation are not for the benefits of its owners, customers and staff alonebut the society at large hence, the need for its operations to conserve thenatural environment and impact the society by safeguarding its resourcesthrough proper management of risk. Banks are also expected to beproactive, as much as possible, and engage in activities that enhances thesociety and preserve the environment. Jeucken (2004) notes that the internaloperations of a sustainable bank should align corporate business standardof sustainability and likewise, its external operations should createsustainable values for its customers and the society at large. CBSL (2012)defines sustainability banking as “an approach that recognizes the role ofbanks in driving long term economic development in Sierra Leone that isnot only economically viable, but also environmentally responsible andsocially relevant” (p. 2). The International Finance Corporation (2008)emphasized that sustainability in the banking sector is beyondphilanthropic activities and corporate social responsibility. Sustainabilityin the banking sector has been embraced through:

Sustainability Practices and Performance of Sierra Leonean Deposit Money Banks 73
i) Commitment to environmental preservation and socialconsiderations in operations.
ii) Adoption of sustainability as a business culture.
iii) Creation of access to more customers through products andservices.
Barclays (2009) opines that sustainable banking entails good governanceand effective risk management. The top management is expected to meetthe requirements of relevant laws, regulatory and industry standards as wellas policies that drive sustainability. Also, Straw (2013) stated that the profitpotential of adopting sustainability should not be the drive for itsimplementation but should rather be seen as a necessity for attaining ESGgoals. The International Institute for Sustainable Development (2013) statedthat in a research by UNEP and Salomon, it was found that commercial andinvestment banks believed that environmental issues had a significant effecton their business operation. The areas of concern to the banks given its effecton financial performance are:
(i) Lending Services: The bank is exposed to a certain level of financialrisk resulting from liability on loan and credit facilities accessible bycustomers. Banks need to adopt due diligence in relying on the financialrecords of their clients and have an understanding of the client’s businessenvironment in order to mitigate potential risk.
(ii) Borrowers’ obligations: The ability of the borrower to pay up loancommitment might be jeopardized by expenses arising as a result of itsactivities. There is need to carry out an assessment of events that mightarise following the activities of a borrower and the effect on the overallassessment of his credit worthiness.
(iii) Growing environmental concerns: A number of regulatory demandsrelating to environmental preservation have surfaced over the yearsfollowing health hazards caused by industrial waste and public concernabout the future of environmental safety. This imposes a responsibility onbanks in matters of environmental and social concern.
(iv) Business opportunities: Rather than react to changes in theenvironment, banks are to forecast and prepare against possible changesthrough their approach and strategies. This will help to narrow downvariance between expected and actual results.
2.1.7. Dimensions to Sustainable Banking
According to Imeson and Sim (2010), there are three basic dimensions tosustainable banking and these are economic, social and environmentaldimensions.

74 Journal of Asian Economics, Accounting and Finance © 2020 ESI
(i) The Economic Dimension: The most significant area of concernin the drive towards sustainability is the impact that the productand services of a bank has on the sector as a whole. Not only arebanks expected to meet customers need for value and quality,they are expected to provide fair compensation and workingenvironment for their employees and create value for theirshareholders. Overall, the operations of a bank should contributeto smooth running of the economy with minimal negative impacts.
(ii) The Social Dimension: To meet social demands, a bank isexpected to work towards reducing the negative effects of itsactivities on the society while maximizing opportunities to makepositive impact on the society. This can be achieved by engagingin ethical business practices, providing responsible services andat the same time creating job opportunities without any form ofdiscrimination, providing basic needs of their operatingcommunity and other volunteer services among others
(iii) The Environmental Dimension: Just like any other sector,sustainability for the banking sector requires a commitmenttowards reducing the negative impacts of their operations on theenvironment. This is done by avoiding some line of actions ortrying to make good the negative effects of previous actions andalso ensuring that their customers’ activities are responsibletowards the environment through their lending policies andassessments.
Sustainable banking entails a balance of the triple bottom line aseconomic achievement by itself does not create balance hence, preservationof the environment and social stability must also be accomplished. Jeucken(2001) noted that in working towards sustainable banking banks are notexpected to only accept clients that have attained sustainability but shouldalso drive clients that are still operating traditionally towards becomingsustainable. Also, banks should provide support for clients already workingin the process of becoming sustainable.
2.1.8. Sierra Leonean Sustainability Banking Principles (SLSBPs)
As stated in Weber and Oni (2015), the NSBPs consist of “nine principlesthat cover environmental and social (E&S) risk management, E&S footprint,human rights, women’s economic empowerment, financial inclusion, E&Sgovernance, capacity building, collaborative partnerships and reporting”(p.1). Sierra Leone’s central bank mandated full adoption andimplementation of these principles and guidelines by the financial

Sustainability Practices and Performance of Sierra Leonean Deposit Money Banks 75
institutions; all banks are expected to issue an initial sustainable bankingreport detailing their respective principles implementation progress nolater than 31December 2013. However, a full sustainable banking reportwill be required from each bank no later than 31 December 2014. Theguidelines have been developed as voluntary standards by Sierra Leoneanbanks. The reason for the development of the NSBP was to guarantee accessto foreign investments for Sierra Leonean banks, because financialinstitutions, such as the Netherlands Development Finance Company(FMO), require information about how sustainability is addressed by theirinvestees (Weber & Oni, 2015).
The Central Bank of Sierra Leone (2012) nine sustainability principlesare:
(i) Principle 1 — “Our Business Activities’ Environmental and SocialRisk Management: We will integrate environmental and socialconsiderations into decisionmaking processes relating to ourBusiness Activities to avoid, minimize or offset negative impacts”.
(ii) Principle 2 — “Our Business Operations’ Environmental andSocial Footprint: We will avoid, minimize or offset the negativeimpacts of our Business Operations on the environment and localcommunities in which we operate and, where possible, promotepositive impacts”.
(iii) Principle 3 — “Human Rights: We will respect human rights inour Business Operations and Business Activities”.
(iv) Principle 4 — “Women’s Economic Empowerment: We willpromote women’s economic empowerment through a genderinclusive workplace culture in our Business Operations and seekto provide products and services designed specifically for womenthrough our Business Activities”.
(v) Principle 5 — “Financial Inclusion: We will promote financialinclusion, seeking to provide financial services to individuals andcommunities that traditionally have had limited or no access tothe formal financial sector”.
(vi) Principle 6 — “E&S Governance: We will implement robust andtransparent E&S governance practices in our respective institutionsand assess the E&S governance practices of our clients”.
(vii) Principle 7 — “Capacity Building: We will develop individualinstitutional and sector capacity necessary to identify, assess andmanage the environmental and social risks and opportunitiesassociated with our Business Activities and Business Operations”.

76 Journal of Asian Economics, Accounting and Finance © 2020 ESI
(viii)Principle 8 — “Collaborative Partnerships: We will collaborateacross the sector and leverage international partnerships toaccelerate our collective progress and move the sector as one,ensuring our approach is consistent with international standardsand Sierra Leonean development needs”.
(ix) Principle 9 — “Reporting: We will regularly review and reporton our progress in meeting these Principles at the individualinstitution and sector level” .
The NSPBs address both social and environmental issues of banking.However, they mainly state that banks will develop policies, practices, andproducts and services to address the various sustainability issues. Inparticular, outcomes of the NSBP are not defined. Therefore, it is not easyto enforce the guidelines and to supervise compliance. Consequently,criteria have to be developed that enable the central regulator to enforcethe guidelines.
2.1.9. Sustainable Performance Evaluation
How well an organization has been able to adjust to changes in theenvironment is assessed through evaluation of its performance. Before theconcept of sustainability became popular, performance evaluation wasbased on financial performance as contained in the financial report. Atpresent, financial performance by itself is not a reliable measure ofperformance as there is need to consider changes in the market andenvironment within which a firm operates which are qualitative measuresof performance as there is increasing focus by stakeholders on theenvironmental and social impact of firms’ operations. According to Goel(2010), the sustainable performance of a company is evaluated by carryingout an assessment of the three areas of sustainability: economic, social andenvironmental performance. Economic performance is concerned withareas reported in a company’s financial statement for the period and alsoincludes training of human resources, research and development, employeecost and benefit. Environmental performance is concerned with theresource usage of the company in their operations which includes energy,land, water and the outcome of engaging in such activities like waste, airpollutions, chemical pollutions and spillages. A company is evaluated basedon the aggregate of environmental impact in terms of waste disposal,depletion of natural resources, energy generation and consumption; airand chemical pollutions. Social performance is concerned with the impactof a company’s value chain on the community it is operating in. It includesemployee relations, health and safety, ratio of wages to cost of living, non

Sustainability Practices and Performance of Sierra Leonean Deposit Money Banks 77
discrimination, employee turnover rate and education. However, assessingthe social impact of companies is more demanding and less embracedcompared to economic and environmental performance assessment(Székely & Knirsch, 2005).
Eccles and Serafeim (2013) opined that the problem with banks,insurance companies, and other financial institutions exhibiting theircommitment to sustainability by focusing on energy and water in theirsustainability reporting is that these issues do not have a significant effecton the sustainability of the institution, its shareholders and otherstakeholders (employees, customers, counterparties, and society) whichrely upon the services and stability of the financial sector to createemployment and stable economic growth. Financial institutions areexpected to focus on social and governance issues as this is significant totheir sustainable performance. There is need for sufficient information onkey areas of sustainability in terms of social and corporate performance,and how it reflects in the financial performance. Social performance isreflected in recruitment and retention process, employee payment scheme,customer satisfaction, ethical productions, and financial inclusion whilegovernance performance is reflected in the management of legal andregulatory issues, systemic risk management, and conflict resolution amongothers.
Eccles and Serafeim (2013) further stated that with adequateinformation, shareholders and other stakeholders will have acomprehensive view of exactly how a financial institution seeks to achievefinancial performance and the associated negative impact it is making indoing so. This will position financial institutions to better manage nonfinancial environmental, social and governance performance throughintroduction of new products, methods, and business strategies that willenhance improvement of financial performance at the same time.
2.1.9.1. Financial Inclusion
Financial inclusion is the objective of providing access for everyone to bepart of the financial system in a manner that the needs of individuals,providers of goods and services and the society as a whole is met if achievedglobally. One essential element of financial inclusion is access to instrumentsthat allow for saving or borrowing or both however, it is possible to nurtureincreased financial inclusion without a large increase in aggregate creditas the most pressing financial needs for say the lowincome populationmay consist in having reliable savings and payment instruments ratherthan credit (Hawkins, 2011, World Bank, 2008). Mckinsey (2010) in their

78 Journal of Asian Economics, Accounting and Finance © 2020 ESI
study on global financial inclusion adopted a descriptive analysis; theyanalyzed the percentage of the world’s adult population that does not usethe services of a financial institution also, they considered the cost ofoffering deposit services.
IFC (2016) adopted a survey research in analyzing the role of banks infinancial inclusion using the rate of income growth, percentage of accountholders in financial institutions, mobile account holders and both. They alsodid an analysis of the drivers of financial inclusion (CSR, investment, marketactivities and commercial motives) and analysis of the users of mobiletechnology. The ROE is a measure of shareholders returns based on theperformance of a firm. Banks that depend more on deposits and borrowingsare likely to achieve a higher ROE than banks that rely more on shareholders’funds. ROE is strongly influenced by the capital structure of a financialinstitution, in particular, how much use it makes of equity financing. Everysector of the economy is affected by interest rate but it is very significant tothe banking sector as they trade money. Deposits in banks forms the bulk ofa nation’s savings and as such impact its economic progress significantly.Bank deposits comprises of cash, cheque or electronic transfer of fund keptby customers in their bank account and attracts a return at the existing interestrate. Bank deposits serves as a support system to the banking sector andinterest is the benefit customers get in return (Mushtaq & Siddiqu, 2017).
2.1.9.2. Environmental and Social Risk Management
International Institute for Sustainable Development (2013) in their studystated that most financial institutions believed that environmental issueshad a significant impact on their business operations and are sensitive aboutthe financial effects as it relates to liability of lenders, ability of borrowersto meet financial obligations, complex environmental issues and businessopportunities.
The state of investing at present is such that investors consider notjust the financial return of a portfolio, project or company they wish toinvest in but also considers if such investment is environmentally andsocially viable. That is to say beyond financial return, sustainability hasbecome an investment criterion for investors (Moore, 2004). Eccles andSerafeim (2013) emphasized that although financial institutions cannotoverlook environmental issues they have a more significant impact on theenvironment when they assess the environmental impact of their customers’activities in giving them access to funds for their operations. As much asthe financial sector has a responsibility to their environment, they shouldnot focus on this as a key indicator of their sustainability.

Sustainability Practices and Performance of Sierra Leonean Deposit Money Banks 79
Nieto (2017) stated that the environmental risk assessment of exposuresshould go hand in hand with the understanding of the credit risk involved.The sustainability risk that the financial sector faces is directly proportionalto the risk exposure of their customers in terms of environmental and socialissues. The risk (reputational, legal and/or financial) that a financial institutionis confronted with results from the transactions they carry out with theircustomers given that that is a level of exposure to environmental and socialrisk which every individual or business is faced with in carrying out theiroperations. Some E&S risks are transactionspecific depending on theindustry, client’s operational activities and location. E&S issues come up inareas of waste management, environmental pollution, safety and health issuesand social cultures; which are most times within the control of the clientsand can be avoided or reduced (IFC, 2007). International Institute forSustainable Development (2013) in their study stated that most financialinstitutions believed that environmental issues had a significant impact ontheir business operations and are sensitive about the financial effects as itrelates to liability of lenders, ability of borrowers to meet financial obligations,complex environmental issues and business opportunities.
2.1.9.4. Environmental and Social Governance
Cadbury (2000) stated that corporate governance is the system throughwhich companies are directed and controlled to ensure that duties areexercised according to laws, regulation and codes of conduct. Formerly,corporate governance was limited to legal and accounting compliance, witha focus on shareholder returns. However, corporate governance presentlyincludes environmental, social and governance (ESG) issues, as well asresponsibilities to wider stakeholders groups (Saravanamuthu, 2004). CSRtransparency is more effectively achieved through improving the qualityof corporate governance, rather than mandating specific disclosures (Chan,Watson & Woodliff, 2014). For many reviewers, the main concern ofresponsible business is no longer how to mitigate negative externalities ofbusiness practices, but rather how to find ways in which businesses cananticipate and prevent the occurrence of negative impact. This approachmeans a significant step towards increased responsibility of firms, whichgoes beyond symbolic efforts and implies a major change to the overarchingbusiness model (Paulet, Parnaudeau & Relano, 2014).
Adenikinju (2005) observes that in a limited view, corporate governancecan be conceived as a set of arrangement internal to the corporation thatdefines the relationships between managers and shareholders. Colemanand NicholasBiekpe (2006) define corporate governance as the relationshipof the enterprise to shareholders or in a broad sense as the relationship of

80 Journal of Asian Economics, Accounting and Finance © 2020 ESI
the enterprise to society as a whole which implies the sum of the processes,structures and information used for directing and overseeing themanagement of an organization. Vives (2000) and Oman (2001) observethat there is a more inclusive approach which views corporate governanceas the methods by which suppliers of finance control managers in order toensure that their capital cannot be expropriated and that they can earn areturn on their investment. Within the capital market, economicperformance is depicted by the amount of profit a firm makes. However,this information may be biased, since it is based on manager’s accountingchoices. Moreover, the ranking of companies which is usually based onaccounting performance may be affected by environmental risks orinefficient corporate governance (Hejazi & Hesari, 2012).
The mechanisms of corporate governance are board size and boardcomposition, board responsibility, accountability, internal control andtransparency and disclosure. Heidi and Marleen (2003) observe that bankingsupervision cannot function well if sound corporate governance is not inplace. Consequently, banking supervisors have strong interest in ensuringthat there is effective corporate governance at every banking organization.Stoiber (2010) posits that most banks engaging in sustainability do thatthrough applying the sustainability lens to the bank’s mission and businessby way of setting ethical standards for investing to designing products withsustainability features at their core. Green operations and philanthropy aregivens in this category. The innovation of the financial system has changedthe banks’ products and has increased the banks’ activities. Traditionalbanking activities mainly consist of receiving deposits and granting loans.Recent trend of product diversification of the banking services under financialderegulation implies that banks have been encouraged to involve nontraditional banking activities, such as cash management, bank accountmanagement, and other offbalance sheet services (Vithyea n.d.).
2.1.9.5. Reporting
Sustainability reporting is still in its initial stage of development. In mostcountries, this practice is adopted on a voluntary basis. Haider (2010)observes the historical development of corporate social and environmentalreporting (CSER) and concludes that the development of CSER is followinga slow process which begins ‘with employee reporting and then moves onto social reporting, environmental reporting, triple bottom line reportingand eventually, and ideally, sustainability reporting. Similar to theirdeveloped counterparts, corporations in developing countries are alsomaking CSER although low in volume. Yet, since the publication of thefirst separate environmental reports in 1989, the number of companies that

Sustainability Practices and Performance of Sierra Leonean Deposit Money Banks 81
has started to publish information on its environmental, social orsustainability policies and/or impacts has increased substantially (Kolk,2004). With the gradual development in the sustainability reporting by thebusinesses, there has been shift from the voluntary nature of reporting tomandatory. For this purpose, various regulatory bodies have developedframeworks and regulations related to the reporting and it is been evidentthat corporations has elevated beyond the external and regulatory pressureand has reached the realization that they have to move beyond including asustainability report/ statement in the annual report. Hence there is a trendof shifting towards an integrated reporting approach, which combines theperformance and the purpose of a business (Hewapathirana, 2014).
2.1.10. Stakeholders
The conflicting needs of the different stakeholder group imposes a difficulttask on companies as there is need to meet the needs of one stakeholdergroup without overlooking the need of another hence the need for balanceof conflicting needs. While one stakeholder group seeks for high returns,the associated cost to the bank is high; another group desires the loan serviceof the bank at the lowest possible cost, which has a negative effect on thereturn of the bank. Bank shareholders desire to generate more earningsfrom little investment which tend to result in a cut in employeescompensation and benefits. There is also the policy of regulatory bodiesthat imposes a limit on the risk taking of the bank in sourcing and usage offunds which equally restrains the bank from meeting other stakeholderneeds (Avkiran & Morita, 2010; Hempel, Simon & Coleman, 1994).
Avkiran and Morita (2010) stated five stakeholders group:shareholders, customers, managers, employees, and regulators. Rebai,Azaiez and Saidane (2012) stated that there is continuous change going onin the business world and a number of associated challenges; popularamong them is the issue of meeting immediate needs without disruptingthe chances of meeting future demands taking into consideration that everystakeholder has a part to play in other to attain sustainability. Also, in orderfor a bank to carry out their responsibility in achieving sustainability, theyshould be positioned to adapt to the changing demands in the businessenvironment and should work towards adopting sustainable values takinginto account the demands of the various stakeholder groups and the societyat large. Rebai, Azaiez and Saidane (2012) in examining the sustainabilityof banks considered six stakeholders’ view point; regulators, shareholders,customers, managers, employees and civil society; and suggested a numberof expectations of each of this stakeholder which can be used to evaluatetheir performance among others.

82 Journal of Asian Economics, Accounting and Finance © 2020 ESI
Regulators: The gap between the economy and the financial sector isfilled by the regulators. They safeguard the interest of the populace and theeconomic condition of the nation through policies on risk areas of the bank.
Shareholders: These are the equity capital providers of a bank and expecta reasonable return for their investment hence; their focus will be on theprofitability of the banks as this will determine their returns on equity,dividend and continued survival of the bank. Shareholders retain and investmore in a bank where their expected returns are met and exceeded.
Customers: These are the recipients of the services provided by thebanks. The income generated by the banks is from the payment made bycustomers for their services hence, the focus of the customers is on thequality and value of services rendered by the banks.
Managers: Managers are officers of the bank and expect fair benefitsand incentives for their service to the bank. There expectations can only bemet when the bank is performing well which means that the performanceof the bank is imperative to meeting their needs.
Employees: Employees also concerned about the financial performanceof their bank as this determines their rewards in terms of benefits andsocietal factors.
Civil society: While the activities of the banking industry do not byitself create issues of social concerns, its unique role can be used to channelthe society at large towards a state of economic stability.
Douglas, Doris and Johnson (2004) opined that the financial sector isan agent of sustainability as they drive other sectors to become moresustainable economically, environmentally and socially. By implementingregulatory policies, the bank is able to maintain a desired level of economicstability. Also, through environmental risk assessment, banks are able tocontrol the activities of their clients by making funds available to sectorsor projects that sustains the natural environment. Finally, through its workplace culture, a bank can adopt practices that are compatible with sociallyacceptable values and norms.
2.2. Theoretical Review
This research study considered a number of theories. These arestakeholders’ theory, resource dependency theory and institutional theory.However, these study was anchored on stakeholders theory.
2.2.1. Stakeholders Theory
Following the introduction of stakeholders’ theory in 1970, Freeman (1984)developed the scope of the theory to accommodate a wider range of

Sustainability Practices and Performance of Sierra Leonean Deposit Money Banks 83
stakeholders. Colbert, Freeman and Wheeler (2003) argued that thestakeholders’ theory is an integration of social and organizational schoolof thought. The theory does not have an origin in itself but was developedfrom the background and incorporation of existing traditional philosophies.Stakeholders’ theory takes into cognizance all group of individuals thathave a stake in the existence of an organization as opposed to agency theorywhere the shareholders’ objective is the main focus of the management.The stakeholder perspective entails working towards a balance in meetingthe needs of various stakeholder groups beyond the traditional ideologyof principal – agent relationship (Freeman, 1999) while Sundaram andInkpen (2004) argues that the theory is focused on meeting only the needsof significant stakeholder groups. However, Clarkson (1995) opined thatan organization is a system that is set up to create value for its stakeholders.Freeman (1984) opined that trying to meet the conflicting needs of thevarious stakeholders poses a challenge to management in decision making.Donaldson and Preston (1995) however argued that the stakeholders’ theoryis concerned with how management decisions affect the needs ofstakeholders without considering the needs of a group above another.
2.2.2. Resources Dependency Theory
This theory was formalized by Pfeffer and SAlancik in 1978. Haslinda andBenedict (2009) stated that the resource dependency theory focus on board’srole in making resources accessible while stakeholders theory focus onmeeting the needs of stakeholder groups. Hillman, Canela and Paetzold(2000) contend that resource dependency theory focuses on the role thatdirectors play in providing or securing essential resources to anorganization through their linkages to the external environment. Daily,Ellstrand and Johnson (1996) agreed that resource dependency theory isfocused on the integration of key professionals into the firm to enhancethe managerial operation of the firm as it is more cost effective than sourcingfor them when the need arises. The availability and accessibility of resourcesis vital to the smooth operation and continuous survival of a firm (Daily,Dalton & Canella, 2003). According to Hillman et al. (2000), the directorsare the link between an organization and resources such as information,skills and access to key players.
2.2.3. Institutional Theory
Since its emergence in the 1970s particularly through Meyer and Rowan’s(1977) model article publication, there have been proliferations oforganizational analyses based on institutional theory with investigatedworks in the field covering a wide range of phenomena (Tolbert & Zucker,

84 Journal of Asian Economics, Accounting and Finance © 2020 ESI
1999). The theory has become vibrant over time and has risen to prominenceas a popular and powerful explanation for both individual andorganizational action (Dacin, Goodstein, & Scott, 2002) emphasizing thedependence of modern organizations on their environments (Meyer, 2008).According to Kostova, Roth and Dacin (2008), the theory provides atheoretical platform for investigating a wide scope of critical issues, givesroom for detailed analysis and can be fundamentally applied ininternational management literature to: conceptualize nationalenvironments in terms of regulatory, cognitive and normative pillarswhichintroduces important constructs such as country institutional profile; andconceptualize processes of largescale transformation of national systemsthrough the notions of institutional transition, upheaval and imperfectionamong many other applications.
Institutional theory considers the processes of institutionalization bywhich structures, including schemes, rules, norms, and routines, becomeestablished as authoritative guidelines for social behavior (Scott, 2004).Conferring to Meyer and Rowan (1977), institutionalization involves theprocess by which social processes, obligations, or actualities take on a rulelike status in social thought and action. The concept of institutionalizationbrings up the issue of structures which aligns to several theories that focuson the flow of activities as key dimensions for the success of formalorganizations in the modern world with the other reason for structuresbeing its institutional legitimacy as structural ideas are intertwined in socialideologies and imposed the legal system among others. As a result, theystated that the use of institutional structures display obligations and leavesno room for excuse. This is vital with regards to regulations as nonadherence to stated rules reflects irresponsibility which could bring aboutsome form of disciplinary actions or sanctions.
2.3. Empirical Review
A number of studies have been done on sustainability practices and banksperformance. Some of the studies relating to return on asset, return onequity, net interest margin and sustainability practices are reviewed.
2.3.1. Sustainability Practices and Return on Asset
Ngwakwe (2009) studied the relationship between environmentalresponsibility and firm performance in Sierra Leone for the period of 1997to 2006. The study showed that sustainable practices have a significantpositive impact on the financial performance (measured by return on asset)of firms. Chan and Heang (2010) did a study on corporate governance,

Sustainability Practices and Performance of Sierra Leonean Deposit Money Banks 85
board diversity and bank efficiency of commercial banks in Malaysia forthe period of 2000 to 2009. Secondary data sourced from the financialstatement of the commercial banks was employed to form a panel data.Gender diversity on the board was used as a measure of board diversitywhich is the independent variable while return on asset was used as ameasure of bank efficiency which is the dependent variable. Adoptingregression analysis, the study showed that gender diversity does not havea significant effect on return on asset (ROA).
Wachudi and Mboya (2012) studied the effect of board gender on theperformance of commercial banks in Kenya for the period of 1998 to 2009using a regression model to carry out the analysis; their measure of boarddiversity was the presence of female directors in the board and theproportion of female directors and ROA was used as a measure ofperformance. Secondary data sourced from the financial statements of thecommercial banks was employed in the study to form a panel data. Thestudy showed that the presence of female directors in the board has anegative relationship with the return on asset (ROA). Also, the proportionof female directors in the board has a negative relationship with ROA.
VanGeffen (2012) studied the financial performance and risk profileof sustainable firms in United States from 2001 to 2010. Secondary datawas employed to form a panel data. The independent variable was corporatesocial performance while the dependent variable was financial performancemeasured by return on asset (ROA). They analyzed the variables usingregression analysis and descriptive statistics and did a comparative analysis.They concluded that sustainable firms are more profitable than benchmarkcompanies. Pathan and Robert (2013) did a study on whether the boardstructures of banks affect their performance in U.S. bank holding companiesfor the period of 1997 to 2004. Gender diversity was used as a proxy forboard diversity and performance was measured by the return on averageasset (ROAA). The studied showed that gender diversity has a positivesignificant effect on the performance of banks measured by ROAA.
Setiyono and Tarazi (2014) studied the diversity of bank board membersand its effect on performance and risk in Indonesia banks from 2001 to2011. Secondary data was employed to form a panel data which wasanalyzed using descriptive statistics and regression analysis. To accountfor gender diversity, they calculated the proportion of women (female) onthe board as a proxy for gender diversity which is the independent variableand return on asset (ROA) as a proxy for performance which is thedependent variable. They concluded that the inclusion of women in theboard has a significant impact on performance. Taskin (2015) studied the

86 Journal of Asian Economics, Accounting and Finance © 2020 ESI
relationship between CSR and banks’ financial performance of banks inTurkey in 2013. The study makes a content analysis based on the guidelinesof GRI for measuring the degree of CSR, namely, economic impacts,environmental impacts and social impacts which is the independentvariable while return on asset (ROA) was used to measure financialperformance which is the dependent variable. Secondary data wasemployed to form a time series data. The study showed an insignificantnegative relationship between CSR and ROA.
Zyadat (2016) studied the impact of sustainability on the financialperformance of Jordanian Islamic banks for the period of 2008 to 2014.Secondary data sourced from annual reports and sustainability reports wasemployed for the study. Sustainability is the independent variable measuredby the three dimensions of sustainability while financial performance isthe dependent variable. The study considered the effect of the threedimensions of sustainability (economic, environmental and social) onfinancial performance (return on assets). Adopting a descriptive analysisusing multiple regression analysis, he concluded that the dimensions ofsustainability have a significant impact on ROA. Ebdane (2016) studiedthe impact of sustainability reporting on corporate performance inPhilippine. The study focused on determining the effect of overallsustainability reporting and the individual performance indicatorsincluding economic, social and environmental disclosures to theperformance of companies who submit sustainability reports. The studiedshowed that sustainability disclosure as a whole affects performancemeasured by return on asset (ROA) however when treated individually,economic, environmental, and social disclosures do not affect the companyperformance in terms of ROA.
2.3.2. Sustainability Practices and Return on Equity
Chan and Heang (2010) did a study on corporate governance, boarddiversity and bank efficiency of commercial banks in Malaysia for the periodof 2000 to 2009. Secondary data data. Gender diversity on the board wasused as a measure of board diversity which is the independent variablewhile return on asset was used as a measure of bank efficiency which isthe dependent variable. Adopting regression analysis, the study showedthat gender diversity does not have a significant effect on return on equity(ROE). VanGeffen (2012) studied the financial performance and risk profileof sustainable firms in United States from 2001 to 2010. Secondary datawas employed to form a panel data. The independent variable was corporatesocial performance while the dependent variable was financial performance

Sustainability Practices and Performance of Sierra Leonean Deposit Money Banks 87
measured by return on equity (ROE). They analyzed the variables usingregression analysis and descriptive statistics and did a comparative analysis.They concluded that sustainable firms are more profitable than benchmarkcompanies.
Pathan and Robert (2013) did a study on whether the board structuresof banks affect their performance in U.S. bank holding companies for theperiod of 1997 to 2004. Secondary data was used for the study to form apanel data which was analyzed using descriptive statistics and regressionestimates. Gender diversity was used as a proxy for board diversity whichis the independent variable while performance which is the dependentvariable was measured by the return on average equity (ROAE). The studiedshowed a positive relationship between gender diversity and performanceof banks. Setiyono and Tarazi (2014) studied the diversity of bank boardmembers and its effect on performance and risk in Indonesia banks from2001 to 2011. Secondary data was employed to form a panel data whichwas analyzed using descriptive statistics and regression analysis. To accountfor gender diversity, they calculated the proportion of women (female) onthe board as a proxy for gender diversity which is the independent variableand return on equity (ROE) as a proxy for performance which is thedependent variable. They concluded that the inclusion of women in theboard has no significant impact on performance.
Halamka (2015) in his study on ethics as a way to sustainability in thebanking sector of Prague for the period of 2003 to 2013 and concluded thatthe peers of ethical banks had a higher profitability measured by return onequity (ROE). Taskin (2015) studied the relationship between CSR andbanks’ financial performance of banks in Turkey in 2013. The study makesa content analysis based on the guidelines of GRI for measuring the degreeof CSR, namely, economic impacts, environmental impacts and socialimpacts while return on equity (ROE) was used to measure financialperformance. The study showed an insignificant negative relationshipbetween CSR and financial performance measured by return on equity(ROE).
Zyadat (2016) studied the impact of sustainability on the financialperformance Jordanian Islamic banks for the period of 2008 to 2014.Secondary data sourced from annual reports and sustainability reports wasemployed for the study. Sustainability is the independent variable measuredby the three dimensions of sustainability while financial performance isthe dependent variable. The study considered the effect of the threedimensions of sustainability (economic, environmental and social) onfinancial performance of Jordanian banks (return on equity). A descriptive

88 Journal of Asian Economics, Accounting and Finance © 2020 ESI
analysis was adopted using multiple regression analysis; he concluded thatthe dimensions of sustainability did not have a significant impact onfinancial performance (ROE).
Ebdane (2016) studied the impact of sustainability reporting oncorporate performance in Philippine. The study focused on determiningthe effect of overall sustainability reporting and the individual performanceindicators including economic, social and environmental disclosures to theperformance of companies who submit sustainability reports. The studiedshowed that sustainability disclosure as a whole affects performancemeasured by return on equity (ROE) also, when treated individually,economic, environmental, and social disclosures do not affect the companyperformance in terms of ROE.
2.3.3. Sustainability Practices and Net Interest Margin
McKinsey (2007) in their study on women matter found out that whenthere are more women in the management board of a firm their financialand organization performance are greater than the industry average interms of returns, EBIT margin and stock performance. Pathan and Robert(2013) did a study on whether the board structures of banks affect theirperformance in U.S. bank holding companies for the period of 1997 to 2004.Secondary data was used for the study to form a panel data which wasanalyzed using descriptive statistics and regression estimates. Genderdiversity was used as a proxy for board diversity which is the independentvariable while performance which is the dependent variable was measuredby net interest margin (NIM). The studied showed a negative significantrelationship between gender diversity and the performance of banksmeasured by NIM using regression analysis.
Setiyono and Tarazi (2014) studied the diversity of bank board membersand its effect on performance and risk in Indonesia banks from 2001 to2011. Secondary data was employed to form a panel data which wasanalyzed using descriptive statistics and regression analysis. To accountfor gender diversity, they calculated the proportion of women (female) onthe board as a proxy for gender diversity which is the independent variableand net interest margin (NIM) as a proxy for performance which is thedependent variable. They concluded that the inclusion of women in theboard has a significant impact on performance. Smith, Smith and Verner(2006) did a study on women in top management and firm performanceand analyzed their data; percentage of female in management and grossvalue added using a regression model. They concluded that females in theboard have a positive impact on performance.

Sustainability Practices and Performance of Sierra Leonean Deposit Money Banks 89
Nwobu (2015) studied the relationship between corporate sustainabilityreporting and profitability in Sierra Leonean banks for the period of 2010to 2013. The study employed a disclosure index to score the extent ofsustainability reporting. The study showed a significant relationshipbetween profitability and corporate sustainability reporting. Taskin (2015)studied the relationship between CSR and banks’ financial performance ofbanks in Turkey in 2013. The study makes a content analysis based on theguidelines of GRI for measuring the degree of CSR, namely, economicimpacts, environmental impacts and social impacts while net interestmargin (NIM) was used to measure financial performance. The study byway of regression analysis showed a significant positive relationshipbetween CSR and financial performance measured by net interest margin(NIM). Halamka (2015) studied ethics as a way of sustainability in thebanking sector of Prague for the period of 2003 to 2013. The study showedby way of comparative analysis that ethical banks had a higher net interestmargin (NIM) than peers.
3. METHODOLOGY
This study adopted an expost facto design which refers to studies thatinvestigate possible cause and effect relationship by observing an existingcondition or state of affairs and searching back for plausible causal factors.This is because data were obtained from the annual financial statements ofthe Sierra Leonean money deposit banks to ascertain the effect ofsustainability practices on performance.
3.1. Measurement of Variables
The dependent variable of this study; performance was measured by returnon asset (ROA), Return on equity (ROE), Net interest margin (NIM) andthe geometric mean of return on asset, return on equity and net interestmargin.
3.2. Model Specification
In trying to achieve the objective of this study, a regression model wasused to evaluate the impact of sustainability practices on the performanceof Sierra Leonean deposit money banks. The model covered the effect ofsustainability practices (SP) on return on asset (ROA), return on equity(ROE), and net interest margin (NIM).
Y = f (X, Z)
PER = f (SP)
Where: P = Performance

90 Journal of Asian Economics, Accounting and Finance © 2020 ESI
SP = Sustainability Practices
Y = Performance (Dependent Variable)
Y = y1,
y2,
y3
y1 = Return on Asset (ROA)
y2 = Return on Equity (ROE)
y3 = Net Interest Margin
X = Sustainability Principles
X = (x1, x
2,x
3)
Z = Control variable
Z = z1, z
2, z
3& z
4
z1 = Leverage (LEV)
z2 = Firm Size (FS)
z3 = Firm Age (FA)
z4 = Risk (RK)
Functional Relationships
ROAit = f (SP
it) F
1
ROAit = f (SP
it, LEV
it, FS
it, FA
it, RK
it) F
2
ROEit = f (SP
it) F
3
ROEit = f (SP
it, LEV
it, FS
it, FA
it, RK
it) F
4
NIMit = f (SP
it) F
5
NIMit = f (SPit, LEVit, FSit, FAit, RKit ) F6
The model is specified as:
ROAit= �
0 + �
1SP
it + µ
itModel 1
ROAit = �
1 + �
1SP
it �
2LEV
it + �
3FS
it + �
4FA
it + �
5RK
itModel 2
ROEit
= �2 + �
1SP
it + µ
itModel 3
ROEit = �
3 + �
1SP
it �
2LEV
it + �
3FS
it + �
4FA
it + �
5RK
itModel 4
NIMit
= �4 + �
1SP
it+ µ
itModel 5
NIMit = �
5 + �
1SP
it �
2LEV
it + �
3FS
it + �
4FA
it + �
5RK
itModel 6
Where:
�0 – �
5 is the intercept for the models

Sustainability Practices and Performance of Sierra Leonean Deposit Money Banks 91
�1 �
5 is the coefficients of the explanatory variables
µ is the error term of the proxies
i represents the Bank
t represents the period of study
Ethical Consideration: Compliance with the relevant principles ofacknowledging the various authors to avoid plagiarism was ensured. Theresearcher avoided any form of dishonesty by using data as obtained.
4. DATA ANALYSIS, RESULTS AND DISCUSSION OF FINDINGS
4.1. Descriptive Statistics
Table 4.1 : Descriptive Statistic Output
Variables Obs Mean Std. Dev. Min Max
SP 100 0.5763 0.2418 0 0.9667
LEV 100 0.7917 0.2487 0.0012 1.4021
FS 100 17.6369 3.0405 12.49464 21.9759
FA 100 20.5 15.2637 2 47
RK 100 0.0206 0.0263 0 0.1067
ROA 100 0.0155 0.0280 0.1051 0.1396
ROE 100 0.0264 0. 4761 3.9432 1.0944
NIM 100 0. 0779 0. 0318 0.0370 0.1541
PER 100 0. 0541 0. 0457 0.2074 0. 2158
Source: Researcher’s Study, 2019
Table 4.1 shows the measures of central tendency and dispersioncomputed to depict the underlying distribution of each variable. The keyhighlights of the table 4.1 are as follows:
Sustainability Practices (SP) shows a mean value of 0.576. This impliesthat on the average, the sampled deposit money banks engage in 58 percent of sustainability practices. The maximum value of 0.9667 and theminimum value of 0.00 shows that the engagement of the sampled depositmoney banks in sustainability practices differ over the years. In addition,the standard deviation of 0.2418 suggests that the sustainability practicesof the sampled deposit money banks were relatively constant overtime.
Leverage (LEV) shows a mean value of 0.7917. This implies that on theaverage, the sampled deposit money banks have a leverage of 79 per cent.The maximum value of 1.4021 and minimum value of 0.0012 shows that

92 Journal of Asian Economics, Accounting and Finance © 2020 ESI
the sampled deposit money banks leverage differ over the years. Inaddition, the standard deviation of 0.2487 suggests that the leverage of thesampled deposit money banks were relatively constant overtime.
Firm age (FA) shows a mean value of 20.5. This implies that on theaverage, the sampled deposit money banks a firm age of 21 years. Themaximum value of 47 and minimum value of 2 shows that the sampleddeposit money banks firm age differ over the years. In addition, thestandard deviation of 15.2637 suggests that the firm age of the sampleddeposit money banks were relatively constant overtime.
Firm size (FS) shows a mean value of 17.6369. This implies that on theaverage, the sampled deposit money banks have a firm size of 18. Themaximum value of 21.9759 and minimum value of 12.49464 shows that thesampled deposit money banks firm size differ over the years. In addition,the standard deviation of 3.0405 suggests that the firm size of the sampleddeposit money banks were relatively constant overtime.
Risk (RK) shows a mean value of 0.0206. This implies that on theaverage, the sampled deposit money banks have a risk of 2 per cent. Themaximum value of 0.1067 and minimum value of 0 shows that the sampleddeposit money banks return on asset differs over the years. In addition,the standard deviation of 0.0263 suggests that the risk of the sampleddeposit money banks were relatively constant overtime.
Return on Asset (ROA) shows a mean value of 0.0155. This impliesthat on the average, the sampled deposit money banks have a return onasset of 1.6 per cent. The maximum value of 0.1396 and minimum value of0.1051 shows that the sampled deposit money banks return on asset differsover the years. In addition, the standard deviation of 0.0280 suggests thatthe return on asset of the sampled deposit money banks were relativelyconstant overtime.
Return on Equity (ROE) shows a mean value of 0.0264. This impliesthat on the average, the sampled deposit money banks have a return onequity of 2.6 per cent.The maximum value of 1.0944 and minimum valueof 3.9432 shows that the sampled deposit money banks return on equitydiffers over the years. In addition, thestandard deviation of 0.4760 suggeststhat the return on asset of the sampled deposit money banks were relativelyvolatile overtime.
Net Income Margin (NIM) shows a mean value of 0.0779. This impliesthat on the average, the sampled deposit money banks have a net interestmargin of 7 per cent. The maximum value of 0.1541 and minimum value of0.0370 shows that the sampled deposit money banks net interest margin

Sustainability Practices and Performance of Sierra Leonean Deposit Money Banks 93
differ over the years.In addition, the standard deviation of 0.0318 suggeststhat the return on asset of the sampled deposit money banks were relativelyconstant overtime.
Performance (PER) shows a mean value of 0.0541. The maximum valueof 0.2158 and minimum value of 0.207 shows that the sampled depositmoney banks performance differ over the years. In addition, the standarddeviation of 0.0457 suggests that the performance of the sampled depositmoney banks were relatively constant overtime.
4.2. Inferential Analysis
In order to determine the effect of sustainability practices (SP) measuredby sustainable solution practice index (SSPI) on performance (PER)measured by return on asset (ROA), return on equity (ROE), and net interestmargin (NIM); controlled by leverage (LEV), firm age (FA), firm size (FS)and risk (RK), the study regressed sustainability practices (SP) on each ofthe measurements of performance (PER) in a linear regression.
Table 4.2.1, 4.2.2, 4.2.3, 4.2.4, 4.2.5, 4.2.6, 4.2.7 and 4.2.8 shows the resultof the regression analysis as well as the diagnosis tests of the effect ofsustainability practices (SP) sustainable solution practice index (SSPI) onthe performance measures; return on asset (ROA), return on equity (ROE),net interest margin (NIM) and performance (PER) controlled by leverage(LEV), firm age (FA), firm size (FS) and risk (RK) respectively.
4.2.1. Test of Hypothesis One
Research Objective 1: To evaluate the effect of sustainability practices onthe return on asset of Sierra Leonean deposit money banks.
Research Question 1: To what extent do sustainability practices affectthe return on asset of Sierra Leonean deposit money banks?
Research Hypothesis 1 (H01): There is no significant effect of
sustainability practices on the return on asset of Sierra Leonean depositmoney banks.
Interpretation of Diagnostic Test
Table 4.2.1 shows the results of the diagnostic tests carried out to determinethe choice and appropriateness of the estimation technique employed forthis model as well as the regression output for the model. The Hausmantest was carried out to determine whether fixed effect, random effect orpooled ordinary least square estimation technique is appropriate for themodel. The result of the hausman test showed a probability value of 0.6332

94 Journal of Asian Economics, Accounting and Finance © 2020 ESI
which is greater than the 5% level of significance hence, the significance ofthis test result indicated that the null hypothesis of the hausmanspecification test cannot be rejected by the study. Therefore, the randomeffect estimation technique was utilized for model one.
The study went further to test the appropriateness of the random effectestimation technique by conducting the Breusch and Pagan Lagrangianmultiplier test. This test has a null hypothesis that random effect is notneeded and not appropriate for the model, the result of this test showed aprobability of 0.0442 which is lower than the 5% level of significance. Thisshowed that the study cannot accept the null hypothesis and hence theacceptance of the alternate hypothesis that random effect is appropriatefor the model.
The study also carried out the crosssectional dependence test throughthe use of Breusch and Pagan CD test. This test result shows a probabilityvalue of 0.0087 which is less than the 1% level of significance. This impliesthat the residuals are correlated at 1% level of significance. Also, theBreuschPagan / CookWeisberg test for heteroscedasticity was carried outto determine if the variance of the residual are constant. This test has a nullhypothesis of constant variance of the residual, the result of the test showeda probability value of 0.000 which is lower than the 5% level of significance.This suggests that the study rejects the null hypothesis of constant variance,indicating that the variance of the residual is not constant. In testing forautocorrelation in the panel data, the Wooldridge test was conducted. This
Table 4.2.1: Regression Analysis for Model 1
Variable Coefficient Std Error tStat. Prob.
Constant 0.0053 0.0081 0.65 0.513
SP 0.0177 0.0101 1.76 0.078
Rsquared 0.0191
Diagnostic Tests Statistics Probability
Hausman test 0.23 0.6332
Multiplier test 4.05 0.0442
Heteroskedasticity test 38.54 0.0000
Wooldridge test for autocorrelation 0.309 0.5916
Pesaran’s test of cross sectional 2.625 0.0087independence
Dependent Variable: ROA; Obs.: 100 Significance level: 5%
Source: Researcher’s Study, 2019
Model 1:
ROAit = �
o+ �
1SP
it
ROA = 0.0053 + 0.0177SPit

Sustainability Practices and Performance of Sierra Leonean Deposit Money Banks 95
test has a null hypothesis of no firstorder autocorrelation and its result inthis model showed a probability value of 0.5916 which is higher than the5% level of significance. It however suggests that the study does not rejectthe null hypothesis of no firstorder autocorrelation in the model.
To jointly deal with this combination of econometrics issues of crosssectional dependence and heteroscedasticity for a random effect estimationpanel data model, the study remedied the issues by estimating the modelwith the option that produced robust standard error estimates for panelmodels using generalized least square (GLS).
Findings: The regression analysis estimates on Table 4.2.1 showed thatsustainability practices (SP) has a positive insignificant effect onperformance measured by return on asset (ROA). This is indicated by thesign of the coefficients, that is �
1 = 0.0177 > 0. This result is consistent with
a priori expectation as it was expected that sustainability practices will havea positive effect on performance. Also, the size of the coefficient of theindependent variable show that a 1 unit increase in SP, will lead to a 0.18unit increase in ROA. Furthermore, the probability of the tstatistics 1.76with pvalue of 0.078 shows that the coefficient is statistically insignificantat 5% level of significance. The R2 of 0.0191 indicates that 2% variation inreturn on asset (ROA) is attributable to sustainability practices asrepresented by sustainable solution practice index (SSPI) while theremaining 98% change in return on asset (ROA) can be attributed to othervariables not covered in this model.
Decision: At the level of significance of 0.05, the tstatistics is 1.76 whilethe pvalue is 0.078 which is greater than 0.05. Therefore, the null hypothesiswas not rejected which means that there is no significant effect ofsustainability practices on the return on asset (ROA) of Sierra Leoneandeposit money banks.
4.2.2. Test of Hypothesis Two
Research Objective 2: To evaluate the controlling effect of leverage, firmsize, firm age and risk on the effect of sustainability practices on the returnon asset of Sierra Leonean deposit money banks.
Research Question 2: What is the controlling effect of leverage, firmsize, firm age and risk on the effect of sustainability practices on the returnon asset of Sierra Leonean deposit money banks?
Research Hypothesis 2 (H02): There is no significant controlling effect
of leverage, firm size, firm age and risk on the effect of sustainabilitypractices on the return on asset of Sierra Leonean deposit money banks.

96 Journal of Asian Economics, Accounting and Finance © 2020 ESI
Table 4.2.2: Regression Analysis for Model 2
Variable Coefficient Std Error tStat. Prob.
Constant 0.0199 0.0272 0.73 0.467
SP 0.0169 0.0116 1.46 0.148
LEV 0.0214 0.0114 1.87 0.064
FS 0.0004 0.0012 0.31 0.761
FA 0.0001 0.0003 0.53 0.600
RK 0.0477 .118909 0.40 0.689
FStatistics 1.47
Prob. 0.2054
Rsquared 0.0727
Adj. Rsquared 0.0234
Diagnostic Tests Statistics Probability
Hausman test 5.95
Heteroskedasticity test 116.29 0.0000
Wooldridge test for autocorrelation 0.414 0.5362
Pesaran’s test of cross sectional 2.611 0.0090independence
Dependent Variable: ROA; Obs.: 100 Significance level: 5%
Source: Researcher’s Study, 2019
Model 2:
ROAit = �
1 + �
1SP
it �
2 LEV
it+ �
3FS
it + �
4FA
it + �
5RK
it
ROAit = 0.0199+ 0.0169SP
it 0.0214LEV
it +0.0004FS
it 0.0001FA
it 0.0477RK
it
Interpretation of Diagnostic Test
Table 4.2.2 shows the results of the diagnostic tests carried out to determinethe choice and appropriateness of the estimation technique employed forthis model as well as the regression output for the model. The Hausmantest was carried out to determine whether fixed effect, random effect orpooled ordinary least square estimation technique is appropriate for themodel. The result of the hausman test showed a value of 5.95 which doesnot meet the hausman test assumption. Therefore, the pooled OLSestimation technique was utilized for model two. The study also carriedout the crosssectional dependence test through the use of Breusch andPagan CD test. This test result shows a probability value of 0.0090 which isless than the 5% level of significance. This implies that the residuals arecorrelated at 5% level of significance.
Also, the BreuschPagan / CookWeisberg test for heteroscedasticitywas carried out to determine if the variance of the residual are constant.This test has a null hypothesis of constant variance of the residual, the

Sustainability Practices and Performance of Sierra Leonean Deposit Money Banks 97
result of the test showed a probability value of 0.000 which is lower thanthe 5% level of significance. This suggests that the study rejects the nullhypothesis of constant variance, indicating that the variance of the residualis not constant. In testing for autocorrelation in the panel data, theWooldridge test was conducted. This test has a null hypothesis of no firstorder autocorrelation and its result in this model showed a probabilityvalue of 0.5362 which is higher than the 5% level of significance. It howeversuggests that the study does not reject the null hypothesis of no firstorderautocorrelation in the model.
Findings: The regression analysis estimates on Table 4.2.2 showed thatsustainability practices (SP) has a positive insignificant effect onperformance measured by return on asset (ROA). This is indicated by thesign of the coefficients, that is �
1 = 0.0169 > 0. This result is consistent with
a priori expectation as it was expected that sustainability practices will havea positive effect on performance. Also, the size of the coefficient of theindependent variable show that a 1 unit increase in SP, will lead to a 0.017unit increase in ROA. Furthermore, the probability of the fstatistics 1.47with pvalue of 0.2054 shows that the coefficient is statistically insignificantat 5% level of significance. The R2 of 0.0727 indicates that 7% variation inreturn on asset (ROA) is attributable to sustainability practices asrepresented by sustainable solution practice index (SSPI) while theremaining 93% change in return on asset (ROA) can be attributed to othervariables not covered in this model.
Decision: At the level of significance of 0.05, the fstatistics is 1.47 whilethe pvalue is 0.2054 which is greater than 0.05. Therefore, the nullhypothesis was not rejected which means that there is no significantcontrolling effect of leverage, firm size, firm age and risk on the effect ofsustainability practices on the return on asset of Sierra Leonean depositmoney banks.
4.2.3. Test of Hypothesis Three
Research Objective 3: To evaluate the effect of sustainability practices onthe return on equity of Sierra Leonean deposit money banks.
Research Question 3: To what extent do sustainability practices affectthe return on equity of Sierra Leonean deposit money banks?
Research Hypothesis 3 (H03): There is no significant effect of
sustainability practices on the return on equity of Sierra Leonean depositmoney banks.

98 Journal of Asian Economics, Accounting and Finance © 2020 ESI
Table 4.2.3: Regression Analysis for Model 3
Variable Coefficient Std Error tStat. Prob.
Constant 0.0129 0.1053 0.84 0.400
SP 0.1058 0.0134 7.90 0.000
Rsquared 0.0107
Diagnostic Tests Statistics Probability
Hausman test 0.53 0.4664
Heteroskedasticity test 8.19 0.0042
Wooldridge test for autocorrelation 229.214 0.0000
Pesaran’s test of cross sectional 2.980 0.0029independence
Dependent Variable: ROE; Obs.: 100 Significance level: 5%
Source: Researcher’s Study, 2019
Model 3:
ROEit = �
o+ �
1SP
it
ROE = 0.0128796 + 0.1058SPit
Interpretation of Diagnostic Test
Table 4.2.3 shows the results of the diagnostic tests carried out to determinethe choice and appropriateness of the estimation technique employed forthis model as well as the regression output for the model. The Hausmantest was carried out to determine whether fixed effect, random effect orpooled ordinary least square estimation technique is appropriate for themodel. The result of the hausman test showed a probability value of 0.4664which is greater than the 5% level of significance hence, the significance ofthis test result indicated that the null hypothesis of the hausmanspecification test cannot be rejected by the study. Therefore, the randomeffect estimation technique was utilized for model three.
The study also carried out the crosssectional dependence test throughthe use of Breusch and Pagan CD test. This test result shows a probabilityvalue of 0.0029 which is less than the 5% level of significance. This impliesthat the residuals are correlated at 5% level of significance. Also, theBreuschPagan / CookWeisberg test for heteroscedasticity was carried outto determine if the variance of the residual are constant. This test has a nullhypothesis of constant variance of the residual, the result of the test showeda probability value of 0.0042 which is lower than the 5% level of significance.This suggests that the study rejects the null hypothesis of constant variance,indicating that the variance of the residual is not constant. In testing forautocorrelation in the panel data, the Wooldridge test was conducted. Thistest has a null hypothesis of no firstorder autocorrelation and its result inthis model showed a probability value of 0.000 which is lower than the 5%

Sustainability Practices and Performance of Sierra Leonean Deposit Money Banks 99
level of significance. It however suggests that the study rejects the nullhypothesis, hence the presence of autocorrelation in the model.
To jointly deal with these combination of econometrics issues of crosssectional dependence, heteroscedasticity and autocorrelation for a randomeffect estimation panel data model, the study remedied the issues byestimating the model with the option that produced robust standard errorestimates for panel models using generalized least square (GLS) estimationwith heteroscedastic, crosssectional correlation and panelspecific AR (1)correlated errors.
Findings: The regression analysis estimates on Table 4.2.3 showed thatsustainability practices (SP) has a positive effect on performance measuredby return on equity (ROE). This is indicated by the sign of the coefficients,that is �
1 = 0.1058 > 0. This result is consistent with a priori expectation as it
was expected that sustainability practices will have a positive effect onperformance. Also, the size of the coefficient of the independent variableshow that a 1 unit increase in SP, will lead to a 0.11 unit increase in ROE.Furthermore, the probability of the tstatistics of 0.000 shows that thecoefficient is statistically significant at 5% level of significance. The R2 of0.0107 indicates that 1% variation in return on equity (ROE) is attributableto sustainability practices as represented by sustainable solution practiceindex (SSPI) while the remaining 99% change in return on equity (ROE)can be attributed to other variables not covered in this model.
Decision: At the level of significance of 0.05, the tstatistics is 7.90 whilethe pvalue is 0.000 which is less than 0.05. Therefore, the null hypothesiswas rejected which means that there is a significant effect of sustainabilitypractices on the return on equity (ROE) of Sierra Leonean deposit moneybanks.
4.2.4. Test of Hypothesis Four
Research Objective 4: To evaluate the controlling effect of leverage, firmsize, firm age and risk on the effect of sustainability practices on the returnon equity of Sierra Leonean deposit money banks.
Research Question 4: What is the controlling effect of leverage, firmsize, firm age and risk on the effect of sustainability practices on the returnon equity of Sierra Leonean deposit money banks?
Research Hypothesis 4 (H04): There is no significant controlling
effect of leverage, firm size, firm age and risk on the effect ofsustainability practices on the return on equity of Sierra Leonean depositmoney banks.

100 Journal of Asian Economics, Accounting and Finance © 2020 ESI
Table 4.2.4: Regression Analysis for Model 4
Variable Coefficient Std Error tStat. Prob.
Constant 0.0551 0.4481 0.12 0.902
SP 0.1762 0.1906 0.92 0.358
LEV 0.0595 0.1879 0.32 0.752
FS 0.0020 0.0203 0.10 0.922
FA 0.0006 0.0044 0.13 0.897
RK 6.3205 1.954701 3.23 0.002
FStatistics 2.89
Prob. 0.0178
Rsquared 0.1334
Adj. Rsquared 0.0873
Diagnostic Tests Statistics Probability
Hausman test 0.10
Heteroskedasticity test 185.48 0.0000
Pesaran’s test of cross sectional 1.212 0.2257independence
Dependent Variable: ROE; Obs.: 100 Significance level: 5%
Source: Researcher’s Study, 2019
Model 4:
ROEit = �
3 + �
1SP
it �
2 LEV
it + �
3FS
it + �
4FA
it + �
5RK
it
ROEit = 0.0551+ 0.1762SP
it 0.0595LEV
it +0.0020FS
it + 0.0006FA
it 6.3205RK
it
Interpretation of Diagnostic Test
Table 4.2.4 shows the results of the diagnostic tests carried out to determinethe choice and appropriateness of the estimation technique employed forthis model as well as the regression output for the model. The Hausmantest was carried out to determine whether fixed effect, random effect orpooled ordinary least square estimation technique is appropriate for themodel. The result of the hausman test showed a value of 0.10 which doesnot meet the hausman test assumption. Therefore, the pooled OLSestimation technique was utilized for model four.
The study also carried out the crosssectional dependence test throughthe use of Breusch and Pagan CD test. This test result shows a probabilityvalue of 0.2257 which is greater than the 5% level of significance. Thisimplies that the residuals are not correlated at 5% level of significance.Also, the BreuschPagan / CookWeisberg test for heteroscedasticity wascarried out to determine if the variance of the residual are constant. Thistest has a null hypothesis of constant variance of the residual, the result ofthe test showed a probability value of 0.0000 which is lower than the 5%

Sustainability Practices and Performance of Sierra Leonean Deposit Money Banks 101
level of significance. This suggests that the study rejects the null hypothesisof constant variance, indicating that the variance of the residual is notconstant.
Findings: The regression analysis estimates on Table 4.2.4 showed thatsustainability practices (SP) has a positive effect on performance measuredby return on equity (ROE). This is indicated by the sign of the coefficients,that is �
1 = 0.1762 > 0. This result is consistent with a priori expectation as it
was expected that sustainability practices will have a positive effect onperformance. Also, the size of the coefficient of the independent variableshow that a 1 unit increase in SP, will lead to a 0.18 unit increase in ROE.Furthermore, the probability of the tstatistics of 0.000 shows that thecoefficient is statistically significant at 5% level of significance. The R2 of0.1334 indicates that 13% variation in return on equity (ROE) is attributableto sustainability practices as represented by sustainable solution practiceindex (SSPI) while the remaining 87% change in return on equity (ROE)can be attributed to other variables not covered in this model.
Decision: At the level of significance of 0.05, the fstatistics is 2.89 whilethe pvalue is 0.0178 which is less than 0.05. Therefore, the null hypothesiswas rejected which means that there is a significant controlling effect ofleverage, firm size, firm age and risk on the effect of sustainability practiceson the return on equity of Sierra Leonean deposit money banks.
4.2.3. Test of Hypothesis Five
Research Objective 5: To evaluate the effect of sustainability practices onthe net interest margin of Sierra Leonean deposit money banks.
Research Question 5: To what extent do sustainability practices affectthe net interest margin of Sierra Leonean deposit money banks?
Research Hypothesis 5 (H05): There is no significant effect of
sustainability practices on the net interest margin of Sierra Leonean depositmoney banks.
Interpretation of Diagnostic Test
Table 4.2.5 shows the results of the diagnostic tests carried out to determinethe choice and appropriateness of the estimation technique employed forthis model as well as the regression output for the model. The Hausmantest was carried out to determine whether fixed effect, random effect orpooled ordinary least square estimation technique is appropriate for themodel. The result of the hausman test showed a probability value of 0.1878which is greater than the 5% level of significance hence, the significance of

102 Journal of Asian Economics, Accounting and Finance © 2020 ESI
this test result indicated that the null hypothesis of the hausmanspecification test cannot be rejected by the study. Therefore, the randomeffect estimation technique was utilized for model five.
The study went further to test the appropriateness of the random effectestimation technique by conducting the Breusch and Pagan Lagrangianmultiplier test. This test has a null hypothesis that random effect is notneeded and not appropriate for the model, the result of this test showed aprobability of 0.000 which is lower than the 5% level of significance. Thisshowed that the study cannot accept the null hypothesis and hence theacceptance of the alternate hypothesis that random effect is appropriatefor the model.
The study also carried out the crosssectional dependence test throughthe use of Breusch and Pagan CD test. This test result shows a probabilityvalue of 0.4837 which is higher than the 5% level of significance. This impliesthat the residuals are not correlated at 5% level of significance. In testingfor autocorrelation in the panel data, the Wooldridge test was conducted.This test has a null hypothesis of no firstorder autocorrelation and its resultin this model showed a probability value of 0.0215 which is lower than the5% level of significance. It however suggests that the study rejects the nullhypothesis, hence the presence of autocorrelation in the model.
To jointly deal with this combination of econometrics issues of crosssectional dependence, and autocorrelation for a random effect estimation
Table 4.2.5: Regression Analysis for Model 5
Variable Coefficient Std Error tStat. Prob.
Constant 0.0652 0.0110 5.94 0.000
SP 0.0221 0.0134 1.66 0.098
Rsquared 0.0092
Diagnostic Tests Statistics Probability
Hausman test 1.73 0.1878
Multiplier test 55.62 0.0000
Wooldridge test for autocorrelation 7.714 0.0215
Pesaran’s test of cross sectional 0.700 0.4837independence
Dependent Variable: NIM; Obs.: 100 Significance level: 5%
Source: Researcher’s Study, 2019
Model 5:
NIMit = �
o+ �
1SP
it
NIM = 0.0652 + 0.0221SPit

Sustainability Practices and Performance of Sierra Leonean Deposit Money Banks 103
panel data model, the study remedied the issues by estimating the modelwith the option that produced robust standard error estimates for panelmodels using generalized least square (GLS).
Findings: The regression analysis estimates on Table 4.2.5 showed thatsustainability practices (SP) has a positive insignificant effect onperformance measured by net interest margin (NIM). This is indicated bythe sign of the coefficients, that is â
1 = 0.0221 > 0. This result is consistent
with a priori expectation as it was expected that sustainability practiceswill have a positive effect on performance. Also, the size of the coefficientof the independent variable show that a 1 unit increase in SP, will lead to a0.022unit increase in NIM. Furthermore, the probability of the tstatisticsof 0.098 shows that the coefficient is statistically insignificant at 5% level ofsignificance. The R2 of 0.0092 indicates that 0.9% variation in net interestmargin (NIM) is attributable to sustainability practices as represented bysustainable solution practice index (SSPI) while the remaining 99.1% changein net interest margin (NIM) can be attributed to other variables not coveredin this model.
Decision: At the level of significance of 0.05, the Tstatistics is 1.66while the pvalue is 0.098 which is greater than 0.05. Therefore, the nullhypothesis (H
05) was not rejected which means that there is no significant
effect of sustainability practices on the net interest margin (NIM) of SierraLeonean deposit money banks.
4.2.6. Test of Hypothesis Six
Research Objective 6: To evaluate the controlling effect of leverage, firmsize, firm age and risk on the effect of sustainability practices on the netinterest margin of Sierra Leonean deposit money banks.
Research Question 6: What is the controlling effect of leverage, firmsize, firm age and risk on the effect of sustainability practices on the netinterest margin of Sierra Leonean deposit money banks?
Research Hypothesis 6 (H06): There is no significant controlling effect
of leverage, firm size, firm age and risk on the effect of sustainabilitypractices on the net interest margin of Sierra Leonean deposit money banks.
Interpretation of Diagnostic Test
Table 4.2.6 shows the results of the diagnostic tests carried out to determinethe choice and appropriateness of the estimation technique employed forthis model as well as the regression output for the model. The Hausmantest was carried out to determine whether fixed effect, random effect or

104 Journal of Asian Economics, Accounting and Finance © 2020 ESI
pooled ordinary least square estimation technique is appropriate for themodel. The result of the hausman test showed a value of 3.47 which didnot meet the hausman test assumption. Therefore, the pooled OLSestimation technique was utilized for model six. The study also carried outthe crosssectional dependence test through the use of Breusch and PaganCD test. This test result shows a probability value of 0.9777 which is higherthan the 5% level of significance. This implies that the residuals are notcorrelated at 5% level of significance.
Also, the BreuschPagan / CookWeisberg test for heteroscedasticitywas carried out to determine if the variance of the residual are constant.This test has a null hypothesis of constant variance of the residual, theresult of the test showed a probability value of 0.2877 which is higher thanthe 5% level of significance. This suggests that the study does not reject thenull hypothesis of constant variance, indicating that the variance of theresiduals is constant. In testing for autocorrelation in the panel data, theWooldridge test was conducted. This test has a null hypothesis of no first
Table 4.2.6: Regression Analysis for Model 6
Variable Coefficient Std Error tStat. Prob.
Constant 0.0841 0.0295 2.85 0.005
SP 0.0161 0.0126 1.28 0.203
LEV 0.0412 0.0124 3.32 0.001
FS 0.0008 0.0013 0.59 0.556
FA 0.0002 0.0003 0.73 0.470
RK 0.3636 0.1288 2.82 0.006
FStatistics 3.55
Prob. 0.0056
Rsquared 0.1587
Adj. Rsquared 0.1139
Diagnostic Tests Statistics Probability
Hausman test 3.47
Heteroskedasticity test 1.13 0.2877
Wooldridge test for autocorrelation 10.438 0.0103
Pesaran’s test of cross sectional 0.028 0.9777independence
Dependent Variable: NIM; Obs.: 100 Significance level: 5%
Source: Researcher’s Study, 2019
Model 6:
NIMit = �
5 + �
1SP
it �
2 LEV
it + �
3FS
it + �
4FA
it + �
5RK
it
NIMit = 0.0841+ 0.0161SP
it 0.0412LEV
it +0.0008FS
it 0.0002FA
it + 0.3636RK
it

Sustainability Practices and Performance of Sierra Leonean Deposit Money Banks 105
order autocorrelation and its result in this model showed a probabilityvalue of 0.0103 which is lower than the 5% level of significance. It howeversuggests that the study rejects the null hypothesis, hence the presence ofautocorrelation in the model.
Findings: The regression analysis estimates on Table 4.2.6 showed thatsustainability practices (SP) has a positive insignificant effect onperformance measured by net interest margin (NIM). This is indicated bythe sign of the coefficients, that is �
1 = 0.0161 > 0. This result is consistent
with a priori expectation as it was expected that sustainability practiceswill have a positive effect on performance. Also, the size of the coefficientof the independent variable show that a 1 unit increase in SP, will lead to a0.016unit increase in NIM. Furthermore, the probability of the fstatisticsof 0.0056 shows that the coefficient is statistically significant at 5% level ofsignificance. The R2 of 0.1587 indicates that 16% variation in net interestmargin (NIM) is attributable to sustainability practices as represented bysustainable solution practice index (SSPI) while the remaining 84% changein net interest margin (NIM) can be attributed to other variables not coveredin this model.
Decision: At the level of significance of 0.05, the fstatistics is 3.55while the pvalue is 0.0056 which is lower than 0.05. Therefore, the nullhypothesis (H
06) was rejected which means that there is significant
controlling effect of leverage, firm size, firm age and risk on the effect ofsustainability practices on the net interest margin of Sierra Leoneandeposit money banks.
4.2.7. Test of Main Model One
Research Objective: To evaluate the effect of sustainability practices onthe performance of Sierra Leonean deposit money banks.
Research Question: To what extent do sustainability practices affectthe performance of Sierra Leonean deposit money banks?
Research Hypothesis: There is no significant effect of sustainabilitypractices on the performance of Sierra Leonean deposit money banks.
Table 4.2.7: Regression Analysis for Main Model 1
Variable Coefficient Std Error tStat. Prob.
Constant 0.0604 0.0131 4.60 0.000
SP 0.0109 0.0173 0.63 0.528
Rsquared 0.0033
contd. table 4.2.7

106 Journal of Asian Economics, Accounting and Finance © 2020 ESI
Diagnostic Tests Statistics Probability
Hausman test 0.66 0.4167
Multiplier test 1.15 0.2838
Heteroskedasticity test 13.41 0.0003
Wooldridge test for autocorrelation 3.235 0.1056
Dependent Variable: PER; Obs.: 100 Significance level: 5%
Source: Researcher’s Study, 2019
Main Model 1:
PERit = �
o+ �
1SP
it
PER = 0.0604 0.0109SPit
Interpretation of Diagnostic Test
Table 4.2.7 shows the results of the diagnostic tests carried out todetermine the choice and appropriateness of the estimation techniqueemployed for this model as well as the regression output for the model.The Hausman test was carried out to determine whether fixed effect,random effect or pooled ordinary least square estimation technique isappropriate for the model. The result of the hausman test showed aprobability value of 0.4167 which is greater than the 5% level ofsignificance hence, the significance of this test result indicated that thenull hypothesis of the hausman specification test cannot be rejected bythe study. Therefore, the random effect estimation technique was utilizedfor model seven.
The study went further to test the appropriateness of the random effectestimation technique by conducting the Breusch and Pagan Lagrangianmultiplier test. This test has a null hypothesis that random effect is notneeded and not appropriate for the model, the result of this test showed aprobability of 0.2838 which is higher than the 5% level of significance. Also,the BreuschPagan/CookWeisberg test for heteroscedasticity was carriedout to determine if the variance of the residual are constant. This test has anull hypothesis of constant variance of the residual, the result of the testshowed a probability value of 0.0003 which is lower than the 5% level ofsignificance. This suggests that the study rejects the null hypothesis ofconstant variance, indicating that the variance of the residual is not constant.In testing for autocorrelation in the panel data, the Wooldridge test wasconducted. This test has a null hypothesis of no firstorder autocorrelationand its result in this model showed a probability value of 0.1056 which ishigher than the 5% level of significance. It however suggests that the studydoes not reject the null hypothesis of no firstorder autocorrelation in themodel.

Sustainability Practices and Performance of Sierra Leonean Deposit Money Banks 107
To jointly deal with this combination of econometrics issues of crosssectional dependence and heteroscedasticity for a random effect estimationpanel data model, the study remedied the issues by estimating the modelwith the option that produced robust standard error estimates for panelmodels using generalized least square (GLS).
Findings: The regression analysis estimates on Table 4.2.7 showed thatsustainability practices (SP) has a negative effect on performance measuredby the geometric mean of return on asset (ROA), return on equity (ROE)and net interest margin (NIM). This is indicated by the sign of thecoefficients, that is â
1 = 0.010936 < 0. This result is not consistent with the a
priori expectation as it was expected that sustainability practices will havea positive effect on performance. Also, the size of the coefficient of theindependent variable shows that a 1 unit increase in SP, will lead to a 0.01unit decrease in PER. Furthermore, the probability of the tstatistics of 0.528shows that the coefficient as is statistically insignificant at 5% level ofsignificance. The R2 of 0.0033 indicates that 0.33% variation in performance(PER) is attributable to sustainability practices as represented by sustainablesolution practice index (SSPI) while the remaining 99.67% changes inperformance (PER) can be attributed to other variables not covered in thismodel.
Decision: At the level of significance of 0.05, the Tstatistics is 0.63while the pvalue is 0.528 which is greater than 0.05. Therefore, the nullhypothesis was not rejected which means that there is no significant effectof sustainability practices on the performance (PER) of Sierra Leoneandeposit money banks.
4.2.8. Test of Main Model Two
Research Objective: To evaluate the controlling effect of leverage, firmsize, firm age and risk on the effect of sustainability practices on theperformance of Sierra Leonean deposit money banks.
Research Question: What is the controlling effect of leverage, firmsize, firm age and risk on the effect of sustainability practices on theperformance of Sierra Leonean deposit money banks?
Research Hypothesis: There is no significant controlling effect ofleverage, firm size, firm age and risk on the effect of sustainability practiceson the performance of Sierra Leonean deposit money banks.
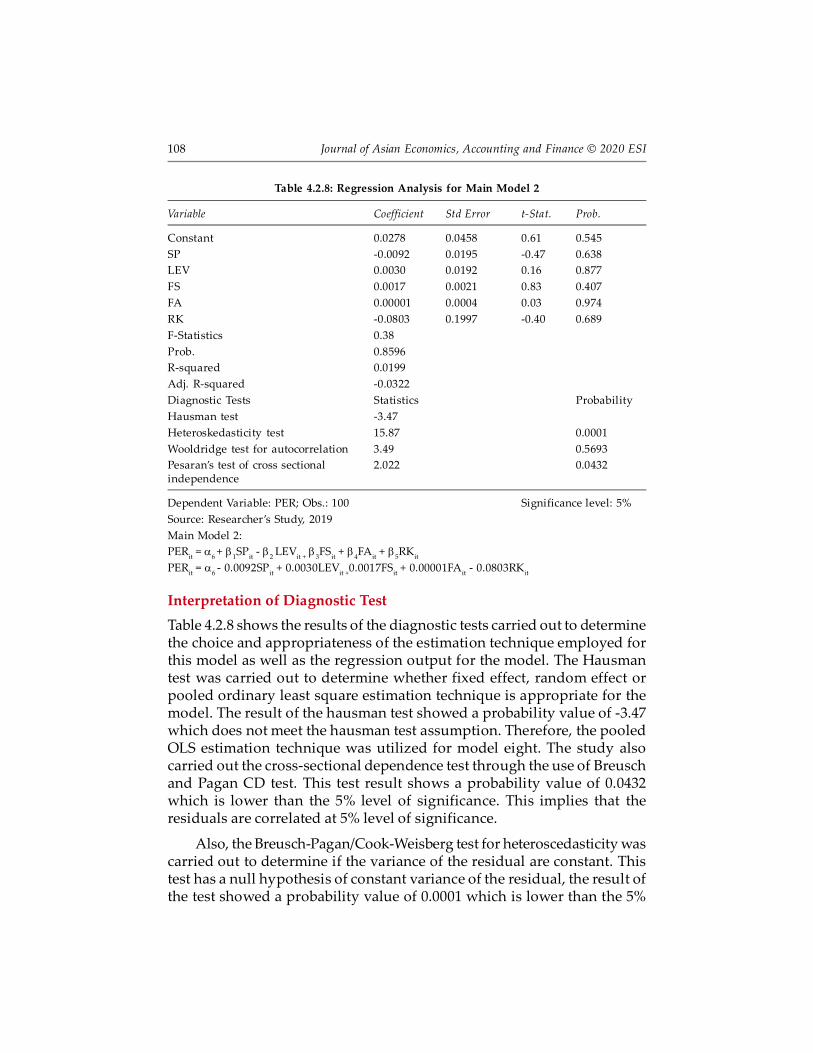
108 Journal of Asian Economics, Accounting and Finance © 2020 ESI
Table 4.2.8: Regression Analysis for Main Model 2
Variable Coefficient Std Error tStat. Prob.
Constant 0.0278 0.0458 0.61 0.545
SP 0.0092 0.0195 0.47 0.638
LEV 0.0030 0.0192 0.16 0.877
FS 0.0017 0.0021 0.83 0.407
FA 0.00001 0.0004 0.03 0.974
RK 0.0803 0.1997 0.40 0.689
FStatistics 0.38
Prob. 0.8596
Rsquared 0.0199
Adj. Rsquared 0.0322
Diagnostic Tests Statistics Probability
Hausman test 3.47
Heteroskedasticity test 15.87 0.0001
Wooldridge test for autocorrelation 3.49 0.5693
Pesaran’s test of cross sectional 2.022 0.0432independence
Dependent Variable: PER; Obs.: 100 Significance level: 5%
Source: Researcher’s Study, 2019
Main Model 2:
PERit = �
6 + �
1SP
it �
2 LEV
it + �
3FS
it + �
4FA
it + �
5RK
it
PERit = �
6 0.0092SP
it + 0.0030LEV
it +0.0017FS
it + 0.00001FA
it 0.0803RK
it
Interpretation of Diagnostic Test
Table 4.2.8 shows the results of the diagnostic tests carried out to determinethe choice and appropriateness of the estimation technique employed forthis model as well as the regression output for the model. The Hausmantest was carried out to determine whether fixed effect, random effect orpooled ordinary least square estimation technique is appropriate for themodel. The result of the hausman test showed a probability value of 3.47which does not meet the hausman test assumption. Therefore, the pooledOLS estimation technique was utilized for model eight. The study alsocarried out the crosssectional dependence test through the use of Breuschand Pagan CD test. This test result shows a probability value of 0.0432which is lower than the 5% level of significance. This implies that theresiduals are correlated at 5% level of significance.
Also, the BreuschPagan/CookWeisberg test for heteroscedasticity wascarried out to determine if the variance of the residual are constant. Thistest has a null hypothesis of constant variance of the residual, the result ofthe test showed a probability value of 0.0001 which is lower than the 5%

Sustainability Practices and Performance of Sierra Leonean Deposit Money Banks 109
level of significance. This suggests that the study rejects the null hypothesisof constant variance, indicating that the variance of the residual is notconstant. In testing for autocorrelation in the panel data, the Wooldridgetest was conducted. This test has a null hypothesis of no firstorderautocorrelation and its result in this model showed a probability value of0.5693 which is higher than the 5% level of significance. It however suggeststhat the study does not reject the null hypothesis of no firstorderautocorrelation in the model.
Findings: The regression analysis estimates on Table 4.2.8 showed thatsustainability practices (SP) has a negative effect on performance measuredby the geometric mean of return on asset (ROA), return on equity (ROE)and net interest margin (NIM). This is indicated by the sign of thecoefficients, that is â
1 = 0.0092 < 0. This result is not consistent with the a
priori expectation as it was expected that sustainability practices will havea positive effect on performance. Also, the size of the coefficient of theindependent variable shows that a 1 unit increase in SP, will lead to a 0.009unit decrease in PER. Furthermore, the probability of the fstatistics of 0.8596shows that the coefficient is statistically insignificant at 5% level ofsignificance. The R2 of 0.0199 indicates that 2% variation in performance(PER) is attributable to sustainability practices as represented by sustainablesolution practice index (SSPI) while the remaining 98% changes inperformance (PER) can be attributed to other variables not covered in thismodel.
Decision: At the level of significance of 0.05, the fstatistics is 0.38 whilethe pvalue is 0.8596 which is greater than 0.05. Therefore, the nullhypothesis was not rejected which means that there is no significantcontrolling effect of leverage, firm size, firm age and risk on the effect ofsustainability practices on the performance of Sierra Leonean depositmoney banks.
5. SUMMARY, CONCLUSION AND RECOMMENDATIONS
Conclusion
The study examined the effect of sustainability practices on the performanceof Sierra Leonean deposit money banks. The findings from the studyprovide relevant empirical evidence by showing that sustainabilitypractices have an insignificant positive effect on return on assets and netinterest margin while there was a positive significant effect of sustainabilitypractices on return on equity. Also, sustainability practices have a negativebut insignificant effect on performance. This constituted statistical and

110 Journal of Asian Economics, Accounting and Finance © 2020 ESI
empirical evidence for the implications of sustainability practices on theperformance of Sierra Leonean deposit money banks.
Thus, this research concluded that a positive relationship existsbetween sustainability practices and the performance of Sierra Leoneandeposit money banks.
Recommendations
The following recommendations are made based on the findings andconclusion of this study;
Investors should look to encourage sustainability practices by investingin organizations committed to sustainability practices.
The management of organizations should continue to incorporatesustainability practices in their business strategies and be more innovative.
Regulators should recognize commitment to sustainability practicesamong organizations and review existing guidelines from time to time toreflect current demands.
In trying to be sustainable, organizations should not cut down on thetraditional activities that enhance profit maximization which is one of theprimary purposes of its existence.
References
Adams, R. B., & Ferreira, D. (2004). Gender diversity in the boardroom. European CorporateGovernance Institute, Finance Working Paper 57. ECGI, Brussels.
Adenikinju, O. (2005). Managerial characteristics, corporate governance and corporateperformance: The case of Sierra Leonean quoted companies. Being Draft Final Reportsubmitted to the AERC, November, 2005.
Adusei, M., Akomea, S. Y. &Poku, K. (2017). Board and management gender diversity andfinancial performance of microfinance institutions. Cogent Business & Management, 4,1360030 Retrieved 21/12/2017 from https://doi.org/10.1080/23311975.2017.1360030
Aggarwal, P. (2013). Impact of sustainability performance of company on its financialperformance: a study of listed Indian companies. Global Journal of Management andBusiness Resources, 13(11), 111.
Ahtik, M., Banerjee, B., Remsak, F. (2016). Net interest margin in a low interest rateenvironment: Evidence for Slovenia. The Journal for Money and Banking, 65(11), 7789.
Akingunola R., Adekunle O. &Adedipe O. (2013). Corporate governance and bank’sperformance in Sierra Leone (post – bank’s consolidation). European Journal of Businessand Social Sciences, 2(8), 89111.
Anya, O. A. (2003). Corporate governance as an effective tool for combating financial andeconomic crimes. The Sierra Leonean Bankers, October December Edition 3236.
Asuquo, A. I., Dada, E. T. &Onyeogaziri, U. R. (2018). The effect of sustainability reportingon corporate performance of selected quoted brewery firms in Sierra Leone. InternationalJournal of Business & Law Research 6(3), 110.

Sustainability Practices and Performance of Sierra Leonean Deposit Money Banks 111
Avkiran, N. K., & Morita, H. (2010). Benchmarking firm performance from a multiplestakeholder perspective with an application to Chinese banking. The InternationalJournal of Management Science, 38(2), 501516.
Babalola, A. &Adedipe, O. (2014). Corporate governance and sustainable banking sector:evidence from Sierra Leone. Research Journal of Finance and Accounting, 5 (12), 6379.
Bansal, P. (2002). The corporate challenges of sustainable development. The Academy ofManagement Executive, 16(2), 122131.
Barclays (2009). Barclays sustainability review. Barclays PLC Responsible Banking Review,UK.
Burke, R. (2000). Company size, board size, and the numbers of women corporate directors.Women on corporate boards of directors: International challenges and opportunities, 118–125.
Cadbury, S. A. (2000). The corporate governance agenda. Corporate Governance: AnInternational Review, 8(1), 7–15.
Carver, J. (2002). On board leadership (1st Edition). New York: JosseyBass Books & Press.
Case, P. (2012). Managing sustainability risks and opportunities in the financial servicessector. NonExecutive Directors Briefing, Price Water house Coopers.
Central Bank of Sierra Leone (2012). Implementation of sustainable banking principles bybanks, discount houses and development finance institutions in Sierra Leone. Retrieved21/12/2017 from https://www.CBSL.gov.ng/out/2012/ccd/circularnsbp.pdf
Chan, S. &Heang, L. (2010). Corporate governance, board diversity and bank efficiency:the case of commercial banks in Malaysia. The Asian Business & Management Conference,577595.
Chan, M. C., Watson, J. and Woodliff, D. (2014). Corporate Governance Quality and CSRDisclosures. Journal of Business Ethics, 125(1), 59–73.
Clark, G., Feiner, A. & Viehs, M. (2015). From the stockholder to the stakeholder: howsustainability can drive financial outperformance. Smith School of Enterprise and theEnvironment, University of Oxford.
Clarke, T. & Boersma, M. (2016). Sustainable finance: a critical analysis of the regulation,policies, strategies, implementation and reporting on sustainability in internationalfinance. UNEP Inquiry and CIGI Working Paper Series.
Clarkson, M. B. E. (1995). A stakeholder framework for analyzing and evaluating corporatesocial performance. Academy of Management Review, 20 (1), 92117.
Coleman, A. & Nicholas Biekpe, N. (2006). Do boards and CEOs matter for bankperformance? A comparative analysis of banks in Ghana. Journal of Business Management,University of Stellenbosch Business School (USB), Cape Town, South Africa 13, 46 59.
Coulson, A. B. (2009). How should banks govern the environment? Challenging theconstruction of action versus veto. Business Strategy and the Environment, 18(3), 149161.
CSR Asia, (n.d.). The role of the private sector in women’s economic empowerment in Asia.Responsible and Inclusive Business Asia.
Dacin, M. T., Goodstein, J., & Scott, W. R. (2002). Institutional theory and institutionalchange: introduction to the special research forum. Academy of Management Journal,45(1), 4556.
Daily, C. M., Dalton, D. R. & Canella, A.A. (2003). Corporate governance: decades of dialogueand data. Academy of Management Review, 28 (3), 371382.

112 Journal of Asian Economics, Accounting and Finance © 2020 ESI
De Koker, L., &Jentzsch, N. (2013). Financial inclusion and financial integrity: alignedincentives? World Development, 44, 267280.
Deloitte (2017). Sustainable banking as a driver for growth: a survey of Sierra Leoneanbanks. Retrieved 29/12/2017 from https://www.deloitte.com/ng/en/pages/strategy/articles/sustainablebankingasadriverforgrowthasurveyofSierra Leoneanbanks.html
Donaldson, T. & Preston, L.E. (1995). The stakeholder theory of the corporation: concepts,evidence and implications. Academy of Management Review, 20 (1), 6591.
Douglas, A., Doris, J. & Johnson, B., (2004). Corporate social reporting in Irish financialInstitutions. The TQM Magazine, 16 (6), 387.
Eapen, S. (2016). Advancing women’s economic empowerment through the financial servicessector. Retrieved 07/01/2018 from https://www.bsr.org/ourinsights/advancingwomeneconomicempowermentthroughthefinancialservicessector
Ebdane, T. M. (2016). The impact of sustainability reporting on company performance: ThePhilippine perspective. Journal of Asia Entrepreneurship and Sustainability, 12(1), 3445.
Ebrahim, M. A., Abdullah, K. A. &Faudziah, H. B. (2014). The measurements of firmperformance’s dimension. Asian Journal of Finance &Accounting, 6(1), 2449.
Eccles, R.G., Ioannou, I., &Serafeim, G. (2011). The impact of a corporate culture ofsustainability on corporate behavior and performance. Harvard Business School WorkingPaper, 12, 035.
Eccles, R.G &Serafeim, G. (2013). Sustainability in financial services is not about beinggreen. Sustainability Harvard Business Review. Retrieved 16/05/18 from https://hbr.org/2013/05/sustainabilityinfinancialservicesisnotaboutbeinggreen
Emerson, J. (n.d.). Risk, Return and impact: understanding diversification and performancewithin an impact investing portfolio. Impact AssetsIssue Brief, 2.
Enyi, E, (2018). Analyzing dependent variables with multiple surrogates in accountingresearch. Retrieved 20/07/2019 from https://www.researchgate.net /publications/329380483
European Central Bank (2010). Beyond roe: how to measure bank performance. Retrieved21/07/2018 from http://www.ecb.europe.eu
Ernst & Young (EY) (2013). Building a better working world together: EMEIA financialservices sustainability report.
Fija³kowska, J., ZyznarskaDworczak, B., &Garsztka, P. (2018). Corporate socialenvironmental performance versus financial performance of banks in central andeastern European countries. Sustainability, 10, 772.
Fondas, N., &Sassalos, S. (2000). A different voice in the boardroom: how the presence ofwomen directors affects board inûuence over management. Global Focus, 12, 13–22
Francoeur, C., Labelle, R., & SinclairDesgagne, B. (2008). Gender diversity in corporategovernance and top management. Journal of Business Ethics, 81(1), 83–95
Freeman (1984). Strategic management: a stakeholder approach. Journal of ManagementStudies 29(2), 131154.
Freeman, E (1999): Divergent stakeholder theory. Academy of Management Review, 24(1),233 239.
Gandhi, I. (1972). Plenary session of United Nations conference on humanenvironment:man and the environment. Stockholm. Retrieved 21/12/2017 from http://lasulawsenvironmental.blogspot.ca/2012/07/indiragandhisspeechatstockholm.html.

Sustainability Practices and Performance of Sierra Leonean Deposit Money Banks 113
Gelder, J.W.V. (2006). The do’s and don’ts of sustainable banking: a bank track manual.Bank Track. Retrieved 07/01/2018 from http://www.banktrack.org/download/the_dos_and_donts_of_sustainable_banking/061129_the_dos_and_donts_of_sustainable_banking_bt _manual.pdf
Gieseche, K. (2004). Credit risk modeling and valuation: An introductionto credit risk models andmanagement (2nd Edition). London: Cornell University Books & Press.
Gimeno, R., Mateos de Cabo, R. and Nieto, M. (2011). Gender diversity on european banks’boards of directors. Journal of Business Ethics. DOI: 10.1007/s1055101111126
Godard, O. (2010). The economic enterprise for sustainable development: challenges andenvironmental policies. French Notebooks, (306), France.
Goel, P. (2010). Triple bottom line reporting: an analytical approach for corporatesustainability. Journal of Finance Accounting and Management, 1(1),2742.
GómezBezares, F., Przychodzen, W. &Przychodzen, J. (2016). Corporate sustainability andshareholder wealth—evidence from british companies and lessons from the crisis.Sustainability, 8, 276.
Grunda, R. (2011). Corporate sustainability assessment: a historical review. Kaunas Universityof Technology: Engineering Economics 22(1), 3240.
Haider, M. B. (2010). An overview of corporate social and environmental reporting (cser)in developing countries. Issues in Social and Environmental Accounting, 4(1), 317.
Halamka, R. (2015). Ethics as a Way to Sustainability in Banking. (Unpublished M.Sc.Project). Charles University, Prague.
Haslinda, A. & Benedict, V. (2009). Fundamentals and ethics of corporate governance. MidEastern Finance and Economics, 4(4), 8896.
Hawken, P. (2013). Blue and green tomorrow: the guide to sustainable banking. Retrieved07/07/2018 from http://blueandgreentomorrow.com/wpcontent/uploads/2013/10/guideto banking201310MB.pdf
Hawkins, P (2011). Financial access: what has the crisis changed? BIS Papers, 56(9), 1120.
Hejazi, R. &Hesari, S. (2012). Investor’s reaction to the disclosure types of corporate socialresponsibilities. 2012 2nd International Conference on Social Science and Humanity.Vol. 31. Singapore: IACSIT Press. Retrieved 25/08/2018 from http://www.ipedr.com/vol31/027ICSSH 2012S10023.pdf, 23.1.2013
Hempel, G. H., Simon, D. G. & Coleman, A. B. (1994). Bank management text and cases (3rd
Edition). New Jersey: John Wiley & Sons Books & Press.
Hillman, A., Cannella, A. &Paetzold, R.(2000). The resource dependence role of corporatedirectors: strategic adaptation of board composition in response to environmentalchange. Journal of .Management Studies, 37(2), 235–256.
International Center for Research on Women (ICRW), (2011). Understanding and measuringwomen’s economic empowerment.
International Federation of Accountants (IFAC), (2006). Why sustainability counts forprofessional accountants in business. Retrieved 16/05/2018 from http://www.ifac.org.
International Finance Corporation (2007). Banking on sustainability: financing environmentaland social opportunities in emerging markets. Retrieved 16/05/2018 from https://firstforsustainability.org/media/IFC%20Banking%20on%20Sustainability.pdf
International Finance Corporation (2016). Sustainability at IFC. Retrieved 16/05/2018 fromhttp: //www.ifc.org/wps/wcm /connect /Topics _Ext_Content/IFC_External_

114 Journal of Asian Economics, Accounting and Finance © 2020 ESI
Corporate_Site/IFC+Sustainability/Partnerships/Sustainable+Banking+Network/SB+Guidance+from+SBN+Members/
International Finance Corporation (2017). Greening the banking system experiences fromthe sustainable banking network (SBN). Input Paper for the G20 Green Finance StudyGroup.
International Institute for Sustainable Development (2013). Key drivers of sustainability inthe banking industry, Canadabeyond.
Imeson, M. & Sim, A (2010). Sustainable banking: why helping communities and savingthe planet is good for business. SAS White Paper Issued by SAS Institute Inc.WorldHeadquarters.
Islam, A., Siddiqui, M., Hossain, F. & Karim, L. (2014). Performance evaluation of thebanking sector in Bangladesh: a comparative analysis. Business and Economic Research,4 (1), 70107.
IUCN/UNEP/WWF (1991). Caring for the earth: a strategy for sustainable living. Gland,Switzerland, PIO.
Jaggi, B. & Freedman, M. (1992). An examination of the impact of pollution performanceon economic and market performance: pulp and paper firms. Journal of BusinessAccounting and Finance, 19(5), (697713).
Jeucken, M. H., & Bouma, J. J. (1999). The changing environment of banks. GreenerManagement International, 27(1), 2035.
Jeucken, M. (2001). Sustainable finance and banking: The financial sector and the future of theplanet (1st Edition). London: Earthscan Books & Press.
Jeucken, M. (2001). Banking and sustainability: slow starters are gaining pace. Retrieved21/12/2018 from http://sustainabilityinfinance.com/ecweb.pdf
Jeucken, M. (2004). Sustainability in finance: Banking on the planet (2nd Edition). Delft: EburonBooks & Press.
Johnson, J. L., Daily, C.M. & Ellstrand, A.E. (1996). Boards of directors: a review and researchagenda. Journal of Management, 22 (3), 409424.
Kiel, G. C., & Nicholson, G. J. (2003). Board composition and corporate performance: howthe Australian experience informs contrasting theories of corporate governance.Corporate Governance: An International Review, 11, 189–205.
Kimball, R. C. (1988). Economic profit and performance measurement in banking. NewEngland Economic Review, 3553.
Klein, M. U., & Mayer, C. (2011). Mobile banking and financial inclusion: the regulatorylessons. World Bank Policy Research Working Paper Series 5664.
Kolk, A. (2004) A decade of sustainability reporting: developments and significance.International Journal for Environment and Sustainable Development, 3(1), 51–64.
Korslund, D. (2013). Sustainable banking starts with determining human needs. Interviewby Carol Adams: Guardian sustainable business Finance. Retrieved 23/03/2018 from https://www.theguardian.com/sustainablebusiness/sustainablebankinghumanneedsdavidkorslund
Kostova, T., Roth, K., &Dacin, M. T. (2008). Institutional theory in the study of multinationalcorporations: a critique and new directions. Academy of Management Review, 33(4), 9941006.
Lassala, C., Apetrei, A. &Sapena, J. (2017). Sustainability matter and financial performanceof companies. Sustainability, 9(9), 1498.

Sustainability Practices and Performance of Sierra Leonean Deposit Money Banks 115
Lubber, M. (2013). Why sustainable investment does not mean lower returns. GuardianSustainable Business Finance. Retrieved 24/12/2017 from https://www.theguardian.com/sustainablebusiness/sustainableinvestmentlowerreturns
Mateos, R., Gimeno, R., &Escot, L. (2011). Disentangling discrimination on Spanish boardsof directors. Corporate Governance: An International Review, 19(1), 77–95.
Mayer, C (1999). Corporate governance in the UK. A Paper Presented at The Conference onCorporate Governance: A Comparative Perspective, held in University of Oxford on16th October, 1999.
Meyer, J. W., & Rowan, B. (1977). Institutionalized organizations: formal structure as mythand ceremony. American Journal of Sociology, 83(2), 340363.
McKinsey, (2007). Women matter: gender diversity a corporate performance driver. Women’sForum for the Economy and Society, 10.
Moore, H. (2004). The environment and sustainability as investment themes: risk and returncharacteristics. Institute for Economy and the Environment(IWOeHSG), Discussion Paper110.
Muller, A. &Pfleger, R. (2014). Business transformation towards sustainability. BusinessResearch, 7(2), 313–350.
Mushtaq, S., &Siddiqui , D.A. (2017). Effect of interest rate on bank deposits: evidencesfrom Islamic and nonIslamic economies. Future Business Journal, 3(1), 1–8
Ngwakwe, C.C. (2009). Environmental responsibility and firm performance: evidence fromSierra Leone. International Journal of Economics and Management Engineering, 2(10), 10551062.
Nguyen, J., (2012). The relationship between net interest margin and noninterest incomeusing a system estimation approach. Journal of Banking & Finance, 36(9), 24292437.
Nieto, M. J. (2017). Banks and environmental sustainability: some reflections from theperspective of financial stability. CEPS Policy Brief.
Nwobu, O. (2017). Sustainability reporting in financial institutions: a study of the SierraLeonean banking sector. Journal of Internet Banking and Commerce, 22(8), 115.
Oh, S.; Hong, A.; & Hwang, J. (2017). An analysis of CSR on firm financial performance instakeholder perspectives. Sustainability 9(6), 10231034.
Oman, C. P. (2001), Corporate governance and national development. OECD DevelopmentCenter Technical Papers, 180, 362388
Okeke, M. (2018). Banking and sustainability: what nexus? The Guardian Opinion. Retrieved16/05/2018 https://guardian.ng/opinion/bankingandsustainabilitywhatnexus/
Oni, O. (2016). Banking on financial sector sustainability regulations. (Unpublished MScproject) Waterloo, Ontario, Canada.
Organization for Economic Cooperation Economic Cooperation Development (OECD), (2002).Principles of corporate government. Retrieved 21/12/2017 from http:// www.Oecd.Org.
Oyewo, B. M. & Badejo, S. O. (2014). Sustainable development reporting practices by SierraLeonean Banks. Mediterranean Journal of Social Sciences, 5(23), 25352544.
Özçelik, F. & Öztürk, B. (2014). Evaluation of banks’ sustainability performance in Turkeywith grey relational analysis. The Journal of Accounting and Finance, 4(9), 189210.
Pamane, K. &Vikpossi, A. (2010). An analysis of the relationship between risk and expectedreturn in the BRVM stock exchange: test of the CAPM. Research in World Economy, 5(1),1328.

116 Journal of Asian Economics, Accounting and Finance © 2020 ESI
Panjaitan, I. (2017). The influences of sustainability report and corporate governance towardfinancial and entity market performance with political visibility as moderating variable.Binus Business Review, 8(1), 6166.
Park, C. Y. and Mercado, R.V. (2015). Financial inclusion, poverty, and income inequalityin developing Asia. ADB Economics Working Paper Series, No. 426.
Pathan, S. & Robert, F. (2013). Does board structure in banks really affect their performance?Journal of Banking and Finance, 37(5), 15731589.
Paulet, E., Parnaudeau, M. and Relano, F. (2014). Banking with ethics: strategic moves andstructural changes of the banking industry in the aftermath of the subprime mortgagecrisis. Journal of Business Ethics, 125(1), 7489.
Pettway, R. &Sinkey, J. (1980) Establishing onsite bank examination priorities: an earlywarning detection system using accounting and market information. Journal of Finance35(2), 137149.
Ramnarain, T. & Pillay, M. (2015). Designing sustainable banking services: the case ofMauritian banks. Procedia Social and Behavioral Sciences, 224(4), 483 – 490.
Rebai, S., Azaiez, M. &Saidane, D. (2012). Sustainable performance evaluation of banksusing a multiattribute utility model: an application to French banks. Procedia Economics and Finance, 2(7),363 – 372.
Rengasamy, D. (2012). The need to evaluate bank performance. Retrieved 21/12/2017 fromhttp://www.theborneopost.com/2012/11/06/theneedtoevaluatebankperformance/
Rogers, J. (2013). How sustainability metrics help build trust in the financial sector. Greenbiz.Retrieved 21/12/2017 from http://www.greenbiz.com/blog/2013/04/26/howsustainabilitymetricshelpsbuildtrustfinancialsector
Sachs, J., & SchmidtTraub, G. (2014). Financing sustainable development: implementingthe SDGs through effective investment strategies and partnerships. Paris and NewYork Sustainable Development Solutions Network 2015.
Salked, M. (2011). Determinants of banks’ total risk: accounting ratios and macroeconomicindicators. Honors Projects. Paper 24. Retrieved 29/12/2017 from http://digitalcommons.iwu.edu/busadmin_honproj/24
Saravanamuthu, K. (2004). What is measured counts: harmonized corporate reporting andsustainable economic development. Critical Perspectives on Accounting, 15(3), 295–302.
Scholtens, B. (2006). Finance as a driver of corporate social responsibility. Journal of BusinessEthics, 68(1), 19–33.
Schwarzmuller, T., Brosi, P., Stelkens, V., Sporrle, M. &Welpe, I. (2017). Investors’ reactionsto companies’ stakeholder management: the crucial role of assumed costs and perceivedsustainability. Business Research, 10(2), 79–96.
Scott, W. R. (2004). Institutional theory. Encyclopedia of Social Theory, 11, 408414.
Setiyono, B. &Tarazi, A. (2014). Does diversity of bank board members affect performanceand risk? Evidence from an emerging market. Retrieved 21/01/2108 from http://dx.doi.org/10.2139/ssrn.2491145
Smouts, M. C. (2005). Sustainable development Editions. France : Armand Colin.
Soppe, A. (2004). Sustainable corporate finance. Journal of Business Ethics, 53(12), 213224.
Sundaram, A. K. &Inkpen, A. C. (2004). The corporate objective revisited. OrganizationScience, 15 (3), 350363.

Sustainability Practices and Performance of Sierra Leonean Deposit Money Banks 117
Stanley, M. (2015). Sustainable reality: understanding the performance of sustainableinvestment strategies. Retrieved 21/07/2018 from https://www.sustainablebrands.com/digital_learning/research_report/stakeholder_trends_insight/sustainable_reality_understanding_perfor
Straw, R. (2013). Sustainable banking: focus financial services. Audit Committee News. KPMGAusgabe, 40 / Q1. Retrieved 21/12/2017 from http://www.kpmg.com/CH/Documents/ACNews/pub2012122006sustainablebankingde.pdf
Singh, V., Vinnicombe, S., & Johnson, P. (2001). Women directors ontop UK boards. CorporateGovernance: An International Review, 9(3), 206–216
Székely, F. &Knirsch, M. (2005). Leadership and corporate responsibility metrics forsustainable corporate performance. Working Paper Series on Leadership andSustainability, European School of Management and Technology.
Taþkýn, D. (2015). The relationship between CSR and banks’ financial performance:Evidence from Turkey. Journal of Yasar University, Special Issue, 2130.
Terjesen, S., & Singh, V. (2008). Female presence on corporate boards: a multicountry studyof environmental context. Journal of Business Ethics, 83(1), 55–63.
The Financial Times/International Finance Corporation (2008). Banking & finance: agendafor sustainable banking in Sierra Leone. Retrieved 16/05/2018 from www.financialSierraLeone.com/developmentreportcategoryite
Tilt, C.A. (2009). Corporate responsibility, accounting and accountants. ProfessionalsPerspectives of Corporate Social Responsibility 14(2), 1132.
Tolbert, P. S., & Zucker, L. G. (1999). The institutionalization of institutional theory. StudyingOrganization.Theory& Method. London, Thousand Oaks, New Delhi, 169184.
United Nations Environment Programme, (2015). Inquiry into the design of a sustainablefinancial system: the financial system we need. United Nations Environment Programme,13.
United Nations General Assembly, (2005). World summit resolution outcome A/60/1.Adopted by the general assembly.
Van der Walt, N., &Ingley, C. (2003). Board dynamics and the inûuence of professionalbackground: gender and ethnic diversity of directors. Corporate Governance: AnInternational Review, 11(3), 218–234
Van Geffen, M. (2012). The Financial performance and risk profile of sustainable firms.Copenhagen Business School.
Vithyea, Y. (n.d.). The linkage between bank net interest margin and noninterest income:The case of the Cambodian banking industry. Retrieved 29/09/2018 from http://ssrn.com/abstract=2542467
Vives, X. (2000). Corporate Governance: Does it Matter, in Xavier Vives (ed.) CorporateGovernance: Theoretical and Empirical Perspectives, Cambridge: CambridgeUniversity Press.
Wachudi, E. J. & Mboya, J. (2012) .Effect of board gender diversity on the performance ofcommercial banks in Kenya. European Scientific Journal April edition, 8(7), 128148.
Weber, O., & Oni, O. (2015). The impact of financial sector sustainability regulations onbanks. CIGI Papers No. 77. Waterloo, ON: CIGI. Retrieved 21/12/2017 www.cigionline.org/publications/impactoffinancialsectorsustainabilityregulationsbanks.
Wheeler, D. Colbert, B & Freeman R.E. (2003). Focusing on value: reconcilling corporatesocial responsibility. sustainability and a stakeholder approach in a network. WorldJournal of General Management, 28(1), 1–28.

118 Journal of Asian Economics, Accounting and Finance © 2020 ESI
Wigwe, H. (2016). Sustainability measures could be the key to success in the Sierra Leoneanbanking sector. World Finance. Retrieved 16/05/2018 from https://www.worldfinance.com/banking/sustainabilitymeasuresarethekeytotheSierraLeoneanbankingsectorssuccess.
Wolk, S. (2012). Wall street cares if companies are sustainable. Environmental Leader Sustainability Accounting Standards Board. Retrieved 21/12/2017 from: http://www.sasb.org/wpcontent/uploads/2012/09/EnviroLeaderWallStreetCaresIfCompaniesAreSustainable2.pdf
World Bank, (2008). Finance for all: policies and pitfalls in expanding access. Policy ResearchReport.
Yarnold, P. Mueser, K. & Lyons, J. (1988). Type A behavior, accountability and work rate insmall groups. Journal of Research in Personality, 22(4), 353360.
Yvanovich, R. (2012). Sustainability and shareholder value. Retrieved 16/05/2018 from http://trginternational.com/bid/122569/SustainabilityandShareholderValue
Zhang, L. (2017). The financial return of responsible investing. Retrieved 21/07/2018 fromwww.splitplatform.com
Zyadat, A. (2016). The impact of sustainability on the financial performance of JordanianIslamic banks. International Journal of Economics and Finance, 9(1), 5569.
To cite this article:
Alpha Bernard Bangura. Sustainability Practices and Performance of Sierra LeoneanDeposit Money Banks. Journal of Asian Economics, Accounting and Finance, Vol. 1,No. 1, 2020, pp. 61118