Embed Size (px)
Citation preview

This article was downloaded by: [64.131.66.214]On: 06 October 2014, At: 14:55Publisher: RoutledgeInforma Ltd Registered in England and Wales Registered Number: 1072954 Registeredoffice: Mortimer House, 37-41 Mortimer Street, London W1T 3JH, UK
Journal of Research on EducationalEffectivenessPublication details, including instructions for authors andsubscription information:http://www.tandfonline.com/loi/uree20
A Randomized Trial of an ElementarySchool Mathematics SoftwareIntervention: Spatial-Temporal MathTeomara Rutherforda, George Farkasa, Greg Duncana, MargaretBurchinalb, Melissa Kibricka, Jeneen Grahama, Lindsey Richlandc,Natalie Trand, Stephanie Schneidere, Lauren Durane & Michael E.Martineza
a University of California, Irvine, Irvine, California, USAb University of North Carolina at Chapel Hill, Chapel Hill, NorthCarolina, USAc University of Chicago, Chicago, Illinois, USAd California State University, Fullerton, Fullerton, California, USAe Orange County Department of Education, Costa Mesa, California,USAAccepted author version posted online: 10 Mar 2014.Publishedonline: 29 Sep 2014.
To cite this article: Teomara Rutherford, George Farkas, Greg Duncan, Margaret Burchinal, MelissaKibrick, Jeneen Graham, Lindsey Richland, Natalie Tran, Stephanie Schneider, Lauren Duran &Michael E. Martinez (2014) A Randomized Trial of an Elementary School Mathematics SoftwareIntervention: Spatial-Temporal Math, Journal of Research on Educational Effectiveness, 7:4, 358-383,DOI: 10.1080/19345747.2013.856978
To link to this article: http://dx.doi.org/10.1080/19345747.2013.856978
PLEASE SCROLL DOWN FOR ARTICLE
Taylor & Francis makes every effort to ensure the accuracy of all the information (the“Content”) contained in the publications on our platform. However, Taylor & Francis,our agents, and our licensors make no representations or warranties whatsoever as tothe accuracy, completeness, or suitability for any purpose of the Content. Any opinionsand views expressed in this publication are the opinions and views of the authors,and are not the views of or endorsed by Taylor & Francis. The accuracy of the Contentshould not be relied upon and should be independently verified with primary sourcesof information. Taylor and Francis shall not be liable for any losses, actions, claims,proceedings, demands, costs, expenses, damages, and other liabilities whatsoever or

howsoever caused arising directly or indirectly in connection with, in relation to or arisingout of the use of the Content.
This article may be used for research, teaching, and private study purposes. Anysubstantial or systematic reproduction, redistribution, reselling, loan, sub-licensing,systematic supply, or distribution in any form to anyone is expressly forbidden. Terms &Conditions of access and use can be found at http://www.tandfonline.com/page/terms-and-conditions
Dow
nloa
ded
by [6
4.13
1.66
.214
] at 1
4:55
06
Oct
ober
201
4

Journal of Research on Educational Effectiveness, 7: 358–383, 2014Copyright © Taylor & Francis Group, LLCISSN: 1934-5747 print / 1934-5739 onlineDOI: 10.1080/19345747.2013.856978
A Randomized Trial of an Elementary School MathematicsSoftware Intervention: Spatial-Temporal Math
Teomara Rutherford, George Farkas, and Greg DuncanUniversity of California, Irvine, Irvine, California, USA
Margaret BurchinalUniversity of North Carolina at Chapel Hill, Chapel Hill, North Carolina, USA
Melissa Kibrick and Jeneen GrahamUniversity of California, Irvine, Irvine, California, USA
Lindsey RichlandUniversity of Chicago, Chicago, Illinois, USA
Natalie TranCalifornia State University, Fullerton, Fullerton, California, USA
Stephanie Schneider and Lauren DuranOrange County Department of Education, Costa Mesa, California, USA
Michael E. MartinezUniversity of California, Irvine, Irvine, California, USA
Abstract: Fifty-two low performing schools were randomly assigned to receive Spatial-Temporal(ST) Math, a supplemental mathematics software and instructional program, in second/third orfourth/fifth grades or to a business-as-usual control. Analyses reveal a negligible effect of ST Math onmathematics scores, which did not differ significantly across subgroups defined by prior math profi-ciency and English Language Learner status. Two years of program treatment produced a nonsignif-icant effect. Publication of evaluation results from large-scale real-world supplemental mathematicsinstructional implementations such as this one can provide a realistic view of the possibilities, costs,and limitations of this and other computer aided instruction supplemental interventions.
Keywords: Elementary mathematics, experimental design, computer-assisted instruction
The existing literature comprises few rigorous evaluations of mathematics curricula orinstructional practices, especially those implemented on a large scale and with high quality.Thus, of the 77 reports examining interventions in elementary mathematics education withinthe Institute of Education Science’s What Works Clearinghouse (WWC), only five met thehighest WWC category of evidence, another five provided evidence meeting somewhatlower standards, and the remainder provided too little valid evidence to support claimsregarding effectiveness (U.S. Department of Education WWC, 2013a). To meet the need
Address correspondence to Teomara Rutherford, University of California, Irvine, 3200 Education,Irvine, CA 92697-5500, USA. E-mail: [email protected]
Dow
nloa
ded
by [6
4.13
1.66
.214
] at 1
4:55
06
Oct
ober
201
4

Evaluation of ST Math Intervention 359
for rigorous research on elementary mathematics interventions, the present study reports onan independent evaluation of one computer-based supplementary mathematics instructionalprogram, Spatial Temporal (ST) Math, based on a randomized control trial (RCT) conductedwith more than 13,000 students in 52 elementary schools in Southern California. Large-scaleimplementation, combined with random assignment to condition, allow us to potentiallydetect and quantify a causal relationship between student participation in the program andeducational outcomes (see Shadish, Cook, & Campbell, 2002).
PRIOR RESEARCH ON ELEMENTARY MATHEMATICS INTERVENTIONS
Of the 10 studies meeting WWC standards, only three have been designated as having “po-tentially positive effects,” with the bulk having “no discernible” or “mixed” effects (U.S. De-partment of Education WWC, 2013a). No computer-assisted intervention (CAI) for elemen-tary school mathematics has been listed within the WWC as showing positive or potentiallypositive effects although every year districts spend millions of dollars on these programs.
A meta-analysis conducted by Slavin and Lake in 2008 uncovered no studies providing“strong evidence” (a randomized study with at least 10 classes or schools or 250 studentsassigned to treatments, p. 476) of positive educational effectiveness among mathematicssoftware programs and found little or no significant differences between treatment andcontrol students among studies meeting their lower standard for “moderate evidence”(Slavin & Lake, 2008, p. 477). Since 2008, few published evaluations have met thesecriteria (for one exception see Roschelle et al., 2010). Cheung and Slavin (2013) usedrigorous inclusion criteria for their updated meta-analysis on K-12 educational technologyfor mathematics. They included only evaluation of programs lasting longer than 12 weeks,noting the bias toward stronger effects with programs of shorter durations. Cheung andSlavin found small positive effects (effect size of .18) for CAI, contrasting these smallereffects with older meta-analyses, which they viewed as overstating effect sizes by includinginappropriate studies. For studies evaluated with RCTs, the effects were even smaller, .08(Cheung & Slavin, 2013, p. 99).
While praising CAI, the National Mathematics Advisory Panel (NMAP) also called forfurther research, especially on the scale-up of Integrated Learning Systems, programs thatinclude both tutorial and drill and practice elements (NMAP, 2008a). Positive results fromsmall controlled studies have proven especially difficult to achieve at scale given issues ofcurricular integration and fidelity of implementation (NMAP, 2008a). Further work withreal-world implementations and rigorous evaluations of mathematics interventions wouldexplicate the potential of CAI, for whom it might be most effective and why. Our currentstudy presents a large-scale evaluation of ST Math to meet this need.
Evaluations of CAI programs such as ST Math may be particularly important, becausethese programs are being widely implemented under the belief that they provide a significanteducational benefit with relatively small investments of time and money by the schools (seeSlavin & Lake, 2008). Yet even optimistic projections do not claim that CAI programs area panacea for low performance—blanket application of CAI is unlikely to raise all studentsto proficiency in all subjects.
Moreover, it is not clear for whom and within what situations specific CAIs havethe greatest effect on student outcomes (NMAP, 2008b; e.g., Roschelle et al., 2010). Inthis study, we examine whether there are Student Characteristic ! ST Math interactioneffects on mathematics outcomes for students’ language status (English Language Learner[ELL] or not) and beginning of the study mathematics proficiency. Better understanding
Dow
nloa
ded
by [6
4.13
1.66
.214
] at 1
4:55
06
Oct
ober
201
4

360 T. Rutherford et al.
individual differences in response to interventions provides important information regardingthe effectiveness and replicability of an intervention for different population subgroups (seeNMAP, 2008b; U.S. Department of Education WWC, 2013b).
THE ST MATH INTERVENTION
Description and Use of ST Math Software
Created by the nonprofit MIND Research Institute (MIND), ST Math is designed to teachmathematical reasoning through spatial temporal representations in which key concepts areillustrated with dynamic imagery that minimizes, at least initially, mathematical symbolsand technical terminology. ST Math is delivered via computer and uses an interactive inter-face to present individualized instruction according to the student’s pace of learning. Thegamelike exercises are formulated to engage and motivate students to solve mathematicsproblems and to advance steadily through the curriculum. Successive games present prob-lems of increasing difficulty, eventually leading to quite challenging, multistep problemsolving. Program developers report that ST Math is currently used by about 473,000 K-8students across 1,355 schools in 24 states, with the largest concentration of schools in Cali-fornia, Texas, Florida, and Illinois. Eighty-three percent of the student users are eligible forfree or reduced lunch. The initial student licensing fee is a maximum of $50 per student,which is, for reference, comparable to the cost of a textbook (see California Departmentof Education IMPL, 2013, where approved textbooks are listed for approximately $80/stu-dent), keeping in mind that ST Math is a supplement to the expense of the textbook. Forsubsequent years, schools pay a $35 per student renewal fee. Larger schools may choose topurchase a site license instead, saving over the individual student licensing fee by paying$49,000 for the first year and $3,750 each year thereafter.
As noted, ST Math is a supplemental program to the school’s mathematics curriculum.According to the developers, full implementation requires two 45-min sessions per weekin the computer lab. The program is divided into grade-level lessons designed to parallelmathematics standards for K-5 students. Linear game-play allows students to move to ahigher level only after they have mastered the current level. Students have two “lives”in each level, which means they must finish the level before making two mistakes (80%mastery) or they must repeat the level. This self-paced structure ensures that the materialis appropriate for the student’s current abilities. The visible goal of the games is to helpJiji, an animated penguin, move from the left to the right side of the screen. Within levels,students build bridges and remove obstacles in Jiji’s path by solving increasingly moreadvanced mathematical puzzles. These bridges and obstacles blend into the mathematicalpuzzles such that there is often little distinction between the game and the mathematics—inother words, the game elements are mathematics.
The content for each grade, K-5, contains several modules that match curricular unitsfound in more traditional classroom instruction with focus on a mathematical concept suchas Addition and Subtraction Situations. Each module contains several games (see Figure1a), and within each game, there are between one and 10 levels of increasing mathematicaldifficulty. Each game has its own consistent scenario and rules. Figure 1b to 1d displayslevel one of the game “Push Box.” In Push Box, students see a ramp on top of a box (thenumber of boxes varies with levels), and they see a bulldozer poised to push a collectionof boxes on top of the ramp. Students must choose the correct sum from the boxes on theright. This sum represents where they will place a bridge to allow Jiji, waiting to ride the
Dow
nloa
ded
by [6
4.13
1.66
.214
] at 1
4:55
06
Oct
ober
201
4
Evaluation of ST Math Intervention 361
Figure 1. The first game in the second-grade curriculum, Push Box. Note. Students must add thebox on the floor with those on the bulldozer and place the bridge on the appropriate square to allowJiji to cross.
bulldozer on top of the boxes on the left, to cross the screen. Figure 1b illustrates the correctplacement of the bridge, at four blocks, and Figure 1c illustrates an error, placing the bridgeat three blocks. Once students choose a placement, the result of their choice is animated.In the case of Figure 1d, the bridge is placed below the spot needed for Jiji to walk acrossand the student will see that Jiji is stuck on the screen. In response to this incorrect answer,Jiji will give a puzzled look to the student, and either a new problem will start (if the childhas not missed any within the current level to this point) or the child will fail the level andwill be directed back to a screen to restart the level.
Push Box is the first game in the second-grade curriculum. Once students completethis game, they move on to the rest of the games in the Addition and Subtraction moduleand then on to the next modules, which for second grade are (in order) Place Value up to1,000; Money; Time and Elapsed Time; Addition and Subtraction, two digits; Geometryand Measurement; Fractions; Intro to Multiplication; Intro to Division; and Addition andSubtraction, three digits. There are 10 second-grade modules, 13 third-grade modules, 12fourth-grade modules, and 13 fifth-grade modules. Each game (within the modules) coverscertain California State Standards for mathematics for the grade covered. For example,program developers relate Push Box to the Algebra and Functions standard 1.2, “Relateproblem situations to . . . addition and subtraction,” and note it as tangentially related toNumber Sense standard 2.2., “Find the sum or difference of two whole numbers up tothree digits long” (MIND Research Institute, 2007). Each game in each grade level is
Dow
nloa
ded
by [6
4.13
1.66
.214
] at 1
4:55
06
Oct
ober
201
4

362 T. Rutherford et al.
similarly linked with a grade-appropriate California standard (see California State Boardof Education, 2010a). The content and progression of ST Math was originally designedfor California standards but has been modified somewhat for administration in states withdifferent mathematics standards.
For the version of ST Math evaluated in this article, Generation 3, students within thesame grade all began the year on the same game within the software and proceeded throughthe games as they solved them. Although students may have begun at the same place,variation in individual rates of progress means that, over time, students mastered differentlessons within the software: different levels, different games, and even different modules.Although MIND occasionally allows for placement below grade level for special educationstudents, non–special education students in the current study all received the software fortheir grade level.
MIND’s Theory of Change and Benefit to Certain Student Populations
The MIND theory of change for ST Math involves coordination between teachers and soft-ware to first help students develop the ability to visualize underlying mathematics concepts,and then create links between these concepts and the types of problems students encounterin their math classroom or on a standardized test. The developers hypothesize that bylearning the meaning behind algorithmic procedures through intuitive spatial relationships,students gain conceptual understanding along with procedural and computational skills—alearning process that may ultimately lead to increased mathematics competency and reten-tion (National Research Council [NRC], 2005; Shaw & Peterson, 2000). These ideas findsome support in research by educators and cognitive scientists. Geary (1995) described abiologically primary system of mathematical understanding upon which humans and otheranimals relied. Opfer and Siegler (2012) similarly described an implicit ability to processnonsymbolic representations of quantity. This implicit ability is related to later mathematicsperformance (e.g., Booth & Siegler, 2008; Opfer & Siegler, 2012) and can be improvedthrough training, such as with number lines (e.g., Ramani & Siegler, 2008). Drawing on therelation between spatial representations and this implicit system (see Geary, 1995; see alsoGeary, 2011, noting the unique relationship between spatial skills and mathematics) may bean especially promising way to enhance students’ sense for numerical magnitudes and aidin creating links between symbolic and nonsymbolic representations. Research exploringhow students learn the mathematics of fractions has shown that visual representations canimprove conceptual understanding of both the magnitude and manipulation of fractions(see Siegler et al., 2010; Siegler, Thompson, & Schneider, 2011). MIND has designedthe system of visual representations within ST Math to support understanding of numbermagnitude and relations across the spectrum of numbers and as they increase in difficulty.Repetition across grade levels of certain spatial representations, such as the number line,may support students’ analogous transitions to more complex mathematics, like problemsinvolving fractions (see Siegler et al., 2011; Wu, 2005).
Mathematics educators have also noted that exposure to, and manipulation of, multiplerepresentations of mathematics problems may enhance conceptual understanding (see NRC,2001). Although the push for instruction that fosters greater conceptual understanding ofmathematics is not new, instructional practices in the United States are still largely focusedon learning procedures (NRC, 2005).1 Students who are not taught the concepts behind the
1This may be changing with adoption and implementation of the Common Core Standards, whichstress conceptual as well as procedural learning.
Dow
nloa
ded
by [6
4.13
1.66
.214
] at 1
4:55
06
Oct
ober
201
4

Evaluation of ST Math Intervention 363
procedures generally have difficulty transferring procedures appropriately to new problemsor identifying their errors (see NRC, 2001, 2005). Inclusive in this notion is the idea thatunderstanding why an answer is wrong can help foster conceptual understanding (NRC,2005). In line with these findings, ST Math is designed to provide animated representationsof students’ incorrect solutions. However, all students who chose the same answer withinthe games are shown the same animated representation of the result of this choice—this maywork for some students but not for all. Hence knowledgeable teachers, actively monitoringstudent progress are considered an integral part and potential weakness of the CAI. Teachersmust identify those students who are “stuck” and provide assistance and instruction so thatthey can both progress in the game and understand the concept at issue (Peterson & Patera,2006).
English Language Learners. By drawing on innate spatial-temporal ability (Shaw & Peter-son, 2000), ST Math is designed to provide access to the ST Math lessons for those studentswho struggle in traditional language-heavy learning environments. ELLs consistently per-form below fluent English speakers in standardized tests of mathematics, and although thisgap between ELLs and non-ELLs may be slowly closing, differences remain (Hemphill& Vanneman, 2011). The prospect of closing these achievement gaps may depend on theidentification of curricula and instructional practices that particularly meet the needs ofELL students. Access to standard mathematics curricula requires considerable amounts ofverbal or written communication—ELL students may not have the academic vocabularynecessary to make sense of traditional math lessons (Hoffert, 2009). In addition, because ofthe slow rate of instruction or dedication of class time to language learning, ELLs often donot have the opportunity to learn a full year’s complement of math material during a regularacademic year (Abedi & Herman, 2010). For these students, ST Math may meet the needsof both access and breadth of material: Language-minimal concept instruction is designedto provide access to the curriculum, and self-pacing allows students to progress individuallythrough a year’s material. Although ST Math is designed so that ELLs may master math-ematical concepts without simultaneously having to master English-related peculiaritiesof mathematics learning, it does not teach math by excluding all language—students aregradually introduced to mathematical symbols and language after the initial language-freeintroduction to concepts. The designers hypothesize that this allows for the integration oflanguage and content that Harper and de Jong (2004) claimed is necessary for ELL studentsuccess. By providing dynamic representations accompanied by visual and image-basedinstruction in their use, ST Math was hypothesized to support stronger math outcomes forELL students compared to students who are proficient in English.
Student Initial Mathematics Proficiency. The hierarchical nature of mathematics impliesthat an understanding of foundational mathematical concepts may become critical as stu-dents advance toward higher mathematics, a proposition supported by the strong relationbetween early mathematics skills and later achievement (e.g., Duncan et al., 2007; Ramani& Siegler, 2011). The concept of developmental progression, as defined in mathematicslearning, lends further support—developmental progression “describes a typical path chil-dren follow in developing understanding and skill about [a] mathematical topic” (Clements& Sarama, 2009, p. 3). Within this progression, new mathematics skills are built on pre-viously mastered skills to form a trajectory of increasingly sophisticated thinking. Themost effective instruction occurs when instructional tasks are matched to the student’sskill level (Clements & Sarama, 2009). Such a system optimizes the learner’s readiness,but without it, gaps may appear in student knowledge and lead to an unstable foundation
Dow
nloa
ded
by [6
4.13
1.66
.214
] at 1
4:55
06
Oct
ober
201
4

364 T. Rutherford et al.
for future mathematics endeavors (NRC, 2009; Thurston, 1990). ST Math’s individualizedcurriculum is designed to allow students to progress to new concepts only once they havemastered the foundational materials. The designers hypothesize that students who strugglewith mathematics may make greater gains in mathematics outcomes than those in moretypical classrooms because they can take time to review basic concepts at their own pace.
The idea that CAI may be effective in improving mathematics outcomes for low-performing students has been present in the literature since the initial uses of the medium(e.g., Edwards, Norton, Taylor, Weiss, & Dusseldorp, 1975). This idea persists, particularlyin special education research (e.g., Li & Edmonds, 2005; Traynor, 2003), although, as notedpreviously, large-scale random assignment studies of ability-differential program effects arerare. We explore these ideas by investigating whether the effect of ST Math differs betweenstudents who begin the study at five different math proficiency levels defined by cut-pointsset by the state. It was our hypothesis that students in the three categories below the“proficient” cut-point would make greater gains in mathematics achievement than wouldtheir peers in the control classrooms and that the overall effect sizes would be larger thanthose of their peers in the top two proficient categories of the ST Math condition.
Effect of More Than 1 Year. New instructional technology, like ST Math, may initiallyboost student achievement due to engagement and motivational benefits from the noveltyof the intervention (e.g., Song & Keller, 2001; Tung & Deng, 2006). Should this be thecase, we might expect the effect of ST Math to level off or fade away after the 1st year ofimplementation. On the other hand, because implementation of ST Math requires specificteacher actions, including progress monitoring, intervention, and integration, 2nd-yearprogram effects may be larger than those from the 1st year of implementation. Similarly,students who have experience with ST Math for more than 1 year may themselves becomemore adept at learning from this medium and translating what they learn to assessmentsoutside of the software.
Alignment With Outcome Measures
ST Math was designed to align with California State Standards; therefore, in this analysis theimpact of ST Math is assessed with the California Standards Tests (CSTs), a standardizedtest series developed to evaluate the competency of California’s students with respect tothese same standards. In addition to serving as a measure of ST Math’s effect on studentmath performance, the CSTs have important policy implications for students and schoolsalike. For students, the mathematics CSTs measure a number of skills deemed criticalfor success in a complex, technical society—these skills are highlighted by Californiapolicymakers and the National Research Council (California State Board of Education,2010a; NRC, 2001). For schools, the CSTs provide markers of students’ progress and carryconsequences for the schools themselves. Schools whose students perform poorly on theCSTs face the possibility of corrective action, restructuring, public scrutiny, and the loss ofstudents through school choice (No Child Left Behind §1111, 2001).2
Previous research has shown correlational associations between ST Math and studentachievement (Graziano, Peterson, & Shaw, 1998; Peterson et al., 2004; Martinez et al.,2008). This article extends the evaluation of ST Math to make causal inferences regarding
2Recent developments have seen relief from these sanctions for failing districts through waiversissued by the U.S. Secretary of Education (U.S. Department of Education, 2013).
Dow
nloa
ded
by [6
4.13
1.66
.214
] at 1
4:55
06
Oct
ober
201
4

Evaluation of ST Math Intervention 365
the 1- and 2-year effects of ST Math on student achievement as measured by the CaliforniaStandards Test. In addition, this article examines whether ST Math is associated with greaterimprovement in test scores among ELLs and students with weaker incoming mathematicsskills—two groups of students in need of an intervention to increase their trajectory—bothto improve their mathematics skills and to assist their schools in reaching policy-relevantproficiency benchmarks.
To summarize, this article addresses the following four research questions: (a) Does STMath produce gains in CST scores on average for all students? (b) Does ST Math producedifferential gains for students who enter the study at different proficiency levels? (c) DoesST Math produce greater gains for ELLs? (d) Does ST Math produce stronger effects forstudents after they have participated in the program for 1 year?
METHOD
Design and Procedure
The current RCT study used random assignment at the school level. The 52 elementaryschools in the study included two cohorts with a staggered implementation design. Thefirst cohort of study schools was drawn from schools selected to participate in MIND’sOrange County Math Initiative. This countywide initiative, supported by local businesspartners and the Orange County Department of Education, provided ST Math without costto low-performing schools. To determine eligibility, every school in Orange County wasranked by its Academic Performance Index, which is a weighted composite of studentscores on state-mandated standardized tests. Schools that fell into the lowest three deciles(155 elementary schools) were invited to participate in the Orange County Math Initiative.After attending an informational session, 73 of the qualifying schools applied to participate,and following a site and eligibility audit, 71 schools were accepted into the Initiative. Asubset of 41 schools was eligible to participate in the current study because they were notalready users of ST Math. Of these 41 schools, 34 agreed to participate in the RCT.
After the recruitment of the Cohort 1 schools, a partnership involving MIND, theOrange County Department of Education, and researchers from the University of California,Irvine, obtained an Institute of Education Sciences grant to support the implementation andevaluation of ST Math within this sample. This article is a product of the evaluationconducted by the latter two, without oversight from MIND. After receipt of the grant, asecond informational session was held for recruitment of an additional cohort of students.Using the same eligibility criteria as for the original sample, eighteen schools were eligibleto be part of this new study cohort—all 18 agreed to participate in the RCT.
Randomization. Prior to the fall of 2008, the original 41 schools in Cohort 1 were randomlyassigned to one of two conditions: 21 schools were assigned to implement ST Math at Grades2 and 3 and not in Grades 4 and 5 (Group A), and 20 schools were assigned to implement STMath at Grades 4 and 5 and not in Grades 2 and 3 (Group B). Although within schools thegrades were split between treatment and control, the randomization occurred at the schoollevel to either a second/third-grade implementation or a fourth/fifth-grade implementation.Thus, Grades 2 and 3 of Group B served as controls for the treated Grades 2 and 3 of GroupA in the treatment year, and Grades 4 and 5 of Group A served as controls for the treatedGrades 4 and 5 of Group B in the treatment year. The decision was made to assign all of aschool’s classrooms in a given grade as a group to either treatment or control to encourage
Dow
nloa
ded
by [6
4.13
1.66
.214
] at 1
4:55
06
Oct
ober
201
4

366 T. Rutherford et al.
Table 1. Comparison of sample descriptives to county and state
AnalysisSample Total Sample County CaliforniaM / % M / % M / % M / %
Math CST 351.86 351.56a 385.59 372.48ELA CST 329.47 329.08a 356.23 346.48Male 51% 51% 50% 49%Free/Reduced lunch 90% 88% 46% 57%Black 2% 2% 2% 8%Hispanic 85% 84% 47% 50%White 5% 6% 31% 26%Vietnamese 4% 4% 6% 1%Other race 4% 5% 31% 15%English Language Learner 63% 63% 39% 32%N 13,803 16,315 110,402 1,401,811
Note. County and California data aggregated for Grades 2 through 4 in 2007–2008 from the Cali-fornia STAR reporting website: http://star.cde.ca.gov/star2008 (California Department of Education,2011b). Means and percentages from the study sample reflect data at baseline, which is 2007–2008for Cohort 1 and 2008–2009 for Cohort 2. Demographics of all students in Grades 2 through 4 in thestudy schools from 2007–2008 to 2008–2009 are relatively stable. If all students were measured in2007–2008, mean Math and ELA scores would each be 2 points lower due to statewide trends.aTest scores provided for the total sample are limited to those students who had valid CaliforniaStandards Tests (CST) data: math (N = 13,905) and English/Language Arts (ELA; N = 13,963).
fidelity to condition. Before receiving their assignment, seven schools excluded themselvesfrom the study and did not sign the randomization agreement. The resulting Cohort 1 whoimplemented ST Math beginning with the fall of 2008 consisted of 18 Group A (Grades2/3) and 16 Group B (Grades 4/5) schools. Cohort 2 schools were randomly assigned to acondition and began ST Math implementation at Grades 2 and 3 or Grades 4 and 5 (nineschools in each condition) at the start of the 2009–2010 school year. No schools in Cohort2 withdrew from the study.
Sample and Participants
The study sample consisted of all second- through fifth-grade students in 52 low-performingschools within 10 districts in Southern California. Schools ranged in size and enrolledbetween 200 and 800 students in the study grades during a given year throughout the3 years included in this analysis. Analyses in this article employ data from the 13,803students who took the mathematics and English/Language Arts CSTs for their school’sfirst study year and who had pretest data available for the immediately prior year. Thisrepresents 84% of the participating students. Descriptive statistics for the study sample areprovided in Table 1 and show that the study sample is generally very similar to the totalsample. There were no significant differences in the cohorts with regard to school size orinitial CST scores.
Because our analysis required a pretest score, and CSTs are only offered to studentsbeginning in second grade, the analysis sample was limited to those students who were insecond through fourth grades during their pretest year. This excluded Cohort 1 students who
Dow
nloa
ded
by [6
4.13
1.66
.214
] at 1
4:55
06
Oct
ober
201
4
Evaluation of ST Math Intervention 367
began second grade in 2008–2009 and students from either cohort who began second gradein 2009–2010. As measured during the first study year, 16,315 students were in the gradestargeted for analysis. However, 2,091 were new to the districts for their school’s 1st yearof implementation, so did not have pretest information. These students were distributedevenly between treatment and control. However, students who moved were more likely tohave a posttest below the proficiency cut-point: 13.63% of those below the proficiency cut-point moved into the study districts as compared with 11.89% of those above proficiency,!2(1, N = 16,221) = 11.01, p = .001. An additional 331 students were missing data orhad scores out of range for 1 or both years—these students may have taken an assessmentother than the CSTs due to disability or language status. Of the 331 with out of range ormissing scores, 256 had a reported diagnosed disability for at least 1 year during the study.An additional 90 students switched between the study cohorts, making their results difficultto interpret; they were excluded.
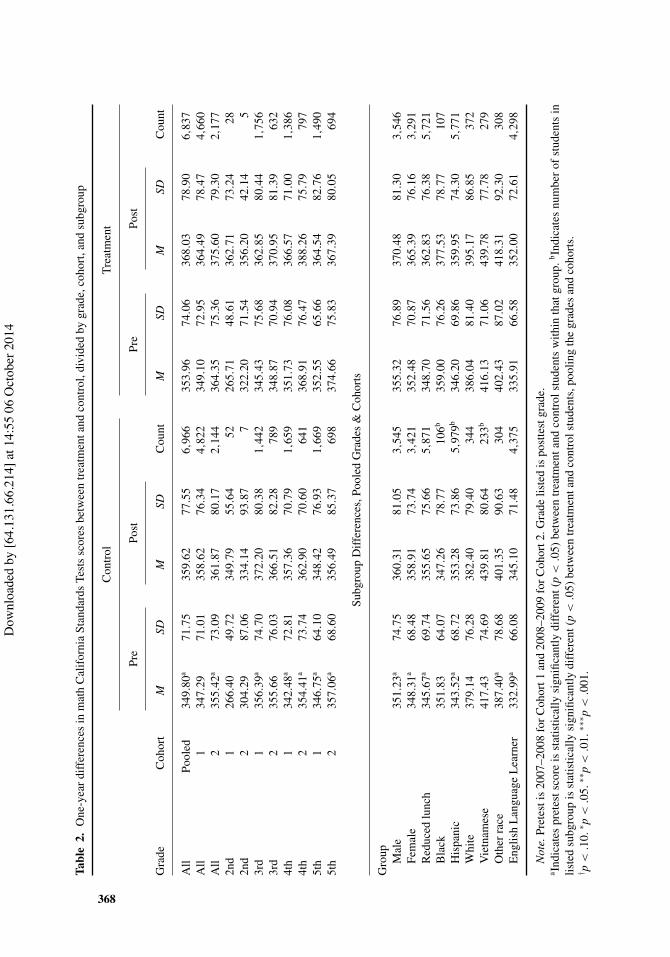
Table 2 shows descriptive statistics by treatment status for students in the study schoolsduring the first implementation year at their school. Aggregated, the mean score of thesestudents was 351.56, a little more than 1 point above the proficiency benchmark set by thestate of California (California State Board of Education, 2010b); individual schools hadbetween 27% and 76% of students who had not met proficiency by this point. Among ELLsin this sample, the mean mathematics CST score, averaged between treatment and control,was 334.17, a significant difference from the mean score of non-ELL, 381.09, t(13801) =38.38, p < .001. This translated to a significantly larger number of ELL students amongthose who were not proficient before the start of the study !2(1, N = 13,904) = 950.43,p < .001. Details about the CSTs and proficiency benchmarks are provided in the upcomingVariables section.
As seen in Table 2, gender, ethnicity, language status, and eligibility for free/reducedlunch did not significantly differ between treatment and control students. Starting mathe-matics CST scores differed slightly between treatment and control groups, t(13801) = 3.35,p = .001, with treatment students scoring, on average, 4 points higher than control students.Pretest scores for treatment and control were roughly normally distributed: skewness forboth groups was similar and below .50; kurtosis was within .30 of three.
The 2-year gains for treatment and control students were investigated using the onlyrandomly assigned students with 2 years of data: Cohort 1 students who began the studyin third grade during the 2007–2008 school year. Within this subsample, there were somestatistically significant differences in demographics and baseline CST scores. The treat-ment students included more Vietnamese students (7% as compared to 3%), !2(1, N =2,676) = 23.13, p < .001; fewer Hispanic students (81% as compared to 85%), !2(1,N = 2,676) = 8.59, p = .003; and more male students (52% as compared to 48%), !2(1,N = 2,676) = 5.67, p = .02. Treatment students in this subsample start with mathemat-ics CST scores 12.36 points higher than control students, t(2675) = 4.13, p < .001, andEnglish/Language Arts (ELA) CST scores 4.45 points higher, t(2675) = 2.11, p = .04.
Implementation. MIND liaisons worked with school and district administrators to set upST Math for each school within currently existing computer labs. Students began attendingST Math lab sessions twice a week for 45 min each session at the beginning of the schoolyear. Based on previous trials of the software, MIND determined that this was the frequencyand duration that was both practical for schools and would allow students to complete themajority of the program by the end of the school year. A 4- to 5-hr professional developmenttraining session on how to use the software was provided to all study teachers. Study schoolswere also given technical support for the 1st year of implementation and for additional years
Dow
nloa
ded
by [6
4.13
1.66
.214
] at 1
4:55
06
Oct
ober
201
4
Tabl
e2.
One
-yea
rdiff
eren
ces
inm
ath
Cal
ifor
nia
Stan
dard
sTe
sts
scor
esbe
twee
ntr
eatm
enta
ndco
ntro
l,di
vide
dby
grad
e,co
hort
,and
subg
roup
Con
trol
Trea
tmen
t
Pre
Post
Pre
Post
Gra
deC
ohor
tM
SDM
SDC
ount
MSD
MSD
Cou
nt
All
Pool
ed34
9.80
a71
.75
359.
6277
.55
6,96
635
3.96
74.0
636
8.03
78.9
06,
837
All
134
7.29
71.0
135
8.62
76.3
44,
822
349.
1072
.95
364.
4978
.47
4,66
0A
ll2
355.
42a
73.0
936
1.87
80.1
72,
144
364.
3575
.36
375.
6079
.30
2,17
72n
d1
266.
4049
.72
349.
7955
.64
5226
5.71
48.6
136
2.71
73.2
428
2nd
230
4.29
87.0
633
4.14
93.8
77
322.
2071
.54
356.
2042
.14
53r
d1
356.
39a
74.7
037
2.20
80.3
81,
442
345.
4375
.68
362.
8580
.44
1,75
63r
d2
355.
6676
.03
366.
5182
.28
789
348.
8770
.94
370.
9581
.39
632
4th
134
2.48
a72
.81
357.
3670
.79
1,65
935
1.73
76.0
836
6.57
71.0
01,
386
4th
235
4.41
a73
.74
362.
9070
.60
641
368.
9176
.47
388.
2675
.79
797
5th
134
6.75
a64
.10
348.
4276
.93
1,66
935
2.55
65.6
636
4.54
82.7
61,
490
5th
235
7.06
a68
.60
356.
4985
.37
698
374.
6675
.83
367.
3980
.05
694
Subg
roup
Diff
eren
ces,
Pool
edG
rade
s&
Coh
orts
Gro
up Mal
e35
1.23
a74
.75
360.
3181
.05
3,54
535
5.32
76.8
937
0.48
81.3
03,
546
Fem
ale
348.
31a
68.4
835
8.91
73.7
43,
421
352.
4870
.87
365.
3976
.16
3,29
1R
educ
edlu
nch
345.
67a
69.7
435
5.65
75.6
65,
871
348.
7071
.56
362.
8376
.38
5,72
1B
lack
351.
8364
.07
347.
2678
.77
106b
359.
0076
.26
377.
5378
.77
107
His
pani
c34
3.52
a68
.72
353.
2873
.86
5,97
9b34
6.20
69.8
635
9.95
74.3
05,
771
Whi
te37
9.14
76.2
838
2.40
79.4
034
438
6.04
81.4
039
5.17
86.8
537
2V
ietn
ames
e41
7.43
74.6
943
9.81
80.6
423
3b41
6.13
71.0
643
9.78
77.7
827
9O
ther
race
387.
40a
78.6
840
1.35
90.6
330
440
2.43
87.0
241
8.31
92.3
030
8E
nglis
hL
angu
age
Lea
rner
332.
99a
66.0
834
5.10
71.4
84,
375
335.
9166
.58
352.
0072
.61
4,29
8
Not
e.Pr
etes
tis
2007
–200
8fo
rCoh
ort1
and
2008
–200
9fo
rCoh
ort2
.Gra
delis
ted
ispo
stte
stgr
ade.
a Indi
cate
spr
etes
tsco
reis
stat
istic
ally
sign
ifica
ntly
diff
eren
t(p
<.0
5)be
twee
ntr
eatm
enta
ndco
ntro
lstu
dent
sw
ithin
that
grou
p.b In
dica
tes
num
ber
ofst
uden
tsin
liste
dsu
bgro
upis
stat
istic
ally
sign
ifica
ntly
diff
eren
t(p
<.0
5)be
twee
ntr
eatm
enta
ndco
ntro
lstu
dent
s,po
olin
gth
egr
ades
and
coho
rts.
† p<
.10.
" p<
.05.
""p
<.0
1.""
" p<
.001
.
368
Dow
nloa
ded
by [6
4.13
1.66
.214
] at 1
4:55
06
Oct
ober
201
4

Evaluation of ST Math Intervention 369
by paying the lesser of a $3,500 or $35 per student renewal fee to MIND. All study schoolscontinued to pay this fee and receive support for the duration of the study.
Each year in the study, schools had the option to add two treatment grades to providemultiple years of treatment to students as they progressed through the elementary grades.As a consequence, a third-grade student who was assigned to a Group A (Grades 2/3)school did not stop receiving ST Math in fourth grade so long as their school exercised theoption to add additional grade levels. To date, only one school has elected to not add gradesduring their subsequent years in the study. The delayed treatment design utilized withinthis study permitted variation in the number of years and grade levels of those assigned totreatment, and supported equal engagement in the study by treatment and control teachers(e.g., Roschelle et al., 2010)—initial control teachers knew that their grade would receivethe intervention within 2 years.
Because ST Math is a supplemental program, treatment students may have receivedan additional 90 min a week of mathematics instruction compared to control students. Asurvey of treatment teachers within the study schools (2011–2012) indicated the teachersused time from a variety of subjects in order to implement ST Math. When asked where theinstructional time for ST Math came from, 34% of teachers reported math, 17% reportedEnglish/Language Arts, 36% reported Social Studies/Science, 9% reported Art/Music/PE,and 4% reported other computer lab time. Thus, treated students received approximately90 additional min per week of (ST) mathematics instruction, minus the time taken fromclassroom mathematics instruction to attend the ST Math computer lab. It is not known howmuch time control group students spent in mathematics instruction compared to treatmentstudents, but it is assumed that they spent less time in mathematics instruction.
Fidelity of Implementation. A key condition for a successful RCT is that the interventionis implemented as intended with reasonable fidelity. Otherwise, it is not clear what is beingtested (see WWC guidelines). For full implementation, ST Math requires that studentscomplete all of the software modules for their grade and that their teachers refer to anddraw on student experiences with the software during classroom mathematics instruction(see Peterson & Patera, 2006). ST Math students within the current study were expectedto spend two 45-min sessions each week in the computer lab for an average total of 68sessions per year. Teachers appeared to take their classrooms to the lab as scheduled: Onaverage, students utilized the ST Math software for 68 days during the 1st year of the studyimplementation and 66 days during the 2nd year as indicated by game-play data. Due to theself-paced nature of the program, utilizing ST Math the maximum number of days withina year did not necessarily mean the student completed all of the grade lessons. On average,students completed 80.97% of their grade’s lessons by the end of the school year and72.77% of the lessons by April, when the CSTs were administered. Percentage of programcompletion by end of year varied as a function of student initial proficiency level. Thelowest performers at pretest, those who were “far below basic,” on average completed only47.82% of the program. The highest performers, those who were “advanced,” averaged acompletion rate of 90.36%. Those in the middle three proficiency categories, “below basic,”“basic,” and “proficient,” averaged completion rates of 58.64%, 69.21%, and 80.54% of theprogram, respectively.
Observations of teacher fidelity were conducted during the 2009–10 school year. Eightobservers (retired teachers or school administrators) were trained by MIND staff on aprotocol developed by the Center for Elementary Mathematics and Science Education atthe University of Chicago and employed this protocol to observe 102 treatment and 90control mathematics classrooms once during class time and once during lab time (for the
Dow
nloa
ded
by [6
4.13
1.66
.214
] at 1
4:55
06
Oct
ober
201
4

370 T. Rutherford et al.
treatment classes). This represents 25% of the 806 teachers in our study grades and schoolsin the 2009–10 school year; one teacher was randomly selected from each grade in eachschool for a total of 208 teachers. Six teachers opted out of the observation. The protocolaimed to capture teacher fidelity to MIND’s view of what the core elements of the programwere, including the use of visualizations, specific teacher questioning practices, and thedrawing of connections between classroom and in-game experiences. Initial results suggestlimited teacher fidelity; of the observed classrooms, only 38% of treatment teachers werementioned the software or Jiji at all during nonlab mathematics time. Only 21% of teacherswere observed to draw connections between the games and what the class was learning.Interpretation of the results should keep in mind the relatively high student attendancerate in ST Math labs and the low teacher compliance with the need to integrate classroominstruction with what is learned in the lab. It is likely that teachers implemented theclassroom aspects of the intervention that would be typical in most districts.
Variables
Standardized Test Scores. Scores from the CST, administered to all California students inGrades 2 to 11 in the spring of each year. Scores were used to assess mastery of grade-levelmathematics content standards. CSTs are criterion-referenced, standards-based assessmentsdeveloped in alignment with the California Content Standards (California Department ofEducation, 2010a). For the 2007–2008 test administration, the latest year for which thisinformation is available, Cronbach’s alphas in Grade 2 and 3 CST mathematics were 0.93and 0.94, respectively (Educational Testing Service, 2008). Scale scores ranging from 150to 600 were calculated by the state to allow for comparison between grade levels and wereprovided to the researchers by the participating school districts. These scale scores arenecessary because tests are designed to assess each grade’s standards and therefore differbetween grades; within grades, each year’s test is based on the same core of standards butcontains different questions. Each student in the current study had data on 1 to 3 yearsof CST scores (2008, 2009, 2010), depending on the grade level of the student. Acrossmathematics and English in all elementary grades, a scale score of 350 points indicates astudent is considered by the state to be proficient in that subject’s content-matter for thatgrade. In addition to specifying the 350-point proficiency cutoff, the state of Californiahas designated math cutoff points for far below basic (scores less than approximately 240,depending on grade level), below basic (below 300), basic (300–350), and advanced (above400, with the exact value depending on grade level; California Department of Education,2010b).
School Math Curriculum. There is no specific mathematics curriculum that MIND recom-mends as optimal for ST Math administration. In 40 of the 52 study schools, the concurrentcurriculum was Houghton Mifflin CA Math. Within a school, the same curricular providerwas used across all study grades. No curriculum was disproportionately represented withina grade and treatment condition. For the current analysis, ST Math was evaluated after 1year of program use, comparing students with 1 year versus no years, and after 2 years ofprogram use, comparing students with 2 years versus no years.
The current study investigated the effect of ST Math with an intent to treat analysisin order to make a policy-relevant conclusion and preserve the integrity of the randomassignment design (Shadish & Cook, 2009). Students and teachers in the study, as in thereal world, cannot be forced to participate fully in the ST Math program. Thus, intent to
Dow
nloa
ded
by [6
4.13
1.66
.214
] at 1
4:55
06
Oct
ober
201
4

Evaluation of ST Math Intervention 371
treat effect estimates more realistically capture the average program effect on the full setof students who were offered the treatment, regardless of their actual level of ST Mathinvolvement.
Demographics. Gender, ethnicity, free/reduced lunch, and ELL status were reported bythe school districts along with the CST data. Ethnicity was represented in the analysisby five groups: Hispanic, Vietnamese, Black, White, and Other, to represent the largestethnic groups within the sample. ELL status was determined by schools as measured bythe California English Language Development Test (California Department of Education,2011a). For purposes of analysis, students were classified as ELL students if they werelisted as English Language Learners in 2008–2009; those students who were RedesignatedFluent English Proficient were not labeled as ELL.
ANALYSIS
To answer the first research question (estimating the average main effect of the ST Mathtreatment), 1st-year posttest results were regressed on treatment, pretest scores (both math-ematics and English/Language Arts), student grade, year, and demographic controls. Toanswer the second and third research questions (differential effects for population sub-groups), this analysis was then performed separately for each proficiency level and for ELLversus non-ELL students. Coefficient differences between the groups were tested for sig-nificance. To examine the fourth question—the effect of 2 versus 1 year of ST Math—thesample was limited to those students who were in third grade in Cohort 1 during the2007–2008 school year. For these analyses, each student contributed 2 years of outcomedata (fourth and fifth grade). Students who received treatment for 2 years were comparedto their same-grade and cohort 2-year-control counterparts. Effects were estimated for boththe 1st and 2nd year by including a treatment by 2nd-year interaction within the equation.Although it was hypothesized that the effect of 2 years of ST Math may be stronger than 1year alone due to teacher practices, we were unable to isolate teacher experience with STMath. The 2nd year of ST Math for the students in our analysis was also the 2nd year ofST Math implementation within their schools. However, we were not able to eliminate thepossibility that the students were taught by a teacher new to ST Math.
In evaluating education interventions, researchers must be concerned that character-istics propelling adoption of interventions are correlated with other determinants of theoutcomes, leading to bias in the estimate of the intervention’s effect. Given a sufficientlylarge sample, random assignment generally allows us to assume that student characteristicsare evenly distributed between treatment and control groups, so that unbiased treatmenteffects can be estimated (Shadish et al., 2002). However, two issues within the current studypotentially interfere with this assumption.
As noted earlier, pretest scores were not completely balanced between treatment andcontrol group students. To control for this, mathematics and ELA pretest covariates wereadded to the regressions. Although other measured characteristics were balanced betweentreatment and control (see Table 2), it is worthwhile to increase the statistical power ofour analyses by adding controls for student characteristics such as grade, year at firstimplementation, and demographics. These are included in the estimated models.
The study schools were chosen to have relatively similar demographic and baselineachievement, but the schools do differ both in their mean pretest scores (the range is323.43 to 392.22, with most falling between 323.4 and 360) and the deviation of student
Dow
nloa
ded
by [6
4.13
1.66
.214
] at 1
4:55
06
Oct
ober
201
4
372 T. Rutherford et al.
scores around the mean (range of the standard deviation is 50.86 to 83.81). The intraclasscorrelation (ICC) of .04, although below the typical nationwide school ICC of .22 (Hedges& Hedberg, 2007),3 indicates some degree of similarity between students within schools.Considering the study’s ICC, with an average school size of 419, a design effect for thecurrent study can be calculated based on the formula provided in McCoach and Adelson(2010). The design effect of 17.72 indicates a sampling variability greater than that whichwould be expected from a simple random sample (McCoach & Adelson, 2010). Withinthis study, it implies that nesting of students within schools should be considered to moreaccurately estimate the significance of any treatment effect. To deal with this nesting,we report Huber-White standard errors clustered on school. These conservative adjustedstandard errors were relied upon for determinations of statistical significance and were anincrease over unadjusted standard errors by a factor of 2.5 to 3.5, depending on the sample.
RESULTS
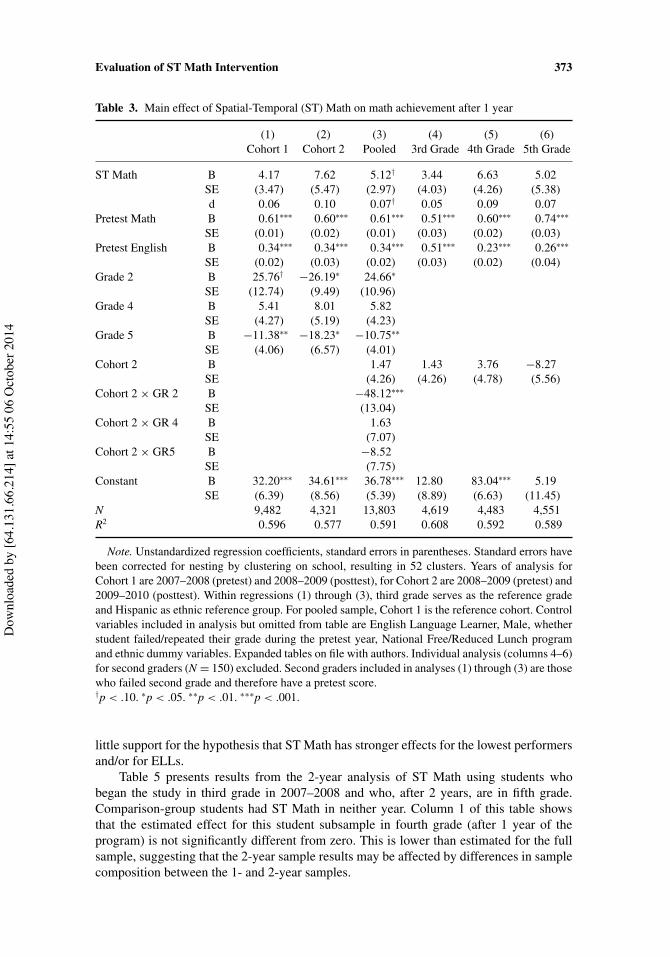
On average, treatment students within the combined sample gained 14.07 points frompre- to posttest, which was 4.25 points more than gained by control students (see the toprow of Table 2). This was .06 of the control group pretest standard deviation, an effectsize that, as we shall see, is similar to the upcoming regression results. Table 3 presentsresults from the regression of mathematics CST scores on treatment status after 1 year.Columns 1 and 2 present the results by cohort, and columns 3 through 6 pool both cohortstogether and present total results as well as results separately by student grade level atposttest (excluding the students who were retained and thus were in second grade twice).The overall, regression-adjusted main effect of ST Math as seen in the pooled sample(column 3) is 5.12 points, and this coefficient is marginally statistically significant (p =.089). Using the standard deviation of the entire sample pretest (72.93), we calculate aneffect size of .07. This is negligible according to Cohen (1988) but on par with the .07effect size found in other random control trials of elementary school interventions testedwith a broad standardized test such as the mathematics CSTs analyzed here and is 14% ofthe average annual mathematics learning gains for a fourth grader (Hill, Bloom, Black, &Lipsey, 2008). In general, the estimated effects of ST Math were similar across the differentsamples in Table 3, with effect sizes ranging from .05 to .10 and with the estimate from thepooled sample falling near the middle of this range. None of these separate estimates wasstatistically significant. Note that standard errors were estimated using the Huber-Whitecorrection for clustering of the sample in schools, which produces larger standard errorsthan those computed from ordinary least squares regression.
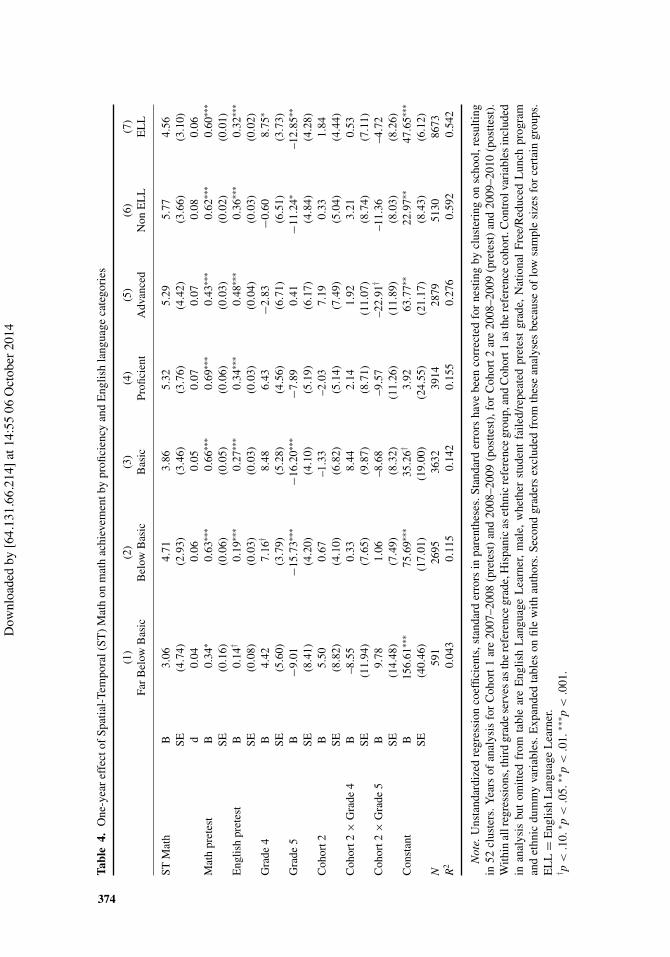
To explore the possibility of effect moderators, we then examined ELL ! Interventionand Initial Proficiency ! Intervention interactions. Separate models were calculated for eachpretest proficiency category and for ELL and non-ELL students (Table 4). Separate models(fully interactive) for each subgroup were chosen over additive models only includinginteraction terms for each Subgroup ! Treatment Status because of the possibility that themathematics and English pretests, grade, year, and other covariates in our model might havedifferent coefficients for each of the subgroups. The 1-year estimated effect of ST Mathwas consistently not significantly greater than zero across the subgroups. Thus, there is
3This low ICC is not surprising given that the study schools were chosen for their demographic,geographic, and prior performance similarities.
Dow
nloa
ded
by [6
4.13
1.66
.214
] at 1
4:55
06
Oct
ober
201
4
Evaluation of ST Math Intervention 373
Table 3. Main effect of Spatial-Temporal (ST) Math on math achievement after 1 year
(1) (2) (3) (4) (5) (6)Cohort 1 Cohort 2 Pooled 3rd Grade 4th Grade 5th Grade
ST Math B 4.17 7.62 5.12† 3.44 6.63 5.02SE (3.47) (5.47) (2.97) (4.03) (4.26) (5.38)d 0.06 0.10 0.07† 0.05 0.09 0.07
Pretest Math B 0.61""" 0.60""" 0.61""" 0.51""" 0.60""" 0.74"""
SE (0.01) (0.02) (0.01) (0.03) (0.02) (0.03)Pretest English B 0.34""" 0.34""" 0.34""" 0.51""" 0.23""" 0.26"""
SE (0.02) (0.03) (0.02) (0.03) (0.02) (0.04)Grade 2 B 25.76† #26.19" 24.66"
SE (12.74) (9.49) (10.96)Grade 4 B 5.41 8.01 5.82
SE (4.27) (5.19) (4.23)Grade 5 B #11.38"" #18.23" #10.75""
SE (4.06) (6.57) (4.01)Cohort 2 B 1.47 1.43 3.76 #8.27
SE (4.26) (4.26) (4.78) (5.56)Cohort 2 ! GR 2 B #48.12"""
SE (13.04)Cohort 2 ! GR 4 B 1.63
SE (7.07)Cohort 2 ! GR5 B #8.52
SE (7.75)Constant B 32.20""" 34.61""" 36.78""" 12.80 83.04""" 5.19
SE (6.39) (8.56) (5.39) (8.89) (6.63) (11.45)N 9,482 4,321 13,803 4,619 4,483 4,551R2 0.596 0.577 0.591 0.608 0.592 0.589
Note. Unstandardized regression coefficients, standard errors in parentheses. Standard errors havebeen corrected for nesting by clustering on school, resulting in 52 clusters. Years of analysis forCohort 1 are 2007–2008 (pretest) and 2008–2009 (posttest), for Cohort 2 are 2008–2009 (pretest) and2009–2010 (posttest). Within regressions (1) through (3), third grade serves as the reference gradeand Hispanic as ethnic reference group. For pooled sample, Cohort 1 is the reference cohort. Controlvariables included in analysis but omitted from table are English Language Learner, Male, whetherstudent failed/repeated their grade during the pretest year, National Free/Reduced Lunch programand ethnic dummy variables. Expanded tables on file with authors. Individual analysis (columns 4–6)for second graders (N = 150) excluded. Second graders included in analyses (1) through (3) are thosewho failed second grade and therefore have a pretest score.†p < .10. "p < .05. ""p < .01. """p < .001.
little support for the hypothesis that ST Math has stronger effects for the lowest performersand/or for ELLs.
Table 5 presents results from the 2-year analysis of ST Math using students whobegan the study in third grade in 2007–2008 and who, after 2 years, are in fifth grade.Comparison-group students had ST Math in neither year. Column 1 of this table showsthat the estimated effect for this student subsample in fourth grade (after 1 year of theprogram) is not significantly different from zero. This is lower than estimated for the fullsample, suggesting that the 2-year sample results may be affected by differences in samplecomposition between the 1- and 2-year samples.
Dow
nloa
ded
by [6
4.13
1.66
.214
] at 1
4:55
06
Oct
ober
201
4
Tabl
e4.
One
-yea
reff
ecto
fSpa
tial-
Tem
pora
l(ST
)Mat
hon
mat
hac
hiev
emen
tby
profi
cien
cyan
dE
nglis
hla
ngua
geca
tego
ries
(1)
(2)
(3)
(4)
(5)
(6)
(7)
FarB
elow
Bas
icB
elow
Bas
icB
asic
Profi
cien
tA
dvan
ced
Non
EL
LE
LL
STM
ath
B3.
064.
713.
865.
325.
295.
774.
56SE
(4.7
4)(2
.93)
(3.4
6)(3
.76)
(4.4
2)(3
.66)
(3.1
0)d
0.04
0.06
0.05
0.07
0.07
0.08
0.06
Mat
hpr
etes
tB
0.34
"0.
63""
"0.
66""
"0.
69""
"0.
43""
"0.
62""
"0.
60""
"
SE(0
.16)
(0.0
6)(0
.05)
(0.0
6)(0
.03)
(0.0
2)(0
.01)
Eng
lish
pret
est
B0.
14†
0.19
"""
0.27
"""
0.34
"""
0.48
"""
0.36
"""
0.32
"""
SE(0
.08)
(0.0
3)(0
.03)
(0.0
3)(0
.04)
(0.0
3)(0
.02)
Gra
de4
B4.
427.
16†
8.48
6.43
#2.
83#
0.60
8.75
"
SE(5
.60)
(3.7
9)(5
.28)
(4.5
6)(6
.71)
(6.5
1)(3
.73)
Gra
de5
B#
9.01
#15
.73""
"#
16.2
0"""
#7.
890.
41#
11.2
4"–1
2.85
""
SE(8
.41)
(4.2
0)(4
.10)
(5.1
9)(6
.17)
(4.8
4)(4
.28)
Coh
ort2
B5.
500.
67–1
.33
–2.0
37.
190.
331.
84SE
(8.8
2)(4
.10)
(6.8
2)(5
.14)
(7.4
9)(5
.04)
(4.4
4)C
ohor
t2!
Gra
de4
B–8
.55
0.33
8.44
2.14
1.92
3.21
0.53
SE(1
1.94
)(7
.65)
(9.8
7)(8
.71)
(11.
07)
(8.7
4)(7
.11)
Coh
ort2
!G
rade
5B
9.78
1.06
–8.6
8–9
.57
–22.
91†
–11.
36–4
.72
SE(1
4.48
)(7
.49)
(8.3
2)(1
1.26
)(1
1.89
)(8
.03)
(8.2
6)C
onst
ant
B15
6.61
"""
75.6
9"""
35.2
6†3.
9263
.77""
22.9
7""47
.65""
"
SE(4
0.46
)(1
7.01
)(1
9.00
)(2
4.55
)(2
1.17
)(8
.43)
(6.1
2)N
591
2695
3632
3914
2879
5130
8673
R2
0.04
30.
115
0.14
20.
155
0.27
60.
592
0.54
2
Not
e.U
nsta
ndar
dize
dre
gres
sion
coef
ficie
nts,
stan
dard
erro
rsin
pare
nthe
ses.
Stan
dard
erro
rsha
vebe
enco
rrec
ted
for
nest
ing
bycl
uste
ring
onsc
hool
,res
ultin
gin
52cl
uste
rs.Y
ears
ofan
alys
isfo
rC
ohor
t1ar
e20
07–2
008
(pre
test
)an
d20
08–2
009
(pos
ttest
),fo
rC
ohor
t2ar
e20
08–2
009
(pre
test
)an
d20
09–2
010
(pos
ttest
).W
ithin
allr
egre
ssio
ns,t
hird
grad
ese
rves
asth
ere
fere
nce
grad
e,H
ispa
nic
aset
hnic
refe
renc
egr
oup,
and
Coh
ort1
asth
ere
fere
nce
coho
rt.C
ontr
olva
riab
les
incl
uded
inan
alys
isbu
tom
itted
from
tabl
ear
eE
nglis
hL
angu
age
Lea
rner
,m
ale,
whe
ther
stud
ent
faile
d/re
peat
edpr
etes
tgr
ade,
Nat
iona
lFr
ee/R
educ
edL
unch
prog
ram
and
ethn
icdu
mm
yva
riab
les.
Exp
ande
dta
bles
onfil
ew
ithau
thor
s.Se
cond
grad
ers
excl
uded
from
thes
ean
alys
esbe
caus
eof
low
sam
ple
size
sfo
rce
rtai
ngr
oups
.E
LL
=E
nglis
hL
angu
age
Lea
rner
.† p
<.1
0." p
<.0
5.""
p<
.01.
""" p
<.0
01.
374
Dow
nloa
ded
by [6
4.13
1.66
.214
] at 1
4:55
06
Oct
ober
201
4

Tabl
e5.
Two-
year
effe
ctof
Spat
ial-
Tem
pora
l(ST
)Mat
hon
mat
hac
hiev
emen
tfor
Coh
ort1
stud
ents
who
star
tin
thir
dgr
ade
(1)
(2)
(3)
(4)
(5)
(6)
(7)
(8)
Mai
nE
ffec
tFa
rBel
owB
asic
Bel
owB
asic
Bas
icPr
ofici
ent
Adv
ance
dN
on-E
LL
EL
L
STM
ath
B1.
95#
7.65
8.75
†4.
074.
33#
7.18
#1.
794.
65SE
(5.1
6)(7
.35)
(4.9
6)(6
.11)
(6.7
4)(8
.14)
(6.8
7)(5
.19)
d0.
03#
0.1
0.12
0.06
0.06
#0.
1#
0.02
0.06
STM
ath
!5t
hG
rade
B9.
596.
364.
987.
617.
6415
.47"
15.8
7"5.
38
SE(5
.99)
(12.
21)
(6.7
4)(7
.97)
(8.3
4)(6
.66)
(7.3
4)(6
.42)
d0.
130.
090.
070.
100.
100.
21"
0.22
"0.
075t
hgr
ade
B#
0.06
8.68
#2.
25#
7.50
#0.
8414
.41""
#1.
110.
64SE
(3.7
3)(8
.62)
(3.2
3)(4
.99)
(5.8
5)(5
.02)
(4.9
0)(4
.19)
Mat
hpr
etes
t(c
ente
red)
B0.
63""
"0.
49†
0.57
"""
0.54
"""
0.55
"""
0.54
"""
0.62
"""
0.63
"""
SE(0
.02)
(0.2
6)(0
.09)
(0.1
3)(0
.10)
(0.0
5)(0
.03)
(0.0
3)E
LA
pret
est
(cen
tere
d)B
0.24
"""
#0.
020.
110.
19""
0.28
"""
0.33
"""
0.30
"""
0.18
"""
SE(0
.03)
(0.2
9)(0
.07)
(0.0
6)(0
.05)
(0.0
7)(0
.04)
(0.0
5)C
onst
ant
B36
7.29
"""
276.
79""
"31
5.34
"""
330.
71""
"38
0.77
"""
459.
24""
"39
7.38
"""
343.
95""
"
SE(7
.59)
(15.
17)
(12.
50)
(11.
32)
(12.
81)
(14.
65)
(8.0
4)(1
3.51
)N
2,67
713
455
575
872
750
31,
068
1,60
9R
20.
549
0.04
70.
069
0.05
60.
097
0.29
80.
580
0.44
8
Fift
h-gr
ade
scor
ere
gres
sed
onST
Mat
h,th
ird-
grad
epr
etes
ts,a
ndde
mog
raph
icco
ntro
ls
STM
ath
B10
.81
#1.
3514
.34"
11.5
712
.03
6.53
13.7
29.
51SE
(7.8
2)(1
2.24
)(6
.92)
(10.
94)
(10.
68)
(9.8
1)(8
.59)
(8.8
4)d
0.15
#0.
020.
20"
0.16
0.16
0.09
0.19
†0.
13R
20.
523
0.05
30.
048
0.04
60.
076
0.31
20.
576
0.40
8
Not
e.U
nsta
ndar
dize
dre
gres
sion
coef
ficie
nts,
stan
dard
erro
rsin
pare
nthe
ses.
Into
pan
alys
is,e
ach
stud
ent(
N=
2,67
7)ha
s2
year
sof
obse
rvat
ions
fora
tota
lof
5,35
4ob
serv
atio
ns.C
ontr
olva
riab
les
incl
uded
inan
alys
isbu
tom
itted
from
tabl
ear
eE
nglis
hL
angu
age
Lea
rner
,mal
e,N
atio
nalF
ree/
Red
uced
Lun
chpr
ogra
man
det
hnic
dum
my
vari
able
s.Pr
etes
tfor
both
sets
ofob
serv
atio
nspe
rstu
dent
isth
e20
07–2
008
Cal
ifor
nia
Stan
dard
sTe
sts
(CST
),be
fore
stud
yim
plem
enta
tion
atco
hort
one
scho
ols.
Con
tinuo
usva
riab
les
are
grou
pm
ean
cent
ered
,dum
my
vari
able
sar
ece
nter
ed(–
.5,.
5).B
otto
mta
ble
isfif
th-g
rade
mat
hC
STre
gres
sed
onth
ird-
grad
epr
etes
twith
cont
rols
asab
ove.
Inbo
thta
bles
;sta
ndar
der
rors
are
clus
tere
don
scho
ol(3
4sc
hool
sw
ithin
this
coho
rt).
EL
L=
Eng
lish
Lan
guag
eL
earn
er.
† p<
.10.
" p<
.05.
""p
<.0
1.""
" p<
.001
.
375
Dow
nloa
ded
by [6
4.13
1.66
.214
] at 1
4:55
06
Oct
ober
201
4

376 T. Rutherford et al.
After fifth grade (2 years in the program), the 2-year effect for this sample was11.48 points (adding together the coefficients of ST Math and ST Math times fifth grade,d = .16) and was not significantly different from zero (p = .12). There was also evidence ofan initial Mathematics Skill ! Treatment interaction for 2 years of ST Math. The interven-tion was least effective for students starting the study with far below basic skills on the CST(d = –.02) and most effective for students beginning with below basic, basic, and proficientmathematics skills (d = .20, .16, and .16, respectively).
The bottom half of Table 5 estimates these results in a different way: regressingfifth-grade score on the treatment variable and third-grade controls. For each column, thenumbers are consistently close to the calculations from the sum of ST and ST ! Fifth-Grade Coefficients in the top panel of the table. In particular, the 2-year main effect for thetotal subsample in Table 5 was not significant. Overall, the fact that the 1-year effect forthe 2-year sample differs substantially from the 1-year effect estimated with the (largestpossible) pooled sample suggests that the estimated 2-year effect should be viewed as nomore than exploratory.
ST Math is a supplemental program, and as such requires an additional 1 12 hr of (com-
puter lab) mathematics instruction each week. This time must come from somewhere; itis possible that instructional time for other subjects is being compromised to accommo-date ST Math (evidence from our 2011–2012 surveys supports this). To test for achieve-ment consequences of this, we analyzed student ELA CSTs scores (pooled sample pretestM = 329.47, SD = 74.49). After 1 year of ST Math, there is a small and nonsignificantnegative association with treatment (d = –.02, p = .204, table on file with authors). Theeffect does not vary significantly across proficiency and language categories, nor does itachieve significance for any one group. Some variation is seen in the 2-year effect (Table 6;effect sizes range from –.17 to +.02) calculated by regressing fifth-grade test score perfor-mance on third-grade controls as is done with mathematics scores at the bottom of Table 5;however, none of the ST Math coefficients reach significance.
Robustness Check
Although less of a concern because of the random assignment of schools to conditions,unmeasured characteristics of schools may nevertheless bias our results. To control forunmeasured characteristics of schools, we employed a school fixed-effects model as a checkof our simple OLS regression results. The fixed-effects estimates were largely consistentwith the results reported; coefficients were within 1 point of those reported, and the directionand significance of results were unchanged.
For the analyses just reported, we included students who were second graders at theirschool’s 1st year of implementation and, because they had failed and repeated secondgrade, therefore have both pre- and posttest results. We conducted sensitivity analyses, andno significant differences were found between models that included and excluded thesestudents.
DISCUSSION
The Main Effect of ST Math
We found that 1 year of ST Math produced very modest (d = 0.07 SD), marginally significantgains in mathematics CST scores among third- through fifth-grade students within 52
Dow
nloa
ded
by [6
4.13
1.66
.214
] at 1
4:55
06
Oct
ober
201
4
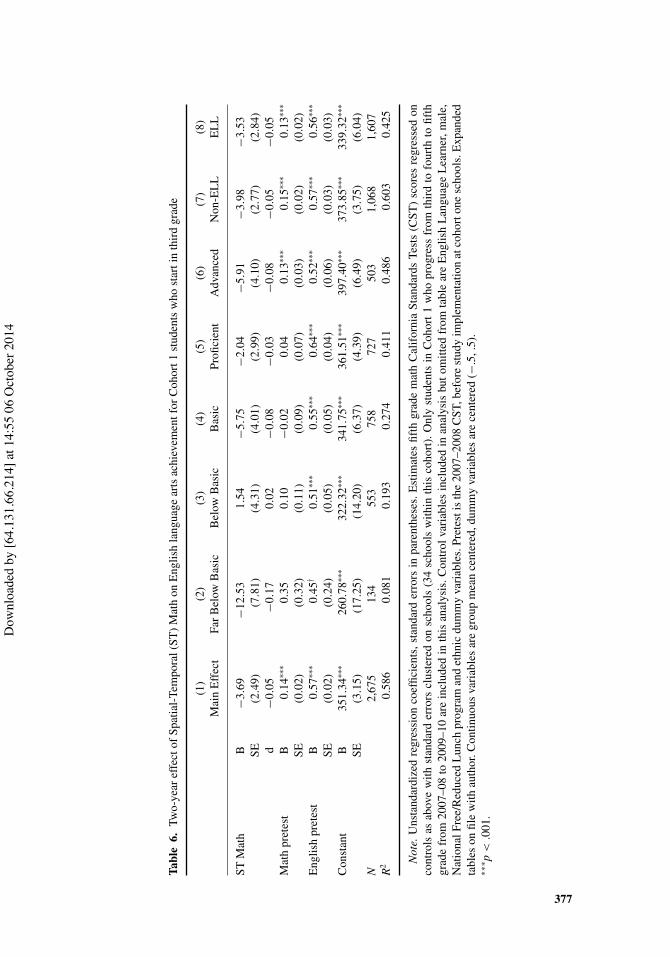
Tabl
e6.
Two-
year
effe
ctof
Spat
ial-
Tem
pora
l(ST
)Mat
hon
Eng
lish
lang
uage
arts
achi
evem
entf
orC
ohor
t1st
uden
tsw
host
arti
nth
ird
grad
e
(1)
(2)
(3)
(4)
(5)
(6)
(7)
(8)
Mai
nE
ffec
tFa
rBel
owB
asic
Bel
owB
asic
Bas
icPr
ofici
ent
Adv
ance
dN
on-E
LL
EL
L
STM
ath
B#
3.69
#12
.53
1.54
#5.
75#
2.04
#5.
91#
3.98
#3.
53SE
(2.4
9)(7
.81)
(4.3
1)(4
.01)
(2.9
9)(4
.10)
(2.7
7)(2
.84)
d#
0.05
#0.
170.
02#
0.08
#0.
03#
0.08
#0.
05#
0.05
Mat
hpr
etes
tB
0.14
"""
0.35
0.10
#0.
020.
040.
13""
"0.
15""
"0.
13""
"
SE(0
.02)
(0.3
2)(0
.11)
(0.0
9)(0
.07)
(0.0
3)(0
.02)
(0.0
2)E
nglis
hpr
etes
tB
0.57
"""
0.45
†0.
51""
"0.
55""
"0.
64""
"0.
52""
"0.
57""
"0.
56""
"
SE(0
.02)
(0.2
4)(0
.05)
(0.0
5)(0
.04)
(0.0
6)(0
.03)
(0.0
3)C
onst
ant
B35
1.34
"""
260.
78""
"32
2.32
"""
341.
75""
"36
1.51
"""
397.
40""
"37
3.85
"""
339.
32""
"
SE(3
.15)
(17.
25)
(14.
20)
(6.3
7)(4
.39)
(6.4
9)(3
.75)
(6.0
4)N
2,67
513
455
375
872
750
31,
068
1,60
7R
20.
586
0.08
10.
193
0.27
40.
411
0.48
60.
603
0.42
5
Not
e.U
nsta
ndar
dize
dre
gres
sion
coef
ficie
nts,
stan
dard
erro
rsin
pare
nthe
ses.
Est
imat
esfif
thgr
ade
mat
hC
alif
orni
aSt
anda
rds
Test
s(C
ST)
scor
esre
gres
sed
onco
ntro
lsas
abov
ew
ithst
anda
rder
rors
clus
tere
don
scho
ols
(34
scho
ols
with
inth
isco
hort
).O
nly
stud
ents
inC
ohor
t1w
hopr
ogre
ssfr
omth
ird
tofo
urth
tofif
thgr
ade
from
2007
–08
to20
09–1
0ar
ein
clud
edin
this
anal
ysis
.Con
trol
vari
able
sin
clud
edin
anal
ysis
buto
mitt
edfr
omta
ble
are
Eng
lish
Lan
guag
eL
earn
er,m
ale,
Nat
iona
lFre
e/R
educ
edL
unch
prog
ram
and
ethn
icdu
mm
yva
riab
les.
Pret
esti
sth
e20
07–2
008
CST
,bef
ore
stud
yim
plem
enta
tion
atco
hort
one
scho
ols.
Exp
ande
dta
bles
onfil
ew
ithau
thor
.Con
tinuo
usva
riab
les
are
grou
pm
ean
cent
ered
,dum
my
vari
able
sar
ece
nter
ed(#
.5,.
5).
""" p
<.0
01.
377
Dow
nloa
ded
by [6
4.13
1.66
.214
] at 1
4:55
06
Oct
ober
201
4

378 T. Rutherford et al.
low-performing schools in Orange County, California. Estimates of 2-year effects werelarger (d = 0.15 SD) but not statistically significant. Although disappointing, such nullfindings are important to consider given the cost of the CAI and the supplementary timerequired. This evidence can be classified as approaching “strong” according to Slavin andLake (2008), because of the randomized design of the study, the large sample size (both ofstudents and schools), and the use of clustered standard errors to account for the nesting ofstudent observations within schools. Neither effect size reaches Slavin and Lake’s (2008)+0.20 effect size threshold for an effect to be important (p. 476). The WWC uses a +.25effect size threshold for “substantive importance.” To put these results in context, the average1-year effect size from the 10 CAI studies vetted by the WWC is .14, and among the threewith enough evidence to be given the label of “potentially positive results for mathematicsachievement,” the effect sizes range from .04 to .27 (U.S. Department of Education WWC,2013a). The effect size for ST Math is at the lower end of this range.
How do these results compare to those of rigorous recent studies of the effect sizes ofinterventions based on innovative educational technology? The two WWC-vetted studiesof educational technology with positive effects have effect sizes well beyond ST Math’s1-year effect. Roschelle and colleagues (2007) find an effect of .87 for SimCalc; however,the intervention is in the shortest duration category of interventions as reported by theNational Mathematics Advisory Panel (2008a)—the category most likely to have the largesteffect. Such short, targeted interventions typically have assessments that are strongly relatedto the intervention (see Cheung & Slavin, 2013). Testing a yearlong intervention with astandardized statewide end-of-year assessment leaves more room for mis-targeting anddiffusion of the effect but may provide more relevant evidence for schools in light ofmandated state assessment and accountability systems.
The Barrow, Markman, and Rouse (2009) study’s .17 1-year effect size is calculatedfrom a limited sample standard deviation. When the national standard deviation is used, theeffect drops to .09 (p. 67). By comparison, the ST Math effect drops from .07 to .06 when thestatewide standard deviation for the appropriate grade levels (Educational Testing Service,2009) is used in the calculation. ST Math’s effect is similar to effects within the randomizedexperiment evaluations of educational technology in Cheung and Slavin (2013), where anaverage effect of .08 was found. Hence, in general, and including ST Math, it appears thatwhen CAI is added to mathematics instruction, the learning gains are relatively small inmagnitude.
Assessment of these results should also consider the costs of the program (Duncan &Magnuson, 2007). As a supplemental intervention, ST Math represents a cost over and abovethe cost of the resources already available to schools. An attempt to create a cost–benefitcalculation runs up against the following considerations: How should the benefit be valued(e.g., per test score point increase, per percentage of students brought over proficiency)?How should the cost be calculated (e.g., with which pricing structure, for a single year oramortized over multiple years)?
In addition, monetary expense is not the only cost of the program. Where did the90 min per week for the ST Math computer lab come from? The answer varied, withteachers drawing time from ELA, Social Studies or Science, and other areas. Although thetreatment effects on ELA scores for student subgroups were not statistically significant, sixout of seven of the subgroup coefficients were negative (Table 6). The largest negative effectsize (–.17) for those students with ELA scores Far Below Basic suggests the possibilitythat, as a result of ST Math implementation, these students suffered from less instructionaltime devoted to ELA.
Dow
nloa
ded
by [6
4.13
1.66
.214
] at 1
4:55
06
Oct
ober
201
4

Evaluation of ST Math Intervention 379
The Effect of ST Math on ELLs
Standard mathematics curricula require the comprehension and production of academicvocabulary that may be beyond the capacity of ELLs. A key feature of the ST Math curricu-lum is that, by providing language-minimal concept instruction, it should be particularlyaccessible to ELLs (Shaw & Peterson, 2000). Program designers hypothesize that ELLscan be gradually introduced to math symbols and language after the initial language-freeintroduction to concepts.
Yet we did not find the expected larger effect for ELL students within our study. Thisexpectation of an ELL ! Treatment interaction assumed that the ST Math instructionalmodel is particularly well aligned with the needs of non-English Learners. Hence thetheory of change model is not supported in this regard and may need to be revised. Onepossibility is that the language-free instruction offered by ST Math is not able to providethe conceptual understanding that ELLs need. Another possibility is that ST Math doesprovide such conceptual understanding but that, given the language challenges faced byELLs, this understanding is not sufficient to provide larger effects for this group.
The Effect of ST Math Depending on Initial Math Proficiency Status
The developers of ST Math hypothesized that the individualized scaffolding and feedbackinherent in ST Math would produce larger effects for low-performing students, similar to acompensatory hypothesis (Sameroff & Chandler, 1975). However, we found little supportfor this in either the effect estimates after 1 year (Table 4) or the 2-year effect estimatesin the bottom panel of Table 5. Instead, the magnitudes of the 2-year effects for the fiveproficiency categories, as seen near the bottom of Table 6, find the smallest effects for the twoextreme groups—the lowest and highest categories and significant effects only for studentswith below basic mathematics skills. Caution should be exercised when interpreting theseresults, and subgroup differences should be considered exploratory, as small sample sizesled to insufficient power to adequately test these hypotheses (Bloom, 2010).
What might account for the failure to observe stronger effects for the lowest students?One possibility is that, because students began ST Math at a place determined by theirgrade level, the lowest performing students were not able to access the curriculum—theymay have needed below-grade-level content. A second possibility is that the failure ofteachers to link program content and classroom curricula reduced the effectiveness of theprogram. More generally, it may be that the type of mathematics skill improvement andtransfer envisioned by the ST Math developers does not occur as easily as they imagine. STMath resembles a video game, and as such it is engaging for the students. But the ability ofsuch video game activities to teach skills that transfer to the mathematics classroom, andmathematics standardized tests, appears to be lower than expected by program developers.Future research should focus in more sharply on which specific mathematics skills aresuccessfully inculcated by ST Math, and the extent to which each of these translates intoincreased performance on standardized tests. It may be that such transfer requires explicitreinforcement of these skills by the classroom teacher, immediately after they are learned byST Math play. Such linkage and reinforcement was absent in the program implementationexamined here.
Within the current study, we were unable to disentangle the effect of ST Math fromthat of extra school time devoted to mathematics instruction, which is a limitation. It ap-peared that around two thirds of teachers took time away from other subjects to devote
Dow
nloa
ded
by [6
4.13
1.66
.214
] at 1
4:55
06
Oct
ober
201
4

380 T. Rutherford et al.
to mathematics instruction via ST Math. To our knowledge, there has not been a ran-dom assignment study to determine the effects of additional mathematics instruction onmathematics achievement in elementary school.
IMPLICATIONS FOR ST MATH AND CAI DEVELOPMENT AND RESEARCH
Although this study was conducted to evaluate one CAI mathematics intervention, STMath contains many features noted as important in designing CAI for underperformingstudents and ELLs (Freeman & Crawford, 2008; Li & Edmonds, 2005; Seo & Bryant,2009). The highly scaffolded, visual approach was expected to produce stronger effects forthese subgroups than English-speaking and higher performing peers and it did not. Futurestudies of other similarly featured programs may be informed by our results and set out apriori to investigate comparisons in line with our findings suggesting a pattern of strongeffects for middle-performing students. In light of our results, programs serving studentswho are performing far below or above grade level may be more effective in increasingstudents’ mathematics gains by including content outside of the student’s school gradeand/or provide a truly adaptive program with different start-points. The active involvementof the teacher might also be required. Some of these adjustments have been included in thelatest generation of ST Math software: Teachers are offered more flexibility in determiningwhich games students skip or repeat and the order in which they are introduced.
In addition, ST Math’s games were designed to capitalize on the unique relationbetween spatial skills and mathematics (see Geary, 1995, 2011) in producing mathematicsconceptual understanding. This approach did not result in statistically significantly higherstandardized math scores than those produced by the business-as-usual instruction receivedby control students. The standardized test used as the measure of effectiveness includeda range of questions on grade-level mathematics but did not include spatial mathematicalrepresentations as were used in ST Math. Developers may wish to assess their products withmore tightly related measures and/or may wish to consider carefully how their softwarewill translate to more classroom-relevant measures of performance.
U.S. students are struggling to prepare for a world increasingly dependent on mathe-matics skill and the critical thinking and problem-solving skills that may be supported bymathematics education (National Academies Press, 2010; National Science Foundation,2010). The students in our study cohort of Orange County, California, schools are no ex-ception, yet only 49% of those in our study schools obtained mathematics scores at or abovea proficient level during the year prior to study entry. Traditional mathematics instructionalone was not producing the gains necessary for our study students to succeed in STEM-related advanced study and careers. Although ST Math claims to provide a distinctiveapproach by emphasizing intuitive spatial representations, a game context for learning, andindividualized instruction, the results of this study suggest that these kinds of supplementalinterventions may not provide an educationally important impact on students’ mathematicslearning. As discussed, ST Math requires investments of both money and time for districts.Hence, publication of evaluation results from large-scale real-world supplemental mathe-matics instructional implementations such as this one can provide a realistic view of thepossibilities and limitations of this and other CAI supplemental interventions.
REFERENCES
Abedi, J., & Herman, J. (2010). Assessing English Language Learners’ opportunity to learn mathe-matics: Issues and limitations. Teachers College Record, 112, 723–746.
Dow
nloa
ded
by [6
4.13
1.66
.214
] at 1
4:55
06
Oct
ober
201
4
Evaluation of ST Math Intervention 381
Barrow, L., Markman, L., & Rouse, C. E. (2009). Technology’s edge: The educational benefitsof Computer-Aided Instruction. American Economic Journal: Economic Policy, 1, 52–74.doi:10.2307/25760027
Bloom, H. S. (2010). When is the story in the subgroups? Strategies for interpreting and re-porting intervention effects for subgroups (Working Paper). Retrieved from MDRC website:http://www.mdrc.org/publications/551/full.pdf
Booth, J. L., & Siegler, R. S. (2008). Numerical magnitude representations influence arithmeticlearning. Child Development, 79, 1016–1031. doi:10.1111/j.1467-8624.2008.01173.x
California Department of Education. (2011a). California English Language Development Test [Testwebsite]. Retrieved from http://www.cde.ca.gov/ta/tg/el/
California Department of Education. (2011b). Standardized Testing and Reporting (STAR) Results[Data files]. Retrieved from http://star.cde.ca.gov/
California Department of Education. (2013). Instructional Materials Price List (IMPL). Retrievedfrom http://www3.cde.ca.gov/impricelist/implsearch.aspx
California State Board of Education. (2010a). K-12 California’s common core contentstandards for mathematics. Retrieved from http://www.scoe.net/castandards/agenda/2010/math ccs recommendations.pdf
California State Board of Education. (2010b). Technical Q & A: Percent proficient. Retrieved fromhttp://www.cde.ca.gov/ta/ac/ap/techqa06b.asp
Cheung, A. C. K., & Slavin, R. E. (2013). The effectiveness of educational technology applicationsfor enhancing mathematics achievement in K-12 classrooms: A meta-analysis. EducationalResearch Review, 9, 88–113. doi:10.1016/j.edurev.2013.01.001
Clements, D. H., & Sarama, J. (2009). Learning and teaching early math: The learning trajectoriesapproach. New York, NY: Taylor & Francis. doi:10.1007/0-306-48085-9 3
Cohen, J. (1988).Statistical power analysis for the behavioral sciences (2nd ed.). Hillsdale, NJ:Erlbaum.
Duncan, G. J., Dowsett, C. J., Claessens, A., Magnuson, K., Huston, A. C., Klebanov, P., . . . Japel,C. (2007). School readiness and later achievement. Developmental Psychology, 43, 1428–1446.doi:10.1037/0012-1649.43.6.1428
Duncan, G. J., & Magnuson, K. (2007). Penny wise and effect size foolish. Child DevelopmentPerspectives, 1, 46–51. doi:10.1111/j.1750-8606.2007.00009.x
Educational Testing Service. (2008). California Standards Tests (CSTs) technical report, spring 2007administration. Retrieved from http://www.cde.ca.gov/ta/tg/sr/documents/csttechrpt07.pdf
Educational Testing Service. (2009). California Standards Tests (CSTs) technical report, spring 2008administration. Retrieved from http://www.cde.ca.gov/ta/tg/sr/documents/csttechrpt08.pdf
Edwards, J., Norton, S., Taylor, S., Weiss, M., & Dusseldorp, R. (1975). How effective is CAI? Areview of the research. Educational Leadership, 33, 147–153.
Freeman, B., & Crawford, L. (2008). Creating a middle school mathematics curriculum forEnglish Language Learners. Remedial and Special Education, 29, 9–19. doi:10.1177/0741932507309717
Geary, D. C. (1995). Reflections of evolution and culture in children’s cognition. Implications formathematical development and instruction. The American Psychologist, 50, 24–37.
Geary, D. C. (2011). Cognitive predictors of achievement growth in mathematics: A 5-year longitu-dinal study. Developmental Psychology, 47, 1539–1552. doi:10.1037/a0025510
Graziano, A. B., Peterson, M., & Shaw, G. L. (1999). Enhanced learning of proportional math throughmusic training and spatial temporal training. Neurological Research, 21, 139–152.
Harper, C., & de Jong, E. (2004). Misconceptions about teaching English-language learners. Journalof Adolescent & Adult Literacy, 48, 152–162. doi:10.1598/JAAL.48.2.6
Hedges, L. V., & Hedberg, E. C. (2007). Intraclass correlation values for planning group-randomized trials in education. Educational Evaluation and Policy Analysis, 29, 60–87.doi:10.3102/0162373707299706
Hemphill, F. C., & Vanneman, A. (2011). Achievement gaps: How Hispanic and White stu-dents in public schools perform in mathematics and reading on the National Assessment
Dow
nloa
ded
by [6
4.13
1.66
.214
] at 1
4:55
06
Oct
ober
201
4
382 T. Rutherford et al.
of Educational Progress (NCES 2011-459). Washington, DC: National Center for Educa-tion Statistics, Institute of Education Sciences, U.S. Department of Education. Retrieved fromhttp://nces.ed.gov/nationsreportcard/pdf/studies/2011459.pdf
Hill, C. J., Bloom, H. S., Black, A. R., & Lipsey, M. W. (2008). Empirical benchmarks for interpret-ing effect sizes in research. Child Development Perspectives, 2, 172–177. doi:10.1111/j.1750-8606.2008.00061.x
Hoffert, S. B. (2009). Mathematics: The universal language? Mathematics Teacher, 103, 130–139.Li, Q., & Edmonds, K. A. (2005). Mathematics and at-risk adult learners: Would technology help?
Journal of Research on Technology in Education, 38, 143–166.Martinez, M. E., Peterson, M., Bodner, M., Coulson, A., Vuong, S., Hu, W., . . . Shaw, G. L.
(2008). Music training and mathematics achievement: A multiyear iterative project designedto enhance students’ learning. In A. E. Kelly, R. A. Lesh, & J. Y. Baek (Eds.), Handbook ofdesign research methods in education: Innovations in science, technology, engineering, andmathematics learning and teaching (pp. 396–409). New York, NY: Routledge.
McCoach, D. B., & Adelson, J. L. (2010). Dealing with dependence (Part I): Understanding theeffects of clustered data. Gifted Child Quarterly, 54, 152–155. doi:10.1177/0016986210363076
MIND Research Institute. (2007). ST Math scope and sequence, second grade, 2007 Californiaedition. Santa Ana, CA: Mind Research Institute.
National Academies Press. (2010). Rising above the gathering storm, revisited: Rapidly approachingCategory 5. Retrieved from http://books.nap.edu/catalog.php?record id = 12999
National Mathematics Advisory Panel (2008a). Chapter 6: Report of the task group on instructionalpractices. Washington, DC: U.S. Department of Education. Retrieved from http://www2.ed.gov/about/bdscomm/list/mathpanel/report/instructional-practices.pdf
National Mathematics Advisory Panel. (2008b). Foundations for success: The final report of the Na-tional Mathematics Advisory Panel. Washington, DC: U.S. Department of Education. Retrievedfrom http://www2.ed.gov/about/bdscomm/list/mathpanel/report/final-report.pdf
National Research Council. (2001). Adding it up: Helping children learn mathematics. In J. Kilpatrick,J. Swafford, & B. Findell (Eds.), Mathematics Learning Study Committee, Center for Education,Division of Behavioral and Social Sciences and Education. Washington, DC: National AcademyPress. Retrieved from http://www.nap.edu/openbook.php?isbn = 0309069955
National Research Council. (2005). How students learn: Mathematics in the classroom. In M.S.Donovan & J. D. Bransford (Eds.), Committee on how people learn. A targeted report for teachers(Division of Behavioral and Social Sciences and Education). Washington, DC: The NationalAcademies Press. Retrieved from http://www.nap.edu/openbook.php?record id = 11101
National Research Council. (2009). Mathematics learning in early childhood: Paths toward excellenceand equity. In C. T. Cross, T. A. Woods, & H. Schweingruber (Eds.), Report of the Committeeon Early Childhood Mathematics (Center for Education, Division of Behavioral and SocialSciences and Education). Washington, DC: The National Academies Press. Retrieved fromhttp://www.nap.edu/openbook.php?record id = 12519&page = R1
National Science Foundation. (2010). Preparing the next generation of STEM innovators: Iden-tifying and developing our nation’s human capital. Retrieved from http://www.nsf.gov/nsb/publications/2010/nsb1033.pdf
No Child Left Behind Act of 2001, Pub. L. No. 107–110, § 115, Stat. 1425 (2002).Opfer, J. E., & Siegler, R. S. (2012). Development of quantitative thinking. In K. Holyoak & R.
Morrison (Eds.), Oxford handbook of thinking and reasoning (pp. 585–605). Cambridge, UK:Oxford University Press.
Peterson, M. R., Balzarini, D., Bodner, M., Jones, E. G., Phillips, T., Richardson, D., & Shaw,G. L. (2004). Innate spatial-temporal reasoning and the identification of genius. NeurologicalResearch, 26, 2–8). doi:10.1179/016164104773026471
Peterson, M. & Patera, J. (2006, July). Non-language-based instruction in mathematics. Paper pre-sented at the conference of the International Commission for the Study and Improvement ofMathematics Education.
Petrosino, A. (2000). Mediators and moderators in the evaluation of programs for children. EvaluationReview, 24, 47–72. doi:10.1177/0193841X0002400102
Dow
nloa
ded
by [6
4.13
1.66
.214
] at 1
4:55
06
Oct
ober
201
4

Evaluation of ST Math Intervention 383
Ramani, G. B., & Siegler, R. S. (2011). Reducing the gap in numerical knowledge between low-and middle-income preschoolers. Journal of Applied Developmental Psychology, 32, 146–159.doi:10.1016/j.appdev.2011.02.005
Roschelle, J., Shechtman, N., Tatar, D., Hegedus, S., Hopkins, B., Empson, S., . . . Gallagher,L. (2010). Integration of technology, curriculum, and professional development for ad-vancing middle school mathematics. American Educational Research Journal, 47, 833–878.doi:10.3102/0002831210367426
Roschelle, J., Tatar, D., Shechtman, N., Hegedus, S., Hopkins, B., Knudsen, J., & Stroter, A. (2007).Can a technology-enhanced curriculum improve student learning of important mathematics?(SimCalc Tech. Rep. 01). Menlo Park, CA: SRI International.
Sameroff, A. J., & Chandler, M. J. (1975). Reproductive risk and the continuum of caretaker casualty.In F. D. Horowitz (Ed.), Review of child development research (Vol. 4) (pp. 119–149). Chicago:University of Chicago Press.
Seo, Y.-J., & Bryant, D. P. (2009). Analysis of studies of the effects of computer-assisted instructionon the mathematics performance of students with learning disabilities. Computers & Education,53, 913–928. doi:10.1016/j.compedu.2009.05.002
Shadish, W. R., & Cook, T. D. (2009). The Renaissance of Field Experimentation in Eval-uating Interventions. Annual Review of Psychology, 60, 607–629. doi:10.1146/annurev.psych.60.110707.163544
Shadish, W. R., Cook, D. T., & Campbell, D. T. (2002). Experimental and quasi-experimental designsfor generalized causal inference. Boston, MA: Houghton Mifflin.
Shaw, G., & Peterson, M. (2000). Keeping Mozart in mind. San Diego Calif.: Academic.Siegler, R., Carpenter, T., Fennell, F., Geary, D., Lewis, J., Okamoto, Y., . . . Wray, J. (2010).
Developing effective fractions instruction for Kindergarten through 8th grade (NCEE#2010-4039). Washington, DC: National Center for Education Evaluation and Regional As-sistance, Institute of Education Sciences, U.S. Department of Education. Retrieved fromhttp://ies.ed.gov/ncee/wwc/pdf/practice guides/fractions pg 093010.pdf
Siegler, R. S., Thompson, C. A., & Schneider, M. (2011). An integrated theory of whole number andfractions development. Cognitive Psychology, 62, 273–296.
Slavin, R. E., & Lake, C. (2008). Effective programs in elementary mathematics: A best-evidencesynthesis. Review of Educational Research, 78, 427–515. doi:10.3102/0034654308317473
Song, S., & Keller, J. (2001). Effectiveness of motivationally adaptive computer-assisted instructionon the dynamic aspects of motivation. Educational Technology Research and Development,49(2), 5–22. doi:10.1007/BF02504925
Thurston, W. P. (1990). Mathematical education. Notices of the American Mathematical Society, 37,844–850. Retrieved from http://arxiv.org/abs/math/0503081
Traynor, P. L. (2003). Effects of computer-assisted-instruction on different learners. Journal ofInstructional Psychology, 30, 137.
Tung, F.-W., & Deng, Y.-S. (2006). Designing social presence in e-learning environments: Test-ing the effect of interactivity on children. Interactive Learning Environments, 14, 251–264.doi:10.1080/10494820600924750
U.S. Department of Education. (2013). Elementary & secondary education, ESEA flexibility. Re-trieved from http://www2.ed.gov/policy/elsec/guid/esea-flexibility/index.html
U.S. Department of Education, Institute of Education Sciences, National Center for EducationEvaluation and Regional Assistance. (2013a). What Works Clearinghouse. Retrieved fromhttp://ies.ed.gov/ncee/wwc/
U.S. Department of Education, Institute of Education Sciences, National Center for Edu-cation Evaluation and Regional Assistance. (2013b). What Works Clearinghouse proce-dures and standards handbook (Version 2.1). Retrieved from http://ies.ed.gov/ncee/wwc/pdf/reference resources/wwc procedures v2 1 standards handbook.pdf
Wu, H. (2005, April). Key mathematical ideas in Grades 5–8. Paper presented at the annual meetingof the National Council of Teachers of Mathematics, Anaheim, CA.
Dow
nloa
ded
by [6
4.13
1.66
.214
] at 1
4:55
06
Oct
ober
201
4


![Rutherford Backscattering Spectrometry (RBS) · 2013-05-14 · Rutherford Backscattering Spectrometry (RBS) Rutherford Backscattering Spectrometry . Quiz [3] “natural” unit in](https://img.dokumen.tips/doc/110x75/5fb3ede1e819350a63085fbf/rutherford-backscattering-spectrometry-rbs-2013-05-14-rutherford-backscattering.jpg)