Embed Size (px)
Citation preview

In the Name of God
Journal of Physical Chemistry & Electrochemistry has been sanctified in the 57th Session of The Investigation and Validation Committee of The Islamic Azad University’s Scientific
Journals; Permit No.88/216625 dated 27 July 2009.
The Islamic Azad University Commission of Assessment & Certification of Scientific Publications, at its 83 and 84th sessions dated 1390.08.30 has assigned the rank of Scientific-Research Journal to the “Journal of physical Chemistry and Electrochemistry”,
of Marvdasht Branch, Islamic Azad University, Iran
Journal of Physical Chemistry and Electrochemistry
Islamic Azad University, Marvdasht Branch
Vol. 2/ No 2/ 2014
Published byIslamic Azad University Marvdasht Branch
Address: P. O Box 465, Marvdasht, IranTel: 0098 71 43311145Fax: 0098 71 43311145

Editor-in-ChiefDr. Mehdi VadiDepartment of Chemistry, Islamic Azad University, Fasa Branch
Managing EditorDr. Zahra SharafiDepartment of Chemistry, Islamic Azad University, Marvdasht Branch
Regional EditorDr. Masoome EmadiDepartment of Chemistry, Islamic Azad University, Marvdasht Branch
English Text EditorDr. Reza Kia, Department of Chemistry, Islamic Azad University, Science and Research Branch, Tehran
Editorial boardProf. M. Asadi (Shiraz University) Prof. H. Eslami (Persian Gulf University)Prof. H. Mousavi Pour (Shiraz University)Prof. M. Papari (Shiraz Technical University)Dr. A. Mohajeri (Shiraz University)Dr. Z. Sharafi (Islamic Azad University, Marvdasht Branch)Dr. M. Bahadori (Islamic Azad University, Marvdasht Branch)Dr. L. Baramakeh (Islamic Azad University, Marvdasht Branch) Dr. Mehdi Vadi (Islamic Azad University, Fasa Branch)
Journal of Physical Chemistry and Electrochemistry (JPCE) is published quarterly by Islamic Azad University (marvdasht Branch). Copyright is protected by the university.
Aims and ScopsJPCE is an Iranian journal covering all fields of physical chemistry and electrochemistry.JPCE welcomes high quality original papers in English dealing with experimental, theoretical and applied research related to all branches of physical chemistry and electrochemistry.
Submission of papersBy Mail: One copies of the manuscript accompanied by a covering letter should be sending to [email protected].
IntroductionPlease consult this Guide for further details on the requirements for submitting your paper to Journal of Physical Chemistry and Electrochemistry (JPCE). JPE is published quarterly by Islamic Azad University (Marvdasht branch). Copyright is protected by the society.

Aims and ScopeJPCE, is an Iranian journal covering all fields of physical chemistry and electrochemistry. JPCE welcomes high quality original papers in English dealing with experimental, theoretical, applied research and review articles to all branches of physical chemistry and electrochemistry. You are kindly invited to submit your manuscript and send your article to [email protected] .All contributions in the form of original papers or short communications will be peering reviewed and published free of charge after acceptance.
Submission InformationAll correspondence concerning submission of manuscripts and communications concerning editorial matters should be addressed to Email: [email protected] . Submission of an article implies that the work described has not been published previously (except in the form of an abstract or as part of a published lecture or academic thesis), that is not under consideration for publication elsewhere, that is published is approved by all authors and tacitly or explicitly by the responsible authorities where the work was carried out, and that, if accepted, it will not be published elsewhere in the same form, in English or in any other language, without the written consent of the copyright-holder.
Referees Please submit, as part of the covering letter with the manuscript, the names, full affiliation (department, institution, city and country) and email addresses of three potential referees.
Article StructureFollow this order when typing manuscript: Title, Authors, Affiliations, Abstract, Keywords, Main Text, Acknowledgements, Appendix, References, Figures and then Tables. Collate acknowledgements in a separate section at the end of the article.
Text Layout: Use Times New Roman font no. 12 with double space between each lineal. Present tables and figures on separate page at the end of the manuscript. Number all pages consecutively.
Title: Papers should be headed by a concise and informative title. This should be followed by the name (s) and complete address of the author(s). Corresponding authors: Clearly indicate who is responsible for correspondence at all stages of refereeing and publication, including post-publication. Telephone and fax numbers (with area code) are provided in addition to the e-mail address and complete postal address. Full postal address must be given for all co-authors.
Abstract: An abstract of 150-250 words should be included at the beginning of a paper. The abstract should be state briefly the purpose of the research, the principle results and major conclusions. An abstract is often presented in a single paragraph, so it must be able to stand alone for this reason and References should be avoided.
Keywords: Immediately after the abstract, provide five to ten keywords. Be sparing with abbreviations: only abbreviations firmly established in the field may be eligible.
Introduction: State the objectives of the work and provide an adequate background, avoiding a detailed literature survey or a summary of the results.
Material and Methods: Provide sufficient detail to allow the work to be reproduced. Methods
already published should be indicated by a reference: only relevant modifications should be described.
Theory/Calculation: A Theory section should extend, not repeat, the background to the article already dealt with in the Introduction. In contrast, a Calculation section represents a practical development from a theoretical basis.
Results: Results should be clear and concise.
Discussion: This should explore the significance of the results of the work, not repeat them. A combined Results and Discussions section is often appropriate. Avoid extensive citations and discussion of published literature.
Conclusions: The main conclusions of the study may be presented in a short Conclusion section, which may stand alone or form a subsection of a Discussion or Results and Discussion section.
References: All publications cited in the text should be presented in a list of references following the text of the manuscript. In the text make references using a number in square brackets on the line, and the full references should be given in a given in a numerical list at the end of the paper. The Titles of journals should be abbreviated according to the standard rules. Titles for wich no abbreviation is given should be written out in full.
Article from a journal (all authors must be mentioned)[1] A. Boushehri, E.A. Mason, J. Kestin, Improved tables for the calculation of nonspherical contributions to second virial coefficients, Internat. J. Thermophys. 7 (1986) 1115.
Book or published thesis[1] M.N Ozisik,. Radiative transfer and interactions with conduction and convection, John Wiley and Sons, New York, 1973.
Unpublished thesis[1] F. Frisvold, Filtration of aluminums: theory, mechanisms and experiments, Ph. D. thesis, university of Trondheim, Norway, 1990.
Article published in conference proceedings[1] D. Bougeard, J. Vermeulen, B. Baudoin, Spatial resolution enhancement of an IR system by image restoration techniques, Proceedings of Quantitative infrared thermography QIRT 94 (Eurotherm Seminar 42), Elsevier, Paris, France, 1995, pp. 3-6.
Tables: Tables should be numbered consecutively and given suitable captions and each table should begin on a new page. No vertical rules should be used. Tables should not duplicate results presented elsewhere in the manuscript (for example, in graphs). Footnotes to tables should be typed below the table and should be referred to by superscript lowercase letters.
Figures: Figures should be numbered consecutively, the captions should be typed below the Figures.
Proofs: Authors will receive proof, which they are requested to correct and return as soon as possible.
Table of Contents
An Analytical Equation of State for Molten PolymersSeyyed Mostafa Hoseini
Effect of Ionic Strength on Deprotonation of Salicylic Acid and its DerivativeMohammad Faraji and Ali Farajtabar
Equilibrium Modeling and Kinetic Studies on the Adsorption of Basic Dye by a Low Cost AdsorbentZohreh Saadati and Anita Makvandy
Indirect Determination of Ascorbic Acid by Atomic Absorption SpectroscopyM. Emadi, M.A. Zare,O. Moradlou and M. Iranpour
Prediction of PVT Properties of Pure Refrigerants Using ISM Equation of StateZahra Sharafi
The DFT Study of Oxygen Adsorption on Pristine and As-Doped of the (4, 4) Armchair Models BNNTs M. Rezaei-Sameti and F.Khaje Joushaghani

Journal of Physical Chemistry and Electrochemistry
Journal homepage: http://journals.miau.ac.ir/jpe
Journal of Physical Chemistry and Electrochemistry Vol.2 No. 2(2014) 57-65
Islamic Azad University Marvdasht Branch
*Correspondig AuthorE-mail address: [email protected]
An Analytical Equation of State for Molten Polymers
Seyyed Mostafa Hoseini
Young Researchers and Elite Club, Marvdasht Branch, Islamic Azad University,Marvdasht, Iran
Abstract
An analytical equation of state (EOS) developed by Ihm-Song-Mason (ISM) has been applied to calculate some thermophysical properties of molten polymers including Poly (1-octene) (PO), Poly (vinyl methyl ether) (PVME), Poly (vinyl chloride) (PVC), and Poly (styrene) (PS). Three temperature-dependent parameters of the ISM EOS have been determined based on the alternative scaling constants, dispersive energy parameters between segments/monomers (ε) and segment diameter (σ). The ability of the proposed EOS has been checked by comparing the results with 547 literature data points for the specific volumes over temperature from 311-557 K and pressure ranging from 0.1 up to 200 MPa. The average absolute deviation (AAD) of the calculated specific volumes from literature data was found to be 0.47%. The isothermal compressibility coefficients, κT have also been predicted using ISM EOS. From 188 data points examined, the AAD of estimated κT was equal to 7.75%. Our calculations on the volumetric and thermodynamic properties of studied polymers reproduce the literature data with reasonably good accuracy.
Keywords: Equation of state, Molten Polymers, thermodynamic properties
1. Introduction
Knowledge of the thermophysical properties of polymers is a prerequisite for the design and optimization of their production plants. They are widely used for industrial and residential purposes. [1-5]. Therefore, accurate knowledge of thermophysical properties of polymeric materials is valuable as it is required to decide whether the use of these fluids could be extended from the laboratory level to large-scale industrial applications. Although some experimental data exist, prediction of thermophysical properties of polymers such
as density and isothermal compressibility is still an important task considering they have been in focus as materials offering many highly promising applications. Under this circumstance, the development of equation of state (EOS) methods for the prediction of volumetric and thermodynamic properties of molten polymers can be highly useful.
Several researchers have previously applied the analytical EOSs to describe volumetric properties of molten polymers. For example, Sabzi-Boushehri (S & B) [6] have utilized the original version of Ihm-Song-Mason (ISM) EOS [7] for 4 polymer melts by means of surface tension and the molar density, both at the freezing point for the determination

of ISM EOS parameters. Recently, Yousefi [8] has employed Tao-Mason (TM) EOS [9] for the estimation of volumetric properties of 8 molten polymers. She determined three temperature-dependent parameters of TM EOS by the help of temperature and liquid density (ρg) at the glass transition (Tg), as scaling constants. She has predicted 804 data points for the specific volumes with AAD equal to 0.34%. Yousefi et al. [10] have also applied the above mentioned scaling constants, i.e., temperature and density at glass transition point to ISM EOS for predicting the volumetric properties of 9 polymeric systems. They have predicted 1079 data points for the specific volumes with AAD equal to 0.40%. However, the need for surface tension and liquid density data both at freezing point and glass transition point, respectively, limits the applicability of the above-cited works because these values are not easily available for most polymers,.
In this study, we demonstrate that there is no need for freezing and glass transition data to evaluate three temperature-dependent parameters of ISM EOS. To other word, these parameters will be determined based on the alternative (molecular) scaling constants contrary to the preceding works of Yousefi et al. [8,10], where the required scaling constants were taken from the bulk properties, e.g., liquid density at glass transition point.
Moreover, another distinctive feature of this work is applying the fixed free parameters, λ to ISM EOS [7]. This significance making it possible to reduce the number of input constants to be used in the EOS with respect to the previous works of Yousefi et al. [8,10], in which further inputs are required for each polymer by considering the temperature dependence of λ.
In this paper, the performance of the ISM based on the proposed molecular scaling constants has also been checked by predicting the estimation of isothermal compressibility
coefficient of molten polymers with reasonably good AAD which indicates the superiority of proposed method against the previous works of Yousefi et al [8,10] (i.e., AADs of the estimated κT were found to be more than 30%).
2. Theory
The general frame of the ISM EOS [7] can be summarized as:
ρλρα
ρλρα
ρ )(1)(
)(22.01))()((1 2
B TbT
TbTTB
TkP
−+
+−
+=
where P is the pressure, ρ is the molar (number) density, B2(T) is the second virial coefficient, α(T) is the contribution of repulsive branch of pair potential function according to Weeks-Chandler-Anderson approach in perturbation theory of liquids [11]. This is based on the recognition that the structure of a liquid is determined primarily by repulsive forces, so that fluids of hard bodies can serve as useful reference states b(T) reflects the van der Waals co-volume, kBT is the thermal energy per segment. λ is a free parameter which can be varied to get the desired volumetric data of dense fluids at the singular point.
The ISM equation of state requires the usage of the second virial coefficient, B2(T), along with the parameters α(T) and b(T). For central force fields, the second virial coefficient is related to the intermolecular potential energy u(r) through the following equation:
Where NA is the Avogadro’s number. If a two-parameter potential energy
function u(r) can describe the nature of the interaction potential between particles of a fluid, the potential can be written in
(1)
(2)∫∞ −−=
0
/)(2 )1(2)( 2 rdreNTB Tkru
Aπ
58 S.M. Hoseini / Journal of Physical Chemistry and Electrochemistry Vol.2 No.2 (2014) 57-65

dimensionless form by:
)(σerFu
=
where ε is a characteristic energy parameter and σ is a characteristic size parameter, and F is a universal function of the reduced intermolecular separation
This function, B2(T) can be determined either by a direct correlation of experimental data for the second virial coefficient or by specification of the universal potential function u/ε and integration. In this work, we have taken ε as the energy parameters and σ as the size parameter in the potential energy relation as molecular scaling constants. Because, it was empirically found that σ3 and ε/kB both are closely proportional to the reciprocal density and to the inter-molecular energy changes during the phase transitions, respectively.
In this section the temperature-dependant parameters B2(T). α(T) and b(T) of Eq. (1) are to be evaluated. We have used the alternative scaling constants; i. e., dispersive energy parameter (ε) and segment size (σ) to express B2(T). α(T) and b(T) in terms of the universal functions of reduced temperature (Tr= kBT/ε) as the following equations:
)()/()( B2
32 eσ TkFNTB A =
)()/()( B3
eσα αTkFNT A =
and
)()/()( B3
eσ TkFNTb bA =
It should be mentioned that the above mentioned temperature-dependent parameters, B2(T). α(T) and b(T) reflect a measure of pairwise interactions.
3. Results and discussion
3.1. PVT propertiesTo utilize the proposed EOS two pure-
component parameters of molten polymers must be characterized. Table 1 has been presented to provide the required pure-component parameters (σ, ε/kB) for studied systems as well as their monomer molecular weight and glass transition temperature, Tg.
At first, we examined the accuracy of ISM EOS for the prediction of the specific volume of studied molten polymers. For this purpose, the specific data of 4 molten polymers have been taken, for which their measured values were available in the literature [15]. The results for 4 studied polymers were reported in Tables 2-5 as the relative deviations (RD in %) of the predicted specific volumes from the literature data [15]. To show the accuracy of the present work, the maximum deviations (in %) of the predicted specific volumes have also been indicated by bold faces in Tables 2-5.
(4)
(6)
(5)
Table 1. Optimized pure-component parameters of the ISM EOS for studied molten polymersPolymer MMWa
(g/mol) ε/kB (K) σ (nm) λ Tg b(k)
PO 112 461.05 0.6135 0.5148 338PVME 58.00 440.19 0.38299 0.8908 239PVC 62.50 422.16 0.36499 0.8158 358PS 104.0 517.86 0.50799 0.6898 373
a MMW is the monomer molecular weight.b these values were taken from Refs. 12-14.
(3)
S.M. Hoseini / Journal of Physical Chemistry and Electrochemistry Vol.2 No.2 (2014) 57-65 59

Table 2. Relative deviation (in %)a of the predicted specific volumes of PS using the proposed EOS at several isotherms, compared with the literature data [15]P/ MPa 391.45 K 413.75 K 435.55 K 455.75 K 478.55 K 501.05 K 534.95 K 556.25 K 557.25K
0.1 -1.88 -1.73 -1.51 -1.16 -0.62 0.05 1.32 2.26b 1.3810 -1.66 -1.54 -1.34 -1.05 -0.60 -0.03 1.02 1.76 0.9420 -1.45 -1.36 -1.19 -0.95 -0.55 -0.06 0.80 1.41 0.6530 -1.25 -1.18 -1.06 -0.85 -0.52 -0.11 0.61 1.10 0.3940 -1.06 -1.01 -0.92 -0.76 -0.48 -0.13 0.47 0.88 0.2050 -0.89 -0.85 -0.80 -0.67 -0.44 -0.15 0.34 0.68 0.0260 -0.75 -0.71 -0.67 -0.58 -0.39 -0.14 0.26 0.54 -0.0970 -0.62 -0.57 -0.56 -0.50 -0.35 -0.15 0.19 0.42 -0.1980 -0.52 -0.43 -0.45 -0.41 -0.29 -0.14 0.13 0.31 -0.2890 -0.41 -0.29 -0.33 -0.33 -0.25 -0.11 0.09 0.24 -0.34100 -0.32 -0.17 -0.23 -0.24 -0.19 -0.09 0.06 0.18 -0.39110 -0.24 -0.04 -0.12 -0.16 -0.14 -0.07 0.05 0.12 -0.42120 -0.15 0.07 -0.02 -0.08 -0.08 -0.04 0.02 0.08 -0.45130 -0.07 0.17 0.08 0.00 -0.02 0.00 0.03 0.06 -0.51140 0.01 0.27 0.19 0.09 0.03 0.03 0.03 0.03 -0.48150 0.08 0.35 0.29 0.17 0.10 0.07 0.04 0.02 -0.47160 0.15 0.44 0.38 0.25 0.17 0.12 0.06 0.02 -0.46170 0.23 0.52 0.48 0.34 0.24 0.17 0.09 0.03 -0.45180 0.30 0.59 0.58 0.42 0.31 0.23 0.11 0.04 -0.43190 0.37 0.67 0.68 0.52 0.38 0.28 0.14 0.07 -0.40200 0.44 0.73 0.77 0.59 0.45 0.35 0.19 0.09 -0.38
Table 3. Relative deviation (in %)a of the predicted specific volumes of PVME using the proposed EOS at several isotherms, compared with the literature data [15].
P/ MPa 311.5K 340.3K 353.5K 374.5K 394.5K 415.5K0.1 -1.93b -1.87 -1.60 -1.01 -0.39 0.415 -1.80 -1.73 -1.48 -0.90 -0.32 0.43
10 -1.67 -1.59 -1.35 -0.80 -0.25 0.4420 -1.42 -1.35 -1.12 -0.60 -0.13 0.5030 -1.18 -1.10 -0.92 -0.44 -0.02 0.5140 -0.95 -0.89 -0.73 -0.27 0.11 0.5850 -0.72 -0.67 -0.54 -0.12 0.22 0.6360 -0.51 -0.48 -0.37 0.02 0.32 0.6670 -0.31 -0.29 -0.20 0.16 0.41 0.7280 -0.10 -0.12 -0.05 0.29 0.51 0.7790 0.07 0.05 0.10 0.41 0.60 0.81100 0.25 0.21 0.24 0.53 0.70 0.86110 0.42 0.37 0.37 0.64 0.77 0.91120 0.58 0.52 0.49 0.75 0.86 0.96
100. .
..a
−= Exp
ExpCalc
VVVDR
b Bold face is the maximum %RD in the predicted specific volumes.
60 S.M. Hoseini / Journal of Physical Chemistry and Electrochemistry Vol.2 No.2 (2014) 57-65

Table 4. Relative deviation (in %)a of the predicted specific volumes of PVC using the proposed EOS at several isotherms, compared with the literature data [15].
P/MPa 373.15K 383.25K 393.25K 403.25K 413.25K 423.15K0 -0.18 -0.04 0.15 0.41 0.74 1.14b
10 -0.20 -0.08 0.08 0.31 0.58 0.8420 -0.20 -0.11 0.03 0.22 0.46 0.7530 -0.20 -0.13 -0.02 0.15 0.36 0.6140 -0.21 -0.14 -0.04 0.10 0.27 0.4950 -0.15 -0.06 0.05 0.21 0.3860 -0.15 -0.08 0.02 0.15 0.3170 -0.15 -0.09 -0.01 0.12 0.24
80 -0.15 -0.10 -0.03 0.06 0.1990 -0.11 -0.04 0.05 0.14
100 -0.11 -0.05 0.02 0.29110 -0.10 -0.06 0.01 0.08120 -0.10 -0.07 -0.01 0.06
130 -0.06 -0.02 0.04
140 -0.05 -0.03 0.03
150 -0.04 -0.02 0.02160 -0.05 -0.02 0.02
170 -0.03 -0.02 0.01180 -0.01 0.02190 0.01 0.02200 0.01 0.02
Table 5. Relative deviation (in %)a of the predicted specific volumes of PO using the proposed EOS at several isotherms, compared with the literature data [15]
P/ MPa 455.9K 465.85K 476.1K 485.95K 496.2K 505.75K 516.5K 526.15K 536.75K0.1 -1.19 -0.89 -0.49 -0.20 0.27 0.71 1.25 1.75 2.4110 -1.00 -0.75 -0.44 -0.18 0.19 0.49 0.92 1.29 1.7820 -0.81 -0.62 -0.35 -0.11 0.14 0.36 0.72 1.01 1.3830 -0.69 -0.53 -0.32 -0.12 0.09 0.27 0.49 0.72 1.0240 -0.57 -0.47 -0.29 -0.13 0.04 0.16 0.37 0.51 0.7550 -0.46 -0.39 -0.26 -0.16 -0.01 0.08 0.24 0.37 0.5260 -0.36 -0.31 -0.22 -0.15 -0.03 0.03 0.14 0.23 0.3670 -0.25 -0.23 -0.17 -0.15 -0.06 -0.02 0.06 0.12 0.2180 -0.15 -0.16 -0.12 -0.12 -0.06 -0.07 0.01 0.04 0.1090 -0.07 -0.09 -0.07 -0.10 -0.07 -0.08 -0.05 -0.03 0.01100 0.03 -0.01 -0.01 -0.06 -0.04 -0.09 -0.07 -0.07 -0.05110 0.14 0.06 0.04 -0.02 -0.02 -0.09 -0.08 -0.11 -0.11120 0.25 0.15 0.11 0.02 0.01 -0.07 -0.07 -0.12 -0.13130 0.34 0.24 0.19 0.09 0.04 -0.04 -0.06 -0.11 -0.15140 0.44 0.34 0.26 0.15 0.10 -0.01 -0.04 -0.11 -0.16150 0.56 0.42 0.35 0.22 0.15 0.03 -0.02 -0.10 -0.15160 0.66 0.53 0.45 0.29 0.20 0.07 0.03 -0.07 -0.13170 0.76 0.64 0.53 0.36 0.26 0.12 0.06 -0.04 -0.10
180 0.87 0.73 0.61 0.45 0.33 0.17 0.11 0.00 -0.08
190 0.98 0.84 0.71 0.53 0.40 0.24 0.15 0.04 -0.04200 1.07 0.94 0.79 0.62 0.47 0.30 0.22 0.09 -0.01
S.M. Hoseini / Journal of Physical Chemistry and Electrochemistry Vol.2 No.2 (2014) 57-65 61

Generally, our calculation results over the whole pressure/temperature range were summarized as average absolute deviation percent (AAD in %) from literature data [15] in Table 6. As indicated by Table 6, from 547 data points examined for studied polymers in wide pressure range between 0.1 - 200 MPa and the temperature range from 311 to 557 K, AAD was found to be 0.47%. It should be mentioned that, the range of deviations in the current prediction was of the order of ±2.86%.
Table 6 also compares our prediction results with those obtained from the preceding work of S & B [6] and Yousefi et al. [10], which employed ISM and TM EOSs, respectively, to predict specific volumes of molten polymers based on the scaling constants raised by the bulk properties contrary to the present work,
in which the alternative correlation equations based on the molecular scaling constants were presented. As Table 6 shows, our prediction results are almost as accurate as the previous works [6,10].
In order to illustrate how the ISM EOS passes through the experimental points, Figure 1 has been presented. It indicates the specific volume of PVC versus pressure at several isotherms. The markers represent the literature data [15] and the solid lines are those estimated from Eq. (1). As it is obvious from Figure 1, the agreement of the predicted values and literature data is quite good. The maximum RD is not more than 1.14%.
Moreover, it has been found that the predicted specific volumes have been affected by pressure, systematically, as it’s impressed
Table 6. Average absolute deviation (AAD in %) of the predicted specific volumes of the molten polymers studied in this work, using the proposed EOS, compared with results from ISM and TM, all were compared with the literature data [15].Polymer ΔP (MPa) ΔT (K) NP a this work ISM [6] TM [8]PVME 0.1-120 311-415 84 0.88 0.30 0.26PVC 0-200 373-423 85 0.15 0.14 0.21PS 0.1-200 391-557 189 0.62 0.51 0.54PO 0.1-200 456-536.7 189 0.31Overall 547 0.47 0.42 0.40
a NP represents the number of data points examined
∑=
−=P N
1iExp. i,Exp.i,Cal.i,
b ||100/NPAAD VVV
Fig. 1:The specific volume (V in cm3 g-1) of PVC versus pressure at several isotherms. The markers represent the experimental data [15] and the solid lines are those estimated from ISM EOS; 393.25 K (◊), 403.25 K (Δ), 413.25 K (○), and 423.25 K (□).
62 S.M. Hoseini / Journal of Physical Chemistry and Electrochemistry Vol.2 No.2 (2014) 57-65

from Tables 2-5. Since, the ISM EOS has been parameterized by some PVT data at moderate pressures; the high deviations have been appeared in the current predictions at low and high pressures accordingly.
3.2. First derivative thermodynamic properties
In this section, the relevant thermodynamic properties of molten polymer to the first derivation of ISM EOS were also predicted. Typically, the isothermal compressibility coefficient, κT is calculated using the isothermal pressure derivative of density/specific volume according to following equation:
TT
S
ST PP
VV
∂∂
=
∂∂
−=
ρρ
κ 11
We compared the calculated κT of PO us-ing ISM EOS with those obtained from Tait equation [16]. The results were reported in Table 7 as the relative deviations (RD in %) of the predicted κT using ISM EOS from those derived by the Tait equation [16]. From 188 data points examined, the AAD of estimated κT was equal to 7.75%. According to Table 7, the maximum value of relative deviations (RD) for isothermal compressibility coefficients was found to be 24.38%. Generally, the reason
(7)
Table 7. Relative deviation (in %)a of the predicted isothermal compressibility coefficients (κT) of PO using the proposed EOS at several isotherms, compared with the those obtained from the Tait equation [16].
P/ MPa 455.9K 465.85K 476.1K 485.95K 496K 505.7K 516K 526K 536.7K
0.1 -10.35 -6.25 -1.97 2.18 6.54 10.65 15.33 19.60 24.38
10 -10.00 -6.11 -2.11 1.73 5.70 9.36 13.46 17.12 21.11
20 -9.92 -6.23 -2.46 1.12 4.78 8.14 11.85 15.10 18.61
30 -10.04 -6.52 -2.95 0.41 3.84 6.95 10.36 13.34 16.51
40 -10.30 -6.94 -3.54 -0.36 2.87 5.79 8.97 11.73 14.65
50 -10.66 -7.43 -4.19 -1.17 1.89 4.64 7.64 10.22 12.96
60 -11.08 -7.99 -4.89 -2.00 0.91 3.52 6.36 8.80 11.37
70 -11.56 -8.58 -5.61 -2.84 -0.06 2.43 5.12 7.44 9.88
80 -12.08 -9.21 -6.34 -3.69 -1.03 1.36 3.93 6.14 8.47
90 -12.62 -9.85 -7.09 -4.53 -1.98 0.31 2.78 4.89 7.12
100 -13.18 -10.50 -7.84 -5.37 -2.91 -0.71 1.66 3.69 5.82
110 -13.75 -11.16 -8.58 -6.20 -3.83 -1.71 0.57 2.53 4.58
120 -14.33 -11.82 -9.32 -7.02 -4.73 -2.68 -0.48 1.41 3.39
130 -14.91 -12.47 -10.06 -7.83 -5.61 -3.63 -1.50 0.33 2.24
140 -15.49 -13.13 -10.78 -8.62 -6.47 -4.55 -2.49 -0.72 1.13
150 -16.08 -13.78 -11.50 -9.40 -7.31 -5.45 -3.45 -1.74 0.05
160 -16.66 -14.42 -12.20 -10.17 -8.13 -6.33 -4.38 -2.72 -0.99
170 -17.23 -15.05 -12.90 -10.91 -8.94 -7.18 -5.29 -3.68 -1.99
180 -17.80 -15.68 -13.58 -11.65 -9.73 -8.01 -6.18 -4.61 -2.96190 -18.37 -16.30 -14.25 -12.37 -10.49 -8.83 -7.04 -5.51 -3.91200 -18.92 -16.90 -14.91 -13.07 -11.24 -9.62 -7.87 -6.39 -4.83
100. .
a
−= Tait
T
TaitT
CalcTDRκ
κκ
b Bold face is the maximum %RD in the predicted κT.
S.M. Hoseini / Journal of Physical Chemistry and Electrochemistry Vol.2 No.2 (2014) 57-65 63

for such high deviations is that κT is nearly related to isothermal EOS derivation against density/volume which resulted serious chang-es in the original frame of ISM EOS, by which the PVT data were predicted well. So, the largedeviations related to the prediction of first derivative properties would be expectable.
Figure 2 depicts κT (in GPa-1 units)
versus pressure for PO at several isotherms graphically. The solid lines are our predictions and the markers represent those obtained from the Tait equation [16].
Fig.2: κT (in GPa-1 units) versus pressure for PO at several isotherms. The solid lines are our predictions and the markers represent those obtained from the Tait equation [13]. 456 K (◊), 486 K (Δ), and 526 K (○).
4. Conclusion
Finally, an analytical EOS has been employed to predict the volumetric and thermodynamic data of molten polymers. Knowing only two molecular scaling constants, ε/kB and σ, is sufficient to determine the temperature-dependent parameters of the ISM EOS. Our calculations on the volumetric and thermodynamic properties of studied polymers reproduce the literature data over the whole liquid range with reasonably good accuracy.
Acknowledgment
We thank the Young Researchers and Elite Club, Marvdasht Branch for their financial
supports.
Nomenclature and unitsList of symbolsAAD average absolute deviation (%)kB Boltzmann’s constant (J K-1)NP number of data pointsP pressure (Pa)T Absolute temperature (K)V Specific molar volume (m3 mol-1)MMW monomer molecular weight (g. mol-1)R Universal gas constant (J mol-1. K-1)B2 second virial coefficient/(m3)b co-volume/ (m3)α repulsive contribution to pair potential function/(m3)NA Avogadro’s number
Greek lettersρ molar density (mol m-3)σ segment diameter (nm)ε dispersive energy parameter (J)λ free parameter
SuperscriptsCalc Calculated valuesExp Experimental value
References
[1] G. Odian, Principles of polymerization, Wiley, New York (1991).
[2] F. F. Mark, N. Bikales, C. G. Overberger, G. Menges, J. I. Kroschwitz, Encyclopedia of polymer science and engineering. Wiley, New York (1986).
[3] S. Parveen, S. K. Sahoo, Clin. Pharmacokinet., 45 (2006) 965-988.
[4] K. Osada, K. Kataoka, Ad. Polym. Sci., 202 (2006) 113-153.
[5] O. Annunziata, N. Asherie, A. Lomakin, J. Pande, O. Ogun, G. B. Benedek. Proc. Natl. Acad. Sci. U.S.A., 99 (2002) 14165-14170.
[6] Sabzi F., and Boushehri A, Eur. Polym. J., 40 (2004) 1105-1110.
[7] Ihm G., Song Y and Mason E. A. J. Chem. Phys, 94 (1991) 3839-3848.
[8] F. Yousefi, High Temp-High Press, 42 (2013) 211-226.
[9] F. M. Tao, E. A. Mason, J. Chem. Physics 100 (1994) 9075-9084.
[10] F. Yousefi, H. Karimi, R. Ghafarian-Shirazi., M. Gomar, High Temp-High Press, 42 (2013) 451-567.
64 S.M. Hoseini / Journal of Physical Chemistry and Electrochemistry Vol.2 No.2 (2014) 57-65

[11] J. D. Weeks, D. Chandler, H. C. Anderson, J. Chem. Phys. 54 (1971) 5237-5247.
[12] J.E. Mark Polymer Data Handbook, second Ed., Oxford University Press: New York, (1999)
[13] J.E. Mark, Physical Properties of Polymers Handbook, second Ed., Springer, New York, (2007).
[14] S.M. Allen, E.L. Thomas. The Structure of Materials. New York, NY: J. Wiley & Sons, (1999).
[15] C. Wohlfarth, CRC Handbook of Thermodynamic Data of Polymer Solutions at Elevated Pressures, Taylor & Francis, New York, (2005).
[16] J. H. Dymond, R. Malhotra, Int. J. Thermophys., 9 (1988) 941–951.
S.M. Hoseini / Journal of Physical Chemistry and Electrochemistry Vol.2 No.2 (2014) 57-65 65


Journal of Physical Chemistry and Electrochemistry
Journal homepage: http://journals.miau.ac.ir/jpe
Journal of Physical Chemistry and Electrochemistry Vol.2 No. 2(2014) 67-73
Islamic Azad University Marvdasht Branch
*Correspondig AuthorE-mail address: [email protected]
1.Introduction
The acid dissociation or protonation constant, pKa, plays an important role in physicochemical behavior of compounds in reaction media. It controls the extent of ionization of the molecules relative to the pH of solution. The determination of pKa is essential in many different area such as chemistry, geology, biochemistry and medicine. For example, many of drugs have one or more acidic or basic functions in their structure which affect the membrane permeability and
solubility of those drugs[1]. In biochemistry, the protein stability and the activity of enzymes are closely related to protonation state of amino acid side chains [2]. In coordination chemistry, the extent of formation of complex is a function of protonation constant of ligands and pH of solution[3-7].
The equilibrium constants, such as protonation equilibrium, are usually determined in constant ionic strength by addition of an excess inert supporting electrolyte to solution to keep activity coefficient of all species constant during measurement process implementation. The equilibrium constants determined in this condition are named as the stoichiometric or conditional equilibrium
Effect of Ionic Strength on Deprotonation of Salicylic Acid and its Derivative
Mohammad Farajia,*and Ali Farajtabar b
aDepartment of Chemistry, Babol Branch, Islamic Azad University, Babol, IranbDepartment of Chemistry, Jouybar Branch, Islamic Azad University, Jouybar, Iran
Abstract
The protonation constant values of salicylic and 5-nitrosalicylic acid werestudied by a combination of spectrophotometric and potentiometric methods at 25 °C in wide range of ionic strength. The ionic strength of solutions was kept constant by sodium perchlorate as background electrolyte at 0.10 to 3.0 mol dm-3. Potentiometer was calibrated according to Gran method at each of ionic strength. The pKa values were calculated using STAR program by multivariate curve fitting of absorbance data. The dependence of deprotonation constants on ionic strength were explained by means of Specific ion Interaction Theory (SIT). Activity coefficients of species were calculated by a modified SIT approach. The specific ion interaction parameters were extracted associated with the thermodynamic protonation constant.
Keywords: pKa, Salicylic Acid, Ionic Strength,Specific ion Interaction Theory

constant. The knowledge of the activity coefficient of the species is needed to compare and predictconditional equilibrium constant in different ionic strength. A quantitative estimation of activity coefficient as a function of ionic strength in a broad range of electrolyte concentration can be provided by the Specific Ion Interaction Theory (SIT) [8]. This model has been successfully used in various studies for description of ionic strength effect on equilibrium constants and for determination of thermodynamics equilibrium constant by extrapolation to infinite dilution in which activity coefficient of species are unity[8-10].
Salicylic acid and some of its derivatives occur naturally in many fruits, plants and vegetables. They are the basic ingredient of a class of non-steroidal anti-inflammatory drugs with anti-pyretic, analgesic and anti-inflammatory effects [11]. The protonation constants of salicylic and 5-nitrosalicylic acid have been determined by some groups in different conditions and by a variety of methods [12-18]. However, to best of our knowledge, no systematic investigation has been done on ionic strength dependence of their protonation constants. In this study the protonation constants of salicylic and 5-nitrosalicylic acid have been determined in wide range of NaClO4 electrolyte concentration. The dependence of protonation constants on ionic strength was studied by the SIT model. The thermodynamics protonation constants were calculated in infinite dilution together with the SIT interaction parameters.
2.Material and Methods
Salicylic acid and its 5-nitro derivativewere supplied from Sigma-Aldrich. Sodium perchlorate as analytical reagent grade and titrasol solutions of NaOH and HCl were obtained of Merck.Water was double-distilled with conductivity of 1.3 ± 0.1 mW-1 cm-1.
A Jenway potentiometer, model 3520,
was used for potentiometric measurements. The emf of titration cell was measured by a combined glass electrode. A UV-Vis Shimadzu spectral photometer, model 2100, was used for spectrophotometric measurements. A double-walled reaction vessel was used as measurement cell with temperature thermostatedat 25 °C. Constant ionic strengths of 0.1, 0.5, 1.0, 1.5, 2.0 and 3.0 mol dm-3 were maintained by concentrated solution of NaClO4. To avoid CO2 contamination, a stream of purified nitrogen gas was bubbled through the solution during titration process.
In order to obtain exact concentration of H+ during spectrophotometric titration, the potentiometric cell was calibrated according to Nernst’s equation at each constant ionic strength. Solution of HCl with exact concentration was titrated by standardized NaOH solution. The formal electrode potential, E°cell, and Nernst slope were computed in terms of known concentration of hydrogen ion for solutions at fixed ionic strength. For spectrophotometric titration, 25 mL of solution of salicylic and 5-nitrosalicylic acid was acidified to pH 2.0 and then titrated by stepwise addition of sodium hydroxide solution of 0.1 mol dm-3. After each electrode stabilization, the emf and absorption spectra of solution were recorded in the interval of 200-400 nm. Then absorption data as a function of sample concentration and pH were introduced to STAR program to calculate the pKa values [19].
3.Resultsand Discussion
Calibration of potentiometric cell in each ionic strength
Glass electrode responses to activity of hydrogen ion rather than its concentration. However, the value of hydrogen ion concentration is needed for calculation of concentration quotients such as protonation constant. Therefore, prior to each
68 M. Faraji & A. Farajtabar/ Journal of Physical Chemistry and Electrochemistry Vol.2 No.2 (2014) 67-73

spectrophotometric titration, potentiometric cell is needed to be calibrated in terms of H+ concentration [20]. The response of glass electrode theoretically follows the Nernst equation as [20-22].
Ecell = E°cell + klog [H+] + kloggg H+ + ELJ (1)
whereELJand kis the liquid junction potential and Nernst slope respectively. In theory,kis equal to 2.303RT/F with usual meaning for R,T and F.the formal electrode potential and the activity coefficient of hydrogen ion are represented by E°celland gH+ respectively. In constant ionic strength, parameters of ELJ and gH+ are approximately constant and can be safely introduced into ka. Therefore, equation 1 reduces to equation 2.
Ecell =ka + klog [H+] (2)
where kais equal to E°cell + kloggH+ + ELJ. The exact concentration of hydrogen ion is given by
[H+] = (MHClV0 – MNaOHV1) / (V0 + V1) (3)
whereMirepresents the molarities of i, V0 and V1denote the initial volume of acid and the added volume of base solution, respectively. Calibration parameters including kaand k were calculated from measured emf data using equations of 2 and 3. The experimental emf values are depicted as a function of negative logarithm of proton concentration in each ionic strength in figure 1.
In all experiments, the value of k were close to Nernst slop(theoretically equals to 59.167 mV at 25 °C) with correlation coefficients of approximately r2 = 0.99. By having calibration parameters, the negative logarithm of concentration of hydrogen ion, pcH,can be properly obtained by equation 4.
pcH = (ka – Ecell) / k (4)
Fig. 1. Experimental emf values versus pcH in ionic strength of 0.10 (+), 0.50 (ж), 1.00 (O), 1.50 (Δ), 2.00 (◊) and 3.00 (□) mol dm-3NaClO4
Calculation of protonation constants Spectral change of 5-nitrosalicylic acid is
shown typically at varying pcH values in figure 2. Protonation constants were calculated by spectral data analysis in STAR program [19].
Fig. 2. Spectral change of 5-nitrosalicylic acid with increasing pcHin ionic strength of 0.10 mol dm-3 NaClO4
For each spectrophotometric titration, recorded spectra were arranged into a matrix R with dimension of m´n. In matrix R, m is the number of spectra with different pcH, and n is
M. Faraji & A. Farajtabar/ Journal of Physical Chemistry and Electrochemistry Vol.2 No.2 (2014) 67-73 69

the number of wave length in each spectrum at which the absorbance is recorded. According to Beer’s law, matrix R can be represented by the matrix equation of 5
R = CS + E (5)
Where C(m´p), S(p´n) and E are matrix of pure concentration, pure spectral profiles and optimal residual error respectively. Here p donates the number of absorbing species in the solution. The number of absorbing species was determined from factor analysis[19]. Rank analysis was performed by introducing M as (1/n)RRt, where Rt is transpose of R. The rank of M, rM,is mathematically equal to the number of eigenvectors with corresponding none zero eigenvalues. However, because of experimental error, the number of absorbing species is equal or lower than rM.To this problem, in factor analysis, the standard deviation of the absorbance, SD, was calculated as a function of the number of none zero eigenvalues.
1tr( )
SD =
j
ii
M a
m j=
−
−
∑ (6)
Where tr(M) and ai are the trace and eigenvalue of component i of M matrix. Our results indicate that the spectral change observed during titration is attributed to two absorbing species, and therefore to the first deprotonation of compounds. By this knowledge, equation 5 was solved using hard modeling multivariate curve fitting. By initial estimation of protonation constant, fitting starts by calculation of the concentration profile of two absorbing species, matrix C, based on the mass action law constraintin terms ofknown total concentration and pcH values during titration. At the same time, matrix S is solved under non-negative absorptivity
constraint for two absorbing species. In the nonlinear least-squares fitting, iterative cycles go on until to find the best set of parameters (protonation constant and molar absorptivities of species) that result in a minimum of E. Typically optimized concentration profile and pure spectra for two absorbing species of 5-nitrosalicylic acid is shown in figure 3.
Fig. 3. a) Pure spectra and b) Optimized concentration profile for 5-nitro
salicylic acid in ionic strength of 0.10 mol dm-3 NaClO4
70 M. Faraji & A. Farajtabar/ Journal of Physical Chemistry and Electrochemistry Vol.2 No.2 (2014) 67-73

The protonation constants determined by STAR program in different ionic strength are listed in Table 1 together with literature values. A disagreement between the values, obtained at the same ionic strength, may be attributed to the difference in experimental conditions involving the type of ionic media and the instrumental techniques.
Results indicate that the pKa value of 5-nitro is lower than salicylic acid. It may be due to electron withdrawing effect of nitro group which makes deprotonated species more stable. Upon first deprotonation, molecules of salicylic acid and 5-nitorsalicylic acid take negative charge on their carboxylic group. However, the presence of electron withdrawing group of nitro on the structure of 5-nitor, results in inductive effect which stabilizes negative carboxylic group more effective than salicylic acid.
Ionic Strength Effect As shown in Table 1, at first, the pKa
values of salicylic acid and 5-nitrosalicylic acid decreases with increasing ionic strength to 0.5 mol dm-3 and then increases with further increasing of ionic strength. This behavior is attributed to change of activity coefficient
of species with increasing of ionic strength. Activity coefficient of species are influenced by the type of interactions between ions. At low ionic strength, interactions between ions are of attractive type; resulting in activity coefficient lower than unity. However, as the ionic strength increases, the ionic atmosphere becomes more compressed and screens the ionic charges more effectively, so repulsive interactions become more important; resulting in activity coefficient higher than unity.
The deprotonation equilibrium of two hydroxybenzoic acids can be represented by equation 7.
H2 H+ + HA-
According to equation 7, the deprotonation constant can be given by
+ +
2 2
+H HA H HA
2 H A H A
[H ][HA ][H A]
Ta aK K
g g g gg g
− −−
= =
Where gi is activity coefficient of species i;
represent thermodynamic deprotonation constant, and Ka stands for stoichiometric constant determined at each ionic strength. By
(8)
(7)
I pKa,Salicylic Acid pKa,5-nitrosalicylic Acid Reference
mol dm-3 mol kg-1 mol dm-3 mol kg-1 mol dm-3 mol kg-1
0.10 0.10 2.92 ± 0.01 2.91 2.02 ± 0.01 2.02 This work0.50 0.51 2.72 ± 0.02 2.71 1.90 ± 0.01 1.89 -1.00 1.05 2.83 ± 0.01 2.81 1.86 ± 0.02 1.84 -1.50 1.62 2.84 ± 0.01 2.81 1.99 ± 0.01 1.96 -2.00 2.21 3.01 ± 0.01 2.97 2.17 ± 0.01 2.13 -3.00 3.50 3.18 ± 0.03 3.12 2.39 ± 0.02 2.32 -0.20 - 2.75 - - - [12]0.10 - 2.90 - - - [13]
0 - 2.97 - - - [14]0 - 3.02 - - - [15]
0.10 - 2.81 - 2.20 - [16]0.10 - 2.77 - 1.92 - [17]
0.10 - 2.83 - - - [18]
Table 1. Protonation constants of salicylic acid and 5-nitrosalicylic acid at 25 °C and in different ionic strength of NaClO4
M. Faraji & A. Farajtabar/ Journal of Physical Chemistry and Electrochemistry Vol.2 No.2 (2014) 67-73 71

taking negative logarithm on equation 8
2H AH HAp p log log logT
a aK K g g g+ −= + + −
The dependence of pKa values on ionic strength may be analyzed by considering well known Specific ion Interaction Theory (SIT) [8-10]. In original SIT model, activity coefficient of ion i with charge zi can be expressed by equation 10 in the solution of ionic strength I (in molal scale) at 25 °C.
2 0.51log m1 1.5i i ij j
j
IzI
g e= − ++
∑
The ion interaction coefficient eij, usually called SIT parameter, interprets the specific short range interactions of ion i with ion j in its molal concentration mj. SIT model assumes that interaction coefficient is zero for two electrically like sign ions or neutral species.
By considering the SIT model for calculation of activity coefficients of species, equation 8 can be reformulated as following
* 0.51p p1
Ta a
IK K z II
e= − + ∆+
Where
* 2 2products reactants(charges) (charges)z = −∑ ∑
4HL ,Na H ,ClOe e e− + + −∆ = + (13)
It should be noted that pKa and I values are in molal concentration scale.
Experimental pKavalues form Table 1 were fitted into equation 11 as a function of ionic strength by least squares regression analysis. The following expressions were obtained in accordance with SIT model where equations 14 and 15 are obtainedfor salicylic acid and 5-nitrosalicylic acid respectively.
(9)0.51p (3.04 0.04) 2 (0.16 0.02)1a
IK II
= ± − + ±+
0.51p (2.14 0.04) 2 (0.19 0.02)1a
IK II
= ± − + ±+
The goodness of fit of SIT model was judged by excellent square correlation coefficients (r2 is 0.936 and 0.939 for equation 14 and 15 respectively), associated with low values of standard deviation obtained for each of regression coefficients. The specific interaction coefficient of HClO4 is 0.146 [23], therefore according to equation 13, the specific interaction coefficient between HA-
and Na+ are calculated to be 0.014 and 0.044 for salicylic acid and 5-nitrosalicylic acid respectively.
4.Conclusion
The protonation constant of salicylic acid and 5-nitrosalicylic acid were investigated by an accurate spectroscopic method in wide range of ionic strength supplied by sodium perchlorate at 25 °C. The pKa values assigned for first deprotonation equilibrium were calculated by multivariate curve fitting implemented in STAR program. Results show that in a regular trend, at first the pKa decreases to a minimum value at around 0.5 mol kg-1 of ionic strength; then increases with a relatively linear manner along the curve. The SIT theory was applied successfully to describe the ionic strength dependency of pKa values. The thermodynamic deporotonation constant of salicylic acid and 5-nitrosalicylic acid were calculated as 3.04 and 2.14 respectively. Alsothe specific interaction coefficient between deprotonated form of salicylic acid and 5-nitrosalicylic acidwith Na+ are calculated as 0.014 and 0.044 respectively. The SIT models obtained can be used for estimation of protonation constants of salicylic acid and
(14)
(10)
(11)
(12)
72 M. Faraji & A. Farajtabar/ Journal of Physical Chemistry and Electrochemistry Vol.2 No.2 (2014) 67-73
(15)

5-nitrosalicylic acid in each ionic strength in the range of 0.0 to 3.0 mol dm-3of NaClO4.
Acknowledgement
The authors gratefully acknowledge the financial support form the Research Council of Islamic Azad University, Babol branch.
References
[1] H.V.D.Waterbeemd, B.Testa,. Drug bioavailability: estimation of solubility, permeability, absorption and bioavailability, Wiley-VCH: Weinheim, Germany, 2008.
[2] O. Holmes,.Human acid-base physiology: a student text, Chapman & Hall Medical, London, UK, 1993.
[3] A. E. Martell, R. M. Smith,Critical stability constants, Plenum, New York, USA, 1974.
4. S. K. Sahoo, B. K. Kanungo, M. Baral,Complexation of a tripodal amine-catechol ligand tris((2,3-dihydroxybenzylamino)ethyl)amine towards Al(III), Ga(III), and In(III), Monatsh Chem.140 (2009) 139-145.
[5] A. Farajtabar, F. Gharib, P. Jamaat, N. Safari,Complexation of 5,10,15,20-Tetrakis(4-sulfonatophenyl)porphyrin with Zinc(II) Ions in Aqueous Solution. J. Chem. Eng. Data 53 (2008) 350-354.
[6] F. Gharib, M. Jabbari, A. Farajtabar, Interaction of dioxouranium(VI) ion with EDTA at different ionic strengths, J. Mol. Liq. 144 (2009) 5-8.
[7] F. Gharib, A. Farajtabar,Complexation of Dioxovanadium(V) with Cysteine in Different Ionic Media: Salt Effects and Formation Constant, Rev.Inorg. Chem. 29 (2009) 37-48.
[8] B. Allard, S. A.Banwart, J. Bruno, J. H. Ephraim, R.Grauer, I.Grenthe, J.Hadermann, W. Hummel, A.Jakob, T.Karapiperis, A. V.Plyasunov, I.Puigdomenech, J. A.Rard, S.Saxena, K.Spahiu, Modelling in Aquatic Chemistry, OCDE,France, 1997.
[9] F. Gharib, A. Farajtabar, Interaction of dioxouranium(VI) ion with serine at different ionic strength,J. Mol. Liq. 135 (2007) 27-31.
[10] C. Bretti, F. Crea, C. De Stefano, C. Foti, S. Materazzi, G. Vianelli, Thermodynamic Properties of Dopamine in Aqueous Solution. Acid–Base Properties, Distribution, and Activity Coefficients
in NaCl Aqueous Solutions at Different Ionic Strengths and Temperatures, J. Chem. Eng. Data, 58 (2013) 2835-2847.
[11] R. K. Madan, J. Levitt, A review of toxicity from topical salicylic acid preparations, J. Am. Acad. Dermatol. 70 (2014) 788–92.
[12] M. Jezowska-Bojczuk, H. Kozłowski, A. Zubor, T. Kiss, M. Branca, G. Micera, A. Dessi, Potentiometric and Spectroscopic Studies on Oxovanadium(iv) Complexes of Salicylic Acid and Catechol and Some Derivatives, J. Chem. Soc., Dalton Trans. (1990) 2903-2907.
[13] G. Kortum, W. Vogel, K. Andrussow, Dissociation Constants of Organic Acids in Aqueous Solution, Butterworths (IUPAC), London, 1961.
[14] R.Ruiz, M. Roses, C. Rafols, E. Bosch, Critical validation of a new simpler approach to estimate aqueous pKa of drugs sparingly soluble in water, Anal. Chim. Acta 550 (2005) 210–221.
[15] Z. Jia, Physicochemical profiling by capillary electrophoresis. Curr. Pharm. Anal. 1 (2005) 41–56.
[16] A. E. Martell, R. J. Motekaitis, R. M. Smith, Aluminium complexes of hydroxyaliphatic and hydroxyaromatic ligands in aqueous systems—some problems and solutions, Polyhedron, 9 (1990) 171-187.
[17] M. S. AKSOY, U. OZER, Equilibrium Studies on Chromium(III) Complexes of Salicylic Acid andSalicylic Acid Derivatives in Aqueous Solution, Chem. Pharm. Bull. 52 (2004) 1280—1284.
[18] R. Tauler, I. Marques, E. Casassas, Multivariate curve resolution applied to three-way trilinear data: Study of a spectrofluorimetric acid–base titration of salicylic acid at three excitation wavelengths, J. Chemom. 12 (1998) 55-75.
[19] J. L. Beltran, R. Codony, M. D. Prat, Evaluation of stability constants from multi-wavelength absorbance data: program STAR, Anal. Chim. Acta 276 (1993) 441-454.
[20] R.J. Motekaitis, A.E. Martell, The Determination and Use of Stability Constants, VCH, New York, 1988.
[21] G. Gran, H. Dahlenborg, S. Laurell, M. Rottenberg, Determination of the Equivalent Point in Potentiometric Titrations, Acta Chem. Scand. 4 (1950) 559-577.
[22] G. Gran, Determination of the equivalence point in potentiometric titrations, Analyst 77 (1952) 661-671.
[23] C. Bretti, C. Foti, N. Porcino, S. Sammartano, SIT Parameters for 1:1 Electrolytes and Correlation with Pitzer Coefficients, J. Solution Chem. 35 (2006) 1401-1415.
M. Faraji & A. Farajtabar/ Journal of Physical Chemistry and Electrochemistry Vol.2 No.2 (2014) 67-73 73


Journal of Physical Chemistry and Electrochemistry
Journal homepage: http://journals.miau.ac.ir/jpe
Journal of Physical Chemistry and Electrochemistry Vol.2 No. 2(2014) 75-86
Islamic Azad University Marvdasht Branch
*Correspondig AuthorE-mail address: [email protected]
Equilibrium Modeling and Kinetic Studies on the Adsorption of Basic Dye by a Low Cost Adsorbent
Zohreh Saadatia, *, Anita Makvandya
aDepartment of Chemistry, Islamic Azad University, Omidiyeh Branch, Omidiyeh, Iran
Abstract
An agricultural waste and eco-friendly biosorbent i.e. rice husk has been used as a cheap adsorbent for the removal of methylene blue dye from aqueous solutions. The physical properties of the developed adsorbent were characterized using FTIR. The study was realized using batch experiments. The effects of contact time, pH, initial dye concentration, biosorbent dose and temperature were investigated. The adsorption data were evaluated by Freundlich and Langmuir isotherm models. The adsorption isotherm is best fitted by the Freundlich model, while the adsorption kinetics is well described by the pseudo-second-order model. Different thermodynamic parameters i.e., changes in standard free energy, enthalpy and entropy have also been evaluated and it has been found that the dye adsorption onto rice was a spontaneous, endothermic and physical reaction.
Keywords: Rice husk; Biosorption; Kinetic study; Isotherm; methylene blue; basic dye
1.Introduction
Color is a visible pollutant and the presence of even a very minute amount of coloring substance makes it undesirable due to its appearance. The removal of color from dye-bearing effluents is a major problem due to the difficulty in treating such waste waters by conventional treatment methods. The sorption technique is proved to be an effective and attractive process for the treatment of these dye-bearing wastewaters [1,2]. The mostwidely used and effective physical method in industry is activated carbon, although running
costs are expensive [3]. If the adsorbent material used is of cheaper cost and does not require any expensive additional pretreatment step, this method will become inexpensive. In recent years, some papers had reported several kinds of agricultural by-product such as rice husk [4-5],cereal chaff [6], giant duckweed [7], sawdust [8] for the removal of methylene blue from its aqueous solutions.
Physical and chemical methods such as biological oxidation, adsorption, foam flotation, electrolysis, coagulation-flocculation, ozonation, oxidation, filtration, membrane separation, photo catalysis and electrochemical methods have been used for waste water decolourisation [9-20].

The adsorption process is one of the most efficient methods of reactive, acidic and direct dyes in neutral solutions removing pollutants from wastewater and provides an attractive alternative treatment, especially if the biosorbent is inexpensive and readily available [21].
The abundance and availability of agricultural by-products make them good sources of cheap raw materials for natural adsorbents. Rice husk, an agricultural waste, has been reported as a good adsorbent for many metals and basic dyes [22-23]. Rice husk consists of 32.2% cellulose, 21.4% hemicelluloses and 21.3% lignin [24-25].The cellulose, hemicellulose and lignin form a very stable matrix structure. The inner surface of rice husk is smooth, and may contain wax and natural fats that provide good shelter for the grain. On the other hand, the presence of these impurities on the inner surface of rice husk also affects the adsorption properties of rice husk, both chemically and physically [26].Scanning Electron Microscope(SEM) of rice husk was showed the morphological features of outer epidermis raw rice husk, which is well organized in structure that resembles rolling hills [27].
In the purpose of this work, adsorption capacity of rice husk for the adsorption of methylene blue dye from aqueous solutions has been investigated and the obtained experimental data were analyzed using isotherm models namely, Langmuir and Freundlich. The effect of pH, adsorbent amount, contact time, biosorbent dose, temperature and initial dye concentration has been studied. Kineticexperiments have been also conducted to determine the rate of adsorption. Methylene blue is the most commonly used material for dying cotton, wood and silk. Methylene blue was chosen because of its known strong adsorption onto solids and it serve as a model compound for removing organic contaminants and colored bodies.
2. Materials and methods
All chemicals and reagents were of analytical grade. Basic dye used in this study was methylene blue (molecular formula: C16H18N3ClS, λmax= 665nm) purchased from Merck. The experimental solutions were obtained by diluting the stock solution in accurate proportions to different initial concentrations. The rice husk was obtained from a farm near Omidiyehcity, Khozestan state, Iran. Rice husk was washed several times with water followed by filtration. The cleaned ricehusk was oven dried completely at 70°C, then cooled and sieved to 50μm size, which was used without further treatment.
2.1. Batch adsorption studiesAdsorption experiments were carried out
by adding a fixed amount of rice husk to a series of Erlenmeyerflasks filled with 25mL diluted solutions. The Erlenmeyer flasks were shaken at 300 rpm for 6 hour at room temperature. After equilibration, 10 mL of the suspension was centrifuged in a stopped tube for10 min at 3000 rpm and 4 mL of the dye solution was taken from the tube by a filtered syringe for measurement. The color of dye concentrations were measured with a PerkinElmer Lambda 25 UV/Vis Spectrometer using maximum absorbance wave length values (λmax) for each dye. To determine the optimum conditions of the several parameters such as contact time, pH, initial dye concentration, biosorbent dose and temperature were studied for methylene blue dye. Using optimum conditions dye removal capacity, equilibrium values and kinetic studies were performed for methylene blue dye.
The amount of methylene blue adsorption at equilibrium,qe(mg/g) was calculated from the following equation[28]:
(1)
76 Z.Saadati & A. Makvandy/ Journal of Physical Chemistry and Electrochemistry Vol.2 No.2 (2014) 75-86

Where Coand Ce(mg/L) are the initial and equilibrium liquid phase concentration of dye solutions, respectively,V(L) the volume of the solution and W(g) is the mass of adsorbent. Decolourisation of dyes sorbed by rice husk was calculated using the following equation[28]:
3.Results and discussion
3.1. Characterization of the adsorbentFTIR spectroscopy was used for the
characterization of rice husk. The FTIR spectrum (Fig. 1) indicated a broad band at 3410.24 cm-1 representing the bonded -OH groups. The C-H stretching vibration around 2925.16 cm-1 indicates the presence of alkane functional group. The peaks around 1648.38-1740 cm-1 correspond to the C=O stretching that may be attributed to the hemicelluloses and lignin aromatic groups [29].The peaks around 1514.67 cm-1 indicate the presence of C=C stretching vibrations of alkenes and aromatic functional groups. The peaks around 1425.63 cm-1 indicate the presence of CH2
and CH3 groups [30]. A peak at 1376.64 cm-1 band may be attributed to the aromatic CH and carboxyl-carbonate structures. The peaks in the 1254.50-1300 cm-1correspond to vibration of C-O group in lactones.
The peaks around 1045.14, 578.92 and 465.93 cm-1, correspond to CHOH stretching, Si-O-Si stretching and Si-H groups, respectively. The presence of polar groups on the surface is likely to provide the considerable cation exchange capacity to the adsorbent [30].
3.2. Effect of different parameters3.2.1. Effect of pH
The pH was adjusted using 0.1 N NaOH and 0.1 N HCl solutions. The pH of the dye solution plays an important role in the whole biosorption process and especially on the biosorption capacity. FTIR spectrum showed that rice husk has –OH groups. So, it seems that the pH value can affect the adsorbent efficiency of rice husk. The effect of pH of the solution on the adsorption efficiency of rice husk has been shown in Fig. 2. It can be seen from the figure that as the solution pH increases, the adsorption capacity increases.
Fig.1. FTIR spectra of Rice husk.
(2)
Z.Saadati & A. Makvandy/ Journal of Physical Chemistry and Electrochemistry Vol.2 No.2 (2014) 75-86 77

Increasing solution pH increases the number of hydroxyl groups thus, increases the number of negatively charge sites and enlarges the attraction between dye and adsorbent surface [31]. Generally, the net positive charge decreases with increasing pH value lead in the decrease in the repulsion between the adsorbent surface and the dye thus, improving the adsorption capacity.
pH
0 2 4 6 8 10 12 14
Dye
Rem
oval
%
60
65
70
75
80
Fig. 2. Effect of pH on the removal of methylene blue by rice husk (Contact time 6 h, biosorbent dose 0.1 g, initial concentration of dye 12 mg/L and 30°C).
Biosorbent dose (g)
0.00 0.05 0.10 0.15 0.20 0.25
Dye
Rem
oval
%
70
75
80
85
90
Fig. 3. Effect of biosorbent dose on the removal of methylene blue by rice husk (Contact time 6 h, pH 11, initial concentration of dye 12 mg/L and 30°C).
3.2.2. Effect of biosorbent doseIn order to evaluate the maximum
biosorptioncapacity of the rice husk, the effect of biosorbentdose was investigated. The dose of respective biosorbent was varied from 0.01to 0.2 g at a fixed pH, temperature and adsorbate concentration. After 0.1 g of the adsorbent, there was no change in the adsorption efficiency. So, 0.1 g of the adsorbent was chosen as an optimum amount. Results were shown in Fig. 3.
3.1.3. Effect of contact timeFor the biosorption processes, biosorption
experiments were carried out for different contact times with a fixed biosorbent dose 0.1 g, initial dye concentration 12 mg/L at solution pH 11 and at 30°C (Fig. 4). It is observed that the uptake of the dye increases with time. The uptake of adsorbate species was rapid in the initial stages of the contact period and became slow near the equilibrium. The percentage of dye removal at contact time of 60 min was 77.88%. After this time no further increase in the adsorption was observed. This result is expected because a large number of surface sites are available for adsorption at the initial stages and after a lapse of time, the remaining surface sites are difficult to occupy because of
Time (min)
0 20 40 60 80 100 120 140
Dye
Rem
oval
%
55
60
65
70
75
80
85
Fig. 4. Effect of contact time on the removal of methylene blue by rice husk ( Biosorbent dose 0.1g, pH 11, initial concentration of dye 12 mg/L and 30°C).
78 Z.Saadati & A. Makvandy/ Journal of Physical Chemistry and Electrochemistry Vol.2 No.2 (2014) 75-86

repulsion between the solute molecules of the solid and bulk phases [32].
3.1.4. Effect of dye concentrationDifferent methylene blue dye
concentrations (8-16 mg/L) were used to determine the effect of dye concentration. The increase in the dye concentration leads to a decrease in the percentage of methylene blue removal (Fig. 5).As the dye/ sorbent ratio increases, sorption sites are saturated, resulting in decreases in sorption efficiency [33].
C ( mg/L)
6 8 10 12 14 16 18
Dye
Rem
oval
%
65
66
67
68
69
70
Fig.5. Effect of dye concentration on the removal of methylene blue by rice husk (Contact time 60 min, Biosorbent dose 0.1g, pH 11 and 30°C).
3.1.5. Effect of temperatureBiosorption experiments were carried
out at different temperatures with a constant methylene blue concentration of 12 mg/L, biosorbent dose 0.1 g and pH 11.The removal percentage of methylene blue increases with increasing temperature, indicating that the sorption is endothermic process. This may be a result of increase in the mobility of dye with increasing temperature. Furthermore, the enhancement of sorption capacity might be due to the enhancement of sorptive interaction between the active site of rice husk and methylene blue or produce a swelling effect
within the internal structure of rice husk and enabling more dye molecules diffusion [34].
The thermodynamic parameters for the biosorption process, ΔH0, ΔS0and ΔG0, were evaluated using the equation [35,36]:
Δ (4)
Where K, known as the distribution coefficient of the adsorbate, is equal to (qe/Ce). R is the gas constant (8.314J.mol.K-1) and T is the temperature in Kelvin. The plot of lnKvs. 1/T is linear with the slope and the intercept giving values of ΔH0and ΔS0, respectively (Fig. 6). These values could be used to compute ΔG0.All these relations are valid when the enthalpy change remains constant in the temperature range. These thermodynamic parameters are given in Table1. Generally, the change of free energy for physical biosorption is smaller than that of chemical biosorption. The positive value of ΔH0 shows that the
1/T ( K-1)
0.0028 0.0030 0.0032 0.0034
ln K
6.90
6.95
7.00
7.05
7.10
7.15
7.20
7.25
7.30
Fig. 6. Plot of ln K versus 1/T for estimation of the thermodynamic parameters.
(3)
(5)
Z.Saadati & A. Makvandy/ Journal of Physical Chemistry and Electrochemistry Vol.2 No.2 (2014) 75-86 79

adsorption is endothermic process while positive ΔS0 value reflects the increasing randomness at the solid/solution interface during the adsorption. The change in free energy for physical and chemical reactions are between - 20 and 0 kJ.mol-1 and - 80 and - 400 kJ.mol-1 respectively [37].
3.3. Biosorption isothermsThe purpose of the adsorption isotherms
is to relate the adsorbate concentration in the bulk and the adsorbed amount at the interface [38]. Biosorption isotherms are the most important information for analyzing and designing a biosorption process [39,40]. Several isotherm equations are available and two important isotherms are selected in this study, the Langmuir and Freundlich isotherms [41,42]. The Langmuir biosorption isotherm assumes that adsorption takes place at specific homogeneous sites within the biosorbent and has found successful applications for too many biosorption processes of monolayer adsorption.
The expression of the Langmuir model is given by Eq. (6) [43].
Where qe (mg/g) is the adsorbed amount of the dye, Ce (mg/L), is the equilibrium concentration of the dye in solution, qm (mg/g)is the maximum adsorption capacity
and KL (L/mg) is the energy of adsorption.
Ce (mg.L-1)
6 8 10 12 14 16 18
Ce/
qe
(g.L
-1)
3.4
3.6
3.8
4.0
4.2
4.4
4.6
Fig. 7. Langmuir isotherm for methylene blue sorption onto rice husk (Contact time 60 min, Biosorbent dose 0.1g, pH 11 and 30°C).
Fig.7.shows a linear plot of Ce/qe versus Ce. The Langmuir constants qm and KL were determined from the slope and intercept of the plot and are presented in Table 2.The important characteristic of the Langmuir isotherm can be expressed by means of dimensionless constant separation factor, which is calculated using the following equation:
Where KL denotes the Langmuir constant and C0 is the initial concentration [44]. At all initial concentrations within studied range, RL values presented in Table 3 have been found between
Table 1: Thermodynamic parameters for biosorption of Methylene blue on rice husk at different temperatures
Temperature (K) ΔG0( kJ.mol-1) ΔH0 ( kJ.mol-1) ΔS0 ( kJ.mol-1 K-1)
303 -14.02 3.46 0.057313 -14.59323 -15.16333 -15.79343 -16.41353 -16.89
(6)(7)
80 Z.Saadati & A. Makvandy/ Journal of Physical Chemistry and Electrochemistry Vol.2 No.2 (2014) 75-86

0 and unity (1), indicating thereby favorable processes for the adsorbent. Also higher RL values at lower dye concentrations show that the adsorption is more favorable at lower dye concentrations.
Table 2:Langmuir and Freundlich isotherm model constants and correlation coefficients for adsorption of methylene blue onto rice husk
Isotherm ParametersLangmuirqm (mg.g-1) 13.63KL (L.mg-1) 0.038
R2 0.981Freundlich
KF 0.361n 1.344R2 0.998
The Freundlich isotherm [45] is an empirical equation employed to describe heterogeneous systems. The Freundlich equation is expressed as:
eCKq n
Fe
1
=
lnqe= ln KF+ lnCe
Where, KF is biosorption capacity at unit concentration and 1/n is biosorption intensity. 1/n values indicate the type of isotherm to be irreversible (1/n = 0), favorable(0 < 1/n < 1) and unfavorable (1/n>1). The biosorption capacity depends on the properties of adsorbate and biosorbent. To determine the constants KF and n, the linear form of the equation may be used to produce a graph of ln(qe) against ln(Ce) (Fig. 8) All constants obtained by Freundlich models are listed in Table 2. By comparing the results of the values, it was found that the Freundlich isotherm generally represent the equilibrium sorption of methylene blue onto rice husk.
Table 3: Co and RL values for adsorption of Methylene blue onto rice husk
Co RL
8 0.61510 0.56112 0.51614 0.47816 0.444
ln Ce
0.8 1.0 1.2 1.4 1.6 1.8 2.0
ln q
e
-0.3
-0.2
-0.1
0.0
0.1
0.2
0.3
0.4
Fig. 8.Freundlich isotherm for methylene blue sorption onto rice husk(Contact time 60 min, Biosorbent dose 0.1g, pH 11 and 30°C).
3.4. Adsorption kineticsA linear form of pseudo-first-order model
was described by Lagergren [46] in the form:
A linear plot of log(qe−qt) against time allows one to obtain the rate constant (Fig. 9). If the plot was found to be linear with good correlation coefficient, indicating that Lagergren’s equation is appropriate to methylene blue sorption on rice husk. So, the adsorption process is a pseudo-first-order process [46,47]. The Lagergren’s first order rate constant (k1) and qe determined from the model are presented in Table 4 along with the corresponding correlation coefficients. It was
(8)
(9)
(10)
Z.Saadati & A. Makvandy/ Journal of Physical Chemistry and Electrochemistry Vol.2 No.2 (2014) 75-86 81

observed that the pseudo-first-order model did not fit well. It was found that the calculated qe value does not agree with the experimental qe value (Table 4). This suggests that the adsorption of methylene blue does not follow first-order kinetics.
Time (min)
0 10 20 30
log(
q e-q
t )
-1.2
-1.0
-0.8
-0.6
-0.4
-0.2
0.0
Fig. 9. Pseudo-first-order sorption kinetics for methylene blue sorption onto rice husk
The pseudo-second-order kinetics may be expressed in a linear form as [48,49]:
Where the equilibrium adsorption capacity (qe), and the second order constant k2 (g/mg min) can be determined experimentally from the slope and intercept of plot t/qt versus t (Fig. 10). Thek2 and qe determined from the model are presented in Table 4 along with the corresponding correlation coefficients.
The values of the calculated and experimental qe are represented in Table 4. It can be seen that there is an agreement between qe experimental and qe calculated values for the pseudo-second-order model. Hence, the pseudo-second-order model better represented the adsorption kinetics. Similar phenomenon has been observed in the adsorption of methylene blue by hazelnut shells and wood sawdust [50].
Time (min)
0 50 100 150 200
t/q
t (g
.min
.mg-1
)
0
10
20
30
40
50
60
70
Fig. 10. Pseudo-second-order sorption kinetics for methylene blue sorption onto rice husk
Kinetics of sorption describes the solute uptake rate, which in turn governs the residence time or sorption reaction. It is one of the important characteristics in defining the efficiency of sorption. In this study, the kinetics of the methylene blue dye removal was carried out to understand the behavior of this low-cost adsorbent. The adsorption of methylene blue dye from an aqueous solution follows reversible second-order kinetics, when a single species is considered on a heterogeneous surface. The heterogeneous equilibrium between the methylene blue dye solution and the rice husk was represented in the following equation.
Where k1 is the forward rate constant and k2 is the backward rate constant. A represents the methylene blue remaining in the aqueous solution and B represents the methylene blue adsorbed on the surface of the rice husk. [51,24].
Another study of methylene blue onto rice husk showed that Equilibrium data fitted well into the Langmuir isotherm equation.
(11)
82 Z.Saadati & A. Makvandy/ Journal of Physical Chemistry and Electrochemistry Vol.2 No.2 (2014) 75-86

The sorption kinetics was found to follow a pseudo-second-order kinetic model [4].A comparative case study of two models (Thomas model and bed-depth/service time analysis model) has shown that these models are suitable for describing the biosorption process of the dynamic behavior of removal methylene blue with the rice husk. All the results suggested that rice husk as adsorbent to removal methylene blue from solution be efficient, and the rate of biosorption process be rapid [5].
Table 4. Comparison of the pseudo-first-order, pseudo-second-order adsorption rate constants and calculated and experimental qevalues obtained at different initial methylene blue concentrationsKinetic model Parameters
Pseudo-first-orderqe,cal (mg.g-1) 0.169k1 (min-1) 0.02R2 0.984
Pseudo-second-order k2(g. mg-1.min-1) 0.474qe,cal (mg.g-1) 1.135h ( mg.min-1.g-1 ) 0.610R2 0.999
qe,exp(mg.g-1) 1.123
The value of qm in the present work is compared with number of recently reported adsorbents used for the adsorption of methylene blue in Table 5. It is evident from Table 5 that the value of adsorption capacity in the present work (13.63 mg/g) is higher than some of adsorbents but lower than the activated carbon obtained from rice husk.
4. Conclusion
The present investigation showed that rice husk can be effectively used as adsorbent. The amount of dye sorbed was found to vary with initial solution pH, adsorbent dose, temperature and contact time. Methylene blue adsorption onto rice husk is increased with the rise in initial pH. The maximum monolayer adsorption capacity, qmax, at 25 °C of Methylene blue onto rice husk was found to be 13.63. The kinetics studies indicated that the adsorption kinetics of dye on rice husk followed the pseudo-second order. The equilibrium data have been analyzed. The results showed that the methylene blue followed Freundlich isotherm model. Thermodynamic studies indicated that the dye adsorption onto rice husk was a spontaneous, endothermic and physical reaction. Rice husk is economically
Table 5. Comparison of adsorption capacity of various adsorbents reported in literature and rice huskAdsorbents qm(mg/g) References
Rice husk (grinded to powder) 40.58 4
Neem leaf (powder) 8.76-1961 53Eggshell and eggshell membrane 0.8-0.24 54Fly ash 13.42 55Wheat shells (grinded to powder) 16.56 56
Activated date pits (500°C) 12.9 57
Activated date pits (900°C) 17.3 57Banana peel (washed and dried) 20.8 58
Pumpkin seed hull (crushed) 141.29 59Rice Husk (washed and dried) 4.41 60Rice Husk’s activated carbon 441.52 61
Present work 13.63
Z.Saadati & A. Makvandy/ Journal of Physical Chemistry and Electrochemistry Vol.2 No.2 (2014) 75-86 83

cheap and so regeneration is not necessary. Furthermore, being an agriculture waste, the rice husk is easily available and a cheap material in agricultural countries such as Iran, so it can be used as potential adsorbent for the removal of MB. Given the facts that rice husk necessitates no pretreatment; it is eco-friendly and low-cost, and that it has a satisfying biosorption capacity.
References
[1] T. Robinson, G. McMullan, R. Marchant, P. Nigam, Remediation of dyesin textile effluent: a critical review on current treatment technologies witha proposed alternative, Bioresour. Technol. 77 (2001) 247–255.
[2] Z. Aksu, Application of biosorption for the removal of organic pollutants:a review, Process Biochem. 40 (2005) 997–1026.
[3] S.Wang, Z.H. Zhu, A. Coomes, F. Haghseresht, G.Q. Lu, The physical andsurface chemical characteristics of activated carbons and the adsorption ofmethylene blue fromwastewater, J.Colloid Interf. Sci. 284 (2005) 440–446.
[4] V. Vadivelan, K.V. Kumar, Equilibrium, kinetics, mechanism, and processdesign for the sorption of methylene blue onto rice husk, J. Colloid Interf.Sci. 286 (2005) 90–100.
[5] R. Han, et al., Biosorption of methylene blue from aqueous solution by rice husk in a fixed-bed column. J. Hazard. Mater.141(3) (2007) 713-718. [6] R.P.Han,Y.F.Wang, P.Han, J. Shi, J.Yang,Y.S. Lu, Removal ofmethyleneblue from aqueous solution by chaff in batch mode, J. Hazard. Mater. 137(2006) 550–557.
[7] P.Waranusantigul, P. Pokethitiyook,M.Kruatrachue, E.S.Upatham,Kinetics of basic dye (methylene blue) biosorption by giant duckweed (Spirodelapolyrrhiza), Environ. Pollut. 125 (2003) 385–392.
[8] V.K. Garg, M. Amita, R. Kumar, R. Gupta, Basic dye (methylene blue)removal from simulated wastewater by adsorption using Indian rose-wood sawdust: a timber industry waste, Dyes.Pigm. 63 (2004) 243–250.
[9] G. McKay, J.F. Porter and G.R. Prasad, The removal of dyecolours from aqueous solutions by adsorption on low-costmaterials, Water, Air, Soil Pollut., 114 (1999) 423–438.
[10] G.M. Walker and L.R. Weatherley, Adsorption of acid dyesonto granular activated carbon in fixed beds, Water Res., 31(1997) 2093–2101.
[11] F.C. Wu, R.L. Tseng and R.S. Juang, Comparative adsorption ofmetal and dye on flake-and bead-types of chitosans preparedfrom fi shery wastes, J. Hazard. Mater., 73 (2000) 63–75.
[12] V. Golob and A. Ojstrs, Removal of vat and disperse dyes fromresidual pad liquors. Dyes. Pigm., 64 (2005) 57–61.
[13] J. Sarasa, M.P. Roche, M.P. Ormad, E. Gimeno, A. Puig andJ.L. Ovelleiro, Treatment of a wastewater resulting from dyesmanufacturing with ozone and chemical coagulation, WaterRes., 32 (1998) 2721–2727.
[14] P.K. Malik, S.K. Sanyal, Kinetics of decolourisation of azo dyesin wastewater by UV/H2O2 process, Sep. Purif. Technol., 36(2004) 167–175.
[15] P.K. Malik and S.K. Saha, Oxidation of direct dyes with hydrogenperoxide using ferrous ion as catalyst, Sep. Purif. Technol.,31 (2003) 241–250.
[16] G. Ciardelli, L. Corsi and M. Marucci, Membrane separationfor wastewater reuse in the textile industry, Resour. Conserv.Recycl., 31 (2000) 189–197.
[17] A. Aguedacha, S. Brosillonb, J. Morvanb and E. Lhadi, Photocatalyticdegradation of azo-dyes reactive black 5 and reactiveyellow 145 in water over a newly deposited titanium dioxide,Appl. Catal. B, 57 (2005) 55–62.
[18] H. Lachheb, E. Puzenat, A. Houas, M. Ksibi, E. Elaloui, C.Guillard and J.M. Herrmann, Photocatalytic degradation ofvarious types of dyes (Alizarin S, Crocein Orange G, MethylRed, Congo red, Methylene Blue in water by UV-irradiatedtitanium, Appl. Catal. B, 39 (2002) 75–90.
[19] A. Sakalis, K. Mpoulmpasakos, U. Nickel, K. Fytianos and A.Voulgaropoulos, Evaluation of a novel electrochemical pilotplant process for azo dyes removal from textile wastewater,Chem. Eng. J., 111 (2005) 63–70.
[20] A. Lopes, S. Martins, A. Morão, M. Magrinho and I. Gonçalves,Degradation of a Textile Dye C. I. Direct Red 80 by ElectrochemicalProcesses, Port. Electrochim.Acta, 22 (2004) 279–294.
[21] C. Namasivayam, R. Radhika and S. Suba, Uptake of dyes by a promising locally available agricultural solid waste: coir pith, Waste Manage., 21 (2001) 381–387.
[22] U. Kumar, M. Bandyopadhyay, Sorption of cadmium from aqueous solution using pretreated rice husk. Bioresource. technology, 97(2006) 104-109.
[23] W. S. Wan Ngah, M. A. K. M.Hanafiah, Removal of heavy metal ions from wastewater by chemically modified plant wastes as adsorbents: a review. Bioresource. technology, (2008) 99, 3935-3948.
[24] T. G. Chuah, A.Jumasiah, I.Azni, S.Katayon, S. Y. Thomas Choong, S. Y. Rice husk as a potentially low-cost biosorbent for heavy metal and dye removal: an overview. Desalination, 175 (2005) 305-316.
[25] A. H. Mahvi, A.Maleki, A.Eslami, (2004). Potential of Rice Husk and Rice Husk Ash for Phenol Removal in Aqueous Systems.Am.J. Appl. Sci. 1 (2007) 321-326.
[26] B. S. Ndazi, S.Karlsson, S. Chemical and physical
84 Z.Saadati & A. Makvandy/ Journal of Physical Chemistry and Electrochemistry Vol.2 No.2 (2014) 75-86

modifications of rice husks for use as composite panels. Composites: Part A, 38 (2007) 925-935.
[27] S. B. Daffalla, H.Mukhtar, M. S.Shaharun, Removal of Phenol from Aqueous Solutions using Rice Husk Ash. Casp. J. Appl. Sci. Res.2(2013) 36-49.
[28] Metcalf & Eddy, Inc., 2003, “Wastewater Engineering treatment and reuse”, McGraw-Hill Higher Education, U.S.A.
[29] M. Bansal, U. Garg , D. Singh, V.K. Garg, Removal of Cr(VI) from aqueous solutions using pre-consumer processing agricultural waste: A case study of rice husk. J. Hazard. Mater.162 (2009) 312–320.
[30] V. C. Srivastava, I.D. Mall, I.M. Mishra, Characterization of mesoporous rice husk ash (RHA) and adsorption kinetics of metal ions from aqueous solution onto RHA. J. Hazard. Mater. B134 (2006) 257-267.
[31] C. H. Lai, Chen C.Y. (2001), Removal of metal ions and humic acid from water by iron- coated filter media, Chemosphere, 44(2001) 1177-1184.
[32] V. J. P. Poots, G. Mckay ,J. J. Healy JJ. The removal of acid dye from effluent using natural adsorbents-I, Peat. Water Res; 10(1976) 1061-66.
[33] S. Boutemedjet, O. Hamdaoui,Sorption of malachite green by eucalyptus bark as a non-conventional low-cost biosorbent , Desal.Water treat. 8 (2009) 201-210.
[34] S. Senthikumaar., P. Kalaamani,. C. V. Subburaam, Liquid phase adsorption of Crystal violet onto activated carbons derived from male flowers of coconut tree, J. Hazard.Mater. B 136 (2006) 800-808.
[35] T. Robinson, B. Chandran and P. Nigam, Effect of pretreatmentsof three waste residues, wheat straw, corncobs andbarley husks on dye adsorption, Bioresour. Technol., 85 (2002)119–124.
[36] R.M. Gong, Y. Ding, M. Li, C. Yang, H.J. Liu and Y.Z. Sun, Utilizationof powdered peanut hull as biosorbent for removalof anionic dyes from aqueous solution, Dyes Pigm., 64 (2005)187–192.
[37] A., Ozcan, E. M., Oncu, A.S., Ozcan, Kinetics, isotherm and thermodynamic studies of adsorption of Acid Blue 193 from aqueous solutions onto natural sepiolite, Colloids Sur. A: Physchem. Eng. Aspects, 277 (2006) 90 – 97.
[38] J. Eastoe, J.S. Dalton, Dynamic surface tension and adsorption mechanisms of surfactants at the air water interface, Adv. J. Colloid Interface Sci. 85(2000) 103– 144.
[39] J.W. Lee, T.W. Kwon and I.S. Moon, Adsorption of monosaccharaides, disaccharides and malt oligosaccharides on activatedcarbon for separation of maltpentose, Carbon, 42 (2004) 371–380.
[40] Z. Al-Qodah, Adsorption of dyes using shale oil ash, Water Res., 34 (2000) 4295–4303.
[41] M. Dogan, M. Alkan and Y. Onganer, Adsorption of methylene blue from aqueous solution onto perlite, Water Air Soil Pollut.,120 (2000) 229–248.
[42] D. Mohan, K.P. Singh, G. Singh and K. Kumar, Removal of dyes from wastewater using flyash, a low-cost biosorbent. Ind. Eng.Chem. Res., 41 (2002) 3688–3695.
[43] I. Langmuir I. The Constitution and Fundamental Properties of Solids and Liquids.J. Am. Chem. Soci. 38 (1916) 2221-2295.
[44] T. W. Weber, R.K. Chakravorti, Pore and Solid Diffusion Models for Fixed Bed Adsorbents. Am. Inst. Chem. Eng. J. 20 (1974) 228-232.
[45] H. Freundlich, U¨ ber die adsorption in lo¨sungen (adsorption in solution), Z. Phys. Chem. 57 (1906) 384–470.
[46] S. Lagergren, Zurtheoriedersogenanntenad- sorptiongelöster stoffe, K. Sven.Vetenskapsakad., Handl. 24 (1898) 1–39.
[47] Y.S. Ho, G. McKay, The sorption of lead(II) ions on peat, Water Res. 33(1999) 578–584.
[48] Y.S. Ho, G. McKay, Sorption of dye from aqueous solution by peat, Chem. Eng. J. 70 (1998) 115–124.
[49] Y.S. Ho, G. McKay, The kinetics of sorption of divalent metal ions onto sphagnum moss peat, Water Res. 34 (2000) 735–742.
[50] F. Ferrero, Dye removal by low cost adsorbents: hazelnut shells in comparison with wood sawdust, J. Hazard. Mater. 142 (2007) 144–152.
[51] A. O¨zer, G. Dursun G, Removal of methylene blue from aqueous solution by dehydrated wheat bran carbon. J. Hazard. Materials.146(2007) 262-269
[52] S. Wang S, Y. Boyjoo, A. Choueib, Comparative study of dye removal using fly ash treated by different methods. Chemosphere. 60(2005) 1401-1407.
[53] K.G. Bhattacharyya, A. Sharma, Kinetics and thermodynamics of Methylene Blue adsorption on Neem (Azadirachta indica) leaf powder, Dyes Pigm. 65 (2005) 51–59.
[54] W.T. Tsai, J.M. Yang, C.W. Lai, Y.H. Cheng, C.C. Lin, C.W. Yeh, Characterization and adsorption properties of eggshells and eggshell membrane, Bioresour. Technol. 97 (2006) 488–493.
[55] S. Wang, Y. Boyjoo, A. Choueib, A comparative study of dye removal using fly ash treated by different methods, Chemosphere 60 (2005) 1401–1407.
[56] Y. Bulut, H. Aydın, Kinetics and thermodynamics study of methylene blue adsorption on wheat shells, Desalination 194 (2006) 259–267.
[57] F. Banat, S. Al-Asheh, L. Al-Makhadmeh, Evaluation of the use of raw and activated date pits as potential adsorbents for dye containing waters, Process Biochem. 39 (2003) 193–202.
[58] G. Annadurai, R. Juang, D. Lee, Use of cellulose-based wastes for adsorption of dyes from aqueous solutions, J. Hazard. Mater. 92 (2002) 263–274.
[59] B.H. Hameed, M.I. El-Khairay, Removal of basic dye from aqueous medium using a novel agricultural waste material: Pumpkin seed hull, J. Hazard. Mater. 155 (2008) 601–609.
Z.Saadati & A. Makvandy/ Journal of Physical Chemistry and Electrochemistry Vol.2 No.2 (2014) 75-86 85

[60] R. Han, Y. Wang, W. Yu, W. Zou, J. Shi, H. Liu, Biosorption of methylene blue from aqueous solution by rice husk in a fixed-bed column, J. Hazard. Mater. 141 (2007) 713–718.
[61] K.Y. Foo, B.H. Hameed, Utilization of rice husks as a feedstock for preparation of activated carbon by microwave induced KOH and K2CO3 activation, Bioresour. Technol. 102 (2011) 9814–9817.
86 Z.Saadati & A. Makvandy/ Journal of Physical Chemistry and Electrochemistry Vol.2 No.2 (2014) 75-86

Journal of Physical Chemistry and Electrochemistry
Journal homepage: http://journals.miau.ac.ir/jpe
Journal of Physical Chemistry and Electrochemistry Vol.2 No. 2(2014) 87-92
Islamic Azad University Marvdasht Branch
*Correspondig AuthorE-mail address: [email protected]
Indirect Determination of Ascorbic Acid by Atomic Absorption SpectroscopyM. Emadi*1, M.A. Zare1,O. Moradlou2, M. Iranpour3
1Young Researchers and Elite Club, Marvdasht Branch, Islamic Azad University, Marvdasht, Iran2Department of Chemistry, College of Sciences, Alzahra University, Tehran, Iran3Department of Chemistry, Shiraz Branch, Islamic Azad University, Shiraz, Iran
Abstract
A new and simple method followed by atomic absorption spectrometry has been developed for indirect determination of ascorbic acid (AA). The proposed method was based on the oxidation of AA to dehydroascorbic acid with Cu2+cation(200mgL-1)in an ammonium thiocyanatesolution at pH2.4. AA reduces Cu2+to Cu+followed by the precipitation of Cu+ with SCN-. Then, the excess of Cu2+in the solution was measured by the atomic absorption spectrometry.The results showed that AA can be sensitively measured in the linear range of 2.0 to 40.0 mgL-1 with the detection limit of 1.5mgL-1.The relative standard deviation (%RSD) was 0.319 in 7 determination of 2.0 mgL-1 AA. Finally, the method was successfully used for the determination of AA in tablets containing various amounts of AA.
Keywords: Ascorbic acid, indirect determination, atomic absorption spectroscopy
1. Introduction
Ascorbic acid (AA) is one of the important vitaminswhich participates in a great variety of biological events concerning electron transport reaction, hydroxylation, and the oxidative catabolism of aromatic aminoacids. Measuring the concentration of some chemical markers commonly assesses food determination and product quality: AA is one such indicator [1].
AA is considered to be essential for the development and regeneration of muscles, bones, teeth and skin. Also it has been
identified as a radical scavenger in vivo. AA or vitamin C is present naturally in a wide range of foods particularly fruits and vegetables. But AA has limited stability and may be lost from foods during storage, preparation and cooking. In some foods, it is purposely added to attract consumers and to act as an antioxidant [2] to prolong the shelf-life of the commercial products. Some pharmaceutical preparations add AA to their products as a supplementary source of vitamin C in human diets [3].
The therapeutic importance of AA has prompted many researchers to develop methods for its determination in such samples as well as in pharmaceuticals [4-56][7].So, it is very important to design a simple, selective

and sensitive method for the determination of AA in routine analysis.Many analytical techniques are available for direct or indirect determination of AA in different matrices such as titrimetry [8], spectrophotometry [9-1011], HPLC [12,13], enzymatic methods [14], fluorimetry [15,16], various electroanalytical techniques [17,18], chemiluminiscence [19,20], kinetic methods [21], capillary zone electrophoresis and isotachophoresis [22,23].A large number of papers have been published and presented on AA quantification. This shows the importance of this compound. Some valuable articles have also been reviewed the determination of AA [24-25262728].
However, indirect determination of AA has also been reported. Among various methods, the special interest is on flame atomic absorption spectrometry (FAAS) [29_30313233]. The main reason is its improved detection limits, low relative standard deviation and selectivity as well as sensitivity.
The present work describes for first time the details of the development of anindirect method for the determination of ascorbic acid with atomic absorption spectroscopy based on the oxidation of ascorbic acid with Cu2+ and consequently, the precipitation reaction of resulted Cu+ with thiocyanate. The unreacted copper is determined with FAAS without using any separation method.
2. Experimental
2.1. ApparatusThe cation absorbance was measured with
a Perkin Elmer atomic absorption spectrometer model AA-800 with an air-acetylene flame and 10 cm burner. The wavelength was set to 324.0nm for Cu2+with a spectral slit- width of 0.7 nm and a lamp current of 15 mA.
2.2. Reagents and solutions
All chemicals were of analytical reagent grade. Solutions of ammonium thiocyanate
and disodium EDTA were made from purified samples in doubly distilled water.Ascorbic acid stock solution of 1000 mg L-1 was prepared by dissolving 0.100 g of ascorbic acid (Merck) in double distilled water in 100-mLflask and diluting to the mark. In order to analyzed real AA samples twenty tablets of vitamin C (Kruger) were weighed and ground into a fine powder. An accuratelyweighed powder equivalent to 100 mg of the active component was transferred into a 100-mLflask and dissolved in doubly distilled water and the mixture was shaken thoroughly for 5 min. Then it was mixed well anddiluted to the mark with distilled water. An aliquot of this solution was diluted appropriately to obtain the working concentrations and analyzedunder proposed procedure.
2.3. ProcedureIn this method, the 5.0 mL of copper sulfate
solution (200mgL-1)was taken in the 100-mL beaker and 5.0 mL of ammonium tiocyanate solution (1%w/v) was added. Then the pH was adjusted to 2.4with sodium hydroxide or hydrochloric acid, and then the exact known volume of ascorbic acid solution (50mgL-1) was added drop wise with constant stirring and heated on a heater stirrer for 15 min (T = 70 °C).The resulted precipitate was filtered through a sinter glass porosity crucible and washedthree times with 0.1% ammonium thiocyanate solution and 20% (v/v) ethanol/water solution and diluted to 25 mL with distilled water. The amount of unreacted Cu2+ was determined by atomic absorption spectrophotometer at the wavelength of 324.0 nm. Hydrochloric acid was chosen for acidification of the solutions in the reaction vessel containing Cu2+, SCN- and AA. The various experimental parameters were optimized as well.
3. Results and discussion
Ascorbic acid (AA) is one of the natural
88 M. Emadi et.al. / Journal of Physical Chemistry and Electrochemistry Vol.2 No.2 (2014) 87-92

compounds having reducing characteristics. So, AA can be easily oxidized to dehydroascorbic acid (DHAA) by various agents. Cu (II) can oxidize AA during the following reaction:
2Cu(II) + AA + 2H+ → 2Cu (I) +DHAA + H2O
The proposed method was based on the oxidation of AA with the excess amount of Cu (II) cation in hydrochloric acid medium, e.g. pH 2.4, and consequently, the precipitation reaction of resulted Cu+ with thiocyanate“ and then analysis of the unreacted copper by FAAS. It should be noted that the unreacted Cu(II) cannot precipitate with thiocyanate [34].
An increase in AA concentration causes more consumption of Cu2+ in the solution, so, the decrease in the measured absorbance of Cu2+.The absorbance is found to be decreased linearly with increase in the concentration of AA.
3.1. Optimization of the experimental variablesA series of experiments were conducted
to establish optimal analytical variables. All experimental parameters including pH, thiocyanate concentration, stirring time and temperature were optimized.
3.1.1. The influence of the amount of ammonium thiocyanate
Several aliquotsof the standard solution Cu2+200 mgL-1 were transferred into a series of 25 mL standard flasks. Then, a volume of 5.0 mL of 50 mgL-1AA solution was added to each flask followed by acidification by 2.0 mL of 0.1 molL-1hydrochloric acid, and then different amounts of 1.0 % thiocyanate was added and the contents were diluted to the mark with distilled water and mixed well. When this solution was heated, precipitat-ion of copper (I) thiocyanate began a few minutes and was complete in 15 min. The amount of unreacted
Cu2+ was determined by atomic absorption spectrophotometer at the wavelength of 324.0 nm.Blank was prepared similarly omitting the AA and its absorbance was measured against distilled water. The decrease in absorbance corresponding to consumed Cu2+ and in turn, to AA concentration, obtained by subtracting the absorbance of AA solution from the corresponding blank. The relationship between thiocyanate amount and the decrease in the measured absorbance of Cu (II) is shown in Fig. 1.
Fig. 1. Influence of the amount of ammonium thiocyanate(1.0%),[Cu (II)] = 16 mgl-1, Ascorbic Acid=4.0 mgl-1, Temp. =70°C, Stirring time=15.0 min, atλmax=324.0 nm.
3.1.2 The effect of pHAs implies from equation (1), the reaction
between Cu2+ and AA as well as the reduction potential of AA depends on the pH of the solution.At pH values higher than5.0, the rate of copper reduction is much decreased and the precipitation is not completed even after a long time of the reaction [34].
Based on the above reaction an acidic environment is required, care should be taken that the concentration of the acid will give optimum performance. The response of oxidation was studied by using different HCl concentrations. The effect of pH value between 1.0 and 6.47 was evaluated (Fig. 2).The analytical signal decreases as the pH increases. There was increase in absorbance,
(1)
M. Emadi et.al. / Journal of Physical Chemistry and Electrochemistry Vol.2 No.2 (2014) 87-92 89
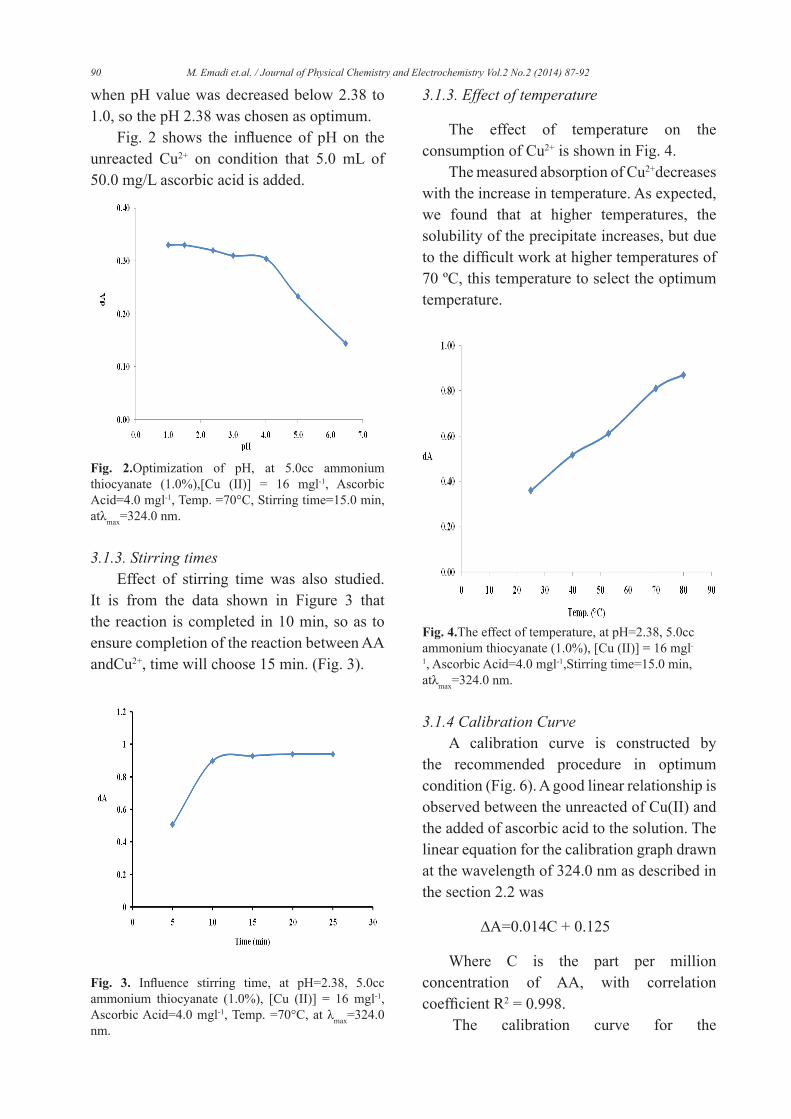
when pH value was decreased below 2.38 to 1.0, so the pH 2.38 was chosen as optimum.
Fig. 2 shows the influence of pH on the unreacted Cu2+ on condition that 5.0 mL of 50.0 mg/L ascorbic acid is added.
Fig. 2.Optimization of pH, at 5.0cc ammonium thiocyanate (1.0%),[Cu (II)] = 16 mgl-1, Ascorbic Acid=4.0 mgl-1, Temp. =70°C, Stirring time=15.0 min, atλmax=324.0 nm.
3.1.3. Stirring timesEffect of stirring time was also studied.
It is from the data shown in Figure 3 that the reaction is completed in 10 min, so as to ensure completion of the reaction between AA andCu2+, time will choose 15 min. (Fig. 3).
Fig. 3. Influence stirring time, at pH=2.38, 5.0cc ammonium thiocyanate (1.0%), [Cu (II)] = 16 mgl-1, Ascorbic Acid=4.0 mgl-1, Temp. =70°C, at λmax=324.0 nm.
3.1.3. Effect of temperature
The effect of temperature on the consumption of Cu2+ is shown in Fig. 4.
The measured absorption of Cu2+decreases with the increase in temperature. As expected, we found that at higher temperatures, the solubility of the precipitate increases, but due to the difficult work at higher temperatures of 70 ºC, this temperature to select the optimum temperature.
Fig. 4.The effect of temperature, at pH=2.38, 5.0cc ammonium thiocyanate (1.0%), [Cu (II)] = 16 mgl-
1, Ascorbic Acid=4.0 mgl-1,Stirring time=15.0 min, atλmax=324.0 nm.
3.1.4 Calibration CurveA calibration curve is constructed by
the recommended procedure in optimum condition (Fig. 6). A good linear relationship is observed between the unreacted of Cu(II) and the added of ascorbic acid to the solution. The linear equation for the calibration graph drawn at the wavelength of 324.0 nm as described in the section 2.2 was
∆A=0.014C + 0.125
Where C is the part per million concentration of AA, with correlation coefficient R2 = 0.998.
The calibration curve for the
90 M. Emadi et.al. / Journal of Physical Chemistry and Electrochemistry Vol.2 No.2 (2014) 87-92

determination of ascorbic acid was prepared according to the general procedure under the optimum conditions developed above (Fig. 5). The linearity was obtained in the range of 2.0-40.0 mg L-1 of ascorbic acid with a correlation coefficient of 0.998. The detection limit of the proposed method (calculated as 3σ) was obtained to be1.5 mgL-1. The relative standard deviation of AA determination (4.0mgL-1) was found to be 0.32% (n=8) (Fig. 5).
Fig. 5. Calibration curve for AA determination
3.1.5. Sample analysisTreatments of samples Vitamin C
tabletsseveral tablets of vitamin C drug are accurately weighed ground and powered. A given amount of this powder is transferred into a volumetric flask and diluted to the mark. The content of the flask is shaken for about 10 min. Then it is filtered and the first portion of the filtrate is rejected. This solution is further diluted to adjust the concentration to meet the requirement of the experimental conditions adopted.
4. Conclusions
Ascorbic acid can be analyzed at the DL 1.5µg ml1- levelwhen reacting with Cu (II)
with the formation of the Cu (I) –thiocyanate precipitate, and concentration and indirect measurement AA. This is a very sensitive, simple and selective one-stepmethod, suitable for laboratory routine controland can be carried out directly without any pre-treatmentof the samples.
Reference
[1] M. Noroozifar, M. khorasani-Motlagh, K. Akhavan, Analytical Sci. 21 (2005) 655.
[2] B.W. Zoecklein, K.C. Fugelsang, B.H. Gump, F.S. Nury, Sulfur Dioxide and Ascorbic Acid in Wine Analysis and Production, Chapman & Hall, New York, 1995.
[3] M.T. Parviainen, in: A. Townshend (Ed.), Encyclopedia of Analytical Science, vol. 9, Academic Press, London, 1995.
[4] Arya S P, Mahajan P and Jain, Anal.Chim.Acta. 417 (2000) 1.
[5] Arya S P, Mahajan P and Jain, Anal.Sci., 14 (1998) 889.
[6] Ana-Maria Hossu,V. Magearu, , Roum. Biotech. Lett., 9 (2004) 1497.
[7] M. Noroozifar, M. Khorasani_Motlagh, and K. Akhvan, Atomic absorption spectrometry for the automatic indirect determination of ascorbic acid based on the reduction of manganese dioxide, analytical science june 2005, vol. 21.
[8] K. K. Verma, A. Jain, R. Rawat, d. Assoc. Off.Anal. Chem. 67 (1984) 262.
[9] S. H. R. Davies, S. J. Masten, Anal.Chim.Acta 248 (1991) 225.
[10] S.Z. Qureshi, A. Saeed, S. Haque, M. A. Khan, Talanta 38(1991) 637.
[11]A. Rahman, S. Hanif, S. Rahman, Pak. d. Sci. 46 (1994) 33.
[12] I. A. Nicolson, R. Macrae, D. P. Richardson, Analyst 1984,109, 267.
[13] H. Iwase, I. Ono, J. Chromatogr. 654(1993) 215.[14] F. Tsumura, Y. Ohsako, Y. Haraguchi, H. Kumagai,
H. Sakurai, K. Ishii, J. Food Sci. 58 (1993) 619.[15]H. K. Chung, J. D. Ingle, Anal.Chim.Acta.243
(1991) 89.[16] H. P. Huang, R. X. Cai, Y. M. Du, Y. E. Zeng, Chin.
Chem. Lett. 6 (1995) 235.[17] S. Uchiyama, Y. Kobayashi, S. Suzuki, Anal.Chem.
63 (1991) 2259.[18] Z. Gao, B. S. Chen, M. X. Zi, J. Electroanal. Chem.
365(1994) 197.[19] K. Sato, Y. Chiba, S. Tanaka, Anal. Chim. Acta.
277 (1993) 61.[20] L. Wang, Ch. Zhu, G. Yang, J. Wu, H. Tong, S.
Zhang, FenxiHuaxue23 (1995) 83.[21] H. K. Chung, J. D. Ingle, Anal.Chim.Acta243
(1991) 89.
M. Emadi et.al. / Journal of Physical Chemistry and Electrochemistry Vol.2 No.2 (2014) 87-92 91

[22] M. Chiara, M. Nesi, G. Carrea, P. G. Righetti, d. Chromatogr. 645 (1993) 197.
[23] C. T. Wang, W. T. Chang, C. W. Huang, T. C. Pan, T. M. Pan, R. T. Wang, Jpn. d. Toxicol. Environ. Health 40 (1994) 197.
[24] L.A. Pachla, D. L. Reynolds, P. T. Kissinger, J. Assoc. Off.Anal.Chem. 68 (1985) 1.
[25] S. M. Sultan, E. Bishop, J. Pharm. Biomed.Anal. 8 (1990) 345.
[26] P.W. Washko, R. W. Welch, K. R. Dhariwal, Y. Wang, M. Levine, Anal. Biochem. 204 (1992) 1.
[27] S. M. Sultan, TaIanta 40 (1993) 593.[28] Y. Liu, Huaxue Shift t6 (1994) 282.
[29] M. C. Yebra, R. M. Cepon, and A. Moreno-Cid, Anal.Chem. Acta, 448 (2001), 157.
[30] Z.-Q. Zhang and Y.-C.Jiang, At.Spectrosc. 21(2000) 110.
[31] Y.-C. Jiang, Z.-Q. Zhang and J. Zhang, Anal. Chem. Acta, 435 (2001) 351.
[32] M. Noroozifar, M. Khorasani-Motlagh, and K. Akhavan, Anal.Science, (2005) 21.
[33] Abdel-Hamid, M.E., Barary M.H., Hassan, E.M., and Elsayd, M.A., Analyst (Cambridge, U.K.), vol. 110, no. 7(1985) 831.
[34] K. N. Upadhyaya, Anal. Chim.Acta, 113(1980)195-197.
92 M. Emadi et.al. / Journal of Physical Chemistry and Electrochemistry Vol.2 No.2 (2014) 87-92

Journal of Physical Chemistry and Electrochemistry
Journal homepage: http://journals.miau.ac.ir/jpe
Journal of Physical Chemistry and Electrochemistry Vol.2 No. 2(2014) 93-99
Islamic Azad University Marvdasht Branch
*Correspondig AuthorE-mail address: zsharafy@yahoocom
Prediction of PVT Properties of Pure Refrigerants Using ISM Equation of State
Zahra Sharafi*
Department of Chemistry, Islamic Azad University, Marvdasht Branch, Marvdasht, Iran
Abstract
A three-parameter cubic equation of state has been proposed for predicting PVT of pure refrigerants such as R236ea, R236fa, R245fa, R245ca, R218, R227ea, and R717, from freezing point up to critical point temperature and pressures up 650 atm. We explore the theory of the equation of state from the view point of Ihm–Song–Mason (ISM) equation of state, which has been derived on the basis of statistical mechanical perturbation theory, and is characterized by three temperature dependent parameters, a, b, B2 , and a free parameter λ. The second virial coefficients are calculated from a correlation based on the heat of vaporization, ΔHvap, and the liquid density at the normal boiling point, ρnb. α(T ) and b(T ) can also be calculated from second virial coefficients by a scaling rule. The theory has considerable predictive power, since it permits the construction of the PVT surface from the heat of vaporization and the liquid density at the normal boiling point. The results indicate that the liquid densities can be predicted with very good agreement over a wide range of temperatures, 100–400 K.
Keywords: Equation of State, Correlation, Heat of Vaporization, Saturation Liquid Density of Refrigerants
1. Introduction
Accurate knowledge and prediction of the thermophysical properties of refrigerants, is of great importance to evaluate the performance of refrigeration cycles and to determine the optimum composition of new working fluids in pure and mixture states. The development of models for representation and prediction of physical properties and phase equilibria as well as the improvement of current equations of state (EOS) is of particular interest for
the refrigeration industry. Thermodynamic properties of the long-known refrigerants and the new refrigerants are the key data needed for the calculation of refrigeration cycles and for designing refrigeration and air-conditioning equipment.
In 1992, Ihm, Song and Mason [1] presented an EOS based on statistical-mechanical perturbation theory for mixtures of fluids. The second virial coefficient, which characterizes binary interactions between atoms and molecules, plays an important role in the EOS, as a source of a scaling factor for calculating the other two temperature-

dependant parameters, α(T) and b(T). It will be shown that by knowing the second virial coefficient, the prediction of the entire pressure-volume-temperature (PVT) surface of fluids can be achieved at least for state points less than the critical temperature. Knowledge of the binary intermolecular potential energy between atomic and molecular constituents of the systems [1, 2] makes it possible to calculate second virial coefficients. Unfortunately, there are no exact intermolecular potential energies (except for some simple gases) for real fluids.
Therefore it seems reasonable to find other methods to evaluate the second virial coefficient. Of course, the experimental second virial coefficient is another good source for using the EOS. But experimental second virial coefficients have not been derived for all systems over a wide range of temperatures. The most generally useful method for prediction of the volumetric properties of fluids, such as the second virial coefficient, is the use of the hypothesis of corresponding states, which came originally from van der Waals in his well-known EOS.
Many investigations have attempted to extend the applicability of equations of state for pure and liquid mixtures [2-12] with even more readily available parameters to cover a wide range of substances, even for those which experimental data such as the second virial coefficient or the intermolecular potential energy are not yet available . In the absence of the accurate values of the second virial coefficients, there are several correlation methods, usually based on a principle of corresponding states, by which B2 (T) can be estimated with reasonable accuracy.
2. Theory
Starting from the pressure equation [13] and applying the Weeks–Chandler–Andersen [14] decomposition of the potential energy function, Song and Mason [15, 16] obtained
an analytical equation of state of the form
2( )11 0.22 1
BPkT b b
α ρ αρρ λ ρ λ ρ
−= + +
+ − (1)
for nonpolar and slightly polar fluids. Here P is the pressure, ρ is the molar (number) density, B2 is the second virial coefficient, α is the contribution of the repulsive forces to the second virial coefficient, b is a temperature dependent parameter analogous to the van der Waals covolume, kT is the thermal energy of one molecule, and λ is an adjustable parameter. The parameters B2, α, and b are all temperature dependent and can be evaluated by knowing the intermolecular forces. However, such forces are almost never known with sufficient accuracy, except for noble gases [17]. If the values of the three parameters are known, the free parameter λ can be determined experimentally from high-density PVT data such as a saturated liquid density. Also the major problem now is to find the three dependent parameters B2,α and b. In the following, we describe a procedure for the determination of these temperature-dependent parameters using a macroscopic corresponding-states-correlation.
3. Correlation procedure
The second virial coefficient B2(T) plays a central role in the application of Eq. (1). It is used both directly and as the source of scaling constants for the calculation of α(T) and b(T). The minimum input information needed to use Eq. (1) consists of the value of B2(T) plus some high-density data to fix the value of an adjustable shape constant in G(bρ). For many fluids, neither accurate potential functions nor experimental values of B2(T) over the whole range of temperature are available. In the absence of accurate values of B2(T), there are several correlation schemes, usually based on the principle of corresponding states, by which B2(T) can be estimated with reasonable
94 Z. Sharafi / Journal of Physical Chemistry and Electrochemistry Vol.2 No.2 (2014) 93-99

accuracy. To determine the parameter B2(T), we have used the following correlation [11]:
2 40.403891 0.076484( / ) 0.0002504( / )nb vap vapB H RT H RTρ = − ∆ − ∆
Once the B2(T) values are known, the parameters α(T) and b(T) of the equation of state are derived from the second virial coefficient [11]:
{ }1/ 41 1 2 2exp[ ( / )] 1 exp[ ( / ) ]nb vap vapa c RT H a c H RTαρ = − ∆ + − − ∆
{ }1 1 1
1/ 4 1/ 42 2 2
[1 ( / )]exp[ ( / )]
1 [1 0.25 ( / ) ]exp[ ( / ) ]nb vap vap
vap vap
b a c RT H c RT H
a c H RT c H RT
ρ = − ∆ − ∆ +
− + ∆ − ∆
a1= -0.1053 c1=5.7862 a2=2.9359 c2=0.7966
where ρnb and ΔHvap are the liquid density and heat of vaporization at the normal boiling point respectively. The correlations cover a wide range of temperatures.
4. Results and Discussion
In this work Ihm-Song-Mason equation of state (ISM EOS) for pure refrigerants [18] is applied to calculate saturated liquid densities. Actually the purpose of this work is to show how the ISM equation of state can be used with even less input information for
refrigerants. Two constants are needed for each pure component, ΔHvap and ρnb, which are readily available, and there is seldom any difficulty in determining them; only simple measurements are needed if values cannot be found in the literature.
Three temperature-dependent parameters of the ISM EOS are calculated with Eqs. (2)-(4). The free parameter λ of Eq. (1) for each pure refrigerant is calculated by using boiling-point data. This method for determining λ makes the whole procedure self-correcting, because if the input values ΔHvap and ρnb at the normal boiling point are not accurate, the effects will be largely compensated by this adjustable parameter. Once the value of the constant λ is determined, the entire volumetric behavior of the given fluids is established. Values obtained for λ as well as the heat of vaporizations and liquid densities at the normal boiling point for refrigerants are given in Table 1. We considered the refrigerants that widely used currently and also substitutions of harmful refrigerant such as R12, R114, R22 and R502.
In the search fluids for potential applications as refrigerants in high-temperature heat pumps, centrifugal chillers, and chemical blowing agents, two new refrigerants, namely, 1,1,1,2,3,3-hexafluoropropane (R236ea), and 1,1,1,3,3,3-hexafluoropropane (R236fa), are among the most promising. The refrigerants have virtually zero potential to deplete the stratospheric ozone, low global warming
(2)
(3)
(4)
Table 1. Parameters used for pure refrigerants.
Refrigerant Formula Tnb (K) ρnb (kg.m-3) ∆Hvap /R (K) λ
R236ea a CF3CHFCHF2 279.3 1482.6 3020.5 0.408R236fa a CF3CH2CF3 271.7 1444.7 2931.8 0.408R245fa a CF3CH2CHF2 288.1 1365.7 3171.3 0.411R245ca a CHF2CF2CH2F 298.3 1386.0 3240.2 0.409R218b C3F8 236.4 1603.0 2351.9 0.392R227ea b CF3CHFCF3 256.7 1535.0 2695.4 0.403R717 b NH3 239.9 682.0 2804.2 0 .421
a from Ref. [19].b from Ref. [20].
Z. Sharafi / Journal of Physical Chemistry and Electrochemistry Vol.2 No.2 (2014) 93-99 95

potential, and are completely nonflammable over a wide range of concentrations in air at temperatures up to 323 K, and no unusual toxicity has been indicated in limited toxicity testing. Through thermodynamic evaluation and experimental tests, R236ea has been demonstrated to have high potential as an alternative for R-114 [21]. Calculated of saturated liquid densities for R236ea and R236fa is shown in Figures 1 and 2.
T / K
220 240 260 280 300 320 340 360 380
10
0(ρ
exp-ρ
ca
l)/ρ
exp
-5
-4
-3
-2
-1
0
1
2
3
Fig. 1. Deviation plot for calculated saturated liquid densities by ISM EOS as a function of temperature, for R236ea and compared with Ref. [19].
T / K
200 220 240 260 280 300 320 340 360
10
0(ρ
exp-ρ
ca
l)/ρ
exp
-6
-4
-2
0
2
4
6
Fig. 2. The same as fig.1. for R236fa.
1,1,2,2,3-pentafluoropropane (R245ca) is currently considered as a potential replacement for chlorine-containing compounds used in chillers, such as R-11 [22].
1,1,1,3,3-pentafluoropropane (R245fa), a non-flammable, low-pressure (relative to R-134a) HFC refrigerant has been introduced for the foam blowing industry [23, 24]. The relatively high critical temperature of this fluid means that it would be an efficient working fluid for air-conditioning equipments [25]. The results for R245ca and R245fa are shown in Figures 3 and 4.
T / K
200 220 240 260 280 300 320 340 360 380 400
10
0(ρ
exp
-ρca
l)/ρ
exp
-6
-4
-2
0
2
4
6
Fig. 3. The same as figure 1. for R245ca.
T / K
200 220 240 260 280 300 320 340 360 380
10
0(ρ
exp
-ρca
l)/ρ
ca
l
-4
-2
0
2
4
6
Fig. 4. The same as figure 1. for R245fa.
96 Z. Sharafi / Journal of Physical Chemistry and Electrochemistry Vol.2 No.2 (2014) 93-99

1,1,1,2,3,3,3-heptatafluoropropane (R227ea), which is chlorine-free, can be considered as a possible alternative refrigerant. It is intended as a potential alternative for R12 and R114 for units with high condensing temperatures, and also blends containing R227ea are potential alternatives to R22 and R502. It can be used in fire suppression, sterilization, and propellant applications [26].
Octafluoropropane (R218) is used in mixture with oxygen in semiconductor applications as an etching material for SiO2 layers, and also is a component in refrigeration mixtures.
Ammonia (R717) is perhaps most well recognized as a household cleaner, and makes another important contribution to daily life as an industrial refrigerant. More recently, ammonia refrigeration systems have been used for air conditioning in publicly accessed buildings and increasing output efficiencies for power generation facilities.Figures.5-7 are deviation plots for R227ea, R218, and R717.
T / K
160 180 200 220 240 260 280 300 320 340 360
10
0(ρ
exp
-ρca
l)/ρ
exp
-4
-2
0
2
4
Fig. 5. The same as fig. 1. R227ea.
As shown in Figures 1-7, the trend of percent deviation, from positive to about zero then becoming negative is due to the particular choice of λ. All of measurements are from freezing point up to critical temperature
and at the boiling temperature at which λ is determined the deviation is around zero.
T / K
100 150 200 250 300 350
10
0(ρ
exp
-ρca
l)/ρ
exp
-4
-2
0
2
4
Fig. 6. The same as fig. 1. for R218.
T (K)
180 200 220 240 260 280 300 320 340 360 380
100(ρ
exp-ρ
cal)/ρ
exp
-5
-4
-3
-2
-1
0
1
2
3
Fig. 7. The same as fig. 1. for R717.
As the figures show there is very good agreement between the calculated values by ISM equation of state and experimental results [19] for pure refrigerants over a wide range of temperatures and pressures.
5.Conclusions
A cubic-perturbed equation of state has been proposed that can predict PVT properties for pure refrigerants over a wide range of
Z. Sharafi / Journal of Physical Chemistry and Electrochemistry Vol.2 No.2 (2014) 93-99 97

temperatures and pressures. An important problem in the thermodynamics of fluids is to derive analytical EoS for real substances, i.e., to obtain explicit relations for the thermodynamic variables in terms of relevant molecular features. Such relations allow us to understand the specific behavior of a real substance in terms of its molecular features and, on practical terms, to use efficiently the usually limited knowledge of the properties of a substance to predict their values in other states. So far, this goal has been partially attained by the ISM EoS. Hence, a conclusion central to our study is that it seems to describe an interesting example of the application of ISM EoS to calculate the molar volume pure refrigerants. The second virial coefficients are calculated from a correlation based on the heat of vaporization, ΔHvap, and the liquid density at the normal boiling point, ρnb. α(T ) and b(T) can also be calculated from second virial coefficients by a scaling rule.
Acknowledgements
The authors thank the computer facilities and the Research Committee of Eslamic AzadUniversity, Marvdasht Branch.
References
[1] G. Ihm, Y. Song, and E.A. Mason, Equation of state for mixtures of non-polar molecular fluids, Mol. Phys. 75 (1992) 897-915.
[2] H. Eslami, M.M. Papari, and A. Boushehri, On the Equation of State for Quantum Systems, J. Phys. Soc. Jpn. 69 (2000) 1731-1734.
[3] M. H. Ghatee, and A. Boushehri, An analytical equation of state for molten alkali metals, Int. J. Thermophys.16 (1995) 1429-1438.
[4] M. H. Ghatee, and A. Boushehri, Equation of state for compressed liquids from surface tension, Int. J. Thermophys. 17 (1996) 945-957.
[5] M.H. Mousazadeh and A. Boushehri, A correlation of densities of liquid natural gas mixtures from surface tension, Fluid Phase Equil. 168 (2000)125-134.
[6] A. Boushehri, F. S. Hashemi and T. Keshavarzi, Prediction of hydrocarbon and CFC liquid mixtures densities, Fluid Phase Equil. 129 (1997) 61-67.
[7] H. Eslami, F. Sabzi, and A. Boushehri, The ISM
Equation of State Applied to Refrigerants Int. J. Thermophys. 20 (1999) 1547-1555.
[8] H. Eslami and A. Boushehri, Equation of state for compressed liquid alkali metals, Fluid Phase Equil. 152 (1998) 235-242.
[9] S. Sheikh, M.M. Papari, and A. Boushehri, Equation of State and Pressure-Volume-Temperature Properties of Refrigerants Based on Speed of Sound Data, Ind. Eng. Chem. Res. 41, 3274 (2002).
[10] H. Eslami, Equation of State for Nonpolar Fluids: Prediction from Boiling Point Constants, Int. J. Thermophys. 21 (2000) 1123-1137.
[11] A. Boushehri and E.A. Mason, Equation of state for compressed liquids and their mixtures from the cohesive energy density, Int. J. Thermophys. 14 (1993) 685-697.
[12] Z. Sharafi and A. Boushehri, Saturated Liquid Densities for 33 Binary Refrigerant Mixtures Based on the ISM Equation of State, Int. J. Thermophys. 26, (2005) 785-794.
[13] D. A. McQuarrie, Statistical Mechanics (Harper Collins, New York, 1976).
[14] J. D. Weeks, D. Chandler, and H. C. Andersen, Role of Repulsive Forces in Determining the Equilibrium Structure of Simple Liquids, J. Chem. Phys. 54 (1971) 5237-5247.
[15] Y. Song and E. A. Mason, Statistical mechanical theory of a new analytical equation of state J. Chem. Phys. 91 (1989) 7840-7853.
[16] Y. Song and E. A. Mason, Equation of state for luids of spherical particles in d dimensions, J. Chem. Phys. 93 (1990) 686-688.
[17] R. A. Aziz, A highly accurate interatomic potential for argon, J. Chem. Phys. 99 (1993) 4518-4525.
[18] G. Ihm, Y. Song, and E.A. Mason, A new strong principle of corresponding states for nonpolar fluids, J. Chem. Phys. 94, (1991) 3839-3848.
[19] E.W. Lemmon, M.O. McLinden, and M.L. Huber, NIST Standard Reference Database 23 (REFPROP Version 7.0), National Institute of Standards and Technology Boulder, Colorado 80305, 2002.
[20]http ://www.tu_dresden.de/mw/iem/kkt/mitarbeiter/lib/kraus/kaeltemittel.html
[21] H. L. Zhang, H. Sato, and K. Watanabe, Vapor Pressure Measurements of 1,1,1,2,3,3-Hexafluoropropane from 300 to 410 K, J. Chem. Eng. Data. 40, (1996) 1281-1284.
[22] G. D. Nicola, and G. Passerini, Saturated Pressure and Gas Phase P−V−T Data for 1,1,2,2,3-Pentafluoropropane (R-245ca), J. Chem. Eng. Data. 47 (2002) 882-886.
[23] B. Zhong, J.M. Bowman, and D.Williams, Paper presented at the International Conference and Exposition Polyurethanes Expo 2001, Columbus, Ohio, September 30 - October 3, (2001).
[24] Sr. G.J. Zyhowski, M.W. Spatz, and S. Yana Motta, Paper presented at the Ninth International Refrigeration and Air Conditioning Conference at Purdue. West Lafayette, Indiana, July, (2002) 16-19.
[25] L.J. Brasz, and W.M. Bilbow, paper R068
98 Z. Sharafi / Journal of Physical Chemistry and Electrochemistry Vol.2 No.2 (2014) 93-99

presented at the 10th
International Refrigeration and Air Conditioning Conference at Purdue. West Lafayette, Indiana July (2004) 12-15,.
[26] P. Hu, Z. S. Chen, and W. L. Cheng, Gaseous PVT Behavior of 1,1,1,2,3,3,3-Heptafluoropropane, J. Chem. Eng. Data, 48 (2003) 337-340.
Z. Sharafi / Journal of Physical Chemistry and Electrochemistry Vol.2 No.2 (2014) 93-99 99

Journal of Physical Chemistry and Electrochemistry
Journal homepage: http://journals.miau.ac.ir/jpe
Journal of Physical Chemistry and Electrochemistry Vol.2 No. 2(2014) 101-110
Islamic Azad University Marvdasht Branch
*Correspondig AuthorE-mail address: [email protected]
Abstract
In this work, the effects of As-doped on the adsorption of oxygen gas on the outer and inner surface of boron nitride nanotube (BNNTs) is investigated. The structural parameters, quantum properties involving: bond length, bond angle, HOMO-LUMO orbital, gapenergy, electron affinity, electronegativity, chemical potential, global hardness, global softness and NMR parameters of BNNTs are calculated at different configurations of O2adsorption on the outer and inner surface of BNNTs by performing density functional theory (DFT) using Gaussian 03 package of program. Our results reveal that the adsorption energy of all models is exothermic and the Eads value in (A and B) undoped models of BNNTs is larger than those of the other models. The results show that As-doped impurities and O2 adsorption decrease the adsorptionenergy of O2gas on the surface of BNNTs andthe gap energy between HOMO-LUMO orbitaland increase the conductivity of nanotube.
Keywords: BNNTs, Adsorption O2, As-doped, DFT, NMR
1. Introduction
Soon after the theoretical and experimental approach on BNNTs [1, 2], Considerable theoretical and experimental efforts have been devoted to investigate the electrical and structural properties and applications of (BNNTs) [3–8]. The structural properties of BNNTs are similar CNTs, while their electronic properties are quite different from CNTs,
The DFT Study of Oxygen Adsorption on Pristine and As-Doped of the (4, 4) Armchair Models BNNTs
M. Rezaei-Sameti 1*and F.Khaje Joushaghani
1Department of Physical Chemistry, Faculty of Science, Malayer University, Malayer, 65174, Iran
however they exhibit only semiconducting properties independent of their chirality and diameter with wide band gaps ranging from 4 to5.5 eV. Like diamond, boron nitride acts as an electrical insulator, but it is an excellent conductor of heat [9-15]. Recent experimental and theoretical studies have a strong interest on the phenomenology of gas molecules such as O2, NO2, NH3, and many other gases, at ambient temperature on nanotube [15-20]. In the last years, several theoretical studies have been performed to study the adsorption of O2 on single-walled carbon nanotubes (SWNT)

using density functional theory (DFT) [21-26]. Recent researches showthat interaction of oxygen with nanotubes have always been an interesting and fascinating, subject for the scientific community for both fundamental and practical reasons, as well as for the possible applications and chemical manufacturing processes in nano device technologies and in chemical sensors[27-34]. Following our pervious research on the electrical structural and NMR parameters SiC-doped AlPNTs, Ga, Al, N, Ge, As doped BPNTs [35-38], in the present work, we investigate the sensitivity of BNNTs toward O2 molecules at different positions of outside and inside of BNNTs and the effect of As dopedon the adsorption. The chemical shielding (CS) tensors originating at the sites of half-spin nuclei, structural properties and quantum parameters involving: HOMO-LUMO orbital, gap energy, other quantum molecular descriptors at different situation of O2 adsorption inside and outside of BNNTs are investigated by performing density functional theory (DFT) using Gaussian 03 package of program.
2. Computational methods
The structural and electrical properties of (4, 4) armchair models of undoped and As-doped of BNNTs (see Figs.1-2) with adsorption of O2 on the surface of nanotubes are investigated by density function theory at B3LYP level of theory using the Gaussian 03 set of programs [39-40]. After optimizing all consider structures of nanotubes, the chemical shielding (CS) tensors at the sites of 11B, 14N nuclei based on the gauge included atomic orbital (GIAO) approach and same level of theory [41]. The calculated CS tensors in principal axes system (PAS) ( 112233 σσσ >> ) are converted to measurable NMR parameters,
chemical shielding isotropic (CSI) and chemical shielding anisotropic (CSA) by using equations (1) and (2), respectively [35-38].
)(31)( 332211 σσσ ++=ppmCSI (1)
2/)()( 221133 σσσ +−=ppmCSA (2)
Adsorption energy (Eads) of oxygen gas on the surface of pristine and As-doped BNNTs was calculated as follow:
BSSEEEEEads OBNNTsOBNNTs ++−= − )(22 (3)
Where EBPNTs-O2 was obtained from the scan of the potential energy of the BNNTs-O2, EBNNTs is the energy of the optimized BNNTs structure, and EO2 is the energy of an optimized O2 and BSSE is base set superposition errors. The quantum molecular descriptors: electronic chemical potential (μ), global hardness (η), electrophilicity index (ω), energy gap, global softness (S), electronegativity (χ) and maximum amount of electronic charge, ∆N, of the nanotubes [42-45] were calculated as the following equitations indicate:
2/)( AI +−=m (4)
x−=m (5)
ηmω 2/2= (6)
2/)( AI −=η (7)
η2/1=S (8)
HOMOLUMOgap EEE −= (9)
ηm−
=∆N (10)
Where I (-EHOMO) is the ionization potential and A (-ELUMO) the electron affinity of the molecule. The electrophilicity index is a measure of the
102 M. Rezaei-Sameti & F.Khaje Joushaghan / Journal of Physical Chemistry and Electrochemistry Vol.2 No.2 (2014) 101-110

Bondlength Unadsobed Model Model Model Model(Å) (A) (B) (C) (D)B42- N41/As 1.46 [2.01] 1.45[2.01] 1.53 [2.01] 1.46[2.17] 1.52[2.15]B31- N41/As 1.46[1.98] 1.46[1.98] 1.52[2.02] 1.46[2.14] 1.52[1.98]B51- N41/As 1.46[1.97] 1.45[1.97] 1.64[1.99] 1.45[3.13] 1.60[2.05]B42-N32 1.46 [1.45] 1.45[1.44] 1.43 [1.44] 1.45 [1.45] 1.43 [1.47]B31- N21 1.46 [1.46] 1.46[1.46] 1.45 [1.46] 1.46 [1.54] 1.44 [1.47]B42-N52 1.46 [1.45] 1.45[1.44] 1.42 [1.44] 1.45 [1.45] 1.42 [1.45]B51- N61 1.46 [1.45] 1.45[1.45] 1.51 [1.44] 1.45 [1.42] 1.47 [1.49]B31-N31 1.46 [1.44] 1.45[1.44] 1.41 [1.44] 1.45 [1.46] 1.42 [1.43]B51- N51 1.46 [1.44] 1.45[1.44] 1.50 [1.44] 1.45 [1.41] 1.48 [1.49]Bond angle(˚)<B31-N41/As-B42 115[88] 115[88] 110[90] 116[78] 123[96]<N41/As-B42-N32 118[118] 119[118] 116[117] 119[107] 113[112]<N21-B31-N41/As 120[114] 120[114] 117[114] 120[68] 116[110]<N41/As-B42-N52 119[119] 120[119] 119[117] 120[133] 117[109]<N61-B51-N41/As 120[114] 119[114] 111[113] 118[96] 115[106]<B51-N41/As-B42 116[87] 119[88] 119[91] 117[63] 115[89]<B51-N41/As-B31 120[95] 119[95] 115[98] 119[49] 122[98]<N41/As-B31-N31 118[124] 116[124] 119[122] 119[147] 114[118]<N51-B51-N41/As 119[125] 115[125] 130[124] 120[120] 113[116]
electrophilic power of a molecule.
3. Results and discussion
3.1 Structural PropertiesIn this work, we begin our study with
oxygen gas adsorption on the outer and inner surface of pristine and As-doped (4, 4)
armchair BNNTs with the diameters 5.4 Å.For this aim,we consider four models (A-D) for adsorption of O2 gas on the surface of nanotube. Model A shows the vertical adsorption of O2 gas on the outer surface of nanotube, Model B indicates the vertical adsorption of O2 gas on the inner surface of nanotube, Model C shows the parallel adsorption of O2 gas on the outer surface of nanotube, and Model D demonstrates the parallel adsorption of O2 gas on the inner surface of nanotube (See Figures 1-2).The structural properties such as bond length and
Table 1. Structures parameters of O2 adsorption on undoped and As-doped of (4, 4) armchair models of BNNTs, first value for undoped and second value for As-doped of (A-D)models of adsorption.see Fig. 1,2)
(A-model-undoped) (B-model-undoped)
(C-model-undoped) (D-model-undoped)
Fig. 1
(A-model-As-doped) (B-model-As-doped)
(A-model-undoped) (B-model-undoped)
(C-model-undoped) (D-model-undoped)
Fig. 1
(A-model-As-doped) (B-model-As-doped)
Fig. 1 2D views of O2 adsorption on the undoped of (4, 4) armchair model of BNNTs;
Model A shows the vertical adsorption of O2 gas on the outer surface of nanotube.
Model B shows the vertical adsorption of O2 gas on the inner surface of nanotube.
Model C shows the parallel adsorption of O2 gas on the outer surface of nanotube.
Model D shows the parallel adsorption of O2 gas on the inner surface of nanotube
(C-model-As-doped) (D-model-As-doped)
Fig. 2
Fig. 2. 2D views of O2 adsorption on the As-doped of (4, 4) armchair model of BNNTs; For (A-D) models (see Fig. 1).
M. Rezaei-Sameti & F.Khaje Joushaghan / Journal of Physical Chemistry and Electrochemistry Vol.2 No.2 (2014) 101-110 103

bond angel of pristine and four adsorption models are given in Table 1.Comparing results reveal that the bond lengthof B42-N41,B31-N41,B51-N41 of (B, D) undoped models increase from 1.46 to 1.52, 1.52, and 1.60Å respectively. On the other hand, the adsorption of O2on the B model caused that the bond length of B51- N61, B51- N51increase from 1.46 to 1.51 and 1.50 Å respectively, due to interaction πelectron of O2gas with nanotube.And also the s-character of the hybridized orbitals decrease which leads to an increase in the interaction of nanotube orbitals with the O2 orbitals. With doping As in the B41 nuclei of nanotube, the B42- N41,B31- N41 ,B51- N41bond length increase from 1.46 to 2.01, 198 and 1.97 Å respectively, because the radius of As is more than B atoms. The adsorption of O2 gas increases significantly the bond length of neighbourhood As-doped. The increaseof bond length on the C model is larger than other models. The bond angles of neighbourhood As-doped of BNNTs in all models decrease from pristine models due to more radius of As respect B atoms. The bond angle of <B31-N41/
As-B42of B model of undoped nanotube decrease from 115 to 110oand at Dmodel of undoped this bond angle increase to 123o. The bond angles <B31-N41/As-B42, <N21-B31-N41/As, <B51-N41/As-B42 and <B51-N41/As-B31of Cmodel decrease from original values in As-doped of nanotube and <N41/As-B31-N31 of this model increase significantly to 147oin As doped.
The results of adsorption energies between nanotube and O2gas calculated on Eqs. 3 are given in Table 2. The results show that the adsorption energy of all models is exothermic and at the (A and B) models the adsorption energy values are more than other models. On the other hand with doping As, the adsorption energy decreases largely from undoped model, this result demonstrates that As-doped is not favorable for O2 adsorption in all models. Base set superposition error for all models is 0.01 eV.
3.2 Electronic and quantum propertiesTable 2 presents the results for the
HOMO, LUMO, gapenergies, and quantum
Table 2. Quantum parameters of O2 adsoption on pristine and As-doped of (4, 4) armchair models of BNNTs.BNNT(4,4)
O2 pristine As-doped
Model(A)
Model(B)
Model( C)
Model(D)
Un doped
AsDoped
Un doped
AsDoped
Un doped
AsDoped
Un doped
AsDoped
E(ads)/kcal/mol - - - -19.45 -0.27 -19.37 -0.13 -18.87 -0.12 -17.41 -1.36
E(Bsse)/ev - - - 0.01 0.012 0.01 0.03 0.01 0.02 0.01 0.02
E(HOMO)/ev -6.81 -6.32 -6.38 -6.23 -5.04 -6.29 -5.29 -6.47 -6.06 -6.32 -6.16
E(LUMO)/ev -4.77 -0.11 -0.75 -4.18 -3.05 -1.68 -1.96 -4.79 -2.01 -1.95 -3.87
E(gap)/ev 2.04 6.21 5.63 2.05 1.99 4.61 3.33 1.68 4.05 4.37 2.29
η/ev 1.02 3.11 2.82 1.03 0.99 2.31 1.67 0.84 2.02 2.19 1.14
S/(ev)-1 0.49 0.16 0.18 0.48 0.51 0.22 0.30 0.59 0.25 0.23 0.44
µ/ev -5.79 -3.22 -3.57 -5.21 -4.05 -3.99 -3.63 -5.63 -4.03 -4.14 -5.01
χ/ev 5.79 3.22 3.57 5.21 4.05 3.99 3.63 5.63 4.03 4.14 5.01
ω/ev 16.43 1.67 2.26 13.18 8.28 3.45 3.94 18.87 4.02 3.91 11.01
∆N 5.68 1.03 1.27 5.06 4.09 1.73 2.17 6.70 1.99 1.89 4.39
104 M. Rezaei-Sameti & F.Khaje Joushaghan / Journal of Physical Chemistry and Electrochemistry Vol.2 No.2 (2014) 101-110

parameters obtained by the DFT calculations and Eqs. (4-9).Calculated gap energies for the isolated nanotubes are 6.21eV in pristine and 5.43 eV in As-doped models. With adsorbing O2gas on the outer surface of the nanotube, the gap energy between HOMO-LUMO orbital decrease from original values due to donor electron effects of O2gas. This lowering ofgap energy with O2 adsorption may be able to increase the reactivity of the O2/BNNTs complex, and shows charge transfer to take place between the π electron of O2 and BNNTs sidewall.
The electronic chemical potential (μ), global hardness (η) of O2 adsorption on surface of BNNTsis presented in Table 2. The results show that, the chemical potential and global hardness decrease with decrease in gap energy. The results also show that thechemical potential and global hardness in C undoped model of nanotube is lower than other models. Therefore, we can predict that adsorbing O2 decreases the stabilities of pristine nanotube. The comparison of electronegativity (χ) of the nanotubes reveals that with adsorbing O2
the electronegativity increases from pristine models. The electronegativity of undoped C model is larger than other models and the electronegativity of As-doped B model is lower than other models. By bringing the O2gas and nanotubes together, electrons will flow from that of lower electronegativity atoms to that of higher electronegative atom. Therefore, the difference in electronegativity drives the electron transfer. As a result, electrons will flow from a definite occupiedorbital in a nanotube and will go into a definite empty orbital in anO2 molecule. The overlap between the exchanging orbitals will be critical in determining the energychanges. In addition, the values for gapenergy and hardness for O2 molecule is smaller than the nanotube;these
results lead that O2 molecule having higher polarizability than the nanotubes. The amount of charge transfer (∆N) between the O2 molecule and (A-D) models of adsorption, as calculated using the Eq. (10) and given in Table 2. In all models, ∆N values are positive and indicate that O2 molecule act as an electron acceptor. The ∆N values of undoped Cmodel aresignificantly larger than other models and therefore in this model, the charge transfer from nanotube to O2 gas is larger than other model.
3.3 NMR parametersThe NMR (CSI and CSA) parameters
of 11B and 14N nuclei for the pristine, As-doped of (4, 4) armchair BNNTs in present of O2-adsorption ((A-D) models Fig.1, 2) are calculated by Eqs (1, 2) and given in Tables (3-6). A look at results of A model (Table 3) show that withdoping As atom the CSI values of 11B nuclei at the sites B31, B42, B51 decrease significantly from 82, 80 and 81 ppm to 61,71, and 63 respectively. On the otherwise, the CSA values of 11B nuclei at the layers 1, 3, 5, 7 increases from undoped model and on the other layers increase. The direction of changes for isotropic and anisotropic chemical shielding because of difference in physical concept of these parameters is different. The CSI values of 14N nuclei at the N21, N32, and N61 with doping As decrease significantly from undoped model, due to donor electron effect of As-doped. The CSA valuesof 14N nuclei at the layers 1, 3, 5, 7 decreases from undoped model and the other layers increase.
In the B model, the CSI values at B31, B42, B51, B52 sites decrease largely from original values. The CSA values of 11B nuclei at the layers 1, 3, 5, 7 are decreased from undoped model and the other layers increase, the similar results are shown for A model. The CSI values
M. Rezaei-Sameti & F.Khaje Joushaghan / Journal of Physical Chemistry and Electrochemistry Vol.2 No.2 (2014) 101-110 105

Table 3. NMR parametres of O2 adsorption on undoped and As-doped of (4, 4) armchair BNNTs, (A) model of Fig.1.B-11 CSI
(ppm)CSA
(ppm)N-14 CSI
(ppm)CSA
(ppm)nuclei nucleiUndoped Doped Undoped Doped Undoped Doped Undoped Doped
B11 80 84 18 37 N11 146 147 80 65B12 80 80 19 34 N12 146 143 75 68B13 80 80 20 31 N13 146 146 80 69B14 80 80 19 32 N14 146 146 82 69B21 84 86 34 28 N21 137 113 132 157B22 84 82 33 27 N22 136 136 135 167B23 84 84 34 30 N23 136 135 135 162B24 84 84 34 30 N24 136 139 135 169B31 82 61 15 29 N31 134 120 139 106B32 82 83 15 25 N32 134 120 135 68B33 82 81 15 24 N33 134 134 136 103B34 82 83 15 26 N34 134 135 135 86B41 82 83 35 26 N41/As 124 - 164 -B42 80 71 36 24 N42 140 138 138 167B43 82 81 34 31 N43 140 140 137 162B44 82 82 34 29 N44 140 142 138 163B51 81 63 19 26 N51 141 126 141 113B52 81 83 16 25 N52 139 125 138 67B53 82 81 15 23 N53 140 139 137 105B54 82 83 15 26 N54 140 141 136 88B61 82 83 35 31 N61 117 112 165 152B62 81 80 38 26 N62 134 135 137 164B63 82 82 35 32 N63 134 134 137 161B64 82 82 35 30 N64 134 136 137 169B71 84 86 17 28 N71 135 137 148 100B72 84 84 17 27 N72 136 133 146 98B73 84 84 17 26 N73 136 136 145 107B74 84 83 17 26 N74 136 135 144 103B81 80 80 53 49 N81 147 147 121 123B82 80 80 53 50 N82 146 145 122 126B83 80 80 53 49 N83 146 146 122 125B84 80 80 53 50 N84 146 146 123 125As As 1815 546
Table 4 NMR parametres of O2 adsorption on undoped and As-doped of (4, 4) armchair BNNTs, (B) model of Fig.1.B-11 CSI
(ppm)CSA
(ppm)N-14 CSI
(ppm)CSA
(ppm)nuclei nuclei
Undoped Doped Undoped Doped Undoped Doped Undoped DopedB11 80 84 45 37 N11 143 146 91 63B12 80 80 44 35 N12 145 142 97 58B13 80 80 46 30 N13 147 147 87 68B14 80 80 43 33 N14 146 146 95 42B21 84 86 22 27 N21 137 114 181 143B22 85 83 18 27 N22 139 136 171 170B23 84 84 22 31 N23 136 135 184 161B24 84 84 21 29 N24 135 139 180 171B31 82 70 33 7 N31 129 123 67 118B32 80 82 31 26 N32 127 113 68 59B33 82 81 33 24 N33 133 133 54 105B34 81 83 32 27 N34 135 135 52 81B41 85 85 17 25 N41/As 145 - 172 -B42 81 72 17 21 N42 125 138 143 169B43 81 81 23 32 N43 138 140 179 161B44 81 82 20 28 N44 140 143 173 164B51 82 63 32 16 N51 147 119 64 126B52 104 83 6 27 N52 133 124 63 68B53 81 81 32 23 N53 139 139 57 107B54 81 83 31 27 N54 141 141 51 84B61 83 84 21 30 N61 138 113 175 148B62 84 82 23 26 N62 137 135 149 165B63 82 82 24 32 N63 135 134 176 161B64 82 82 21 29 N64 134 136 173 170B71 84 87 33 29 N71 135 137 53 98B72 83 85 33 28 N72 136 133 42 95B73 84 84 32 25 N73 136 136 58 108B74 83 84 33 26 N74 136 135 47 101B81 80 80 42 49 N81 148 148 117 123B82 80 80 41 51 N82 143 145 120 127B83 80 80 41 49 N83 145 146 118 125B84 80 80 40 50 N84 146 146 117 126As As 1675 549
106 M. Rezaei-Sameti & F.Khaje Joushaghan / Journal of Physical Chemistry and Electrochemistry Vol.2 No.2 (2014) 101-110

Table 5 NMR parametres of O2 adsorption on undoped and As-doped of (4, 4) armchair BNNTs, (C) model of Fig.1.B-11 CSI
(ppm)CSA
(ppm)N-14 CSI
(ppm)CSA
(ppm)nuclei nuclei
Undoped Doped Undoped Doped Undoped Doped Undoped DopedB11 81 77 32 16 N11 146 131 67 77B12 80 79 29 14 N12 146 146 61 87B13 81 80 32 18 N13 146 146 67 74B14 81 81 29 22 N14 146 145 62 69B21 84 84 29 30 N21 136 215 168 47B22 85 80 30 30 N22 136 131 160 140B23 84 83 29 35 N23 136 137 168 134B24 85 84 30 35 N24 136 135 160 138B31 83 106 26 19 N31 135 160 92 96B32 81 81 22 19 N32 135 135 110 86B33 83 82 26 16 N33 135 135 92 130B34 81 80 22 13 N34 135 135 110 141B41 79 81 31 31 N41/As 114 - 206 -B42 81 74 34 15 N42 135 143 163 151B43 79 81 31 33 N43 114 143 207 134B44 81 81 34 35 N44 135 140 167 140B51 79 88 35 13 N51 139 147 98 97B52 77 80 26 19 N52 138 144 124 101B53 79 81 35 36 N53 140 143 98 132B54 77 79 27 12 N54 138 139 124 146B61 79 81 32 32 N61 105 145 212 108B62 80 78 35 37 N62 128 133 165 146B63 80 82 32 33 N63 104 135 213 128B64 80 81 35 36 N64 128 131 165 135B71 85 84 27 17 N71 137 138 95 130B72 83 84 23 18 N72 134 131 122 154B73 85 84 27 15 N73 137 137 95 140B74 83 83 23 17 N74 134 134 122 154B81 81 81 48 51 N81 146 147 128 115B82 80 80 50 49 N82 145 148 122 122B83 81 80 48 52 N83 146 146 128 118B84 80 79 50 54 N84 145 145 122 122As As 1042 1127
Table 6 NMR parametres of O2 adsorption on undoped and As-doped of (4, 4) armchair BNNTs, (D) model of Fig.1.
B-11 CSI(ppm)
CSA(ppm)
N-14 CSI(ppm)
CSA(ppm)nuclei nuclei
Undoped Doped Undoped Doped Undoped Doped Undoped DopedB11 80 84 42 23 N11 143 147 90 67B12 80 79 38 21 N12 142 138 75 100B13 80 81 42 16 N13 147 147 89 81B14 80 79 38 23 N14 145 145 70 90B21 83 85 26 32 N21 137 121 177 79B22 83 83 27 34 N22 135 135 177 124B23 84 85 21 34 N23 135 136 182 117B24 84 83 26 35 N24 136 138 175 110B31 84 70 28 11 N31 133 125 64 115B32 79 78 30 17 N32 129 146 95 75B33 82 82 31 12 N33 135 136 47 140B34 81 82 29 8 N34 134 134 75 155B41 79 80 22 26 N41/
As 99 - 197 -B42 79 89 28 28 N42 139 137 169 125B43 81 81 20 35 N43 141 143 176 122B44 81 82 27 36 N44 133 135 173 115B51 106 121 22 24 N51 169 172 30 132B52 79 78 29 12 N52 134 140 103 116B53 82 82 30 12 N53 142 142 51 142B54 80 80 28 9 N54 140 141 79 155B61 79 81 23 34 N61 140 136 159 97B62 78 80 30 36 N62 133 130 173 121B63 81 82 21 34 N63 136 137 174 122B64 81 82 27 36 N64 127 126 173 112B71 85 87 28 18 N71 135 138 22 137B72 83 83 30 9 N72 131 128 85 172B73 84 84 31 15 N73 137 138 55 146B74 83 83 30 9 N74 135 135 81 170B81 80 80 41 53 N81 145 147 121 123B82 80 80 46 53 N82 146 145 119 116B83 80 80 41 52 N83 147 147 121 119B84 80 80 46 53 N84 147 146 116 113As As 75 1229
M. Rezaei-Sameti & F.Khaje Joushaghan / Journal of Physical Chemistry and Electrochemistry Vol.2 No.2 (2014) 101-110 107

of 14N nuclei at the N21, N32, N51 and N61 sites of As-doped decrease significantly from undoped model. In addition, the CSA values of 14N nuclei at the layers 1, 4, 6 decrease and other layers increase. The results of Table 5 for C models reveal that the CSI values of 11B
nuclei with As-doped at the B42 site decrease largely from 81 to 74ppm and at sites B31 and B52 increase from 83, 77 ppm to 106 and 80 respectively. The CSA value of 11B nuclei at the layers 1, 3, 7 decreases from undoped model and the other sites increase. The CSI values of
A1-model-undoped B1-model-undoped C1-model-undoped D1-model-undoped
A2-model-undoped B2-model-undoped C2-model-undoped D2-model-undoped
Fig. 3 HOMO-LUMO –undoped(44)
Fig. 3 Comparisons the HOMO-LUMO structures of O2 adsorption on the undoped of (4,4) armchair model of BNNTs, index (1) used for HOMO and index (2) for LUMO (A-D) models (see Fig.1).
(a3)
A1-model-Asdoped B1-model-Asdoped C1-model-Asdoped D1-model-Asdoped
A2-model-Asdoped B2-model-Asdoped C2-model-Asdoped D2-model-Asdoped
Fig. 4 HOMO-LUMO –Asdoped(44)
Fig. 4 Comparisons the HOMO-LUMO structures of O2 adsorption on the As-doped of (4,4) armchair model of BNNTs, index (1) used for HOMO and index (2) for LUMO (A-D)models (see Fig.2).
108 M. Rezaei-Sameti & F.Khaje Joushaghan / Journal of Physical Chemistry and Electrochemistry Vol.2 No.2 (2014) 101-110

14N nuclei at the N21, N31, N43, N52, N61, and N63 sites increase from undoped model. The CSA values of 14N nuclei at the layers 2, 4, 6, 8decreases from undoped model and the other layers increase.The calculated results of D model (Table 6) show that the CSI values of 11B nuclei with As-doped at B42 and B51 sites increase from 79, 106 ppm to 89, 121ppm, and at site B31 decrease from 84 to 76 ppm. CSA values of 11B nuclei at odd layers decrease and even layers increase from undoped models. On the other hand, the CSI values of 14N nuclei at the sites N21, N31 and N61 decrease and at sites N32, N51 and N52 increase from undoped model. In addition, the CSA values of 14N nuclei at even layers decrease and at layers 3, 5, 7 increase significantly from undoped models.The comparison results show that the CSI and CSA values depended on either As-doped or configurations of O2 adsorption.
4. Conclusions
In this research we studied the adsorptions of O2gas on four models of the outer and inner surface of pristine and As-doped (4, 4) armchair BNNTs by means of density functional theory (DFT) calculations. The results reveal that adsorption energy of undoped of nanotube in four models are exothermic and at the (A and B)models are more than other models, so the adsorption O2 on surface of these models are favorable than other models. With doping As in all models the adsorption energy is decrease.The gap energy between LUMO-MOMO orbital with adsorbing O2 gas on the surface of nanotube decrease and so the conductivity properties of nanotube are increase. The gap energy of undoped C model is lower than other models. The comparing results of quantum properties reveal that the global hardness, electronic chemical potential and stability of
nanotube are decrease and so the reactivity of the O2 adsorbed is increase.The comparison results of NMR parameters show that the CSI and CSA values depended on either As-doped or configurations of O2 adsorption.
Acknowledgment
The authors thank the centre of computational nano of Malayer University for supporting this research.
References
[1] X. Blase, A. Rubio, S.G. Louie, M.L. Cohen,Euro.phys. Lett. 28(1994) 335.
[2] N.G. Chopra, R.J. Luyken, K. Cherrey, V.H. Crespi, M.L. Cohen, S.G. Louie, A. Zettl,Science.269(1995) 966.
[3]Q. Dong, X. M. Li, W. Q. Tian, X. R. Huang, C. C. Sun,J. Mol. Stru.(THEOCHEM) 948 (2010)83.
[4] E. Bengu, L.D. MarksPhys. Rev. Lett. 86 (2001)2385.[5] K.B. Shelimov, M. Moskovits,Chem. Mater.
12(2000) 250.[6] R.J. Baierle, P. Piquini, T.M. Schmidt, S.J. Fazzio,J.
Phys. Chem. B. 110 (2006) 21184.[7] H. Chen, Y. Chen, C.P. Li, H. Zhang, J.S. Williams,
Y. Liu, Z. Liu, S.P. Ringer,Adv.Mater. 19(2007) 1845.
[8] D. Golberg, Y. Bando, M. Eremets, K. Takemura ,K. Kurashima , H. Yusa,Appl. Phys. Lett.69(1996) 2045.
[9] H. Chen, H. Zhang, L. Fu, Y. Chen, J.S. Williams, C. Yu, D. Yu,Appl. Phys. Lett. 92 (2008) 243105.
[10] S.A. Shevlin, Z.X. Guo, Phys. Rev. B. 76 (2007) 024104.
[11] A. Ahmadi, J. Beheshtian. N. L. Hadipour, (2011).Struct.Chem. 22,183.
[12] A. Ahmadi, M. Kamfiroozi, J. Beheshtian, N. L. Hadipour,Struct Chem. 22(2011) 1261.
[13] S.F. Wang, J.M. Zhang, K.W. Xu,Physica B. 405(2010) 1035.
[14] R. Chegel, S. Behzad, Solid State Comm. 151(2011) 259.
[15] H. Roohi, S. Bagheri,J. Mol. Stru. (THEOCHEM) 856(2008) 46.
[16]J. Beheshtian, H. Soleymanabadi ,M. Kamfiroozi ,A. Ahmadi,J. Mol. Model.18(2011) 2343.
[17] V. Nirmala, P. Kolandaivel,J. Mo. Struct. (THEOCHEM).817(2007) 137.
[18] M. Mirzaei, Z.Phys. Chem. 223(2009) 815.[19] L. Chen, G.Q. Zhou, C. Xu, T. Zhou, Y. Huo,J.
Mol. Struct.(THEOCHEM).900(2009) 33.[20] R. Arenal, A.C. Ferrari, S. Reich, L. Wirtz, J.Y.
M. Rezaei-Sameti & F.Khaje Joushaghan / Journal of Physical Chemistry and Electrochemistry Vol.2 No.2 (2014) 101-110 109

Mevellec, S. Lefrant, A. Rubio, A.Loiseau,.Nano.Lett. 6(2006)1812
[21] X. Pan, Q. X. Cai, W. L. Chen, G.L. Zhuang, X.N. Li, J. G. Wang,Comp. Mat.Sci. 67(2013)174.
[22] E.M. Fernandez, R.I. Eglitis, G. Borstel, L.C. Balbas,Comp. Mat.Sci. 39(2007)587.
[23] R. L. Liang,Y. Zhang, J. M. Zhang,Appl. Surf. Sci. 257(2010) 282.
[24] H. R. Liu, H. Xiang, X. G. Gong,J. Chem. Phys. 135(2011) 214702.
[25] A. Ricca, J. A. Drocco, Chem. Phys. Let.362(2002) 217.
[26] M. Barberio, P. Barone, A. Bonanno, F. Xu, Super.Microstr.46(2009) 365.
[27] F. Xu, M. Minniti, C. Giallombardo, A. Cupolillo, P. Barone, A. Oliva, L. Papagno, Surf. Sci. 601(2007) 2819.
[28] A. B. Silva-Tapia, X. Garcı-Carmona , L. R. Radovi,CARBON ,50(2012) 1152.
[29] P. Giannozzi, R. Car, G. Scoles,J. Chem. Phys.118(2003) 1003.
[30] Y. Chen, C. L. Hu, J. Q. Li, G. X. Jia, Y. F. Zhang,Chem. Phys. Let. 449(2007) 149.
[31] A. Montoya, J. O. Gil, F. Mondragón, T. N. Truong ,Fuel. Chem. Div. Prep. 47(2002) 424.
[33] T. Baei, A. Ahmadi Peyghan, Z. Bagheri,Chin. Chem. Let.23(2012) 965.
[34] Y.L. Wang, S. Tan, J. Wang, Z.J. Tan, Q.X. Wu, Z. Jiao, M.H. Wu,Chin. Chem. Lett. 22(2011) 603.
[34] R. Khorrampour,M.D.Esrafili,N.L.Hadipour,Physica E, 41(2009)1373.
[35] M. Rezaei-Sameti,Physica E. 44(2012) 1770.[36] M. Rezaei-Sameti, Physica B. 407(2012) 3717.
[37] M. Rezaei-Sameti,Physica B. 407(2012) 22.[38] M. Rezaei-Sameti,Quant. Matt., 2(2013) 1.[39] C. Lee, W. Yang,R. G. Parr, (1988). Phys. Rev.
B. 37785.[40] M.J.Frisch, G.W. Trucks, H.B. Schlegel, G.E.
Scuseria, M.A. Robb, J. Cheeseman, V.G. Zakrzewski, J.A. Montgomery, R.E. Stratmann, J.C. Burant, S.Dapprich, M. Millam, J.M. Daniels, A.D. Kudin, K.N. Strain, M.C. Farkas, O. Tomasi, J. Barone,V. Cossi Cammi, R. Mennucci, B. Pomelli, C. Adamo, C. Clifford, S. Ochterski, J. Petersson, G.A. Ayala, P.Y. Cui, K. Morokuma, Q. Salvador, P. Dannenberg, J.J. Malick, D.K. Rabuck, A.D. Raghavachari, K. Foresman, J.B. Cioslowski, J.J.V. Ortiz, B.B. Stefanov, G. Liu, A. Liashenko, P. Piskorz, I. Komaromi, R. Gomperts, R.L. Martin, D.J. Fox, T. Keith, M.A. Al-Laham, C.Y. Peng, A. Nanayakkara, C. Gonzalez, M. Challacombe, P.M.W. Gill, B. Johnson, W. Chen, M.W. Wong, J.L. Andres, C. Gonzalez, M. Head-Gordon, E.S. Replogle, J.A. Pople, GAUSSIAN 98.
[41] R. Ditchfield, W.J. Hehre, J. A. Pople, J.Chem.Phys. 54(1972) 724 .
[42] M. T. Baei, M. Moghimi, P. Torabi, A. VarastehMoradi,Comput. Theo1. Chem. 972 (2011)14.
[43] P. K. Chattaraj, U. Sarkar,D. R. Roy, Chem. Rev. 106(2006) 2065.
[44] K. K. Hazarika, N. C. Baruah, R. C. Deka,Struct. Chem. 20(2009). 1079.
[45] R. G. Parr, L. Szentpaly, S. Liu,J. Am. Chem. Soc. 121(1999) 1922.
110 M. Rezaei-Sameti & F.Khaje Joushaghan / Journal of Physical Chemistry and Electrochemistry Vol.2 No.2 (2014) 101-110