Embed Size (px)
Citation preview
lable at ScienceDirect
Journal of Molecular Structure 1147 (2017) 427e437
Contents lists avai
Journal of Molecular Structure
journal homepage: ht tp: / /www.elsevier .com/locate/molstruc
Raman spectra and DFT calculations for botryococcene andmethylsqualene hydrocarbons from the B race of the green microalgaBotryococcus braunii
Mehmet Tatli a, Hye Jin Chun b, Charles H. Camp Jr. c, Jingting Li d, Marcus T. Cicerone c,Wei-Chuan Shih d, e, f, g, Jaan Laane b, Timothy P. Devarenne a, *
a Department of Biochemistry & Biophysics, Texas A&M University, College Station, TX, United Statesb Department of Chemistry, Texas A&M University, College Station, TX, United Statesc Biosystems and Biomaterials Division, National Institute of Standards and Technology, Gaithersburg, MD, United Statesd Department of Electrical and Computer Engineering, University of Houston, Houston, TX, United Statese Department of Biomedical Engineering, University of Houston, Houston, TX, United Statesf Department of Chemistry, University of Houston, Houston, TX, United Statesg Program of Materials Science and Engineering, University of Houston, Houston, TX, United States
a r t i c l e i n f o
Article history:Received 1 May 2017Accepted 28 June 2017Available online 30 June 2017
Keywords:Botryococcus brauniiBotryococceneDFT calculationsMethylsqualeneRaman spectroscopyTriterpenoids
* Corresponding author.E-mail address: [email protected] (T.P. Devarenne).
http://dx.doi.org/10.1016/j.molstruc.2017.06.1260022-2860/© 2017 Elsevier B.V. All rights reserved.
a b s t r a c t
Botryococcus braunii, a green colonial microalga, is a prodigious producer of liquid hydrocarbon oils thatcan be used as renewable feedstocks for producing combustion engine fuels. The B race of B. brauniimainly produces the triterpene hydrocarbons known as botryococcenes, which have over twenty knownstructures. Minor hydrocarbons in the B race include the triterpene methylsqualenes. Here we report anexamination of the molecular structure for ten botryococcenes and five methylsqualenes using Ramanspectroscopy and density functional theory (DFT) calculations in an effort to distinguish between thesestructurally similar molecules by spectroscopic approaches. The DFT calculations show that these mol-ecules have between 243 and 271 vibrational frequencies. A comparison of the experimental Ramanspectroscopy and DFT calculations indicates several spectral regions such as those for n(C]C) stretching,CH2/CH3 bending, and ring bending can be used to distinguish between these molecules. In an extensionof this analysis, a broadband coherent anti-Stokes Raman spectroscopy (BCARS) analysis was used toclearly distinguish between several botryococcenes isomers.
© 2017 Elsevier B.V. All rights reserved.
1. Introduction
Algae produced lipids are considered a potential renewablefeedstock source to replace petroleum-based transportation fuelsin order to address concerns over global climate changes due tofossil fuel derived greenhouse gas build up [1]. One alga that pro-duces large amounts of lipids in the form of liquid hydrocarbons isthe green colony-forming microalga Botryococcus braunii [2]. Hy-drocarbons produced by B. braunii have been identified as majorconstituents of currently used petroleum and coal deposits indi-cating contribution by this organism to the formation of thesedeposits over geologic time [3e7]. Thus, these B. braunii hydro-carbons can be converted into combustion engine fuels using
conventional petroleum hydrocracking procedures [8e10].B. braunii is divided into three chemical races, A, B, and L, that
are defined by the type of hydrocarbon produced [2]. The B race ofB. braunii, the focus of this study, produces 30e40% of its dry weightas hydrocarbons in the form of two types of isoprenoid triterpenes;botryococcenes as the major accumulating hydrocarbons, andmethylated squalenes as minor hydrocarbon components [2].Botryococcenes and squalenes follow a very similar biosyntheticroute and thus are very similar in structurewith the exception of anethene branch in the middle of the botryococcene structure that isnot present in squalenes (Fig. 1). Both botryococcenes and meth-ylated squalenes start as C30 molecules, which are methylated atcarbons 3, 7, 16, and 20 for botryococcenes and carbons 3, 7, 18, and20 for squalenes (Fig. 1) to generate molecules ranging from C30 -C34 [2]. Additionally, botryococcenes can be found in acyclic orcyclic forms with the ring structures on either end of the molecule,

Fig. 1. Hydrocarbons purified from the B race of B. braunii for use in Raman spectroscopy for this study.
M. Tatli et al. / Journal of Molecular Structure 1147 (2017) 427e437428
while methylsqualenes are always acyclic (Fig. 1). This structuraldiversity has led to the identification of over twenty differentbotryococcene structures [2,11] and five different methylsqualenesranging from monomethylsqualene to tetramethylsqualene[12e14] (Fig. 1).
These structural differences between and among botryo-coccenes and methylsqualenes should offer specific spectral sig-natures that could be used to distinguish between the differentmolecules. Such information could be useful for monitoring theproduction of specific hydrocarbons during large scale algal growth

Table 1Vibrations of B. braunii race B botryococcenes.
Symbol Vibration Showacene 2 Wolficene 4 Braunicene 6 Cyclic C33-1 7 Cyclic C33-2 8 Cyclic C33-3 9 C34 Botryococceneisomer 10
WavenumberRange (cm�1)
Number ofvibrations
WavenumberRange (cm�1)
Numberof vibrations
WavenumberRange (cm�1)
Number ofvibrations
WavenumberRange (cm�1)
Number ofvibrations
WavenumberRange (cm�1)
Number ofvibrations
WavenumberRange (cm�1)
Number ofvibrations
WavenumberRange (cm�1)
Number ofvibrations
n (CH3) CH3 stretch 2886e3045 24 2898e3025 24 2885e3025 24 2886e3044 24 2898e3027 27 2887e3019 24 2871e3045 27d (CH3) CH3 deformation 1253e1463 24 1345e1474 24 1352e1474 24 1325e1477 24 1322e1474 27 1331e1472 24 1308e1466 27r (CH3) CH3 rock 753e1222 16 792e1335 16 555e1329 16 885e1309 16 646e1322 18 477e1306 16 509e1300 18t (CH3) CH3 torsion 100e285 8 108e319 8 102e335 8 99e290 8 150e316 9 138e315 8 145e302 9n (CH2) CH2 stretch 2872e3117 20 2898e3116 20 2885e3116 22 2886e3116 24 2898e3118 20 2887e3125 24 2871e3119 22d (CH2) CH2 deformation 1406e1463 10 1411e1474 10 1412e1474 11 1407e1477 12 1366e1474 10 1409e1472 12 1372e1466 11u (CH2) CH2 wag 916e1377 10 1148e1384 10 907e1363 11 903e1380 12 909e1368 10 909e1366 12 912e1377 11t (CH2) CH2 twist 693e1318 10 729e1332 10 692e1321 11 558e1321 12 691e1335 10 692e1331 12 693e1307 11r (CH2) CH2 rock 737e1052 10 729e1033 10 692e1027 11 647e997 12 691e997 10 589e1047 12 536e1013 11n (CH) ]CeH stretch/
eCeH stretch2872e3117 8 2898e3044 8 2885e3115 8 2886e3044 8 2898e3027 9 2887e3024 8 2871e3117 9
ui (CH) CH wag (in-plane) 1026e1406 8 1064e1416 8 1078e1378 8 995e1468 8 1061e1439 9 986e1350 8 1022e1408 9uo (CH) CH wag (out-of-
plane)818e1303 8 813e1345 8 852e1357 8 856e1322 8 857e1370 9 857e1020 8 693e1320 9
n (Ring) Six-membered ringstretch
e e 741e1349 6 727e1352 6 736e1414 6 792e1415 6 692e1415 6 e e
b (Ring) Six-membered ringbending (in-plane)
e e 408e486 3 407e692 3 407e647 3 411e646 3 337e594 3 e e
b (Ring) Six-membered ringbending (out-of-plane)
e e 466e693 3 349e709 3 358e707 3 349e691 3 285e647 3 e e
n (C]C) C]C stretch 1643e1679 6 1648e1679 5 1650e1670 5 1649e1671 5 1649e1664 5 1649e1663 5 1644e1667 6n (CeC) CeC stretch 718e1406 24 713e1411 20 718e1407 21 713e1414 22 712e1415 22 692e1415 22 711e1416 27b (CeCeC) CeCeC angle bend 135e632 11 283e693 8 173e709 9 232e707 10 192e691 9 186e714 11 145e629 14b (C]CeC) C¼CeC angle bend 288e632 10 388e693 5 248e709 6 301e707 6 257e691 6 271e714 6 255e629 7uo (CeCH3) CeCH3 wag (out-of-
plane)318e693 8 453e532 8 299e555 8 313e554 8 287e591 9 271e594 8 353e629 9
ui (CeCH3) CeCH3 wag (in-plane)
272e590 8 297e444 8 231e537 8 266e502 8 234e589 9 246e542 8 239e338 9
t (CeC) Internal rotation(CeC)/Skeletal
9e285 16 5e319 18 8e335 19 8e290 20 10e316 19 12e315 20 9e302 18
t (C]C) Internal rotation(C]C)/Skeletal
52e285 4 50e319 3 53e335 2 55e290 2 59e316 2 55e315 1 51e302 6
Total 243 243 252 261 261 261 270
M.Tatli
etal./
Journalof
Molecular
Structure1147
(2017)427
e437
429
Table
2Vibration
sof
B.brau
niirace
Bsq
ualen
es.
Symbo
lVibration
Mon
omethylsq
ualen
e12
Dim
ethylsq
ualen
e13
Trim
ethylsq
ualen
e14
Trim
ethylsq
ualen
eisom
er15
Tetram
ethylsq
ualen
e16
Wav
enumbe
rRan
ge(cm
�1)
Numbe
rof
vibrations
Wav
enumbe
rRan
ge(cm
�1)
Numbe
rof
vibrations
Wav
enumbe
rRan
ge(cm
�1)
Numbe
rof
vibrations
Wav
enumbe
rRan
ge(cm
�1)
Numbe
rof
vibrations
Wav
enumbe
rRan
ge(cm
�1)
Numbe
rof
vibrations
n(CH3)
CH3stretch
2885
e30
2524
2887
e30
2524
2886
e30
4324
2886
e30
4527
2886
e30
2424
d(CH3)
CH3deformation
1315
e14
6324
1315
e14
6224
1312
e14
6424
1312
e14
7627
1341
e14
6324
r(CH3)
CH3rock
755e
1275
1673
5e12
2116
715e
1306
1676
6e12
3718
575e
1307
16t(CH3)
CH3torsion
72e23
28
74e22
98
87e23
78
70e26
79
87e22
98
n(CH2)
CH2stretch
2885
e31
1622
2887
e31
1824
2886
e31
2526
2886
e31
2524
2886
e31
2528
d(CH2)
CH2deformation
1372
e14
6311
1372
e14
6212
1371
e14
6413
1372
e14
7612
1406
e14
6314
u(CH2)
CH2wag
915e
1367
1191
4e14
0712
914e
1377
1391
4e13
6812
910e
1372
14t(CH2)
CH2tw
ist
717e
1315
1171
6e13
0412
715e
1306
1371
5e13
0612
713e
1307
14r(CH2)
CH2rock
735e
995
1173
5e10
3112
734e
988
1373
6e80
312
736e
942
14n(CH)
]Ce
Hstretch/e
CeH
stretch
2885
e30
256
2887
e30
256
2886
e30
096
2886
e30
255
2886
e30
246
ui(CH)
CH
wag
(in-plane)
1018
e14
586
1031
e14
536
978e
1444
610
01e14
085
991e
1413
6uo(CH)
CH
wag
(out-of-plane)
748e
1302
673
5e13
046
573e
1306
678
2e13
065
872e
1314
6n(C]
C)
C]Cstretch
1654
e16
796
1654
e16
726
1652
e16
726
1652
e16
726
1652
e16
726
n(CeC)
CeCstretch
717e
1408
2471
6e14
0725
715e
1409
2670
7e14
1226
713e
1411
27b(CeCeC)
CeCe
Can
glebe
nd
160e
596
1111
8e59
812
120e
595
1412
0e59
713
123e
595
16b(C]
CeC)
C¼CeCan
glebe
nd
232e
596
926
0e59
88
237e
595
729
2e59
78
277e
595
8uo(CeCH3)
CeCH3wag
(out-of-plane)
456e
583
830
5e58
08
307e
586
826
7e59
79
471e
579
8ui(CeCH3)
CeCH3wag
(in-plane)
330e
577
826
0e59
88
237e
595
824
7e59
19
238e
458
8t(CeC)
Intern
alrotation
(CeC)/Sk
eletal
6e23
216
5e22
917
7e23
718
6e26
717
6e22
919
t(C]
C)
Intern
alrotation
(C]
C)/Sk
eletal
53e23
25
54e22
96
52e23
76
53e26
75
42e22
94
Total
243
252
261
261
270
M. Tatli et al. / Journal of Molecular Structure 1147 (2017) 427e437430
in relation to biofuel feedstock production. Additionally, moleculespecific spectral information could be used for mapping cellular/colony locations of each molecule noninvasively by Ramanspectroscopy. For example, our past studies analyzing the mo-lecular structure of C30, C32, C33, and C34 botryococcenes [15], C30squalene [16], and the B. braunii L race hydrocarbons [17] showthat Raman spectroscopy and DFT calculations can be used toidentify spectral differences in the n(C]C) stretch for thesemolecules to differentiate between them. In the current study, wereport the assignment of bond frequencies for seven botryo-coccenes not before reported and five methylsqualenes based onexperimental and DFT calculations. Additionally, ten botryo-coccenes are analyzed using various Raman spectroscopy tech-niques to show this approach can be used to distinguish betweenseveral of these molecules.
2. Experimental methods
2.1. Culturing of B. braunii
B. braunii race B, Showa (Berkeley) strain [18], was grown at22 �C under continuous aerationwith filter-sterilized air enrichedwith 2.5% CO2. A modified Chu 13 media was used for culturing[19]. Cultures were exposed to a light intensity of 120 mmolephotons・m�2・s�1 under a 12:12 h light:dark cycle. Algal cul-tures were subcultured from a six-week-old culture using 100 mlof floating colonies for inoculation into 750 ml of fresh medium.
2.2. Hydrocarbon purification
B. braunii B race hydrocarbons were purified as previouslydescribed [14,20,21]. Briefly, five-week-old freeze-dried algalcolonies were treated three times with n-hexane to extractextracellular hydrocarbons, followed by two treatments withCHCl3:MeOH (2:1) to extract intracellular hydrocarbons. Solventsfrom both extracts were removed using a rotary evaporator, thehydrocarbons resuspended in a minimal amount of n-hexane, theextracts combined, and applied to a gravity-fed silica gel columnusing n-hexane as the mobile phase. The eluent collected prior tothe pigment front was pooled as the total hydrocarbon fraction,the solvent removed using a rotary evaporator, the hydrocarbonsresuspended in a small amount of n-hexane, and a crude sepa-ration of the hydrocarbons into eight peaks was done byreversed-phase HPLC using a Cosmosil 5C18-AR-II column(20 mm � 250 mm) with 100% MeOH as the mobile phase at aflow rate of 8 ml/min and detection at 210 nm. Each peak fromthis separation containedmultiplemolecules, whichwere furtherseparated using normal-phase HPLC using a Develosil 60 silicacolumn (20 mm � 250 mm) with 100% n-hexane as the mobilephase at a flow rate of 8 ml/min and detection at 210 nm. Peaksthat still contained multiple molecules were further separated bynormal-phase HPLC using a KANTO silver nitrate (AgNO3) silicacolumn (4.6 � 250 mm) with 99.85%:0.15% n-hexane:acetonitrileas the mobile phase at a flow rate of 1 ml/min and detection at210 nm. Purity to at least 95% and molecular mass of each samplewas determined by GC-MS analysis, and molecule structureidentity confirmed by NMR analysis [14].
2.3. Raman spectroscopy
Experimental Raman spectroscopy data was collected usingline-scan and broadband coherent anti-Stokes Raman spectros-copy (BCARS). For all spectroscopy, each hydrocarbon was dis-solved in n-hexane and ~100 mg of each sample was pipetted ontoa glass microscope slide one drop at a time, allowing the n-

Fig. 2. Experimental and calculated spectra for botryococcenes. A. The experimental Raman spectra for the indicated botryococcenes. B. The calculated Raman spectra for theindicated botryococcenes. Spectral regions in dashed line boxes indicate the n(C]C) stretching analyzed in Fig. 4A and B, CH2/CH3 bending analyzed in Fig. 5A and B, andcyclohexane b(Ring) bending analyzed in Fig. 6A and B.
M. Tatli et al. / Journal of Molecular Structure 1147 (2017) 427e437 431
hexane to evaporate after applying each drop. Once all n-hexanewas evaporated the spectra for each hydrocarbon was collected.
Line-scan Raman spectroscopy analysis was carried out on thefollowing purified hydrocarbons: C31 showacene 2, C31 wolficene 4,cyclic C33-1 botryococcene 7, cyclic C33-2 botryococcene 8, andcyclic C33-3 botryococcene 9, C34 botryococcene isomer 10, mono-methylsqualene 12, dimethylsqualene 13, trimethylsqualene 14,trimethylsqualene isomer 15, and tetramethylsqualene 16. For dataacquisition, line-scan Ramanwas carried out as previously reported[22]. Briefly, the output of a continuous-wave 532 nm laser(Spectra-Physics Millennia Xs) was focused on the sample as a
uniform 133 � 1 mm2 line. Epi-Raman was collected by a 60�objective (Olympus, N.A ¼ 1.2), imaged at the entrance slit of aspectrograph (Acton 2300) and recorded by a CCD detector (PIXIS400BR). All spectra were collected at 35 mW of power using 4 minexposure. A fifth order polynomial least-squares fitting algorithmwas used for spectral baseline correction.
BCARS analysis was carried out on the following purified hy-drocarbons: C30 botryococcene 1, C31 isoshowacene 3, C32 botryo-coccene 5, and C32 braunicene 6. Each hydrocarbon was separatelydried on a glass microscope slidewithin a gasket, then coveredwitha coverslip. BCARS-generated Raman spectra were collected on a
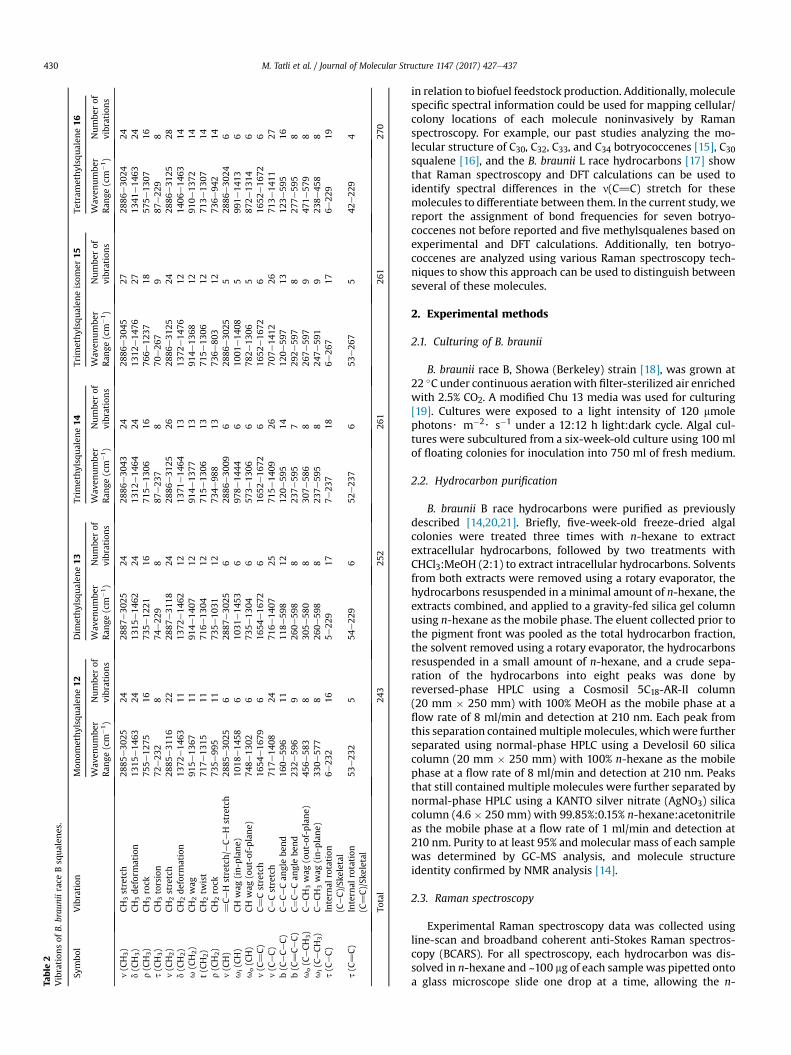
Fig. 3. Experimental and calculated spectra for methylsqualenes. A. The experimental Raman spectra for the indicated methylsqualenes. B. The calculated Raman spectra for theindicated methylsqualenes. Spectral regions in dashed line boxes indicate the n(C]C) stretching analyzed in Fig. 4C and D, and CH2/CH3 bending analyzed in Fig. 5C and D.
M. Tatli et al. / Journal of Molecular Structure 1147 (2017) 427e437432
100 � 100 pixel grid with 2 mm/pixel spacing. Described previously[23], the BCARS instrument employs a 40 MHz dual-output fiberlaser, with a 16 mW, 770 nm probe output of pulse duration 3.4 ps,and a 10 mW, 900 nm-centered supercontinuum output with 16 fsduration. This system provides Raman spectra at each image pixelwith a pixel dwell time of 3.5 ms.
2.4. Theoretical computations
The vibrational frequencies and Raman intensities of all twelvemolecules were calculated using the Gaussian 09 program, RevisionA.02 [24]. The density functional theory (DFT) B3LYP method
[25,26] was utilized with a cc-pVTZ basis set for the computations.The calculations apply for the vapor-phase of these molecules, butlittle difference between these values and those for the liquid stateis expected except for the low frequency modes below about200 cm�1. The standard Gaussian 09 protocol with the defaultvalues for bandwidths was used for producing the computedspectra in the figures. The Semichem AMPAC/AGUI program [27]was utilized to visualize the vibrational modes. A scaling factor of0.969 was used for all frequencies above 1000 cm�1 and 0.985 wasused for the lower frequencies. These scaling factors values werefound to be best suited for correlating the experimental andtheoretical frequency values in our previous studies [15e17,28].
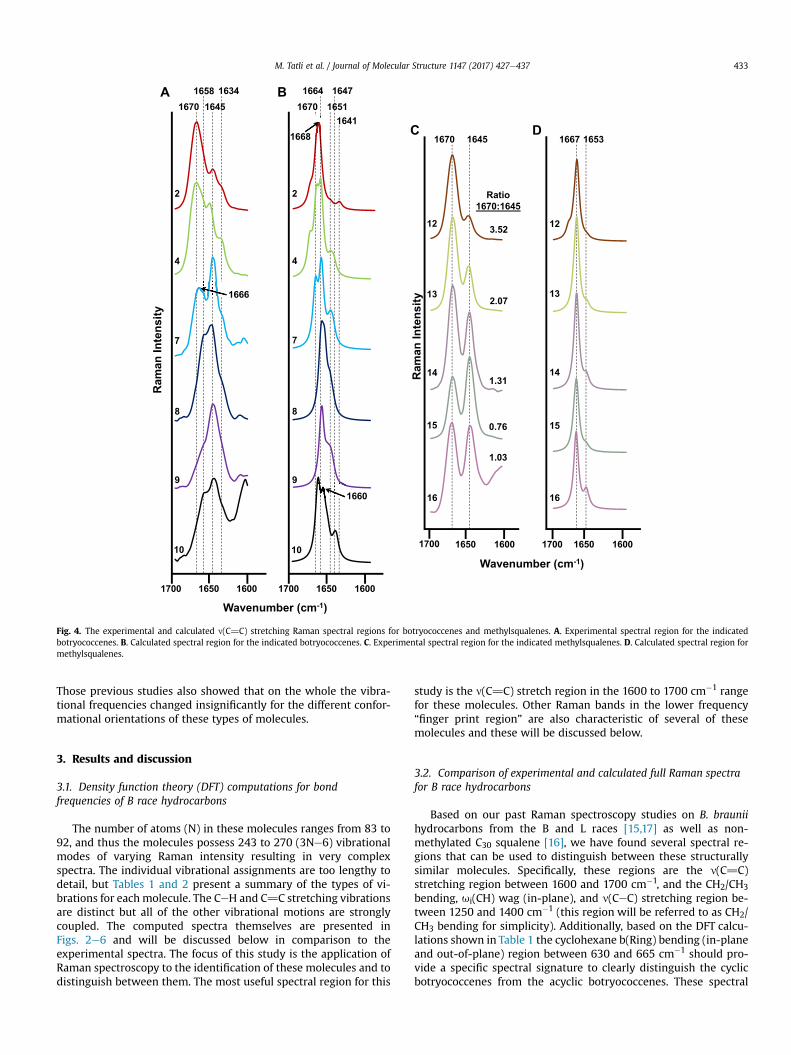
Fig. 4. The experimental and calculated n(C]C) stretching Raman spectral regions for botryococcenes and methylsqualenes. A. Experimental spectral region for the indicatedbotryococcenes. B. Calculated spectral region for the indicated botryococcenes. C. Experimental spectral region for the indicated methylsqualenes. D. Calculated spectral region formethylsqualenes.
M. Tatli et al. / Journal of Molecular Structure 1147 (2017) 427e437 433
Those previous studies also showed that on the whole the vibra-tional frequencies changed insignificantly for the different confor-mational orientations of these types of molecules.
3. Results and discussion
3.1. Density function theory (DFT) computations for bondfrequencies of B race hydrocarbons
The number of atoms (N) in these molecules ranges from 83 to92, and thus the molecules possess 243 to 270 (3Ne6) vibrationalmodes of varying Raman intensity resulting in very complexspectra. The individual vibrational assignments are too lengthy todetail, but Tables 1 and 2 present a summary of the types of vi-brations for eachmolecule. The CeH and C]C stretching vibrationsare distinct but all of the other vibrational motions are stronglycoupled. The computed spectra themselves are presented inFigs. 2e6 and will be discussed below in comparison to theexperimental spectra. The focus of this study is the application ofRaman spectroscopy to the identification of these molecules and todistinguish between them. The most useful spectral region for this
study is the n(C]C) stretch region in the 1600 to 1700 cm�1 rangefor these molecules. Other Raman bands in the lower frequency“finger print region” are also characteristic of several of thesemolecules and these will be discussed below.
3.2. Comparison of experimental and calculated full Raman spectrafor B race hydrocarbons
Based on our past Raman spectroscopy studies on B. brauniihydrocarbons from the B and L races [15,17] as well as non-methylated C30 squalene [16], we have found several spectral re-gions that can be used to distinguish between these structurallysimilar molecules. Specifically, these regions are the n(C]C)stretching region between 1600 and 1700 cm�1, and the CH2/CH3
bending, ui(CH) wag (in-plane), and n(CeC) stretching region be-tween 1250 and 1400 cm�1 (this region will be referred to as CH2/CH3 bending for simplicity). Additionally, based on the DFT calcu-lations shown in Table 1 the cyclohexane b(Ring) bending (in-planeand out-of-plane) region between 630 and 665 cm�1 should pro-vide a specific spectral signature to clearly distinguish the cyclicbotryococcenes from the acyclic botryococcenes. These spectral
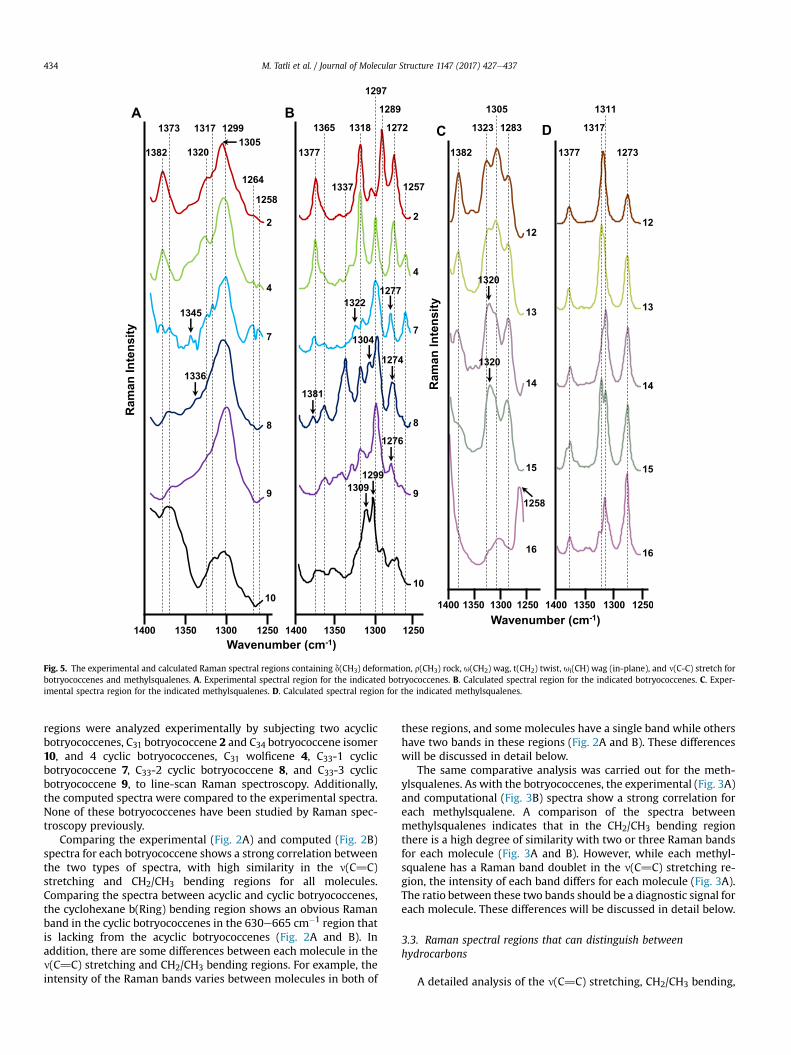
Fig. 5. The experimental and calculated Raman spectral regions containing d(CH3) deformation, r(CH3) rock, u(CH2) wag, t(CH2) twist, ui(CH) wag (in-plane), and n(C-C) stretch forbotryococcenes and methylsqualenes. A. Experimental spectral region for the indicated botryococcenes. B. Calculated spectral region for the indicated botryococcenes. C. Exper-imental spectra region for the indicated methylsqualenes. D. Calculated spectral region for the indicated methylsqualenes.
M. Tatli et al. / Journal of Molecular Structure 1147 (2017) 427e437434
regions were analyzed experimentally by subjecting two acyclicbotryococcenes, C31 botryococcene 2 and C34 botryococcene isomer10, and 4 cyclic botryococcenes, C31 wolficene 4, C33-1 cyclicbotryococcene 7, C33-2 cyclic botryococcene 8, and C33-3 cyclicbotryococcene 9, to line-scan Raman spectroscopy. Additionally,the computed spectra were compared to the experimental spectra.None of these botryococcenes have been studied by Raman spec-troscopy previously.
Comparing the experimental (Fig. 2A) and computed (Fig. 2B)spectra for each botryococcene shows a strong correlation betweenthe two types of spectra, with high similarity in the n(C]C)stretching and CH2/CH3 bending regions for all molecules.Comparing the spectra between acyclic and cyclic botryococcenes,the cyclohexane b(Ring) bending region shows an obvious Ramanband in the cyclic botryococcenes in the 630e665 cm�1 region thatis lacking from the acyclic botryococcenes (Fig. 2A and B). Inaddition, there are some differences between each molecule in then(C]C) stretching and CH2/CH3 bending regions. For example, theintensity of the Raman bands varies between molecules in both of
these regions, and some molecules have a single band while othershave two bands in these regions (Fig. 2A and B). These differenceswill be discussed in detail below.
The same comparative analysis was carried out for the meth-ylsqualenes. As with the botryococcenes, the experimental (Fig. 3A)and computational (Fig. 3B) spectra show a strong correlation foreach methylsqualene. A comparison of the spectra betweenmethylsqualenes indicates that in the CH2/CH3 bending regionthere is a high degree of similarity with two or three Raman bandsfor each molecule (Fig. 3A and B). However, while each methyl-squalene has a Raman band doublet in the n(C]C) stretching re-gion, the intensity of each band differs for each molecule (Fig. 3A).The ratio between these two bands should be a diagnostic signal foreach molecule. These differences will be discussed in detail below.
3.3. Raman spectral regions that can distinguish betweenhydrocarbons
A detailed analysis of the n(C]C) stretching, CH2/CH3 bending,
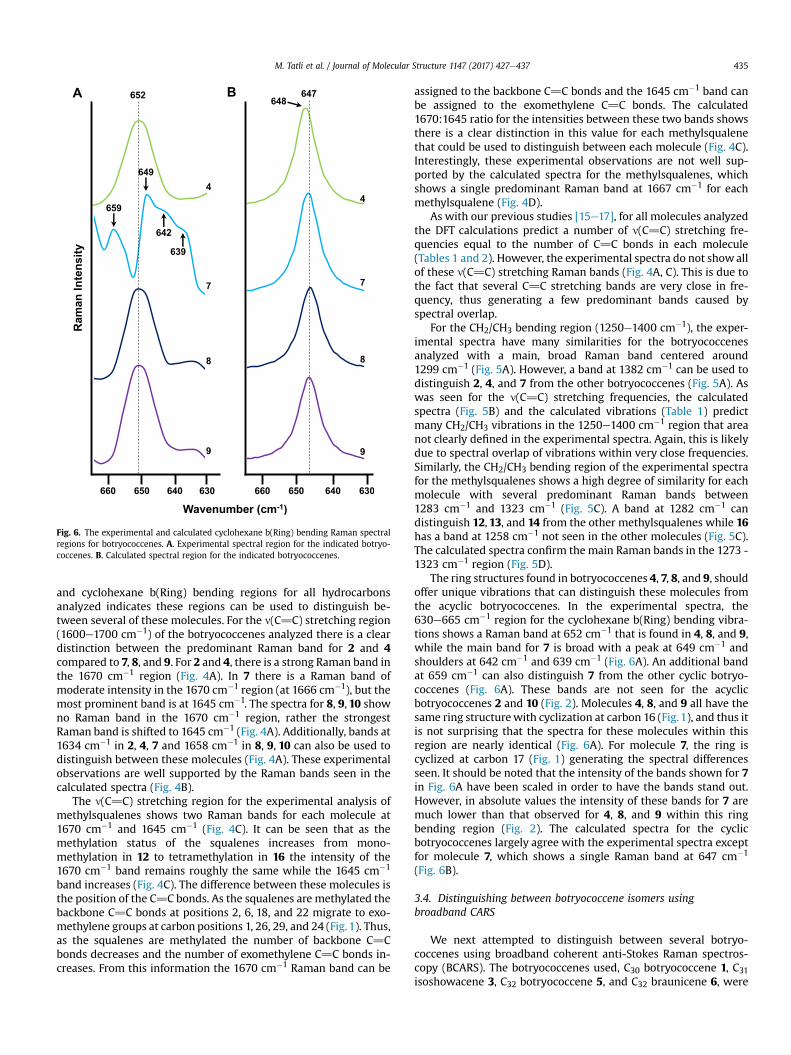
Fig. 6. The experimental and calculated cyclohexane b(Ring) bending Raman spectralregions for botryococcenes. A. Experimental spectral region for the indicated botryo-coccenes. B. Calculated spectral region for the indicated botryococcenes.
M. Tatli et al. / Journal of Molecular Structure 1147 (2017) 427e437 435
and cyclohexane b(Ring) bending regions for all hydrocarbonsanalyzed indicates these regions can be used to distinguish be-tween several of these molecules. For the n(C]C) stretching region(1600e1700 cm�1) of the botryococcenes analyzed there is a cleardistinction between the predominant Raman band for 2 and 4compared to 7, 8, and 9. For 2 and 4, there is a strong Raman band inthe 1670 cm�1 region (Fig. 4A). In 7 there is a Raman band ofmoderate intensity in the 1670 cm�1 region (at 1666 cm�1), but themost prominent band is at 1645 cm�1. The spectra for 8, 9, 10 showno Raman band in the 1670 cm�1 region, rather the strongestRaman band is shifted to 1645 cm�1 (Fig. 4A). Additionally, bands at1634 cm�1 in 2, 4, 7 and 1658 cm�1 in 8, 9, 10 can also be used todistinguish between these molecules (Fig. 4A). These experimentalobservations are well supported by the Raman bands seen in thecalculated spectra (Fig. 4B).
The n(C]C) stretching region for the experimental analysis ofmethylsqualenes shows two Raman bands for each molecule at1670 cm�1 and 1645 cm�1 (Fig. 4C). It can be seen that as themethylation status of the squalenes increases from mono-methylation in 12 to tetramethylation in 16 the intensity of the1670 cm�1 band remains roughly the same while the 1645 cm�1
band increases (Fig. 4C). The difference between these molecules isthe position of the C]C bonds. As the squalenes are methylated thebackbone C]C bonds at positions 2, 6, 18, and 22 migrate to exo-methylene groups at carbon positions 1, 26, 29, and 24 (Fig.1). Thus,as the squalenes are methylated the number of backbone C]Cbonds decreases and the number of exomethylene C]C bonds in-creases. From this information the 1670 cm�1 Raman band can be
assigned to the backbone C]C bonds and the 1645 cm�1 band canbe assigned to the exomethylene C]C bonds. The calculated1670:1645 ratio for the intensities between these two bands showsthere is a clear distinction in this value for each methylsqualenethat could be used to distinguish between each molecule (Fig. 4C).Interestingly, these experimental observations are not well sup-ported by the calculated spectra for the methylsqualenes, whichshows a single predominant Raman band at 1667 cm�1 for eachmethylsqualene (Fig. 4D).
As with our previous studies [15e17], for all molecules analyzedthe DFT calculations predict a number of n(C]C) stretching fre-quencies equal to the number of C]C bonds in each molecule(Tables 1 and 2). However, the experimental spectra do not showallof these n(C]C) stretching Raman bands (Fig. 4A, C). This is due tothe fact that several C]C stretching bands are very close in fre-quency, thus generating a few predominant bands caused byspectral overlap.
For the CH2/CH3 bending region (1250e1400 cm�1), the exper-imental spectra have many similarities for the botryococcenesanalyzed with a main, broad Raman band centered around1299 cm�1 (Fig. 5A). However, a band at 1382 cm�1 can be used todistinguish 2, 4, and 7 from the other botryococcenes (Fig. 5A). Aswas seen for the n(C]C) stretching frequencies, the calculatedspectra (Fig. 5B) and the calculated vibrations (Table 1) predictmany CH2/CH3 vibrations in the 1250e1400 cm�1 region that areanot clearly defined in the experimental spectra. Again, this is likelydue to spectral overlap of vibrations within very close frequencies.Similarly, the CH2/CH3 bending region of the experimental spectrafor the methylsqualenes shows a high degree of similarity for eachmolecule with several predominant Raman bands between1283 cm�1 and 1323 cm�1 (Fig. 5C). A band at 1282 cm�1 candistinguish 12, 13, and 14 from the other methylsqualenes while 16has a band at 1258 cm�1 not seen in the other molecules (Fig. 5C).The calculated spectra confirm the main Raman bands in the 1273 -1323 cm�1 region (Fig. 5D).
The ring structures found in botryococcenes 4, 7, 8, and 9, shouldoffer unique vibrations that can distinguish these molecules fromthe acyclic botryococcenes. In the experimental spectra, the630e665 cm�1 region for the cyclohexane b(Ring) bending vibra-tions shows a Raman band at 652 cm�1 that is found in 4, 8, and 9,while the main band for 7 is broad with a peak at 649 cm�1 andshoulders at 642 cm�1 and 639 cm�1 (Fig. 6A). An additional bandat 659 cm�1 can also distinguish 7 from the other cyclic botryo-coccenes (Fig. 6A). These bands are not seen for the acyclicbotryococcenes 2 and 10 (Fig. 2). Molecules 4, 8, and 9 all have thesame ring structurewith cyclization at carbon 16 (Fig. 1), and thus itis not surprising that the spectra for these molecules within thisregion are nearly identical (Fig. 6A). For molecule 7, the ring iscyclized at carbon 17 (Fig. 1) generating the spectral differencesseen. It should be noted that the intensity of the bands shown for 7in Fig. 6A have been scaled in order to have the bands stand out.However, in absolute values the intensity of these bands for 7 aremuch lower than that observed for 4, 8, and 9 within this ringbending region (Fig. 2). The calculated spectra for the cyclicbotryococcenes largely agree with the experimental spectra exceptfor molecule 7, which shows a single Raman band at 647 cm�1
(Fig. 6B).
3.4. Distinguishing between botryococcene isomers usingbroadband CARS
We next attempted to distinguish between several botryo-coccenes using broadband coherent anti-Stokes Raman spectros-copy (BCARS). The botryococcenes used, C30 botryococcene 1, C31isoshowacene 3, C32 botryococcene 5, and C32 braunicene 6, were
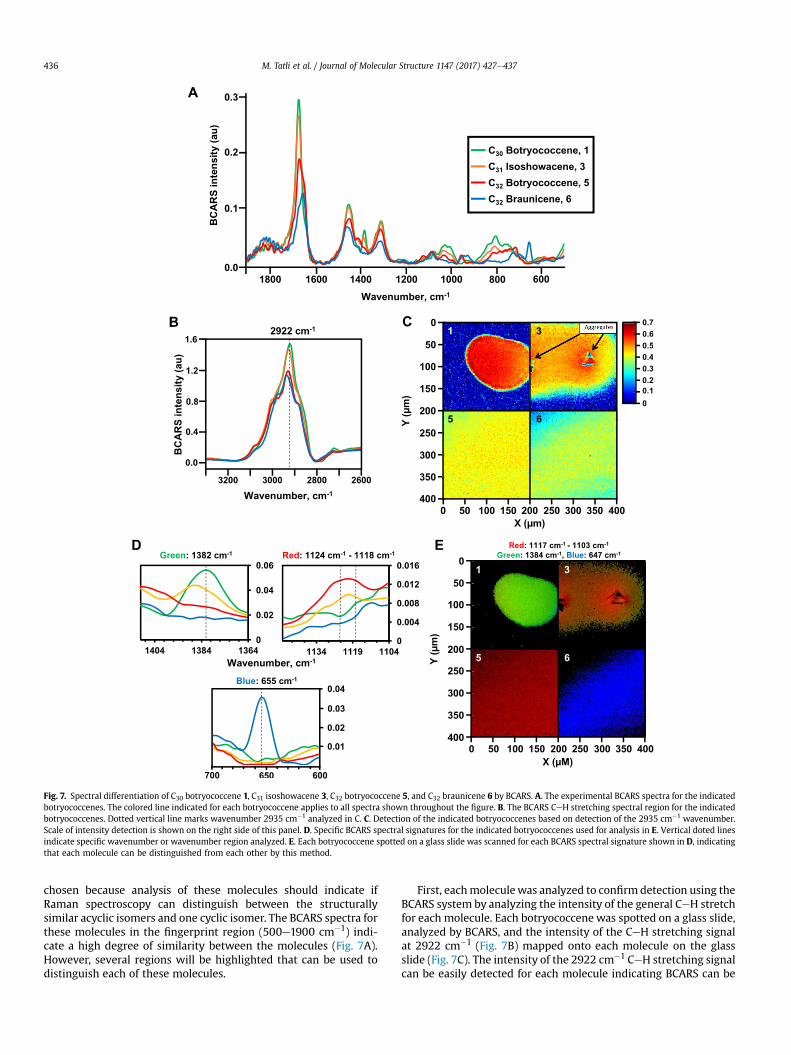
Fig. 7. Spectral differentiation of C30 botryococcene 1, C31 isoshowacene 3, C32 botryococcene 5, and C32 braunicene 6 by BCARS. A. The experimental BCARS spectra for the indicatedbotryococcenes. The colored line indicated for each botryococcene applies to all spectra shown throughout the figure. B. The BCARS CeH stretching spectral region for the indicatedbotryococcenes. Dotted vertical line marks wavenumber 2935 cm�1 analyzed in C. C. Detection of the indicated botryococcenes based on detection of the 2935 cm�1 wavenumber.Scale of intensity detection is shown on the right side of this panel. D. Specific BCARS spectral signatures for the indicated botryococcenes used for analysis in E. Vertical doted linesindicate specific wavenumber or wavenumber region analyzed. E. Each botryococcene spotted on a glass slide was scanned for each BCARS spectral signature shown in D, indicatingthat each molecule can be distinguished from each other by this method.
M. Tatli et al. / Journal of Molecular Structure 1147 (2017) 427e437436
chosen because analysis of these molecules should indicate ifRaman spectroscopy can distinguish between the structurallysimilar acyclic isomers and one cyclic isomer. The BCARS spectra forthese molecules in the fingerprint region (500e1900 cm�1) indi-cate a high degree of similarity between the molecules (Fig. 7A).However, several regions will be highlighted that can be used todistinguish each of these molecules.
First, eachmoleculewas analyzed to confirm detection using theBCARS system by analyzing the intensity of the general CeH stretchfor each molecule. Each botryococcene was spotted on a glass slide,analyzed by BCARS, and the intensity of the CeH stretching signalat 2922 cm�1 (Fig. 7B) mapped onto each molecule on the glassslide (Fig. 7C). The intensity of the 2922 cm�1 CeH stretching signalcan be easily detected for each molecule indicating BCARS can be
M. Tatli et al. / Journal of Molecular Structure 1147 (2017) 427e437 437
used for analysis of these molecules. Additionally, it can be seenthat eachmolecule has different surface tension characteristics. TheC30 botryococcene 1 stayed as a tight oil drop on the glass slidewhile each of the other botryococcenes spread out more on thesurface of the glass slide and were no longer contained in a tight oildrop such as for C32 braunicene 6 (Fig. 7C).
Next, three spectral regions that should offer specificity toseveral of these botryococcenes were analyzed. These three regionswere identified from the fingerprint region of each spectrum andthen each botryococcene was analyzed for the detection of eachsignal. The first region analyzed was a Raman band at 1382 cm�1
that is mainly found in the spectrum for C30 botryococcene 1(Fig. 7D). Each botryococcene was analyzed for a signal from the1382 cm�1 band, and if it was detected the signal was assigned agreen color for mapping to the hydrocarbons on the glass slide. Itcan be seen that the 1382 cm�1 signal was mainly found in C30botryococcene 1 with lower detection in C31 isoshowacene 3, andno detection in either C32 botryococcene 5 or C32 braunicene 6(Fig. 7E). The second spectral region analyzed was a Raman bandbetween 1124 cm�1 and 1118 cm�1 that is mostly detected in C32botryococcene 5 (Fig. 7D). If the signal for the 1124e1118 cm�1
region was detected in any molecule it was given a red color formapping to the hydrocarbons on the glass slide. This signal wasmainly detected in C32 botryococcene 5with lower detection in C31isoshowacene 3, and no detection in C30 botryococcene 1 or C32
braunicene 6 (Fig. 7E). Interestingly, C32 botryococcene 5 is mainlyshown as an orange color which would be due to mixed detectionof the green 1382 cm�1 signal and the red 1124e1118 cm�1 signal(Fig. 7E). The third spectral region analyzed was a Raman band at655 cm�1 that is specific for the cyclohexane b(Ring) bending in C32braunicene 6 (Fig. 7D). Detection of the 655 cm�1 signal in anymolecule was assigned a blue color, and this signal is only detectedin C32 braunicene 6 (Fig. 7E).
4. Conclusions
Distinguishing between structurally similar molecules by spec-troscopy techniques such as the B. braunii race B hydrocarbons ischallenging. Here we have shown that experimental and calculatedRaman spectroscopy can be used to clearly differentiate betweenseveral of these hydrocarbons. This information could be used forcommercial production of algal hydrocarbons. For example,particular hydrocarbons may be more suited for certain industrialapplications, and thus more desirable. The use of Raman spec-troscopy to identify production levels of these particular hydro-carbons within an algal culture would then inform best times forharvest to maximize hydrocarbon production.
Acknowledgments
This work was supported by the National Science Foundation[grant number EFRI-PSBR #1240478 TPD] and the Robert A. WelchFoundation [grant A-0396 to JL]. Computations were carried out onthe Texas A&MDepartment of Chemistry Medusa computer systemfunded by the National Science Foundation [grant CHE-0541587].
References
[1] Q. Hu, M. Sommerfeld, E. Jarvis, M. Ghirardi, M. Posewitz, M. Seibert,A. Darzins, Microalgal triacylglycerols as feedstocks for biofuel production:perspectives and advances, Plant J. 54 (2008) 621e639.
[2] P. Metzger, C. Largeau, Botryococcus braunii: a rich source for hydrocarbonsand related ether lipids, Appl. Microbiol. Biotechnol. 66 (2005) 486e496.
[3] J.M. Moldowan, W.K. Seifert, First discovery of botryococcane in petroleum,J.C.S. Chem. Comm 19 (1980) 912e914.
[4] D.M. McKirdy, R.E. Cox, J.K. Volkman, V.J. Howell, Botryococcanes in a new
class of Australian non-marine crude oils, Nature 320 (1986) 57e59.[5] E. Lichtfouse, S. Derenne, A. Mariotti, C. Largeau, Possible algal origin of long-
chain odd n-alkanes in immature sediments as revealed by distributions andcarbon-isotope ratios, Org. Geochem 22 (1994) 1023e1027.
[6] M. Glikson, K. Lindsay, J. Saxby, Botryococcus - a planktonic green alga, thesource of petroleum through the ages: transmission electron microscopicalstudies of oil shales and petroleum source rocks, Org. Geochem 14 (1989)595e608.
[7] P. Adam, P. Schaeffer, P. Albrecht, C40 monoaromatic lycopane derivatives asindicators of the contribution of the alga Botryococcus braunii race L to theorganic matter of Messel oil shale (Eocene, Germany), Org. Geochem 37(2006) 584e596.
[8] L.W. Hillen, G. Pollard, L.V. Wake, N. White, Hydrocracking of the oils ofBotryococcus braunii to transport fuels, Biotechnol. Bioeng. 24 (1982)193e205.
[9] H. Kitazato, S. Asaoka, H. Iwamoto, Catalytic cracking of hydrocarbons frommicroalgae, Sekiyu Gakkaishi 32 (1989) 28e34.
[10] N.H. Tran, J.R. Bartlett, G.S.K. Kannangara, A.S. Milev, H. Volk, M.A. Wilson,Catalytic upgrading of biorefinery oil from micro-algae, Fuel 89 (2010)265e274.
[11] A. Banerjee, R. Sharma, Y. Chisti, U.C. Banerjee, Botryococcus braunii: arenewable source of hydrocarbons and other chemicals, Crit. Rev. Biotechnol.22 (2002) 245e279.
[12] E. Achitouv, P. Metzger, M.N. Rager, C. Largeau, C31-C34 methylated squalenesfrom a Bolivian strain of Botryococcus braunii, Phytochem 65 (2004)3159e3165.
[13] Z. Huang, C.D. Poulter, Tetramethylsqualene, a triterpene from Botryococcusbraunii var. showa, Phytochem 28 (1989) 1467e1470.
[14] M. Tatli, M.T. Naik, S. Okada, L.J. Dangott, T.P. Devarenne, Isolation and char-acterization of cyclic C33 botryococcenes and a trimethylsqualene isomer fromBotryococcus braunii Race B, J. Nat. Prod. 80 (2017) 953e958.
[15] T.L. Weiss, H.J. Chun, S. Okada, S. Vitha, A. Holzenburg, J. Laane,T.P. Devarenne, Raman spectroscopy analysis of botryococcene hydrocarbonsfrom the green microalga Botryococcus braunii, J. Biol. Chem. 285 (2010)32458e32466.
[16] H.J. Chun, T.L. Weiss, T.P. Devarenne, J. Laane, Vibrational spectra and DFTcalculations of squalene, J. Mol. Struct. 1032 (2013) 203e206.
[17] H.J. Chun, S. Waqued, H.R. Thapa, A. Han, V.V. Yakovlev, J. Laane,T.P. Devarenne, Raman spectra and DFT calculations for tetraterpene hydro-carbons from the L race of the green microalga Botryococcus braunii, J. Mol.Struct. 1129 (2017) 216e221.
[18] A.M. Nonomura, Botryococcus braunii var. showa (Chlorophyceae) from Ber-keley, California, United States of America, Jpn. J. Phycol. 36 (1988) 285e291.
[19] S.P. Chu, The influence of the mineral composition of the medium on thegrowth of planktonic algae Part 1. Methods and culture media, J. Ecol. 30(1942) 284e325.
[20] S. Okada, M. Murakami, K. Yamaguchi, Hydrocarbon composition of newlyisolated strains of the green microalga Botryococcus braunii, J. Appl. Phycol. 7(1995) 555e559.
[21] S. Okada, M. Murakami, K. Yamaguchi, Characterization of hydrocarbons fromthe Yayoi strain of the green microalga Botryococcus braunii, Phytochem. Anal.8 (1997) 198e203.
[22] J. Qi, W.C. Shih, Performance of line-scan Raman microscopy for high-throughput chemical imaging of cell population, Appl. Opt. 53 (2014)2881e2885.
[23] C.H. Camp Jr., Y.J. Lee, J.M. Heddleston, C.M. Hartshorn, A.R. Hight Walker,J.N. Rich, J.D. Lathia, M.T. Cicerone, High-speed coherent raman fingerprintimaging of biological tissuesw, Nat. Photonics 8 (2014) 627e634.
[24] M.J. Frisch, G.W. Trucks, H.B. Schlegel, G.E. Scuseria, M.A. Robb,J.R. Cheeseman, G. Scalmani, V. Barone, B. Mennucci, G.A. Petersson,H. Nakatsuji, M. Caricato, X. Li, H.P. Hratchian, A.F. Izmaylov, J. Bloino,G. Zheng, J.L. Sonnenberg, M. Hada, M. Ehara, K. Toyota, R. Fukuda,J. Hasegawa, M. Ishida, T. Nakajima, Y. Honda, O. Kitao, H. Nakai, T. Vreven,J. Montgomery, J.A.J.E. Peralta, F. Ogliaro, M. Bearpark, J.J. Heyd, E. Brothers,K.N. Kudin, V.N. Staroverov, R. Kobayashi, J. Normand, K. Raghavachari,A. Rendell, J.C. Burant, S.S. Iyengar, J. Tomasi, M. Cossi, N. Rega, J.M. Millam,M. Klene, J.E. Knox, J.B. Cross, V. Bakken, C. Adamo, J. Jaramillo, R. Gomperts,R.E. Stratmann, O. Yazyev, A.J. Austin, R. Cammi, C. Pomelli, J.W. Ochterski,R.L. Martin, K. Morokuma, V.G. Zakrzewski, G.A. Voth, P. Salvador,J.J. Dannenberg, S. Dapprich, A.D. Daniels, €O. Farkas, J.B. Foresman, J.V. Ortiz,J. Cioslowski, D.J. Fox, Gaussian 09, Revision A.02, Gaussian, Inc., WallingfordCT, 2009.
[25] A.D. Becke, Density-functional thermochemistry .3. The role of exact ex-change, J. Chem. Phys. 98 (1993) 5648e5652.
[26] C.T. Lee, W.T. Yang, R.G. Parr, Development of the Colle-Salvetti correlation-energy formula into a functional of the electron-density, Phys. Rev. B 37(1988) 785e789.
[27] I.S. AGUI Program from Semichem, KS 66216, 2016. http://www.semichem.com/.
[28] H.J. Chun, N. Meinander, J.R. Villarreal, J. Laane, Vibrational spectra, theoreticalcalculations, and two-dimensional potential energy surface for the ring-puckering vibrations of 2,4,7-trioxa[3.3.0]octane, J. Phys. Chem. A 119(2015) 410e417.