Embed Size (px)
Citation preview

This journal is©The Royal Society of Chemistry 2018 J. Mater. Chem. C
Cite this:DOI: 10.1039/c7tc05278b
All-atom simulation of molecular orientation invapor-deposited organic light-emitting diodes†
Yong Youn, ‡a Dongsun Yoo, ‡a Hochul Song,a Youngho Kang, §a
Kye Yeop Kim,¶a Sang Ho Jeon,b Youngmi Cho,b Kyungchan Chaeb andSeungwu Han*a
Molecular orientation in vapor-deposited organic semiconductor films is known to improve the optical
and electrical efficiencies of organic light-emitting diodes, but atomistic understanding is still
incomplete. In this study, using all-atom simulation of vapor deposition, we theoretically investigate how
the molecular orientation depends on various factors such as the substrate temperature, molecular
shape, and material composition. The simulation results are in good agreement with experiment,
indicating that the all-atom simulation can predict the molecular orientation reliably. From the detailed
analysis of the dynamics of molecules, we suggest that the kinetics of molecules near the surface mainly
determines the orientation of the deposited film. In addition, the oriented films have higher density and
thermal stability than randomly oriented films. We also show that higher mobility of laterally oriented
films can be explained in terms of the site-energy correlation.
Introduction
Organic semiconductors have advantages over inorganic semi-conductors in cost, flexibility, weight, and efficiency. Owing tothese merits, organic semiconductors are currently empoweringseveral high-performing electronic and energy devices, such asorganic light-emitting diodes (OLEDs),1–5 organic photovoltaics,6–8
and organic thin-film transistors.9,10 In particular, OLEDs haveentered the mainstream market for full-color displays and lightingapplications.
Despite successful commercialization, the lifetime, particularlyfor blue emission, is still a major weakness of OLEDs. This in turnelevated the importance of emission efficiency because it helpslower the power consumption and extend the device lifespan. Assuch, recently, the fact that the molecular orientation can improvethe efficiency of OLEDs is receiving much attention;11–14 in thepast, the molecular orientation in vapor-deposited amorphousfilms was assumed to be random and isotropic.11 However, recent
studies indicated that rod-like15–17 or heteroleptic18 molecules tendto lie parallel to the substrate in vapor-deposited amorphous films.(In the crystalline structure, both horizontal and vertical orientationswere reported.19) Such horizontal orientations can be beneficial tothe device performance. For example, a phosphorescent OLEDcould exceed the theoretical quantum-efficiency limit of isotropicmolecules by preferentially orienting phosphorescent dyes.12 Itwas also found that the horizontal orientation improves the out-coupling efficiency12 and carrier mobility.20 Furthermore, vapor-deposited films showed exceptional thermal stability comparableto glasses aged over thousands of years,21–23 implying a prolongedlifetime.
To fully exploit the molecular orientation for improvingdevice efficiency, it is important to understand the atomisticmechanism of the molecular orientation and predict its effecton device properties such as charge transport and thermalstability. There are several factors that are known to correlatewith the molecular orientation like the molecular shape,11
substrate temperature (Tsub),11,22 and material composition inhost–dopant systems.24–26 Explanations at the molecular levelwere also proposed; in ref. 12, preferred orientation wasexplained in terms of the supramolecule made of host anddopant molecules. In the case of heteroleptic molecules, it wassuggested that the alignment of aliphatic ligands at the vacuum–organic interface leads to the horizontal orientation.27 However,the full understanding of molecular orientation would ultimatelyrequire consideration of the deposition process. In this respect,computer simulation of the deposition process would be a usefulvehicle that can fully enlighten the microscopic origin of the
a Department of Materials Science and Engineering and Research Institute of
Advanced Materials, Seoul National University, Seoul 08826, Korea.
E-mail: [email protected] Display R&D Center, Samsung Display Co., Ltd, 1 Samsung-ro, Giheung-gu,
Yongin-si, Gyeonggi-do 17113, Korea
† Electronic supplementary information (ESI) available. See DOI: 10.1039/c7tc05278b‡ These authors contributed equally.§ Present address: Materials Modeling and Characterization Department,Korea Institute of Materials Science, Changwon 51508, Korea.¶ Present address: LGE Yangjae R&D campus, 38, Baumoe-ro, Seocho-gu,Seoul 06763, Korea.
Received 18th November 2017,Accepted 22nd December 2017
DOI: 10.1039/c7tc05278b
rsc.li/materials-c
Journal ofMaterials Chemistry C
PAPER
Publ
ishe
d on
22
Dec
embe
r 20
17. D
ownl
oade
d by
Seo
ul N
atio
nal U
nive
rsity
on
16/0
1/20
18 0
4:42
:42.
View Article OnlineView Journal
J. Mater. Chem. C This journal is©The Royal Society of Chemistry 2018
preferred orientation. Recently, there have been simulations withsuch motivations,22,28–30 which examined the effects of Tsub anddeposition rate on the molecular orientation. They attributed theformation of the orientation to the liquid-like property near thesurface. However, ref. 22 and 28 employed coarse-grained orsimplified models which lack electrostatic interactions, and alsodid not examine shape-dependent preferred orientations. Theprocess-dependent film orientation was studied in ref. 29 butthe organic molecule in the simulation is rather simple comparedto actual molecules in OLEDs. In ref. 30, molecular dynamicssimulations of layer-by-layer deposition of TPD molecules wereperformed and it was found that lateral molecular orientation waspreferred, which explained the measured anisotropy in thermalconductivity. However, the influence of substrate temperature onthe molecular orientation was not examined.
In this study, using all-atom molecular dynamics simulationof vapor-deposition processes, we theoretically analyze the effectsof Tsub, molecular shape, and host molecules on the molecularorientation in the deposited film. We show that the simulationresults agree well with previous experimental studies, and thatour model can reliably predict the process-dependent orientationof actual molecules. We explain in detail the effects of molecularshape and material composition on the molecular orientation.We also assess the thermal stability of the films and analyze thesite-energy distribution.
Method
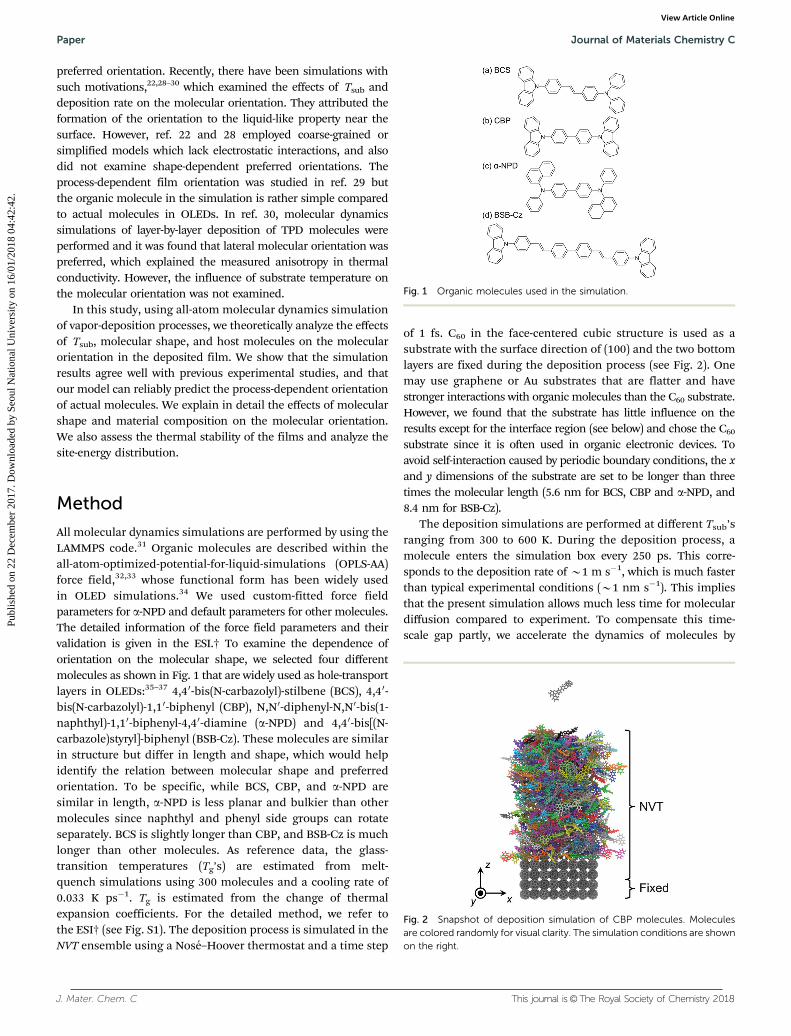
All molecular dynamics simulations are performed by using theLAMMPS code.31 Organic molecules are described within theall-atom-optimized-potential-for-liquid-simulations (OPLS-AA)force field,32,33 whose functional form has been widely usedin OLED simulations.34 We used custom-fitted force fieldparameters for a-NPD and default parameters for other molecules.The detailed information of the force field parameters and theirvalidation is given in the ESI.† To examine the dependence oforientation on the molecular shape, we selected four differentmolecules as shown in Fig. 1 that are widely used as hole-transportlayers in OLEDs:35–37 4,40-bis(N-carbazolyl)-stilbene (BCS), 4,40-bis(N-carbazolyl)-1,10-biphenyl (CBP), N,N0-diphenyl-N,N0-bis(1-naphthyl)-1,10-biphenyl-4,40-diamine (a-NPD) and 4,40-bis[(N-carbazole)styryl]-biphenyl (BSB-Cz). These molecules are similarin structure but differ in length and shape, which would helpidentify the relation between molecular shape and preferredorientation. To be specific, while BCS, CBP, and a-NPD aresimilar in length, a-NPD is less planar and bulkier than othermolecules since naphthyl and phenyl side groups can rotateseparately. BCS is slightly longer than CBP, and BSB-Cz is muchlonger than other molecules. As reference data, the glass-transition temperatures (Tg’s) are estimated from melt-quench simulations using 300 molecules and a cooling rate of0.033 K ps�1. Tg is estimated from the change of thermalexpansion coefficients. For the detailed method, we refer tothe ESI† (see Fig. S1). The deposition process is simulated in theNVT ensemble using a Nose–Hoover thermostat and a time step
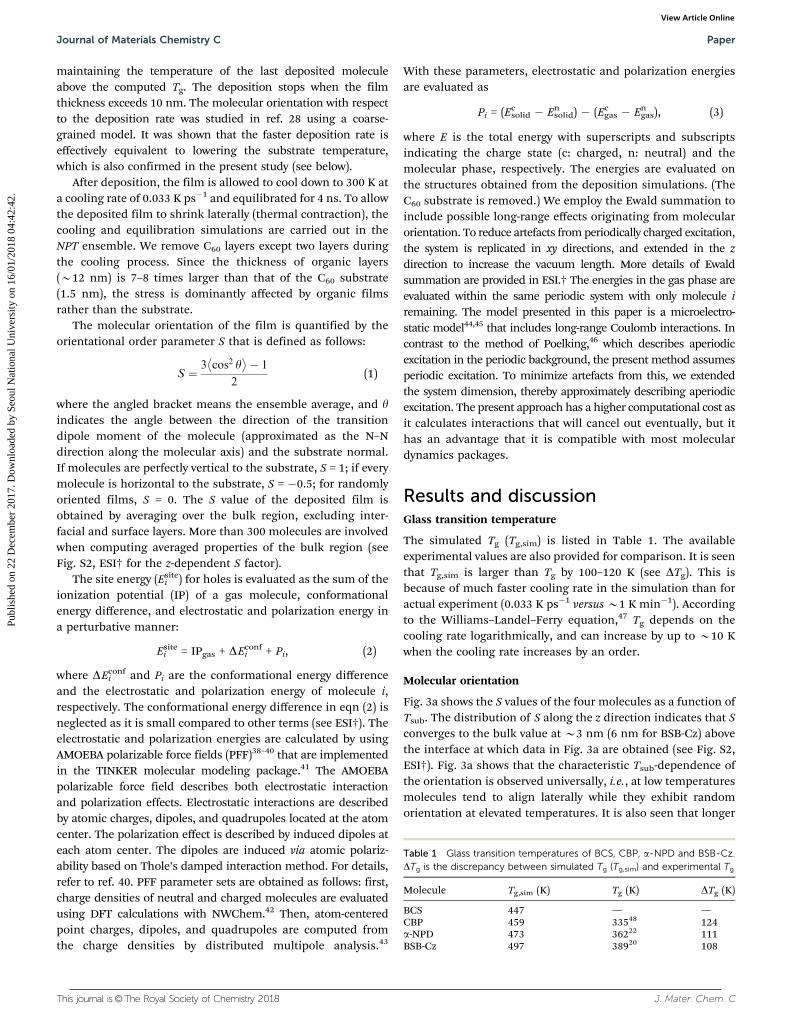
of 1 fs. C60 in the face-centered cubic structure is used as asubstrate with the surface direction of (100) and the two bottomlayers are fixed during the deposition process (see Fig. 2). Onemay use graphene or Au substrates that are flatter and havestronger interactions with organic molecules than the C60 substrate.However, we found that the substrate has little influence on theresults except for the interface region (see below) and chose the C60
substrate since it is often used in organic electronic devices. Toavoid self-interaction caused by periodic boundary conditions, the xand y dimensions of the substrate are set to be longer than threetimes the molecular length (5.6 nm for BCS, CBP and a-NPD, and8.4 nm for BSB-Cz).
The deposition simulations are performed at different Tsub’sranging from 300 to 600 K. During the deposition process, amolecule enters the simulation box every 250 ps. This corre-sponds to the deposition rate of B1 m s�1, which is much fasterthan typical experimental conditions (B1 nm s�1). This impliesthat the present simulation allows much less time for moleculardiffusion compared to experiment. To compensate this time-scale gap partly, we accelerate the dynamics of molecules by
Fig. 1 Organic molecules used in the simulation.
Fig. 2 Snapshot of deposition simulation of CBP molecules. Moleculesare colored randomly for visual clarity. The simulation conditions are shownon the right.
Paper Journal of Materials Chemistry C
Publ
ishe
d on
22
Dec
embe
r 20
17. D
ownl
oade
d by
Seo
ul N
atio
nal U
nive
rsity
on
16/0
1/20
18 0
4:42
:42.
View Article Online
This journal is©The Royal Society of Chemistry 2018 J. Mater. Chem. C
maintaining the temperature of the last deposited moleculeabove the computed Tg. The deposition stops when the filmthickness exceeds 10 nm. The molecular orientation with respectto the deposition rate was studied in ref. 28 using a coarse-grained model. It was shown that the faster deposition rate iseffectively equivalent to lowering the substrate temperature,which is also confirmed in the present study (see below).
After deposition, the film is allowed to cool down to 300 K ata cooling rate of 0.033 K ps�1 and equilibrated for 4 ns. To allowthe deposited film to shrink laterally (thermal contraction), thecooling and equilibration simulations are carried out in theNPT ensemble. We remove C60 layers except two layers duringthe cooling process. Since the thickness of organic layers(B12 nm) is 7–8 times larger than that of the C60 substrate(1.5 nm), the stress is dominantly affected by organic filmsrather than the substrate.
The molecular orientation of the film is quantified by theorientational order parameter S that is defined as follows:
S ¼3 cos2 y� �
� 1
2(1)
where the angled bracket means the ensemble average, and yindicates the angle between the direction of the transitiondipole moment of the molecule (approximated as the N–Ndirection along the molecular axis) and the substrate normal.If molecules are perfectly vertical to the substrate, S = 1; if everymolecule is horizontal to the substrate, S = �0.5; for randomlyoriented films, S = 0. The S value of the deposited film isobtained by averaging over the bulk region, excluding inter-facial and surface layers. More than 300 molecules are involvedwhen computing averaged properties of the bulk region (seeFig. S2, ESI† for the z-dependent S factor).
The site energy (Esitei ) for holes is evaluated as the sum of the
ionization potential (IP) of a gas molecule, conformationalenergy difference, and electrostatic and polarization energy ina perturbative manner:
Esitei = IPgas + DEconf
i + Pi, (2)
where DEconfi and Pi are the conformational energy difference
and the electrostatic and polarization energy of molecule i,respectively. The conformational energy difference in eqn (2) isneglected as it is small compared to other terms (see ESI†). Theelectrostatic and polarization energies are calculated by usingAMOEBA polarizable force fields (PFF)38–40 that are implementedin the TINKER molecular modeling package.41 The AMOEBApolarizable force field describes both electrostatic interactionand polarization effects. Electrostatic interactions are describedby atomic charges, dipoles, and quadrupoles located at the atomcenter. The polarization effect is described by induced dipoles ateach atom center. The dipoles are induced via atomic polariz-ability based on Thole’s damped interaction method. For details,refer to ref. 40. PFF parameter sets are obtained as follows: first,charge densities of neutral and charged molecules are evaluatedusing DFT calculations with NWChem.42 Then, atom-centeredpoint charges, dipoles, and quadrupoles are computed fromthe charge densities by distributed multipole analysis.43
With these parameters, electrostatic and polarization energiesare evaluated as
Pi = (Ecsolid � En
solid) � (Ecgas � En
gas), (3)
where E is the total energy with superscripts and subscriptsindicating the charge state (c: charged, n: neutral) and themolecular phase, respectively. The energies are evaluated onthe structures obtained from the deposition simulations. (TheC60 substrate is removed.) We employ the Ewald summation toinclude possible long-range effects originating from molecularorientation. To reduce artefacts from periodically charged excitation,the system is replicated in xy directions, and extended in the zdirection to increase the vacuum length. More details of Ewaldsummation are provided in ESI.† The energies in the gas phase areevaluated within the same periodic system with only molecule iremaining. The model presented in this paper is a microelectro-static model44,45 that includes long-range Coulomb interactions. Incontrast to the method of Poelking,46 which describes aperiodicexcitation in the periodic background, the present method assumesperiodic excitation. To minimize artefacts from this, we extendedthe system dimension, thereby approximately describing aperiodicexcitation. The present approach has a higher computational cost asit calculates interactions that will cancel out eventually, but ithas an advantage that it is compatible with most moleculardynamics packages.
Results and discussionGlass transition temperature
The simulated Tg (Tg,sim) is listed in Table 1. The availableexperimental values are also provided for comparison. It is seenthat Tg,sim is larger than Tg by 100–120 K (see DTg). This isbecause of much faster cooling rate in the simulation than foractual experiment (0.033 K ps�1 versus B1 K min�1). Accordingto the Williams–Landel–Ferry equation,47 Tg depends on thecooling rate logarithmically, and can increase by up to B10 Kwhen the cooling rate increases by an order.
Molecular orientation
Fig. 3a shows the S values of the four molecules as a function ofTsub. The distribution of S along the z direction indicates that Sconverges to the bulk value at B3 nm (6 nm for BSB-Cz) abovethe interface at which data in Fig. 3a are obtained (see Fig. S2,ESI†). Fig. 3a shows that the characteristic Tsub-dependence ofthe orientation is observed universally, i.e., at low temperaturesmolecules tend to align laterally while they exhibit randomorientation at elevated temperatures. It is also seen that longer
Table 1 Glass transition temperatures of BCS, CBP, a-NPD and BSB-Cz.DTg is the discrepancy between simulated Tg (Tg,sim) and experimental Tg
Molecule Tg,sim (K) Tg (K) DTg (K)
BCS 447 — —CBP 459 33548 124a-NPD 473 36222 111BSB-Cz 497 38920 108
Journal of Materials Chemistry C Paper
Publ
ishe
d on
22
Dec
embe
r 20
17. D
ownl
oade
d by
Seo
ul N
atio
nal U
nive
rsity
on
16/0
1/20
18 0
4:42
:42.
View Article Online

J. Mater. Chem. C This journal is©The Royal Society of Chemistry 2018
or more planar molecules have a stronger tendency to beoriented. For example, BSB-Cz, which is the longest, showsthe largest variation in the S value.
In comparison, we also plot in Fig. 3a the experimental dataon TPD, NPB, and DSA-Ph from ref. 22 with thick lines. NPBand a-NPD are the same molecule while TPD (DSA-Ph) may wellcorrespond to CBP (BSB-Cz) in terms of the molecular lengthand shape. The experimental data are shifted for the bestmatch with simulation data. (DT = 150, 145, and 210 K forTPD, NPB, and DSA-Ph, respectively.) It is noticeable that thedependence of S on Tsub is well reproduced for BSB-Cz and CBPexcept for rigid temperature shifts. This confirms that increasingthe deposition rate is equivalent to decreasing Tsub (see above). Inparticular, small, positive S factors before fully randomized arealso reproduced. An explanation on this was given in ref. 22 andwill also be discussed below.
In Fig. 3a, the agreement with experiment is rather poor fora-NPD. This is due to more three-dimensional geometry ofa-NPD, which hinders surface diffusion of molecules. Sincenaphthyl and phenyl groups of a-NPD can rotate separately andare out of plane with the long molecular axis, a-NPD moleculesare easy to be entangled with each other. (We refer to Fig. 2 inref. 11 for the three-dimensional conformations of CBP anda-NPD.) The slower diffusion results in rough surfaces because
of the fast deposition rate. The rough surface in turn tends toincrease the S value, because molecules are deposited on thesurface with more upright positions. As a result, the variation ofS is rather suppressed for a-NPD in the present simulation.Such effects of rough surfaces also appear at low Tsub for othermolecules (not shown).
Fig. 3b shows the S values of four target molecules when Tsub
is normalized by Tg. (For BCS with no extant experiment, we use333 K by subtracting the average DTg from Tg,sim.) The universalfeature suggested in experiment is also confirmed in thepresent simulation;22 in the experiment, the peak is locatedaround Tsub/Tg = 0.9 regardless of the molecule type while Speaks at B1.4 in Fig. 3b. The peak position of Tsub/Tg may shiftfrom the experimental value due to the huge gap in thedeposition rate.
The comparison with other experiments is also favorable.For instance, S values of a-NPD, CBP, BCS, and BSB-Cz werereported to be �0.0111 (�0.2049),�0.07,11 �0.17,11 and�0.33,11
respectively. The substrate temperatures were not specified inthese references but if we sample S values at 420 K (roomtemperature +120 K), they are estimated to be �0.12, �0.20,�0.25, and �0.42 for the same order of molecules, respectively.Considering experimental and theoretical uncertainties, theseagreements are reasonable. Therefore, it is concluded that theall-atom simulation can predict the S values reliably.
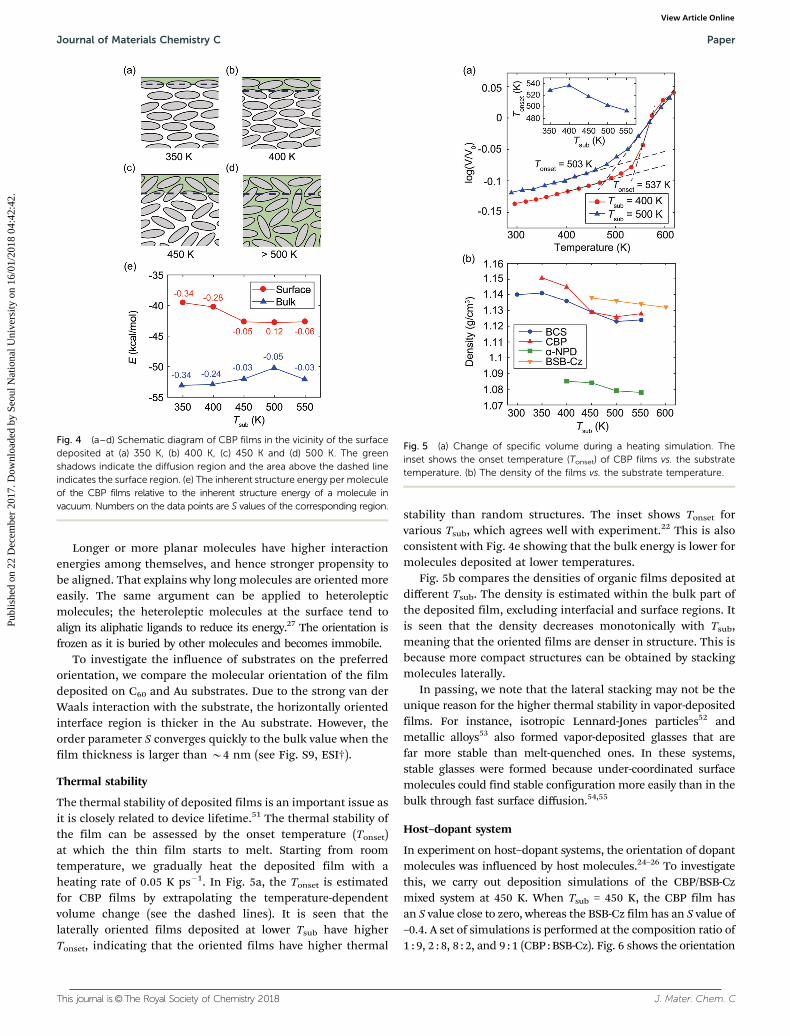
In order to understand the atomistic mechanism of preferredorientation, we closely monitored the orientational variationduring the deposition and deduced a schematic picture asillustrated in Fig. 4a–d, which is consistent with the mechanismpresented in ref. 28. The shaded (green) regions are wheremolecules can move or rotate freely. At low temperatures, themobile region is limited to the surface but it gradually expandsinto the bulk at elevated temperatures (see Fig. S8, ESI†). Fig. 4eshows inherent structure energies and S values in the surfaceand bulk regions for CBP with respect to Tsub. The inherentstructure and inherent structure energy are widely used todescribe the potential energy landscape of glass.50 The inherentstructure is the one at the local minimum of potential energy(the inherent structure energy). It is obtained by simply relaxingthe whole structure at 0 K.
We recall that the surface energy is minimum when moleculesare vertically aligned such that the molecular edges are fullyexposed to the surface. At low temperatures (Fig. 4a), surfacemolecules lie horizontally despite higher surface energy (Fig. 4e).This is because deposited molecules cannot rotate due to the thinmobile layer. As the thickness of the surface region increases,surface molecules gradually reorient to reduce the surface energy asin Fig. 4b–d. Consistently, the surface energy in Fig. 4e decreases.
When Tsub o Tg, molecules barely move in the bulk region.Therefore, the orientation at the surface region dictates theorientation of the film. This accounts for the behavior of S ofCBP in Fig. 3a up to 500 K. It also explains a slightly positivevalue at Tsub = 465 K at which a slight vertical alignment at thesurface is maintained during deposition. On the other hand, forTsub 4 Tg, molecules are highly mobile in the bulk region and theyare randomly oriented as in supercooled liquids (see Fig. 4d).
Fig. 3 (a) Orientational order parameter S vs. substrate temperature ofBCS, CBP, a-NPD, and BSB-Cz. Thick lines indicate experimental values22
of TPD (blue), a-NPD (green) and DSA-Ph (orange). The experimental dataare shifted for the best match with simulation data. (b) Orientational orderparameter S versus substrate temperature (Tsub) normalized by Tg.
Paper Journal of Materials Chemistry C
Publ
ishe
d on
22
Dec
embe
r 20
17. D
ownl
oade
d by
Seo
ul N
atio
nal U
nive
rsity
on
16/0
1/20
18 0
4:42
:42.
View Article Online
This journal is©The Royal Society of Chemistry 2018 J. Mater. Chem. C
Longer or more planar molecules have higher interactionenergies among themselves, and hence stronger propensity tobe aligned. That explains why long molecules are oriented moreeasily. The same argument can be applied to heterolepticmolecules; the heteroleptic molecules at the surface tend toalign its aliphatic ligands to reduce its energy.27 The orientation isfrozen as it is buried by other molecules and becomes immobile.
To investigate the influence of substrates on the preferredorientation, we compare the molecular orientation of the filmdeposited on C60 and Au substrates. Due to the strong van derWaals interaction with the substrate, the horizontally orientedinterface region is thicker in the Au substrate. However, theorder parameter S converges quickly to the bulk value when thefilm thickness is larger than B4 nm (see Fig. S9, ESI†).
Thermal stability
The thermal stability of deposited films is an important issue asit is closely related to device lifetime.51 The thermal stability ofthe film can be assessed by the onset temperature (Tonset)at which the thin film starts to melt. Starting from roomtemperature, we gradually heat the deposited film with aheating rate of 0.05 K ps�1. In Fig. 5a, the Tonset is estimatedfor CBP films by extrapolating the temperature-dependentvolume change (see the dashed lines). It is seen that thelaterally oriented films deposited at lower Tsub have higherTonset, indicating that the oriented films have higher thermal
stability than random structures. The inset shows Tonset forvarious Tsub, which agrees well with experiment.22 This is alsoconsistent with Fig. 4e showing that the bulk energy is lower formolecules deposited at lower temperatures.
Fig. 5b compares the densities of organic films deposited atdifferent Tsub. The density is estimated within the bulk part ofthe deposited film, excluding interfacial and surface regions. Itis seen that the density decreases monotonically with Tsub,meaning that the oriented films are denser in structure. This isbecause more compact structures can be obtained by stackingmolecules laterally.
In passing, we note that the lateral stacking may not be theunique reason for the higher thermal stability in vapor-depositedfilms. For instance, isotropic Lennard-Jones particles52 andmetallic alloys53 also formed vapor-deposited glasses that arefar more stable than melt-quenched ones. In these systems,stable glasses were formed because under-coordinated surfacemolecules could find stable configuration more easily than in thebulk through fast surface diffusion.54,55
Host–dopant system
In experiment on host–dopant systems, the orientation of dopantmolecules was influenced by host molecules.24–26 To investigatethis, we carry out deposition simulations of the CBP/BSB-Czmixed system at 450 K. When Tsub = 450 K, the CBP film hasan S value close to zero, whereas the BSB-Cz film has an S value of–0.4. A set of simulations is performed at the composition ratio of1 : 9, 2 : 8, 8 : 2, and 9 : 1 (CBP : BSB-Cz). Fig. 6 shows the orientation
Fig. 4 (a–d) Schematic diagram of CBP films in the vicinity of the surfacedeposited at (a) 350 K, (b) 400 K, (c) 450 K and (d) 500 K. The greenshadows indicate the diffusion region and the area above the dashed lineindicates the surface region. (e) The inherent structure energy per moleculeof the CBP films relative to the inherent structure energy of a molecule invacuum. Numbers on the data points are S values of the corresponding region.
Fig. 5 (a) Change of specific volume during a heating simulation. Theinset shows the onset temperature (Tonset) of CBP films vs. the substratetemperature. (b) The density of the films vs. the substrate temperature.
Journal of Materials Chemistry C Paper
Publ
ishe
d on
22
Dec
embe
r 20
17. D
ownl
oade
d by
Seo
ul N
atio
nal U
nive
rsity
on
16/0
1/20
18 0
4:42
:42.
View Article Online

J. Mater. Chem. C This journal is©The Royal Society of Chemistry 2018
of CBP and BSB-Cz molecules with respect to the compositionalratio. It is noticeable that the orientation of dopant moleculesbecomes closer to that of host molecules. For example, in a CBPdopant/BSB-Cz host system (see the right dashed ellipsoid), CBPmolecules are more horizontally oriented than in the pureCBP film, while the orientation of BSB-Cz molecules is notaffected by the dopant. Reversely, in the BSB-Cz dopant/CBPhost system (see the left dashed ellipsoid), BSB-Cz molecules aremore randomly oriented than in the pure BSB-Cz, while theorientation of CBP molecules remained to be random. Theseobservations are because the dynamics of dopant molecules isaffected by host molecules. For example, the motions of CBPdopant molecules in BSB-Cz are significantly hindered asBSB-Cz molecules barely move at the temperature as shown inFig. S10 (ESI†). The simulation results are in good agreementwith the previous experimental studies.24,26
Site energy distribution
It was reported that the mobility of the horizontally orientedfilm is more than two times higher than that of the randomlyoriented film.20 The higher mobility of oriented films wasattributed to lower energetic disorder and higher transferintegrals.29 To estimate the influence of molecular orientationon charge transport, we examine the distribution of site energiesof CBP films. The site energies are calculated in consideration ofthe electrostatic and polarization energy of the neighbouringmolecules as explained in the Method section. In Fig. 7a, wecompare the site energy distributions over the bulk region of thehorizontally oriented film and the randomly oriented film. Whilethe mean value is slightly lower for the structure deposited at550 K, the standard deviation (s), which is a measure of disorder,is almost the same within the error range. Therefore, the degreeof energetic disorder is similar between the two films, which isconsistent with ref. 29. Next, we calculate the spatial auto-correlation function C(r) of site energies which expresses thecorrelation of site energies between two sites at distance r, asdefined below:
CðrÞ ¼ ðE � mÞðEr � mÞh is2
; (4)
where m and s are the mean and standard deviation of siteenergies, and E and Er are the energies of two sites separated bydistance r. The calculated C(r) is shown in Fig. 7b. It is seen thatC(r) of the randomly oriented film (Tsub = 550 K) is almost thesame as that of the melt-quenched sample. However, thehorizontally oriented film (Tsub = 400 K) shows a higher spatialcorrelation than the film with random orientation. This meansthat energy levels of neighbouring hopping sites are similar toeach other, which may result in higher mobility. This correlationseems to originate from short-range interactions rather thanlong-range ones because site energies computed without long-range effects (cluster model) produced similar C(r) (not shown).
Conclusions
In summary, we carried out the all-atom simulation of vapordeposition and investigated how the molecular orientationvaries with respect to various factors such as the substratetemperature, molecular shape, and compositional ratio. Thesimulation results were in good agreement with experiment,confirming many key features in experiment. We showed thatthe molecular orientation has characteristic dependence onTsub, and molecular shape or host molecules affect the degreeof orientation. Through the analysis of inherent structureenergy and the kinetic behaviour, we confirmed the mechanismby which the kinetically determined orientation of surface
Fig. 6 Orientation order parameter S vs. the ratio of BSB-Cz in a CBP/BSB-Cz mixed system. Insets show the schematic configuration of themixed films of CBP (short and red) and BSB-Cz (long and blue).
Fig. 7 (a) Site energy distributions, and (b) spatial autocorrelation function(C(r)) for the horizontally (Tsub = 400 K) or randomly (Tsub = 550 K) orientedCBP films. For comparison, C(r) for the melt-quenched CBP film is alsopresented in (b). Site energy distribution and spatial autocorrelation areevaluated in the bulk region of the film.
Paper Journal of Materials Chemistry C
Publ
ishe
d on
22
Dec
embe
r 20
17. D
ownl
oade
d by
Seo
ul N
atio
nal U
nive
rsity
on
16/0
1/20
18 0
4:42
:42.
View Article Online

This journal is©The Royal Society of Chemistry 2018 J. Mater. Chem. C
molecules dictates the S factor in the bulk region. The higherthermal stability of oriented films was demonstrated by calculatingonset temperatures. The higher spatial correlation in site energiesmay contribute to the enhanced electrical conductivity of orientedfilms. In conclusion, we believe that the all-atom simulation is apowerful method to theoretically predict the preferred orientationsof amorphous organic films.
Conflicts of interest
There are no conflicts of interest to declare.
Acknowledgements
This research was supported by Samsung Display. The computationswere performed at the KISTI supercomputing center (Grant No.KSC-2017-C3-0019).
References
1 M. A. Baldo, S. Lamansky, P. E. Burrows, M. E. Thompsonand S. R. Forrest, Appl. Phys. Lett., 1999, 75, 4–6.
2 S. Reineke, F. Lindner, G. Schwartz, N. Seidler, K. Walzer,B. Lussem and K. Leo, Nature, 2009, 459, 234–238.
3 B. W. D’Andrade and S. R. Forrest, Adv. Mater., 2004, 16,1585–1595.
4 A. P. Kulkarni, C. J. Tonzola, A. Babel and S. A. Jenekhe,Chem. Mater., 2004, 16, 4556–4573.
5 E. Jung, H. Lee, H. Chae and S. M. Cho, Electron. Mater. Lett.,2015, 11, 764–768.
6 L. Schmidt-Mende, A. Fechtenkotter, K. Mullen, E. Moons,R. H. Friend and J. D. MacKenzie, Science, 2001, 293,1119–1122.
7 Y. Sun, G. C. Welch, W. L. Leong, C. J. Takacs, G. C. Bazanand A. J. Heeger, Nat. Mater., 2012, 11, 44–48.
8 J.-H. Kim, E.-K. Park, J.-H. Kim, H. J. Cho, D.-H. Lee andY.-S. Kim, Electron. Mater. Lett., 2016, 12, 383–387.
9 G. Giri, E. Verploegen, S. C. B. Mannsfeld, S. Atahan-Evrenk,D. H. Kim, S. Y. Lee, H. A. Becerril, A. Aspuru-Guzik, M. F.Toney and Z. Bao, Nature, 2011, 480, 504–508.
10 C. Kim, A. Facchetti and T. J. Marks, Science, 2007, 318,76–80.
11 D. Yokoyama, J. Mater. Chem., 2011, 21, 19187–19202.12 K.-H. Kim, S. Lee, C. Moon, S.-Y. Kim, Y. Park, J.-H. Lee,
J. W. Lee, J. Huh, Y. You and J. Kim, Nat. Commun., 2014,5, 4769.
13 L. Zhao, T. Komino, D. H. Kim, M. H. Sazzad, D. Pitrat,J.-C. Mulatier, C. Andraud, J.-C. Ribierre and C. Adachi,J. Mater. Chem. C, 2016, 4, 11557–11565.
14 D. H. Kim, K. Inada, L. Zhao, T. Komino, N. Matsumoto,J. C. Ribierre and C. Adachi, J. Mater. Chem. C, 2017, 5,1216–1223.
15 H.-W. Lin, C.-L. Lin, H.-H. Chang, Y.-T. Lin, C.-C. Wu, Y.-M.Chen, R.-T. Chen, Y.-Y. Chien and K.-T. Wong, J. Appl. Phys.,2004, 95, 881–886.
16 D. Yokoyama, A. Sakaguchi, M. Suzuki and C. Adachi, Appl.Phys. Lett., 2008, 93, 173302.
17 D. Yokoyama, A. Sakaguchi, M. Suzuki and C. Adachi, Org.Electron., 2009, 10, 127–137.
18 M. Flammich, J. Frischeisen, D. S. Setz, D. Michaelis,B. C. Krummacher, T. D. Schmidt, W. Brutting andN. Danz, Org. Electron., 2011, 12, 1663–1668.
19 H. Yoshida, K. Yamada, J. Tsutsumi and N. Sato, Phys. Rev.B: Condens. Matter Mater. Phys., 2015, 92, 75145.
20 D. Yokoyama, Y. Setoguchi, A. Sakaguchi, M. Suzuki andC. Adachi, Adv. Funct. Mater., 2010, 20, 386–391.
21 D. M. Walters, R. Richert and M. D. Ediger, J. Chem. Phys.,2015, 142, 134504.
22 S. S. Dalal, D. M. Walters, I. Lyubimov, J. J. de Pablo andM. D. Ediger, Proc. Natl. Acad. Sci. U. S. A., 2015, 112,4227–4232.
23 K. L. Kearns, S. F. Swallen, M. D. Ediger, T. Wu and L. Yu,J. Chem. Phys., 2007, 127, 154702.
24 C. Mayr and W. Brutting, Chem. Mater., 2015, 27, 2759–2762.25 C.-K. Moon, K.-H. Kim, J. W. Lee and J.-J. Kim, Chem. Mater.,
2015, 27, 2767–2769.26 J. Jiang, D. M. Walters, D. Zhou and M. D. Ediger, Soft
Matter, 2016, 12, 3265–3270.27 M. J. Jurow, C. Mayr, T. D. Schmidt, T. Lampe, P. I. Djurovich,
W. Brutting and M. E. Thompson, Nat. Mater., 2015, 15, 85–91.28 I. Lyubimov, L. Antony, D. M. Walters, D. Rodney, M. D. Ediger
and J. J. de Pablo, J. Chem. Phys., 2015, 143, 94502.29 L. W. Antony, N. E. Jackson, I. Lyubimov, V. Vishwanath,
M. D. Ediger and J. J. de Pablo, ACS Cent. Sci., 2017, 3,415–424.
30 J. Rafols-Ribe, R. Dettori, P. Ferrando-Villalba, M. Gonzalez-Silveira, L. Abad, A. Lopeandıa, L. Colombo and J. Rodrıguez-Viejo, 2017, arXiv:1710.10123.
31 S. Plimpton, J. Comput. Phys., 1995, 117, 1–19.32 W. L. Jorgensen, D. S. Maxwell and J. Tirado-Rives, J. Am.
Chem. Soc., 1996, 118, 11225–11236.33 G. A. Kaminski, R. A. Friesner, J. Tirado-Rives and
W. L. Jorgensen, J. Phys. Chem. B, 2001, 105, 6474–6487.34 F. May, M. Al-Helwi, B. Baumeier, W. Kowalsky, E. Fuchs,
C. Lennartz and D. Andrienko, J. Am. Chem. Soc., 2012, 134,13818–13822.
35 Z. B. Wang, M. G. Helander, Z. W. Liu, M. T. Greiner, J. Qiuand Z. H. Lu, Appl. Phys. Lett., 2010, 96, 1–4.
36 M. Sigalov, A. Ben-Asuly, L. Shapiro, A. Ellern andV. Khodorkovsky, Tetrahedron Lett., 2000, 41, 8573–8576.
37 X. Zhang, Z. Chi, Z. Yang, M. Chen, B. Xu, L. Zhou, C. Wang,Y. Zhang, S. Liu and J. Xu, Opt. Mater., 2009, 32, 94–98.
38 P. Ren and J. W. Ponder, J. Comput. Chem., 2002, 23,1497–1506.
39 P. Ren and J. W. Ponder, J. Phys. Chem. B, 2003, 107, 5933–5947.40 J. W. Ponder, C. Wu, P. Ren, V. S. Pande, J. D. Chodera,
M. J. Schnieders, I. Haque, D. L. Mobley, D. S. Lambrecht,R. A. DiStasio, M. Head-Gordon, G. N. I. Clark, M. E. Johnsonand T. Head-Gordon, J. Phys. Chem. B, 2010, 114, 2549–2564.
41 Y. Shi, Z. Xia, J. Zhang, R. Best, C. Wu, J. W. Ponder andP. Ren, J. Chem. Theory Comput., 2013, 9, 4046–4063.
Journal of Materials Chemistry C Paper
Publ
ishe
d on
22
Dec
embe
r 20
17. D
ownl
oade
d by
Seo
ul N
atio
nal U
nive
rsity
on
16/0
1/20
18 0
4:42
:42.
View Article Online

J. Mater. Chem. C This journal is©The Royal Society of Chemistry 2018
42 M. Valiev, E. J. Bylaska, N. Govind, K. Kowalski, T. P. Straatsma,H. J. J. Van Dam, D. Wang, J. Nieplocha, E. Apra, T. L. Windusand W. A. de Jong, Comput. Phys. Commun., 2010, 181, 1477–1489.
43 A. J. Stone, J. Chem. Theory Comput., 2005, 1, 1128–1132.44 S. Verlaak and P. Heremans, Phys. Rev. B: Condens. Matter
Mater. Phys., 2007, 75, 115127.45 S. M. Ryno, S. R. Lee, J. S. Sears, C. Risko and J. L. Bredas,
J. Phys. Chem. C, 2013, 117, 13853–13860.46 C. Poelking and D. Andrienko, J. Chem. Theory Comput.,
2016, 12, 4516–4523.47 A. Soldera and N. Metatla, Phys. Rev. E: Stat., Nonlinear, Soft
Matter Phys., 2006, 74, 61803.48 M.-H. Tsai, Y.-H. Hong, C.-H. Chang, H.-C. Su, C.-C.
Wu, A. Matoliukstyte, J. Simokaitiene, S. Grigalevicius,
J. V. Grazulevicius and C.-P. Hsu, Adv. Mater., 2007, 19,862–866.
49 Y. Sakai, M. Shibata and D. Yokoyama, Appl. Phys. Express,2015, 8, 96601.
50 F. H. Stillinger, Science, 1995, 267, 1935–1939.51 M. Kim, S. K. Jeon, S.-H. Hwang and J. Y. Lee, Adv. Mater.,
2015, 27, 2515–2520.52 D. R. Reid, I. Lyubimov, M. D. Ediger and J. J. de Pablo, Nat.
Commun., 2016, 7, 13062.53 J. Q. Wang, Y. Shen, J. H. Perepezko and M. D. Ediger, Acta
Mater., 2016, 104, 25–32.54 L. Yu, Adv. Drug Delivery Rev., 2016, 100, 3–9.55 S. L. L. M. Ramos, A. K. Chigira and M. Oguni, J. Phys. Chem. B,
2015, 119, 4076–4083.
Paper Journal of Materials Chemistry C
Publ
ishe
d on
22
Dec
embe
r 20
17. D
ownl
oade
d by
Seo
ul N
atio
nal U
nive
rsity
on
16/0
1/20
18 0
4:42
:42.
View Article Online