Embed Size (px)
Citation preview

http://jom.sagepub.com
Journal of Management
DOI: 10.1177/0149206306290712 2006; 32; 646 Journal of Management
Michael H. Lubatkin, Zeki Simsek, Yan Ling and John F. Veiga Role of Top Management Team Behavioral Integration
Ambidexterity and Performance in Small-to Medium-Sized Firms: The Pivotal
http://jom.sagepub.com/cgi/content/abstract/32/5/646 The online version of this article can be found at:
Published by:
http://www.sagepublications.com
On behalf of:
Southern Management Association
can be found at:Journal of Management Additional services and information for
http://jom.sagepub.com/cgi/alerts Email Alerts:
http://jom.sagepub.com/subscriptions Subscriptions:
http://www.sagepub.com/journalsReprints.navReprints:
http://www.sagepub.com/journalsPermissions.navPermissions:
http://jom.sagepub.com/cgi/content/refs/32/5/646SAGE Journals Online and HighWire Press platforms):
(this article cites 48 articles hosted on the Citations
© 2006 Southern Management Association. All rights reserved. Not for commercial use or unauthorized distribution. at PENNSYLVANIA STATE UNIV on April 17, 2008 http://jom.sagepub.comDownloaded from

Ambidexterity and Performance inSmall- to Medium-Sized Firms: The Pivotal
Role of Top Management TeamBehavioral Integration†
Michael H. Lubatkin*Zeki Simsek
Management Department, School of Business, University of Connecticut,2100 Hillside Road Unit 1041, Storrs, CT 06269-1041
Yan LingManagement Department, George Mason University, Fairfax, Virginia
John F. VeigaManagement Department, School of Business, University of Connecticut,
2100 Hillside Road Unit 1041, Storrs, CT 06269-1041
While a firm’s ability to jointly pursue both an exploitative and exploratory orientation has beenposited as having positive performance effects, little is currently known about the antecedentsand consequences of such ambidexterity in small- to medium-sized firms (SMEs). To that end,this study focuses on the pivotal role of top management team (TMT) behavioral integration infacilitating the processing of disparate demands essential to attaining ambidexterity in SMEs.Then, to address the bottom-line importance of an ambidextrous orientation, the study hypoth-esizes its association with relative firm performance. Multisource survey data, including CEOsand TMT members from 139 SMEs, provide support for both hypotheses.
Keywords: behavioral integration; top management teams; ambidexterity; exploratory andexploitative orientation
646
†This study was conducted as part of the dissertation of the first author under the supervision of the second author.
*Corresponding author. Tel.: 860-486-3482; fax: 860-486-6415.
E-mail address: [email protected]
Journal of Management, Vol. 32 No. 5, October 2006 646-672DOI: 10.1177/0149206306290712© 2006 Southern Management Association. All rights reserved.
© 2006 Southern Management Association. All rights reserved. Not for commercial use or unauthorized distribution. at PENNSYLVANIA STATE UNIV on April 17, 2008 http://jom.sagepub.comDownloaded from
Lubatkin et al. / TMT Behavioral Integration 647
Organization theorists have recently adopted the human trait of ambidexterity, or the abil-ity of individuals to use both their hands with equal skill, as a metaphor to describe organi-zations. As defined, ambidextrous firms are capable of exploiting existing competencies aswell as exploring new opportunities with equal dexterity. However, because exploitative andexploratory orientations emerge from contradictory knowledge-processing capabilities(Floyd & Lane, 2000), researchers debate how, or even if, firms can achieve both orienta-tions and whether such a pursuit results in higher performance.
Those researchers who view ambidexterity as an attainable outcome have highlighted thestructures (Benner & Tushman, 2003; Tushman & O’Reilly, 1996; 1997), meta-routines(Adler, Goldoftas, & Levine, 1999), and behavioral contexts (Gibson & Birkinshaw, 2004)that promote it, as well as the integrative role of the top management team (TMT) in helpingto create such mechanisms (Smith & Tushman, 2005). For example, Tushman and O’Reillysuggested that ambidexterity is largely driven by TMTs’ “internal processes that enable themto handle large amounts of information and decision alternatives and deal with conflict andambiguity” (1997: 23), but they did not specify the precise nature of these TMT processes.
To gain a better understanding of the underlying processes, we focus on the pivotal roleof “behavioral integration,” an all-inclusive TMT process construct that Hambrick (1994)considered a major refinement to upper echelon theory. Intended to capture the level of thesenior team’s wholeness and unity of effort, a behaviorally integrated TMT is better able tosynchronize the team’s social and task processes, including the quality of informationexchange, collaborative behavior, and joint decision making (Hambrick, 1994; Simsek,Veiga, Lubatkin, & Dino, 2005). Our thesis is that a TMT’s level of behavioral integrationdirectly influences how its members deal with the contradictory knowledge processes thatunderpin the attainment of an exploitative and exploratory orientation, such that greater inte-gration enhances the likelihood of jointly pursuing both.
To test this thesis, we chose small- to medium-sized firms (SMEs) as a sampling framebecause firms of this size (i.e., employing 20 to 500 individuals) and age (considerably olderthan start-ups) present a more direct litmus test of this link. We infer this because SMEs, likelarger firms, generally face the kind of competitive pressures to jointly pursue exploitationand exploration. However, SMEs lack the amount of slack resources and the kind of hierar-chical administrative systems that can help or impede larger firms in managing their contra-dictory knowledge processes and, thus, affect the attainment of ambidexterity. For example,larger firms can manage these processes by creating structurally separate business units,some focusing entirely on exploitation and others entirely on exploration.
Lacking these facilitating mechanisms, we argue, SMEs have to rely more on the abilityof their TMT to attain ambidexterity. In particular, because SMEs have fewer hierarchicallevels, their top managers are more likely to play both strategic and operational roles and,therefore, they directly experience the added dissonance of competing knowledge demandsinherent in the pursuit of an ambidextrous orientation. Thus, to the extent that ambidexterityis largely facilitated by the senior management team’s internal processes, as suggested byTushman and O’Reilly (1997), we reason that the level of TMTs’ behavioral integration inSMEs is pivotal in effectively coping with, and integrating, these disparate demands.
In addition, whereas some scholars argue that firm performance is enhanced when firmsengage in “sufficient exploitation and enough exploration” (Levinthal & March 1993), and
© 2006 Southern Management Association. All rights reserved. Not for commercial use or unauthorized distribution. at PENNSYLVANIA STATE UNIV on April 17, 2008 http://jom.sagepub.comDownloaded from
others find some support for this claim using cross-sectional data (Gibson & Birkinshaw 2004;He & Wong, 2004), still others question the robustness of this claim. For example, March(1991) asserted that given the inherent difficulties of attaining and maintaining a proper bal-ance between exploration and exploitation, firms might run the risk of being mediocre at both.Indeed, pursuing this point of view, some suggest that firms should primarily concentrate theirresources, management routines, and knowledge flows in only one direction, allowing for onlymarginal consideration of the other direction (Barney, 1991; Ghemawat & Costa, 1993; Porter,1985). Therefore, we theoretically examine whether an SME’s joint pursuit of exploration andexploitation enhances its performance and then empirically test this association using subse-quent relative performance data gathered 1 year later.
Finally, we recognize that aside from theoretical justifications for studying SMEs, thereis also an important practical reason. SMEs represent a vital component of most nations’economies. In the United States alone, SMEs are, by far, the most common form of busi-ness organization, generating about 70% of all jobs in the country (Small BusinessAssociation, 2003). Yet, despite their ubiquity, SMEs tend to be overlooked by manage-ment scholars, generally because data about them are not readily available. Instead, theextant literature on TMT processes and ambidexterity has tended to focus on larger firms,ones that typically compete with multiple businesses in multiple markets, leaving a gap inour understanding. To begin to fill this gap, we test our hypotheses using multisource sur-vey data from 139 SMEs, which were gathered from their CEOs and 369 of their TMTmembers. In so doing, we provide an upper echelon explanation of SME-level ambidex-terity and performance.
Exploitation and Exploration
Researchers have either implicitly or explicitly noted that exploitation and explorationentail contradictory knowledge processes (Floyd & Lane, 2000). On one hand, exploitationinvolves the use of explicit knowledge bases, such that by internalizing and combining them,incremental refinements to existing technological or marketing trajectories can be made(Nonaka, 1994). In effect, the intent of exploitation is to respond to current environmentalconditions by adapting existing technologies and further meeting the needs of existing cus-tomers (Harry & Schroeder, 2000). In contrast, exploration involves the use of tacit knowl-edge bases, such that by externalizing and combining them, new technological or marketingtrajectories are developed (Nonaka, 1994). Essentially, exploration is intended to respond to,as well as drive, latent environmental trends by creating innovative technologies and newmarkets.
Fundamentally, these knowledge processes are contradictory because they tap differentadministrative routines and managerial behaviors. Exploitation primarily involves learningfrom a top-down process, in which senior managers move to institutionalize those routinesand behaviors that are best suited for refining current competencies. In contrast, explorationgenerally involves a bottom-up learning process, in which senior managers are persuaded toabandon their old routines and make a commitment to a new course of action (Wooldridge &Floyd, 1989). Unlike exploitation, exploration necessitates developing new skills and internal
648 Journal of Management / October 2006
© 2006 Southern Management Association. All rights reserved. Not for commercial use or unauthorized distribution. at PENNSYLVANIA STATE UNIV on April 17, 2008 http://jom.sagepub.comDownloaded from
selection processes that are expected to yield a sufficient variety of autonomous strategicinitiatives, that is, experiments with new skills or market opportunities that are triggered byshifts in factor or product markets (Burgelman, 1991). And, whereas exploitation entails largelyformalized interactions between levels of management, exploration entails intensely sociopolit-ical interactions that, because they are influenced by where managers reside in the organization’shierarchy, may cause managers to perceive the need to adapt differently (Weick, 1995).
Although SMEs face similar knowledge-processing demands as do their larger counter-parts, SMEs differ significantly in the impediments that they face in dealing with theseprocesses. For example, because they are closest to the changing trends in customer demand,the operating managers at both firm types are generally the first to feel the need to explorenew sources of competitive advantage. At large firms, however, the operating managers typ-ically communicate their insights and recommended initiatives to middle managers, who, inturn, choose what to convey, if anything, to senior managers. In some instances, middle man-agers may feel conflicted, particularly if these initiatives entail changing routines, compe-tencies, and resource allocations, which threaten the status quo (Floyd & Lane, 2000).Consequently, middle managers may choose to filter or alter the meaning of cues from theoperating-level managers to suit their own interpretation or to promote their own agenda.They may do so, even at the expense of their operating managers (Dutton & Jackson, 1987),the firm’s strategic selection process, and the firm’s performance.
In contrast, such organizational impediments tend to be minimized in SMEs, simplybecause the members of their TMTs are much closer to the firm’s operating core. Indeed,senior managers in SMEs not only ratify and direct their firm’s strategy, as do their counter-parts in larger firms, but they also participate more directly in the day-to-day implementa-tion of those strategies, as do the operating managers in larger firms. Consequently, thesemanagers are closer to the firm’s existing competencies and, therefore, are knowledgeableabout when and how to exploit them. They are also closer to the markets and, therefore, arepositioned to be more aware of changing trends in customer demand. This enables them topotentially discover, evaluate, and champion new market opportunities more directly—activitiesthat lie at the heart of exploration.
Such potential notwithstanding, however, the ability of senior managers in SMEs to guideknowledge processes in ways that promote an ambidextrous orientation is not a given. Indeed,studies of SMEs have shown these firms to be, on average, biased toward exploratoryprocesses, such as the proactive acquisition of new information (Zahra, Ireland, & Hitt, 2000),higher level learning (Busenitz & Barney, 1997), product leadership (Eisenhardt &Schoonhoven, 1990), and the aggressive use of resources in new arenas (Romanelli, 1987). Inother words, despite facing fewer organizational learning impediments, senior managers inSMEs will experience dissonance in trying to reconcile contradictory knowledge demands,particularly because they are often expected to play both operating and strategic roles.
To illustrate, consider a senior operations manager who has invested a considerableamount of time and energy researching a new process technology that could improve the pro-duction efficiency of the firm’s current product line. Although operationally this new tech-nology could be important, as a member of the firm’s TMT, this manager knows that theteam may not support it for strategic reasons. In particular, the team has begun to convergeon a plan to invest in a new product line that is unlikely to benefit from the new process
Lubatkin et al. / TMT Behavioral Integration 649
© 2006 Southern Management Association. All rights reserved. Not for commercial use or unauthorized distribution. at PENNSYLVANIA STATE UNIV on April 17, 2008 http://jom.sagepub.comDownloaded from
technology but better meets the market’s changing needs. Thus, the dilemma is, Should theoperations manager pursue his or her operating agenda by championing the new technology,or should he or she pursue the team’s strategic agenda and remain silent about the technol-ogy? We reason that reconciling this dissonance places a premium on the kind of TMTprocesses that encourage the sharing of valuable insights, along with a platform for recon-ciling contradictory role demands. As such, we posit that the ability to jointly pursueexploitation and exploration in SMEs is directly rooted in the extent to which their TMTs arebehaviorally integrated.
Theory and Hypotheses
As a starting point to ground this argument, we turn to the team process research, whichintegrates the upper echelon view of the firm (Hambrick & Mason, 1984) with group processtheory (Shaw, 1981) and examines how TMT processes work to influence team and/or firmoutcomes such as strategies and performance. Previous studies in this line of inquiry haveexamined various team process constructs, including communication quality (O’Reilly,Snyder, & Boothe, 1993), communication frequency (Smith, Smith, Olian, Sims, O’Bannon,& Scully, 1994), speed in decision-making processes (Eisenhardt, 1989), debate (Simons,Pelled, & Smith, 1999), decision comprehensiveness (Simons et al., 1999), social integration(Smith et al., 1994), and interpersonal conflict and agreement seeking (Knight et al., 1999).Knight et al. (1999) succinctly captured the essence of this research stream when they notedthat the central arguments behind these studies pertain to team processes that either providegreater efficiency (e.g., reducing costs or increasing speed in decision making) or greatereffectiveness (e.g., making better decisions).
This research has moved the field closer to understanding some of the complexities of theTMT process. However, Hambrick (1994) reasoned that there is more to reveal becauseTMT processes are distinct from group processes at other levels in the organization, in partbecause TMT members face higher levels of firm-related task responsibilities, individuallyas senior executives and interdependently as members of a firm’s top decision-making team.Therefore, he parsimoniously recast specific social and task team processes into the all-encompassing metaconstruct of behavioral integration, consisting of one social dimension(the level of the team’s collaborative behavior) and two task dimensions (the team’s quantityand quality of information exchanged and its emphasis on joint decision making). He arguedthat these mutually reinforcing processes, when taken in concert, better capture a TMT’slevel of wholeness and unity of effort than does each dimension when examined separately.For example, because “fragmented teams” are victims of minimal interaction and impover-ished decision making (Hambrick, 1995) but may also display high degrees of cohesion(Janis, 1972), failure to examine all aspects of the team’s process could result in misspeci-fying the team’s level of behavioral integration.
Recent research has advanced behavioral integration’s authenticity by developing a reli-able measure of it and confirming its multilevel origin (Simsek et al., 2005). In addition,there has also been work on behavioral integration’s consequences. For example, Hambrick(1995) noted that firms that have difficulty adapting to external challenges in a timely manner
650 Journal of Management / October 2006
© 2006 Southern Management Association. All rights reserved. Not for commercial use or unauthorized distribution. at PENNSYLVANIA STATE UNIV on April 17, 2008 http://jom.sagepub.comDownloaded from
Lubatkin et al. / TMT Behavioral Integration 651
have the least integrated TMTs. Siegel and Hambrick (1996) argued that behaviorallyintegrated teams make better use of knowledge alternatives because cognitive conflict insuch teams affords them more opportunities to debate and discuss strategic issues. Similarly,Hambrick (1998) concluded that behavioral integration enables the TMT to combine knowl-edge and insights to respond well to the increasing needs of the market, to create core com-petencies, and to develop global strategies. Li and Zhang (2002) found that behavioral inte-gration facilitated product innovation intensity, and Carmeli and Schaubroeck (in press)found that it improved the quality of TMT decisions. In sum, this stream of work further sub-stantiates Hambrick’s assertion that truly integrated teams engage in several interrelatedprocesses, reflecting the inherent complexity and dynamism of strategic decision makingthat cannot be adequately captured by any single process dimension.
Behavioral Integration and SME Ambidexterity
Building on this stream of work, we posit that behaviorally integrated TMTs in SMEs arebetter able to manage the contradictory knowledge processes, which are required to attain anambidextrous orientation. That is, by synchronizing the social and task processes associatedwith collaborative behavior, quality of information exchange, and joint decision making, abehaviorally integrated TMT can promote a more diverse and deeper understanding of theteam’s existing explicit knowledge base, as well as a better use of that base. In effect, suchsynchronization increases the “opportunity for feedback and error correction and . . .synthesis of different points of view” (Tushman & Nadler, 1978: 618). Said differently, theextent to which a TMT is behaviorally integrated is positively associated with an SME’s abilityto adapt to current environmental challenges, by revealing ways to further refine the firm’sexisting technological and marketing trajectories to the senior executives.
Similarly, by promoting a collaborative, high-quality exchange of information, behavioralintegration engenders social mechanisms such as trust and reciprocity (Coleman, 1990;Granovetter, 1985; Uzzi, 1997), which should further serve to dissipate a team member’sreluctance to sharing tacit knowledge, critical to exploration. Therefore, behaviorally inte-grated TMTs should be better able to draw from a diverse set of insights from their seniorexecutives—each a repository of tacit knowledge based on frequent interactions at the oper-ating level with the external market and internal organizational environment. Such divergentknowledge sharing promotes the TMT’s externalizing and combining of its tacit knowledgebase and, therefore, the discovery of new opportunities. Or, as Hambrick (1998) observed,behavioral integration enables the TMT to combine knowledge in ways that can create newinsights and competencies regarding the firm’s strategic options.
Conversely, absent behavioral integration and the associated interaction and collabora-tion, team members are more likely to resolve any dissonance they face by focusing “on theirown piece of the enterprise” (Hambrick, 1998: 123). At this extreme, TMT coordination ismore likely to be limited to bilateral exchanges coupled with infrequent and highly distilledcommunication (Hambrick, Li, Xin, & Tsui, 2001). Consequently, less behaviorally inte-grated TMTs are more prone to divert their attention to team maintenance, as well as torequire costly formal rules to function (Smith et al., 1994), all of which detracts from thelikelihood of developing an ambidextrous orientation in an SME.
© 2006 Southern Management Association. All rights reserved. Not for commercial use or unauthorized distribution. at PENNSYLVANIA STATE UNIV on April 17, 2008 http://jom.sagepub.comDownloaded from

652 Journal of Management / October 2006
Suppose, for example, a senior marketing manager in an SME envisions a new productinnovation that could move the firm into an entirely new market. If this manager is part of aless behaviorally integrated TMT, he or she might naturally feel reluctant to champion theinitiative because this individual expects that the team will be less receptive and supportiveof ideas that might deviate from the status quo. If, however, this manager is part of a morebehaviorally integrated TMT, he or she should be a more willing champion. We say thatbecause, in a climate of collaboration, where a general predisposition also exists to freelyexchange information and jointly make decisions, we expect that the TMT members will bemore receptive to a broad range of initiatives. And, from an open discussion of existing andnew market opportunities, coupled with a willingness to share explicit knowledge and tacitinsights, such a team will be more apt to uncover ways to feasibly pursue new markets, whilejointly expanding existing ones. In effect, this scenario reinforces Nonaka’s (1994) argumentthat “although ideas are formed in the minds of individuals, interactions typically play a crit-ical role in developing these ideas,” and it is through this “community of interaction that neworganizational knowledge is developed.”
In sum, a behaviorally integrated TMT acts as a forum in which senior executives canopenly and freely exchange contradictory knowledge, resolve conflicts, and create a set ofshared perceptions that then can be integrated and acted upon, thereby facilitating the firm’sdevelopment of a more ambidextrous orientation. Stated formally,
Hypothesis 1: The level of behavioral integration of TMTs in SMEs is positively associated withthe extent to which they pursue an ambidextrous orientation.
Ambidexterity and SME Performance
But, is an SME’s ambidextrous orientation linked to its subsequent performance?Although a positive association is implicit in much of the grounding of our first hypothesisand in the recent literature (e.g., Gibson & Birkinshaw 2004; He & Wong, 2004), this causallink has neither been theoretically clear nor empirically established. Indeed, some have pre-viously argued that the pursuit of ambidexterity is no guarantee of subsequent performance(Barney, 1991; Ghemawat & Costa, 1993), given the difficulties of attaining and maintain-ing a proper balance of exploration and exploitation (March, 1991). We opt for the morerecent view, basing our position on Floyd and Lane’s assertion that in order for firms toremain adaptive and escape the forces of environmental selection, they must “exploit exist-ing competencies and explore new ones—and more importantly, that these two facets oforganizational learning are inseparable” (2000: 155).
Consider SMEs that primarily pursue exploration and, therefore, are proficient at proac-tively responding to environmental changes by seeking revolutionary innovations. Thesefirms may have positive performance outcomes, particularly should they discover a newcompetency that shapes the rules of the competitive game in ways that rivals will have difficultyimitating or if they are able to expand their customer base into new or emerging markets(Brown & Eisenhardt, 1997). However, such initiatives also entail some inherent riskbecause their benefits are difficult to estimate a priori and may take years to realize, if theydo so at all. These risks can be particularly onerous for SMEs, which lack the resources to
© 2006 Southern Management Association. All rights reserved. Not for commercial use or unauthorized distribution. at PENNSYLVANIA STATE UNIV on April 17, 2008 http://jom.sagepub.comDownloaded from
Lubatkin et al. / TMT Behavioral Integration 653
sustain such efforts for extended periods of time. Moreover, SMEs that are only deft inexploration incur significant costs both in terms of research and in the potential loss of sus-tained paybacks from earlier innovations, making them more vulnerable to efficiency-minded and larger competitors. Indeed, as Levinthal and March note, “An organization thatengages exclusively in exploration will ordinarily suffer from the fact that it never gains thereturns of its knowledge” (1993: 105).
In contrast, consider SMEs that primarily pursue exploitation and, therefore, strive tomake incremental refinements to existing technological or marketing trajectories intendedto better adapt to current environmental conditions and to the needs of the firm’s existingcustomers (Harry & Schroeder, 2000). Although the returns to these firms may be moreproximate and predictable than those who pursue exploration, their returns are not neces-sarily sustainable because they run the risk of obsolescence. Deftly pursuing exploitationcan cause a firm to be effective at adapting to incremental trajectory changes, but the firmwill be ineffective at adapting to major changes, including those introduced by theirexploratory-driven rivals, echoing the sentiments of Levinthal and March who suggestedthat “an organization that engages exclusively in exploitation will ordinarily suffer fromobsolescence” (1993: 105).
Recognizing the adaptive limitations of each orientation and the indeterminate associa-tion each would seem to have with performance, scholars have long suggested, but have yetto conclusively show, that a firm’s ability to compete is rooted in an ability to jointly pursueboth orientations, that is, build on current competencies through exploitation, while devel-oping new innovative capabilities through exploration, such that the pursuit of both posi-tively affects the productive service of each (Abernathy, 1978). Indeed, the ability to achievesuch a level of ambidexterity is said to lie at the heart of a firm’s dynamic capabilities(Eisenhardt & Martin, 2000; Teece, Pisano, & Shuen, 1997).
Accordingly, we reason that although an ambidextrous orientation does not assure subse-quent SME performance, it is an essential core driver that should enhance returns for the firmrelative to its competitors—as they are better able to attain and sustain their advantages inthe marketplace and, thus, are more able to shield their future cash flows from external selec-tion pressures. We also reason that the empirical linkage between ambidexterity and thefirm’s relative performance will be more evident at SMEs than at larger firms, given thatdeterminants of performance at the latter are driven by a larger set of influences extraneousto TMT diversity, such as multiple products, markets, and divisions. Thus,
Hypothesis 2: The extent to which SMEs pursue an ambidextrous orientation is positively associ-ated with their subsequent relative performance.
Method
Sampling Strategy and Data
Using data from D&B’s Million Dollar Database, we identified 795 small- to medium-sizedfirms (i.e., employing 20 to 500 individuals) in one region of New England to facilitate meetingeach firm’s CEO. Letters, endorsed by the director of the local Small Business Development
© 2006 Southern Management Association. All rights reserved. Not for commercial use or unauthorized distribution. at PENNSYLVANIA STATE UNIV on April 17, 2008 http://jom.sagepub.comDownloaded from

654 Journal of Management / October 2006
Center, were sent to the CEOs of these firms. These letters explained the research project,encouraged participation, promised that each participating firm would receive an executivesummary of the findings when the study was completed, and indicated that we would followup by telephone. We then began contacting CEOs to request participation and, if they agreed,to schedule a meeting. One hundred ninety-three CEOs agreed. During the meeting, the natureof the study was further explained, and each CEO was given a survey to complete and returnvia a postage-paid envelope. Then, following prior studies (e.g., Smith, Collins, & Clark, 2005;Smith et al., 1994), we asked these CEOs to identify all the members of their TMT and to senda memo encouraging each member to participate, along with a survey and postage-paid returnenvelope. After excluding incomplete surveys and surveys from firms that had less than a 50%TMT member response rate, we received usable responses from 154 firms’ CEOs and 405 oftheir TMT members (or 19% of the original sampling frame of 795 firms).
In addition, we sent a follow-up survey to the 154 firms’ CEOs 1 year after our first sur-vey, to assess relative firm performance, and 90% responded, resulting in a final sample of139 firms. We gathered these time-lagged performance data 1 year later for two reasons. First,on the basis of Podsakoff, MacKenzie, Lee, and Podsakoff’s (2003) recommendation that thelength of the time lag should correspond to the process under examination, we considered a1-year lag to be sufficiently long enough to reflect, more fully, the performance impact of anambidextrous orientation and sufficiently short enough to avoid the intervention of other con-taminating factors and the loss of respondents. And, second, on the basis of Podsakoff andcolleagues’ recommendation for minimizing common method variance, we temporally sepa-rated our measures (i.e., a time lag in gathering data from the same source) by first gatheringinformation on the predictor variables and then, subsequently, on the criterion variable.
The 139 SMEs in the final sample should not be confused with start-ups and other suchentrepreneurial ventures, for these SMEs averaged 62 employees in size, $4.9 million insales, and 24 years of age. And, their TMTs averaged 4.4 members (including the CEO), ofwhich 16% are women. The average participation rate for TMT members was 83%, whichcompares favorably to most upper echelon studies in terms of sample size and TMT partici-pation rates across firms (Geletkanycz, 1998; Hambrick, 1994). Moreover, the data showeda high level of stability in the composition of the sampled TMTs, with an average TMTtenure of 9.5 years; 91.4% of the surveyed members have served at least 3 years with theteam, and 92.1% of them have served at least 3 years with the firm.
Ninety percent of the firms were privately held. Based on the first two digits of the NorthAmerican Industry Classification System (NAICS), the firms primarily represented threeindustries, manufacturing (54%), scientific and technical services (19%), and construction(12%); the remaining firms were spread out over several different industries. A paired com-parison test indicated no significant differences in firm age, size, or industry between firmsthat agreed to participate in our study and those that did not, and no significant differencesin firm age and firm size across industries.
Measures
Behavioral integration. The survey asked the CEOs and each TMT member to assess theirTMT’s level of behavioral integration during the past 3 years. TMT behavioral integration
© 2006 Southern Management Association. All rights reserved. Not for commercial use or unauthorized distribution. at PENNSYLVANIA STATE UNIV on April 17, 2008 http://jom.sagepub.comDownloaded from
was assessed using the nine-item measure and a 5-point scale ranging from 1 (strongly disagree)to 5 (strongly agree) that was developed and validated by Simsek and colleagues (2005),whose sample was comparable to ours in firm size (22-500 employees) and TMT size (aver-age of 4.75 members). They designed this measure to capture collaborative behavior, infor-mation exchange, and joint decision making, the three interrelated and mutually reinforcingTMT processes associated with Hambrick’s meta-construct, and found the measure to havecontent, construct, and convergent validity.
Before aggregating the scores from each team member, including the CEO, we did a one-way analysis of variance on each item, using firm affiliation as the independent variable, todetermine if there was greater variability in the ratings between organizations than withinorganizations (Winer, 1971). The F ratio was significant (p < .001) for each item, support-ing aggregation. We also used an interrater reliability coefficient developed by James,Demaree, and Wolf (1993) to examine the intragroup reliability (rwg) of responses. It is sug-gested that an rwg greater than, or equal to, .70 is considered to be an indicator of good agree-ment within a group (George & Bettenhausen, 1990). The average intragroup reliability ofthis scale was .81, further legitimizing the aggregation of individual team member scores.The overall measure of TMT behavioral integration had a reliability of α = .90, which com-pares favorably to α = .85 found by Simsek and colleagues (2005).
We then compared two models using confirmatory factor analysis (CFA). In the first model,behavioral integration was treated as a single factor with the nine items as separate indicators.In the second model, behavioral integration was a second-order construct represented by threerelated dimensions, which in turn were represented by three items, respectively. The analy-sis showed that the second-order model, χ2(24, N = 139) = 25.41, ns, Comparative Fit Index(CFI) = .99, Incremental Fit Index (IFI) = .99, Tucker-Lewis Index (TLI) =.99, AdjustedGoodness-of-Fit Index (AGFI) =.92, and root mean square error of approximation (RMSEA) =.02, had a better fit than the single-factor model, χ2(27, N = 139) = 309.16, p < .001, CFI = .71,IFI = .71, TLI = .61, AGFI = .65, and RMSEA = .26. The chi-square difference (3) of 283.75between them is significant (p < .001). Our finding is consistent with Simsek and colleagues’findings (2005) and provides further evidence to support Hambrick’s (1994) theory that behav-ioral integration’s three dimensions are best captured as a meta-construct.
Ambidextrous orientation. Although there is no widely accepted measure of an ambidex-trous orientation, existing research provides a sound basis for developing one. For example,He and Wong (2004) designed a measure primarily based on product design differenceshaving to do with exploration and exploitation. Benner and Tushman (2003), however, con-ceptualized ambidexterity as encompassing more than just product design and proposed atwo-dimensional definition, entailing exploration and exploitation differences along an inno-vation’s proximity to the firm’s current technological/product trajectory—which is similar toHe and Wong’s measure—and an innovation’s proximity to the firm’s existing customer/market segment, which extended that measure. We, therefore, adapted, and then extended,He and Wong’s (2004) 8-item measure into a 14-item measure, as a means to capture bothof Benner and Tushman’s (2003) proposed dimensions. Specifically, we developed sevenitems to reflect an exploratory orientation and seven items to reflect an exploitation orienta-tion. To content validate these items, we initially asked a panel of 13 researchers familiar
Lubatkin et al. / TMT Behavioral Integration 655
© 2006 Southern Management Association. All rights reserved. Not for commercial use or unauthorized distribution. at PENNSYLVANIA STATE UNIV on April 17, 2008 http://jom.sagepub.comDownloaded from
with the literature to independently categorize each item as consistent with an exploratory orexploitative orientation, or unknown. Out of the 14 items, 12 were consistently categorized,as expected, with an average agreement level of 90%, whereas 2 items (one exploratory andone exploitative) were inconsistently categorized and, therefore, dropped.
Consequently, the final measure consisted of 12 items in which respondents were askedto assess their firm’s orientation during the past 3 years using a 5-point scale ranging from1 (strongly disagree) to 5 (strongly agree). The six items consistent with an exploratory ori-entation described the firm as one that (a) looks for novel technological ideas by thinking“outside the box,” (b) bases its success on its ability to explore new technologies, (c) createsproducts or services that are innovative to the firm, (d) looks for creative ways to satisfy itscustomers’ needs, (e) aggressively ventures into new market segments, and (f) actively tar-gets new customer groups. Similarly, the 6 items consistent with an exploitative orientationdescribed the firm as one that (a) commits to improve quality and lower cost, (b) continu-ously improves the reliability of its products and services, (c) increases the levels of automa-tion in its operations, (d) constantly surveys existing customers’ satisfaction, (e) fine-tuneswhat it offers to keep its current customers satisfied, and (f) penetrates more deeply into itsexisting customer base.
A one-way analysis of variance (p < .001) and the intragroup reliability test (rwg = .79)suggest that the individual scores (including the CEO) for each item can be aggregated to thefirm level. Based on firm-level data, a principal axis factor analysis using oblique rotation ofthe 12 items revealed the expected two-factor structure, which accounted for 66% of the vari-ance. The two factors appropriately represented the exploration and exploitation items.Primary loadings exceeded .58, and cross-loadings were lower than .12. Adequate reliabilitieswere achieved for both exploration (α = .84) and exploitation (α = .83). These results suggestdiscriminant validity of the two measures.
Consistent with Floyd and Lane’s (2000) assertion that these two orientations are “insep-arable,” researchers have combined both measures to create a measure of ambidexterity. Forexample, Gibson and Birkinshaw (2004) measured ambidexterity by multiplying exploita-tion and exploration, whereas He and Wong (2004) subtracted exploitation from explorationand used an absolute difference score. As Edwards and Parry (1993) and Edwards (1993)pointed out, however, any time two or more measures are combined into a single index,enough information may be lost that the index cannot be accurately interpreted. That is, weneed to know whether each component of the final index contributes uniquely to predictingoutcomes or if only one component does so.
Following the procedures recommended by Edwards (1994), we sought the most inter-pretable approach for combining our measures of exploration and exploitation. First, we ranan unconstrained regression equation in which firm performance was the dependent variable,and the orientations of exploration and exploitation were treated as separate independentvariables. Then, we ran three constrained regression equations in which exploration andexploitation were combined into a single index, first by subtracting exploitation from explo-ration, second by multiplying exploration and exploitation, and third by summing the two.The “additive” model proved to be superior; its regression beta weight (.17) indicated no sig-nificant loss of information, whereas the beta weights for the “difference” and “multiplica-tive” models (.05 and .05, respectively) indicated significant loss of information relative to
656 Journal of Management / October 2006
© 2006 Southern Management Association. All rights reserved. Not for commercial use or unauthorized distribution. at PENNSYLVANIA STATE UNIV on April 17, 2008 http://jom.sagepub.comDownloaded from

Lubatkin et al. / TMT Behavioral Integration 657
the unconstrained regression equation. Second, and again following Edward’s (1994) proce-dures, we three-dimensionally plotted the relationship between firm performance, explo-ration, and exploitation. The result, as shown in Figure 1, demonstrates that both orientationscontribute uniquely to overall firm performance, further supporting the interpretability of anadditive index.
Having established the interpretability of our measure, we then used CFA to comparethree alternative additive models: Model 1 treats the two orientations as independentconstructs, Model 2 treats them as latent factors of a second-order construct—ambidextrousorientation, and Model 3 treats all 12 items from the two measures as separate indicatorsof a single latent factor—ambidextrous orientation. Our data show that the best fit isModel 3, χ2(43, N = 139) = 66.81, p < .05, CFI = .97, IFI = .98, TLI = .96, AGFI = .90, andRMSEA = .06, which is superior to Model 1, χ2(50, N = 139) = 138.34, p < .001, CFI = .91,IFI = .91, TLI = .87, AGFI = .79, and RMSEA = .11, and Model 2, χ2(49, N = 139) = 94.20,p < .001, CFI = .95, IFI = .95, TLI = .93, AGFI = .87, and RMSEA = .08. Given these results,and those from Edwards’s tests, we measured ambidextrous orientation as the sum of all12 items (α = .89).
Relative firm performance. We gathered time-lagged performance data 1 year after sur-veying information on the predictor variables by asking CEOs (and not the other TMT
Figure 1Firm Performance, Exploratory, and Exploitative Orientation
© 2006 Southern Management Association. All rights reserved. Not for commercial use or unauthorized distribution. at PENNSYLVANIA STATE UNIV on April 17, 2008 http://jom.sagepub.comDownloaded from
members) to compare their firm’s performance relative to that of other major competitors onprofitability and growth, using an eight-item scale developed by Gupta and Govindarajan(1986), which was later used by researchers such as Covin, Prescott, and Slevin (1990). Themeasure included items such as growth in sales, growth in market share, return on equity,and return on total assets, which were rated using a scale from 1 (much worse) to 5 (muchbetter). The measure demonstrated good reliability (α = .91) and CFA suggested a goodfit for all eight items, χ2(16, N = 139) = 34.72, p < .01, CFI = .98, IFI = .98, TLI = .97,AGFI = .91, and RMSEA = .09.
We used the CEOs’ evaluation because objective data on the financial performance ofSME firms are rarely available, largely because the owners are not legally required to pub-lish these data. In addition, we did so because it is generally assumed that CEOs are knowl-edgeable informants, particularly with regard to their firms’ performance. That said, anddespite evidence to suggest that CEO self-reports of performance significantly correlate withsome objective measures of firm performance (Dess & Robinson, 1984; Robinson & Pearce,1988), we decided to further test the veracity of our subjective measure. To do so, weobtained, from D&B’s Million Dollar Database, an objective measure of sales growth (theonly performance measure listed in this database) for 121 of our sample firms, computedover the same time frame as our subjective performance measure. To enhance comparabilitywith the subjective scale, which is calibrated relative to competitors’ performance, weadjusted the objective measure by the NAICS industry average sales growth rate, which wasobtained from Standard & Poor’s Market Insight Database. Finally, we correlated this objec-tive industry-adjusted measure with our self-report of relative performance and found a pos-itive and significant association (r = .24, p < .01). Hence, although this statistic is likely tobe understated, because of the differences in which the two measures are scaled and com-puted, this finding provides evidence of the convergent validity of the self-report perfor-mance measure that we used.
Covariates. We included nine variables that have been associated with one or more of ourstudy’s core constructs. Regarding TMT processes, we controlled for team tenure by mea-suring the average tenure as reported by all team members and for team size by measuringthe total number of individuals on a company’s TMT, as reported by the CEO. Both teamvariables have been discussed in terms of their impact on TMT behavioral integration(Simsek et al., 2005). Each was transformed by its square root because the distributiondeparted from normality.
Regarding firm-level variables, we controlled for firm size (the number of full-timeemployees), as it has been associated with inertia, difficulty in processing informationrelated to changing resources, and failure to adapt to changing resource conditions (e.g.,Hannan & Freeman, 1989; Tushman & Romanelli, 1985). We also controlled for firm age(i.e., the number of years since the company was established), as it has been associated withthe institutional routines and norms that engender inertial behaviors (Tushman & Romanelli,1985). Both size and age were transformed by their square root because their distributionsdeparted from normality. We also controlled for the firm’s level of unabsorbed slack and pastperformance (1 year prior to our survey period), as both variables have been associatedwith exploration, exploitation, and firm performance. Unabsorbed slack was measured by a
658 Journal of Management / October 2006
© 2006 Southern Management Association. All rights reserved. Not for commercial use or unauthorized distribution. at PENNSYLVANIA STATE UNIV on April 17, 2008 http://jom.sagepub.comDownloaded from
four-item measure, which combined Chattopadhyay, Glick, and Huber’s (2001) two-itemmeasure with Nohria and Gulati’s (1996) two-item measure. The reliability for the combinedfour-item measure is α = .84. Past performance was evaluated by CEOs on the basis of thesame scale used for subsequent firm performance (α = .95). Because SMEs are more likelyto be “family firms” and, therefore, influenced by the founding family, we controlled forfamily ownership. Following Chua, Chrisman, and Sharma (1999), we identified familyfirms on the basis of the percentage of the business owned by members of a family, thenumber of family members involved in managing the business, and whether the future suc-cessor as president of the business was expected to be a member of the family. Seventy-twosample firms met these family-firm criteria (coded as 1), and 67 firms did not (coded as 0).
And finally, with regard to environmental influences, we controlled for industry and envi-ronmental uncertainty because both have been linked to a firm’s motivation to adapt to chang-ing resource conditions and performance. On the basis of the first two digits of the NAICScode, the firms in our sample were categorized into four industries—manufacturing, scientificand technical services, construction, and others—and then were dummy coded. Environmentaluncertainty was measured using a four-item scale reported by Waldman, Ramirez, House, andPuranam (2001); however, our reliability test resulted in two items being dropped in order toachieve an acceptable reliability (α = .75). The intragroup reliability (rwg) is .79.
Analyses and Results
Beyond temporally separating measurement of our predictor variables and criterion vari-able, we also performed several post hoc tests including the Harman’s single-factor test,CFAs, and bivariate correlations (Podsakoff et al., 2003) to look for additional traces ofcommon method bias. Exploratory factor analysis, which combined items from the depen-dent variable and independent variables, provided initial evidence that no single factor attrib-utable to common method bias was present in our data, which was further confirmed byscree plots. Further evidence of this was obtained using CFA in which a one-factor, a two-factor, and a three-factor model structure were compared to our measurement model, withthe single-factor model producing the poorest fit. Our hypothesized model clearly outper-formed other configurations in terms of discriminant validity as evidenced by significant chi-square reductions. Finally, to more directly rule out common method bias in our data, wealso checked bivariate correlations and retested our hypotheses using the CEO’s assessmentof the firm’s ambidextrous orientation versus all other team members’ assessments of behav-ioral integration, and vice versa. The CEO’s measures were significantly correlated with theassessment from all other TMT members (behavioral integration = .85; ambidextrous orien-tation = .82), and using these alternative assessments yielded results comparable to our fullsample (details available upon request).
Because Simsek and colleagues (2005) found, consistent with Hambrick’s (1994) con-ceptualization, that behavioral integration is best empirically represented as a second-orderconstruct represented by three related dimensions, we used maximum likelihood structuralequation modeling (SEM) to test our model’s hypotheses. SEM was also appropriate becauseit allows estimation of multiple associations, it simultaneously incorporates observed and
Lubatkin et al. / TMT Behavioral Integration 659
© 2006 Southern Management Association. All rights reserved. Not for commercial use or unauthorized distribution. at PENNSYLVANIA STATE UNIV on April 17, 2008 http://jom.sagepub.comDownloaded from
latent constructs in these associations, and it accounts for the biasing effects of randommeasurement error in the latent constructs (Medsker, Williams, & Holahan, 1994; Shook,Ketchen, Hult, & Kacmar, 2004). We adopted the two-step approach to SEM outlined inAnderson and Gerbing (1988), as recommended by numerous researchers including Hoyleand Panter (1995) and Medsker and colleagues (1994). The first phase of this approachinvolves the fit of a CFA model to the observed data. The second phase involves comparinga sequence of nested structural models to yield information concerning the structural modelthat best accounts for the covariances observed between the model’s exogenous and endoge-nous constructs (Anderson & Gerbing, 1988). Below, we report results from both phases fol-lowing suggestions in Hoyle and Panter (1995), Medsker and colleagues (1994), and Shookand colleagues (2004) and then report results for each individual hypothesis.
Phase 1: CFA Model Results
The first phase of Anderson and Gerbing’s (1988) approach involves determining the fitof a CFA model to the observed data to assess the fit of the overall measurement model andthen examining the psychometric properties of constructs. Each latent variable in SEM needsto be explicitly assigned a metric or a measurement range (Kline, 1998). We did so by set-ting a path for each latent variable to 1.0. Factor loadings were also set equal to 1.0 for non-latent variables.
Multiple indices were used to assess the fit of each model. The criteria examined includedchi-square, a standardized measure where a smaller value represents a better fit, CFI, IFI,TLI, AGFI, and RMSEA (Hoyle & Panter, 1995; Medsker et al., 1994; Shook et al., 2004).CFI, IFI, TLI, and AGFI have expected values of 1.0, and RMSEA has an expected value of.0 when the hypothesized model fully reflects the sample population. Although standards forsuch indices are difficult to establish, a value of .90 or higher for CFI, IFI, TLI, and AGFI,and a value of .08 or lower for RMSEA, is typically suggested as indicating adequate fit(Bollen, 1989; Browne & Cudeck, 1993; Hu & Bentler, 1999). The fit indices for our mea-surement model were as follows: χ2(290, N = 139) = 399.41, p < .001, CFI = .96, IFI = .96,TLI = .94, AGFI = .90, and RMSEA = .05.
As Hair, Anderson, Tatham, and Black noted, once the overall CFA model has been accepted,“each of the constructs can be evaluated separately by: (1) examining the indicator loadings forstatistical significance; and (2) assessing the construct’s reliability and variance extracted”(1995: 652). Results for our CFA indicate that the relationship between each indicator variableand its respective variable is significant (p < .001), verifying the posited relationships amongindicators and constructs, and thus, convergent validity (Hair et al., 1995: 653).
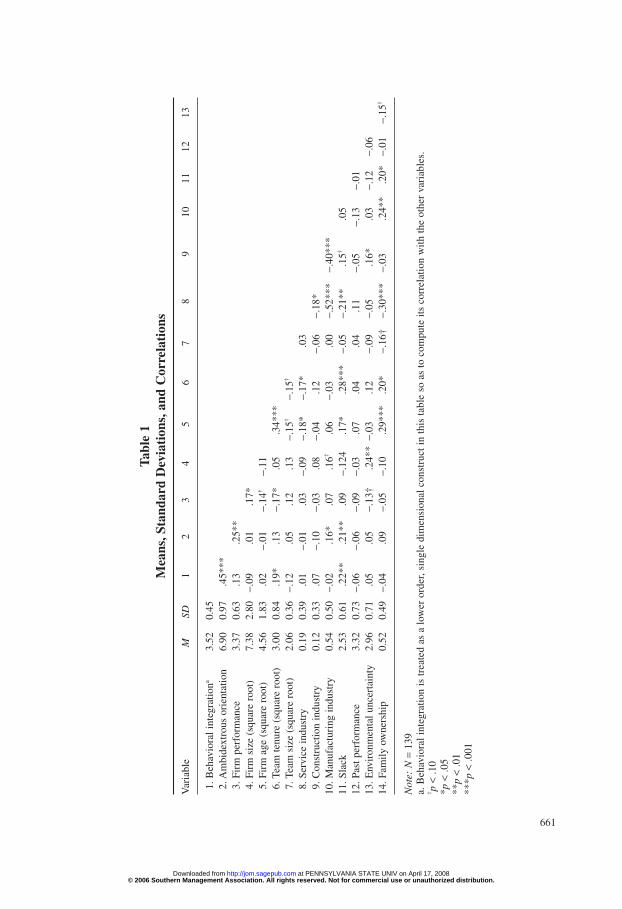
For evidence of discriminant validity, we examined bivariate interitem correlations.Table 1, which summarizes means, standard deviations, and correlations among all studyvariables, provides some initial evidence of discriminant validity and permits the interestedreader to recover the covariance matrix that can be used to further assess our data. Specifically,given that no interfactor correlation is above the recommended level of .65 (Tabachnick &Fidell, 1996: 86), multicollinearity and, hence, problems created by a lack of discriminantvalidity are not likely to bias our data.
660 Journal of Management / October 2006
© 2006 Southern Management Association. All rights reserved. Not for commercial use or unauthorized distribution. at PENNSYLVANIA STATE UNIV on April 17, 2008 http://jom.sagepub.comDownloaded from
Tabl
e 1
Mea
ns,S
tand
ard
Dev
iati
ons,
and
Cor
rela
tion
s
Var
iabl
eM
SD1
23
45
67
89
1011
1213
1. B
ehav
iora
l int
egra
tiona
3.52
0.45
2. A
mbi
dext
rous
ori
enta
tion
6.90
0.97
.45*
**3.
Fir
m p
erfo
rman
ce3.
370.
63.1
3.2
5**
4. F
irm
siz
e (s
quar
e ro
ot)
7.38
2.80
−.09
.01
.17*
5. F
irm
age
(sq
uare
roo
t)4.
561.
83.0
2−.
01−.
14†
−.11
6. T
eam
tenu
re (
squa
re r
oot)
3.00
0.84
.19*
.13
−.17
*.0
5.3
4***
7. T
eam
siz
e (s
quar
e ro
ot)
2.06
0.36
−.12
.05
.12
.13
−.15
†−.
15†
8. S
ervi
ce in
dust
ry0.
190.
39.0
1−.
01.0
3−.
09−.
18*
−.17
*.0
39.
Con
stru
ctio
n in
dust
ry0.
120.
33.0
7−.
10−.
03.0
8−.
04.1
2−.
06−.
18*
10. M
anuf
actu
ring
indu
stry
0.54
0.50
−.02
.16*
.07
.16†
.06
−.03
.00
−.52
***
−.40
***
11. S
lack
2.53
0.61
.22*
*.2
1**
.09
−.12
4.1
7*.2
8***
−.05
−.21
**.1
5†.0
512
. Pas
t per
form
ance
3.32
0.73
−.06
−.06
−.09
−.03
.07
.04
.04
.11
−.05
−.13
−.01
13. E
nvir
onm
enta
l unc
erta
inty
2.96
0.71
.05
.05
−.13
†.2
4**
−.03
.12
−.09
−.05
.16*
.03
−.12
−.06
14. F
amily
ow
ners
hip
0.52
0.49
−.04
.09
−.05
−.10
.29*
**.2
0*−.
16†
−.30
***
−.03
.24*
*.2
0*−.
01−.
15†
Not
e:N
=13
9a.
Beh
avio
ral i
nteg
ratio
n is
trea
ted
as a
low
er o
rder
,sin
gle
dim
ensi
onal
con
stru
ct in
this
tabl
e so
as
to c
ompu
te it
s co
rrel
atio
n w
ith th
e ot
her
vari
able
s.† p
<.1
0*p
<.0
5**
p<
.01
***p
<.0
01
661
© 2006 Southern Management Association. All rights reserved. Not for commercial use or unauthorized distribution. at PENNSYLVANIA STATE UNIV on April 17, 2008 http://jom.sagepub.comDownloaded from

Phase 2: Sequence of Nested Structural Models Results
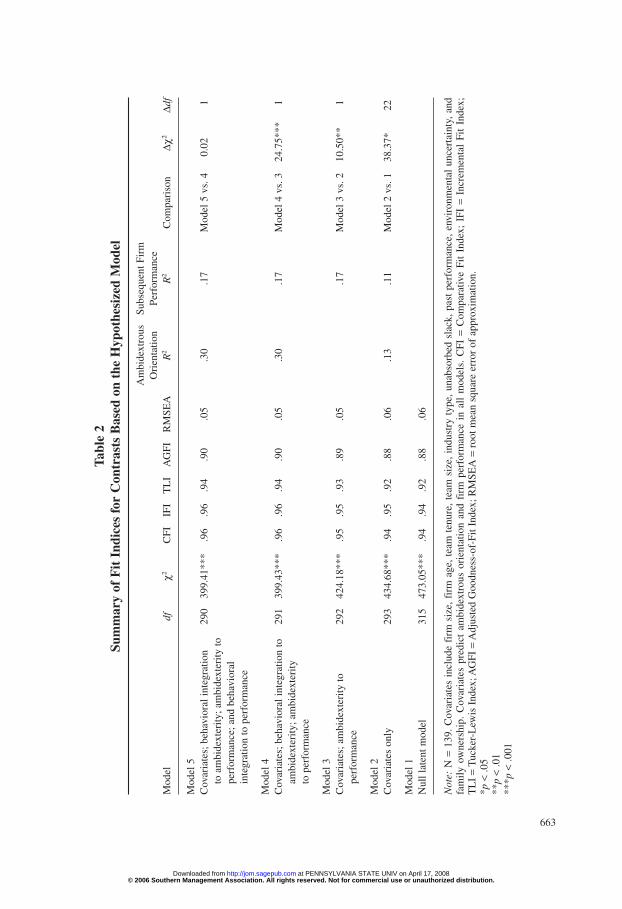
The second phase of Anderson and Gerbing’s (1988) approach involves contrasts betweensequences of nested structural models to yield information concerning a better fitting structuralmodel that better accounts for the observed covariances among the latent constructs. The firstcontrast is between the measurement model and a null latent model that constrains the rela-tionship between all latent factors to zero. A significant chi-square difference between the fitof the two models indicates that sufficient covariance exists between the latent variables towarrant testing the hypothesized model. The initial comparison between the measurementmodel, χ2(290, N = 139) = 399.41, p < .001, CFI = .96, IFI = .96, TLI = .94, AGFI = .90, andRMSEA = .05, and the null latent model, χ2(293, N = 139) = 437.68, p < .001, CFI = .94,IFI = .95, TLI = .92, AGFI = .88, and RMSEA = .06, evidenced a large significant (p < .001)chi-square difference (3) of 35.27. The result of the null latent model is summarized inTable 2, Model 1.
This difference, then, provides the basis for examining the nested structural models inwhich the relative fit of the hypothesized model is assessed against other nested models(Anderson & Gerbing, 1988). To gain a more complete understanding of our individualhypotheses, we tested another four nested structural models. In evaluating these models, wefollowed the suggestions of Jöreskog (1993) and Bollen (1989), using a three-step procedurethat includes assessments of (a) model fit using various fit indices, (b) significance of thecompletely standardized path estimates as a test of the model’s hypotheses, and (c) amountof variance explained in the endogenous constructs as an indication of the substantive con-tribution of practical significance.
The covariates model specified the influences of all team-, firm-, and environment-levelcovariates on the model’s two endogenous constructs, ambidextrous orientation and firm per-formance. As shown in Table 2, Model 2, these covariates accounted for 13% of variance in thefirm’s ambidextrous orientation and 11% of the variance in firm performance, supporting ourcontention for their inclusion in the model. The next model (Model 3) specified the effect ofambidexterity on firm performance after accounting for the effects of covariates. SupportingHypothesis 2, ambidexterity was positively associated with performance (.27, p < .01) andexplained additional significant variance in performance (∆R2 = .06). Model 4 added the effectof behavioral integration on the firm’s ambidextrous orientation. Supporting Hypothesis 1,behavioral integration was associated with ambidextrous orientation (.45, p < .001) andexplained additional variance (∆R2 = .17). In Model 5, the path from behavioral integration tofirm performance, although not hypothesized, was added to fully test all plausible relation-ships. As shown, this model, χ2(290, N = 139) = 399.41, p < .001, CFI = .96, IFI = .96, TLI =.94, AGFI = .90, and RMSEA = .05, was not superior to the more constrained Model 4, χ2(291,N = 139) = 399.43, p < .001, CFI = .96, IFI = .96, TLI = .94, AGFI = .90, and RMSEA = .05.
These findings suggest that the more parsimonious model that we hypothesized (Model4) better fits the data. The significant standardized path estimates for the two paths in thismodel (as shown in Figure 2) suggested that our two hypotheses were both supported:Behavioral integration is positively associated with an ambidextrous orientation (.45, p <.001), and an ambidextrous orientation is positively associated with subsequent firm perfor-mance (.27, p < .01). The latter finding is also illustrated in Figure 1, which showed that the
662 Journal of Management / October 2006
© 2006 Southern Management Association. All rights reserved. Not for commercial use or unauthorized distribution. at PENNSYLVANIA STATE UNIV on April 17, 2008 http://jom.sagepub.comDownloaded from
Tabl
e 2
Sum
mar
y of
Fit
Ind
ices
for
Con
tras
ts B
ased
on
the
Hyp
othe
size
d M
odel
Am
bide
xtro
usSu
bseq
uent
Fir
mO
rien
tatio
nPe
rfor
man
ceM
odel
dfχ22
CFI
IFI
TL
IA
GFI
RM
SEA
R22
R22
Com
pari
son
∆χ22
∆df
Mod
el 5
Cov
aria
tes;
beh
avio
ral i
nteg
ratio
n 29
039
9.41
***
.96
.96
.94
.90
.05
.30
.17
Mod
el 5
vs.
40.
021
to a
mbi
dext
erity
; am
bide
xter
ity to
pe
rfor
man
ce; a
nd b
ehav
iora
lin
tegr
atio
n to
per
form
ance
Mod
el 4
Cov
aria
tes;
beh
avio
ral i
nteg
ratio
n to
29
139
9.43
***
.96
.96
.94
.90
.05
.30
.17
Mod
el 4
vs.
324
.75*
**1
ambi
dext
erity
; am
bide
xter
ityto
per
form
ance
Mod
el 3
Cov
aria
tes;
am
bide
xter
ity to
29
242
4.18
***
.95
.95
.93
.89
.05
.17
Mod
el 3
vs.
210
.50*
*1
perf
orm
ance
Mod
el 2
Cov
aria
tes
only
293
434.
68**
*.9
4.9
5.9
2.8
8.0
6.1
3.1
1M
odel
2 v
s. 1
38.3
7*22
Mod
el 1
Nul
l lat
ent m
odel
315
473.
05**
*.9
4.9
4.9
2.8
8.0
6
Not
e:N
=13
9. C
ovar
iate
s in
clud
e fi
rm s
ize,
firm
age
,te
am t
enur
e,te
am s
ize,
indu
stry
typ
e,un
abso
rbed
sla
ck,
past
per
form
ance
,en
viro
nmen
tal
unce
rtai
nty,
and
fam
ily o
wne
rshi
p. C
ovar
iate
s pr
edic
t am
bide
xtro
us o
rien
tatio
n an
d fi
rm p
erfo
rman
ce i
n al
l m
odel
s. C
FI =
Com
para
tive
Fit
Inde
x; I
FI =
Incr
emen
tal
Fit
Inde
x;T
LI
=T
ucke
r-L
ewis
Ind
ex; A
GFI
=A
djus
ted
Goo
dnes
s-of
-Fit
Inde
x; R
MSE
A =
root
mea
n sq
uare
err
or o
f ap
prox
imat
ion.
*p<
.05
**p
<.0
1**
*p<
.001
663
© 2006 Southern Management Association. All rights reserved. Not for commercial use or unauthorized distribution. at PENNSYLVANIA STATE UNIV on April 17, 2008 http://jom.sagepub.comDownloaded from

664 Journal of Management / October 2006
highest level of performance is achieved when both exploitation and exploration are at theirhighest levels.
To further explore the patterns of less ambidextrous firms with respect to their pursuit ofan exploratory or exploitative orientation, we also performed a post hoc cluster analysis.
Figure 2Hypothesized Model Resultsa
TMTBehavioral Integration
AmbidextrousOrientation
FirmPerformance
Past Performance
Slack
Team Tenure
Team Size
Service Industry
Construction Industry
Manufacturing Industry
Firm Size
Firm Age
Uncertainty
Family Ownership
.45*** .27**
-.19*
.19*
-.18*
.22*.16*
.14†
.70 .83
Note: N = 139. Standardized parameter estimates. TMT = top management team.a. This is a simplified version of the actual model. It does not show indicators, error terms, exogenous factor vari-ances, and correlations between exogenous factors. Only significant paths are shown.†p < .10*p < .05**p < .01***p < .001
© 2006 Southern Management Association. All rights reserved. Not for commercial use or unauthorized distribution. at PENNSYLVANIA STATE UNIV on April 17, 2008 http://jom.sagepub.comDownloaded from
Lubatkin et al. / TMT Behavioral Integration 665
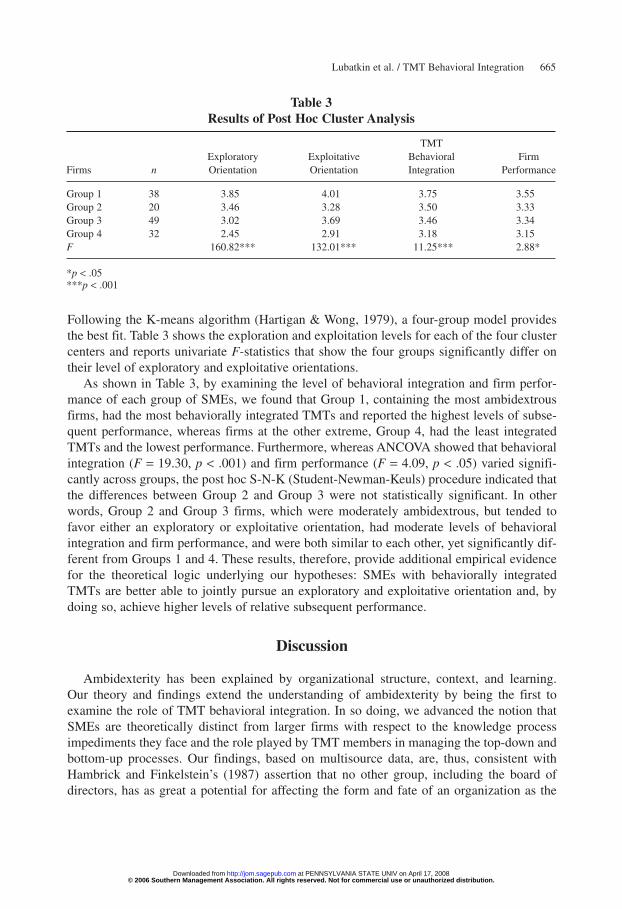
Following the K-means algorithm (Hartigan & Wong, 1979), a four-group model providesthe best fit. Table 3 shows the exploration and exploitation levels for each of the four clustercenters and reports univariate F-statistics that show the four groups significantly differ ontheir level of exploratory and exploitative orientations.
As shown in Table 3, by examining the level of behavioral integration and firm perfor-mance of each group of SMEs, we found that Group 1, containing the most ambidextrousfirms, had the most behaviorally integrated TMTs and reported the highest levels of subse-quent performance, whereas firms at the other extreme, Group 4, had the least integratedTMTs and the lowest performance. Furthermore, whereas ANCOVA showed that behavioralintegration (F = 19.30, p < .001) and firm performance (F = 4.09, p < .05) varied signifi-cantly across groups, the post hoc S-N-K (Student-Newman-Keuls) procedure indicated thatthe differences between Group 2 and Group 3 were not statistically significant. In otherwords, Group 2 and Group 3 firms, which were moderately ambidextrous, but tended tofavor either an exploratory or exploitative orientation, had moderate levels of behavioralintegration and firm performance, and were both similar to each other, yet significantly dif-ferent from Groups 1 and 4. These results, therefore, provide additional empirical evidencefor the theoretical logic underlying our hypotheses: SMEs with behaviorally integratedTMTs are better able to jointly pursue an exploratory and exploitative orientation and, bydoing so, achieve higher levels of relative subsequent performance.
Discussion
Ambidexterity has been explained by organizational structure, context, and learning.Our theory and findings extend the understanding of ambidexterity by being the first toexamine the role of TMT behavioral integration. In so doing, we advanced the notion thatSMEs are theoretically distinct from larger firms with respect to the knowledge processimpediments they face and the role played by TMT members in managing the top-down andbottom-up processes. Our findings, based on multisource data, are, thus, consistent withHambrick and Finkelstein’s (1987) assertion that no other group, including the board ofdirectors, has as great a potential for affecting the form and fate of an organization as the
Table 3Results of Post Hoc Cluster Analysis
TMTExploratory Exploitative Behavioral Firm
Firms n Orientation Orientation Integration Performance
Group 1 38 3.85 4.01 3.75 3.55Group 2 20 3.46 3.28 3.50 3.33Group 3 49 3.02 3.69 3.46 3.34Group 4 32 2.45 2.91 3.18 3.15F 160.82*** 132.01*** 11.25*** 2.88*
*p < .05***p < .001
© 2006 Southern Management Association. All rights reserved. Not for commercial use or unauthorized distribution. at PENNSYLVANIA STATE UNIV on April 17, 2008 http://jom.sagepub.comDownloaded from

small group of senior executives residing at the apex of the organization. We conclude thatupper echelon theory holds promise for serving as a general theory that can complement theprevious ambidexterity explanations.
However, although our findings give even more credence to the growing importance ofTMT behavioral integration as a salient influence on organizational outcomes, our findingsalso suggest that this influence may be causally indirect. In particular, when we contrast ourhypothesized model (Model 4), which separately links behavioral integration to ambidexter-ity, and ambidexterity to relative firm performance, with a less parsimonious model (Model5), which adds an additional link between behavioral integration and relative firm perfor-mance, we find that Model 4 better fits the data. Although we did not hypothesize a directcasual link between behavioral integration and relative firm performance, taken together, ourfindings suggest that such an inference would not have been supported. Thus, our findingsnot only suggest that TMT behavioral integration is essential to achieving an ambidextrousorientation in SMEs; they also suggest that the joint pursuit of an exploratory and exploita-tive orientation affects performance. Clearly more longitudinal research is needed to furtherflesh out TMT behavioral integration’s causal role.
Our findings also support and extend the study by Simsek and colleagues (2005). Theyadvanced the theoretical authenticity of behavioral integration, by developing a reliable mea-sure of it and confirming its meta-construct properties. Using the same instrument to mea-sure behavioral integration, and a different sample of firms, we replicated those findings.Whereas they primarily examined the multilevel antecedents of behavioral integration, com-ing from the CEO, team, firm, and the environment, we demonstrate how behavioral inte-gration facilitates firm-level consequences. A next step might be to test a holistic model thatassociates behavioral integration with both its antecedents and consequences, for this testmight enable researchers to parse out the direct effects of TMT composition.
Of course, it remains an interesting empirical question as to whether our findings gener-alize to larger firms. Unlike SMEs, outcomes at larger firms are often driven by a broader setof ecological influences extraneous to the TMT, such as multiple product lines and markets,as well as more complex organizational systems, which make their knowledge processesassociated with bottom-up and top-down learning more vulnerable to organizational imped-iments. Moreover, the influence of TMT actions at larger firms may be confounded by exter-nal governance pressures from an independent board of directors who can monitor and dis-cipline the TMT irrespective of the CEO’s power, as well as by capital markets that monitorfirms and provide instantaneous feedback to shareholders via share price.
That said, we would encourage additional research within larger firms. We reason that ourSME findings could be replicated at larger firms, given that upper echelon theory has beenprimarily associated with such firms, and its central thesis holds that the TMT of a firm hasthe greatest potential to affect its future (Hambrick & Finkelstein, 1987). Such findingswould also lend further credence to Tushman and O’Reilly’s (1997) contention that in alarger firm ambidexterity is driven by the TMT’s internal processes. We suspect, however,that the statistical associations between behavioral integration, ambidexterity, and relativefirm performance may not be as strong as what we found with our sample of SMEs, pri-marily because of the many impediments and extraneous influences that will likely dilute theeffect size of these associations.
666 Journal of Management / October 2006
© 2006 Southern Management Association. All rights reserved. Not for commercial use or unauthorized distribution. at PENNSYLVANIA STATE UNIV on April 17, 2008 http://jom.sagepub.comDownloaded from
On the other hand, the appropriate level of analysis for studying ambidexterity at large firmsmay be, as Gibson and Birkinshaw (2004) reasoned, at the business unit level and not at the firmlevel. Specifically, they defined ambidexterity as a capacity to demonstrate alignment and adapt-ability across an entire business unit, by arguing that “this is potentially a moresustainable model than structural separation because it facilitates the adaptation of an entirebusiness unit, not just the separate units or functions responsible for new business development”(2004: 211). We concur; consider large diversified firms like GE, who keep their eggs in widelydifferent baskets of activities and knowledge (e.g., GE Capital, medical systems, appliances,aerospace, etc.). We reason that the competitive pressures to jointly pursue exploitation andexploration, the knowledge processing demands to attain them, and the role played by the TMTprocesses are more proximately associated with the business units within a large diversifiedfirm, for there is a limited range of products, technologies, and markets at this level of analysis.
Taken in this light, the SMEs that we studied bear resemblance to business units at largefirms in terms of range and, in some cases, number of individuals employed. Thus, althoughwe argued that SMEs are theoretically distinct from larger firms with respect to the knowl-edge process impediments they face and the role played by TMT members in managing thetop-down and bottom-up processes, SMEs may not be as distinct from the large firm’s busi-ness units. A research question, therefore, is whether behavioral integration’s role with thesenior management teams of business units is as pivotal as what we found for the TMTs ofSMEs. Perhaps size matters, not so much at the firm level but at the business unit level.Perhaps at very large business units, like those at GE, each unit may face the kind of knowl-edge impediments that have been associated with large firms and, as such, are forced to man-age their knowledge processes in the manner described by O’Reilly and Tushman (2004),that is, by creating structurally separated units within the larger unit, rather than solelythrough a behaviorally integrated TMT.
As for additional future research, we believe we have developed a reliable and valid mea-sure of a firm’s ambidextrous orientation. Our findings demonstrate that an additive measure,modeled as the simple sum of the items associated with both exploitation and exploration,where each item is treated as a separate indicator of a single latent factor, represents the mostinterpretable measure, and the one that best fits the data. Hence, we encourage researchersto consider using our measure. Along similar lines, we were able to provide objective evi-dence to partially validate a self-reported measure of SME performance. Recognizing howdifficult it is to find objective performance data for privately held SMEs, we consider this isa step in the right direction for those who wish to study this largely overlooked organiza-tional form, which represents a vital component of most nations’ economies.
Likewise, although we found that behavioral integration is positively associated withambidexterity in SMEs, we cannot infer causality because this portion of our study was cor-relational and did not involve the manipulation of variables. As such, the present researchdesign cannot rule out the possibility of reverse/reciprocal causality, for example, greaterambidexterity might cause greater behavioral integration. The issue of causality can only beresolved using longitudinal designs, where the complex interplay of these variables is exam-ined over time or through the use of experimental or quasi-experimental manipulations.
Furthermore, our reliance on 1-year, time-lagged relative performance data, althoughclearly superior to cross-sectional data, prevents us from ruling out other extraneous
Lubatkin et al. / TMT Behavioral Integration 667
© 2006 Southern Management Association. All rights reserved. Not for commercial use or unauthorized distribution. at PENNSYLVANIA STATE UNIV on April 17, 2008 http://jom.sagepub.comDownloaded from
influences that may have intervened during that period of time. For example, we cannot ruleout the conventional ecological view that suggests that a firm’s ability to successfully adapt(e.g., by being ambidextrously oriented) to environmental forces is destined to be eroded byentropic administrative forces (Barnett & Freeman, 2001). Although we argue that a firm’sability to offset such erosion is based, in part, on the extent to which its TMT is behaviorallyintegrated, we did not examine our sample firm’s level of behavioral integration subsequent toour first survey, which could have varied during the intervening year. Hence, even thoughbehavioral integration is likely to be relatively stable in the short run, given its normative baseand the continuing membership of most TMT members, we cannot rule out to what extent ero-sion may have occurred, which may have further explained some of the unexplained variancein firm performance. Only a longitudinal research design can more precisely address the ques-tion as to whether higher performance is sustainable in the face of changing competitive chal-lenges, coupled with limited resources and the inherent difficulties in reconciling differing riskpreferences, repertoires, and competencies within the same firm. Such a design would alsoguard against concerns over intervening phenomena during such an extended time period.
In addition, the fact that some of our covariates, such as firm age, that we selected on thebasis of previous research on larger firms did not influence subsequent performance suggeststhat they may be less applicable to SMEs. Although the absence of this association may sim-ply reflect the more restricted range of our sample, this restriction did not alter the influenceof other covariates, like firm size on performance. On the other hand, we also note that teamsize, which was expected to confound the attainment of an ambidextrous orientation, had amarginally positive effect. Here, too, it may be that in SMEs, attaining ambidexterity neces-sitates some threshold level of team size in order for there to be sufficient explicit and tacitbases of knowledge to debate and process. Moreover, the positive association between familyownership and ambidexterity suggests that attaining ambidexterity in SMEs may actually beenhanced when TMT members are family. Clearly, more needs to be understood aboutSMEs, including the identification of covariates that are specific to this population. In short,a comprehensive investigation of how TMT processes influence ambidexterity in SMEs andhow ambidexterity influences their subsequent performance has been long overdue, and wehope our findings will help pave the way for the next generation of research.
And last, with regard to managerial implications, prior research suggests that firms aremore likely to develop a natural tendency to focus on either exploitation or exploration, butnot both. Henderson and Clark refer to this tendency as the “competency trap” (1990), Weickas a “key dilemma facing organizations” (1982: 386), and Levinthal and March as a “basicunresolved problem” (1993: 105). Our findings suggest a much more optimistic message tosenior SME managers: This problem can be resolved—despite their firm’s lack of resourcesor their inability to take advantage of structural mechanisms that promote ambidexterity—and the best-in-class SMEs that do so are rewarded for their efforts.
Put simply, organizational ambidexterity may not be as difficult or illusive for firms toachieve as some in the literature believe. What may be required is to have a CEO with theleadership ability to foster greater behavioral integration among the members of his or herTMT. And, CEOs are generally uniquely positioned to do this, given their responsibility forselecting, evaluating, motivating, and coaching the TMT members. Moreover, our findingssuggest that senior managers of larger firms in search of greater ambidexterity may want to
668 Journal of Management / October 2006
© 2006 Southern Management Association. All rights reserved. Not for commercial use or unauthorized distribution. at PENNSYLVANIA STATE UNIV on April 17, 2008 http://jom.sagepub.comDownloaded from
Lubatkin et al. / TMT Behavioral Integration 669
reconsider creating structurally separate business units that focus on either exploitation orexploration, and instead strive to create business units that are capable of pursuing both.
References
Abernathy, W. J. 1978. The productivity dilemma. Baltimore: Johns Hopkins University Press.Adler, P. S., Goldoftas, B., & Levine, D. 1999. Flexibility versus efficiency? A case study of model changeovers in
the Toyota production system. Organization Science, 10: 43-68.Anderson, J. C., & Gerbing, D. W. 1988. Structural equation modeling in practice: A review and recommended two-
step approach. Psychological Bulletin, 103: 411-423.Barnett, W. P., & Freeman, J. 2001. Too much of a good thing? Product proliferation and organizational failure.
Organization Science, 12: 539.Barney, J. B. 1991. Firm resources and sustained competitive advantage. Journal of Management, 17: 99-120.Benner, M. J., & Tushman, M. L. 2003. Exploration, exploitation, and process management: The productivity
dilemma revisited. Academy of Management Review, 28: 238-256.Bollen, K. A. 1989. Structural equations with latent variables. New York: John Wiley.Brown, S. L., & Eisenhardt, K. M. 1997. The art of continuous change: Linking complexity theory and time-paced
evolution in relentless shifting organizations. Administrative Science Quarterly, 42: 1-34.Browne, M. W., & Cudeck, R. 1993. Alternative ways of addressing model fit. In K. A. Bollen & J. S. Long (Eds.),
Testing structural equation, models: 136-162. Newbury Park, CA: Sage.Burgelman, R. A. 1991. Intraorganizational ecology of strategy making and organizational adaptation: Theory and
field research. Organizational Science, 2: 239-262.Busenitz, L. W., & Barney, J. B. 1997. Differences between entrepreneurs and managers in large organizations:
Biases and heuristics in strategic decision-making. Journal of Business Venturing, 12: 9-30.Carmeli, A., & Schaubroeck, J. in press. Top management team behavioral integration, decision quality, and orga-
nizational decline. Leadership Quarterly.Chattopadhyay, P., Glick, W., & Huber, G. P. 2001. Organizational actions in response to threats and opportunities.
Academy of Management Review, 44: 937-956.Chua, J. H., Chrisman, J. J., & Sharma, P. 1999. Defining the family business by behavior. Entrepreneurship:
Theory and Practice, 23: 19-39. Coleman, J. S. 1990. Rational action, social networks, and the emergence of norms. In C. Calhoun, M. W. Meyer,
& W. R. Scott (Eds.), Structures of power and constraint: 91-112. New York: Cambridge University Press.Covin, J. G., Prescott, J. E., & Slevin, D. P. 1990. The effects of technological sophistication on strategic profiles,
structure and firm performance. Journal of Management Studies, 27: 485-510.Dess, G. G., & Robinson, R. B. 1984. Measuring organization performance in the absence of objective measures: The
case of the privately-held firm and the conglomerate business unit. Strategic Management Journal, 5: 265-273.Dutton, J. E., & Jackson, S. E. 1987. Categorizing strategic issues: Links to organizational action. Academy of
Management Review, 12: 76-90.Edwards, J. R. 1993. Problems with the use of profile similarity indices in the study of congruence in organizational
research. Personnel Psychology, 46: 641-665.Edwards, J. R. 1994. The study of congruence in organizational behavior research: Critique and a proposed alter-
native. Organizational Behavior and Human Decision Processes, 58: 51-100.Edwards, J. R., & Parry, M. E. 1993. On the use of polynomial regression equations as an alternative to differences
scores in organizational research. Academy of Management Journal, 36: 1577-1613.Eisenhardt, K. 1989. Agency theory: An assessment and review. Academy of Management Review, 14: 57-74.Eisenhardt, K. M., & Martin, J. A. 2000. Dynamic capabilities: What are they? Strategic Management Journal,
21: 1105-1121.Eisenhardt, K. M., & Schoonhoven, C. B. 1990. Organizational growth: Linking founding team, strategy, environment,
and growth among U.S. semiconductor ventures, 1978-1988. Administrative Science Quarterly, 35: 504-529.Floyd, S., & Lane, P. 2000. Strategizing throughout the organization: Managing role conflict in strategic renewal.
Academy of Management Review, 25: 154-177.
© 2006 Southern Management Association. All rights reserved. Not for commercial use or unauthorized distribution. at PENNSYLVANIA STATE UNIV on April 17, 2008 http://jom.sagepub.comDownloaded from

Geletkanycz, M. A. 1998. The salience of “culture’s consequences”: The effect of cultural values on top executivecommitment to the status quo. Strategic Management Journal, 18: 615-634.
George, J. M., & Bettenhausen, K. 1990. Understanding prosaic behavior, sales performance, and turnover:A group-level analysis in a service context. Journal of Applied Psychology, 75: 698-709.
Ghemawat, P., & Costa, J. 1993. The organizational tension between static and dynamic efficiency. StrategicManagement Journal, 14: 59-73.
Gibson, C., & Birkinshaw, J. 2004. The antecedents, consequences, and mediating role of organizational ambidex-terity. Academy of Management Journal, 47: 209-226.
Granovetter, M. 1985. Economic action and social structure: The problem of embeddedness. American Journal ofSociology, 91: 481-510.
Gupta, A. K., & Govindarajan, V. 1986. Resource sharing among SBUs: Strategic antecedents and administrativeimplications. Academy of Management Journal, 29: 695-714.
Hair, J. F., Anderson, R. E., Tatham, R. L., & Black, W. C. 1995. Multivariate data analysis with readings.Englewood Cliffs, NJ: Prentice Hall.
Hambrick, D. C. 1994. Top management groups: A conceptual integration and reconsideration of the team label. InB. M. Staw & L. L. Cummings (Eds.), Research in organizational behavior, 16: 171-214. Greenwich, CT: JAI.
Hambrick, D. C. 1995. Fragmentation and the other problems CEOs have with their top management teams.California Management Review, 37: 110-128.
Hambrick, D. C. 1998. Corporate coherence and the top management team. In D. C. Hambrick, D. A. Nadler, &M. L. Tushman (Eds.), Navigating change: How CEOs, top teams, and boards steer transformation: 123-140.Boston: Harvard Business School Press.
Hambrick, D. C., & Finkelstein, S. 1987. Managerial discretion: A bridge between two polar views on organiza-tions. In B. M. Staw & L. L. Cummings (Eds.), Research in Organizational Behavior, 9: 369-406. Greenwich,CT: JAI.
Hambrick, D. C., Li, J., Xin, K., & Tsui, A. S. 2001. Compositional gaps and downward spirals in international jointventure management. Strategic Management Journal, 22: 1033-1053.
Hambrick, D. C., & Mason, P. A. 1984. Upper echelon: The organization as a reflection of its top managers.Academy of Management Review, 9: 193-206.
Hannan, M. T., & Freeman, J. 1989. Organizational ecology. Cambridge, MA: Harvard University Press.Harry, M. J., & Schroeder, R. 2000. Six sigma: The breakthrough management strategy revolutionizing the world’s
top corporations. New York: Currency.Hartigan, J. A., & Wong, M. A. 1979. A K-means clustering algorithm. Applied Statistics, 28: 100-108.He, Z., & Wong, P.-K. 2004. Exploration and exploitation: An empirical test of the ambidextrous hypothesis.
Organization Science, 15: 481-496.Henderson, R. M., & Clark, K. B. 1990. Architectural innovation: The reconfiguration of existing product tech-
nologies and the failure of established firms. Administrative Science Quarterly, 35: 9-30.Hoyle, R. H., & Panter, A. T. 1995. Writing about structural equation models. In R. H. Hoyle (Ed.), Structural equa-
tion modeling: Concepts, issues and applications: 158-176. Thousand Oaks, CA: Sage.Hu, L., & Bentler, P. M. 1999. Cutoff criteria for fit indexes in covariance structure analysis: Conventional criteria
versus new alternatives. Structural Equation Modeling, 6: 1-55.James, L. R., Demaree, R. G., & Wolf, G. 1993. rwg: An assessment of within-group inter-rater agreement. Journal
of Applied Psychology, 78: 306-339.Janis, I. 1972. Victims of groupthink. Boston: Houghton Mifflin.Jöreskog, K. G. 1993. Testing structural equation models. In K. A. Bollen & J. S. Long (Eds.), Testing structural
equation models: 294-316. New York: Wiley.Kline, R. B. 1998. Principles and practice of structural equation modeling. New York: Guildford.Knight, D., Pearce, C. L., Smith, K. G., Olian, J. D., Sims H. P., Smith, K. A., et al. 1999. Top management team
diversity, group process, and strategic consensus. Strategic Management Journal, 20: 445-458.Levinthal, D. A., & March, J. G. 1993. The myopia of learning. Strategic Management Journal, 14: 95-112.Li, H., & Zhang, Y. 2002. Founding team comprehension and behavioral integration: Evidence from new technology
ventures in China. In D. Nagao (Ed.), Academy of Management Best Paper Proceedings: 1-6. New York:Briarcliff Manor.
March, J. G. 1991. Exploration and exploitation in organizational learning. Organization Science, 2: 71-87.
670 Journal of Management / October 2006
© 2006 Southern Management Association. All rights reserved. Not for commercial use or unauthorized distribution. at PENNSYLVANIA STATE UNIV on April 17, 2008 http://jom.sagepub.comDownloaded from
Lubatkin et al. / TMT Behavioral Integration 671
Medsker, G. J., Williams, L. J., & Holahan, P. J. 1994. A review of current practices for evaluating causal modelsin organizational behavior and human resources management research. Journal of Management, 20: 439-464.
Nohria, N., & Gulati, R. 1996. Is slack good or bad for innovation? Academy of Management Journal, 39: 1245-1264.Nonaka, L. 1994. A dynamic theory of organizational knowledge creation. Organization Science, 5: 714-737.O’Reilly, C. A., III., Snyder, R. C., & Boothe, J. N. 1993. Executive team demography and organizational change.
In G. P. Huber & W. H. Glick (Eds.), Organizational change and redesign: Ideas and insights for improvingperformance: 147-175. New York: Oxford University Press.
O’Reilly, C. A., III., & Tushman, M. L. 2004. The ambidextrous organization. Harvard Business Review, 82(4): 74-81.Podsakoff, P. M., MacKenzie, S. B., Lee, J., & Podsakoff, N. P. 2003. Common method bias in behavioral research:
A critical review of the literature and recommended remedies. Journal of Applied Psychology, 88: 879-903.Porter, M. E. 1985. Competitive advantage. New York: Free Press.Robinson, R. B., & Pearce, J. A. 1988. Planned patterns of strategic behavior and their relationship to business-unit
performance. Strategic Management Journal, 9: 43-60.Romanelli, E. 1987. New venture strategies in the minicomputer industry. California Management Review,
30: 160-175.Shaw, M. E. 1981. Group dynamics: The psychology of small group behavior. New York: McGraw-Hill.Shook, C. L., Ketchen, D. J., Hult, G. T. M., & Kacmar, K. M. 2004. An assessment of the use of structural equa-
tion modeling in strategic management research. Strategic Management Journal, 25: 397-404.Siegel, P. A., & Hambrick, D. 1996. Business strategy and the social psychology of top management teams. In
J. A. C. Baum & J. E. Dutton (Eds.), Advances in strategic management, 13: 91-119. Greenwich, CT: JAI.Simons, T., Pelled, L. H., & Smith, K. A. 1999. Making use of difference: Diversity, debate, and decision compre-
hensiveness in top management teams. Academy of Management Journal, 42: 662-675.Simsek, Z., Veiga, J. F., Lubatkin, M., & Dino, R. 2005. Modeling the multilevel determinants of top management
team behavioral integration, Academy of Management Journal, 48: 69-84.Small Business Association. 2003. Administrative economic plan (Release 03-02). Washington, DC: Author.Smith, K. G., Collins, C. J., & Clark, K. D. 2005. Existing knowledge, knowledge creation capability and the rate
of new product introduction in high technology firms. Academy of Management Journal, 48: 346-357.Smith, K. G., Smith, K. A., Olian, J. D., Sims, H. P., O’Bannon, D. P., & Scully, J. A. 1994. Top management team
demography and process: The role of social integration and communication. Administrative Sciences Quarterly,39: 412-438.
Smith, W., & Tushman, M. 2005. Managing strategic contradictions: A top management model for managing inno-vation streams. Organization Science, 16: 522-536.
Tabachnick, B. G., & Fidell, L. S. 1996. Using multivariate statistics. New York: HarperCollins.Teece, D. J., Pisano, G., & Shuen, A. 1997. Dynamic capabilities and strategic management. Strategic Management
Journal, 18: 509-533.Tushman, M. L., & Nadler, D. A. 1978. Information processing as an integrating concept in organizational design.
Academy of Management Review, 3: 613-624.Tushman, M. L., & O’Reilly, C. A., III. 1996. Ambidextrous organizations: Managing evolutionary and revolution-
ary change. California Management Review, 38: 8-30.Tushman, M. L., & O’Reilly, C. A., III. 1997. Winning through innovation. Boston: Harvard Business School Press.Tushman, M., & Romanelli, E. 1985. Organizational evolution: A metamorphosis model of convergence and reori-
entation. In L. L. Cummings & B. M. Staw (Eds.), Research in organizational behavior, 7: 171-222. Greenwich,CT: JAI.
Uzzi, B. 1997. Social structure and competition in interfirm networks: The paradox of embeddedness.Administrative Science Quarterly, 42: 35-67.
Waldman, D. A., Ramirez, G. G., House, R. J., & Puranam, P. 2001. Does leadership matter? CEO leadership attrib-utes and profitability under conditions of perceived environmental uncertainty. Academy of ManagementJournal, 44: 134-143.
Weick, K. E. 1982. Management of organizational change among loosely coupled elements. In P. S. Goodman (Ed.),Change in organizations: 375-408. San Francisco: Jossey-Bass.
Weick, K. E. 1995. Sensemaking in organizations. London: Sage.Winer, B. J. 1971. Statistical principles in experimental design. New York: McGraw-Hill.
© 2006 Southern Management Association. All rights reserved. Not for commercial use or unauthorized distribution. at PENNSYLVANIA STATE UNIV on April 17, 2008 http://jom.sagepub.comDownloaded from

Wooldridge, B., & Floyd, S. W. 1989. Strategic process effects on consensus. Strategic Management Journal,10: 295-302.
Zahra, S. A., Ireland, R. D., & Hitt, M. A. 2000. International expansion by new venture firms: International diver-sity, mode of entry, technological learning, and performance. Academy of Management Journal, 43: 925-950.
Michael H. Lubatkin ([email protected]) earned his DBA from the University of Tennessee; heholds the Thomas, John, and Bette Wolff Family Chaired Professor of Strategic Entrepreneurship at the Universityof Connecticut and a professorial position at EM Lyon in France. His current research interests include top man-agement teams and corporate governance issues as they pertain to family and entrepreneurial firms.
Zeki Simsek ([email protected]) is an assistant professor of management in the ManagementDepartment at the University of Connecticut. He received his PhD from the University of Connecticut. His currentresearch interests are in the area of strategic management and strategic entrepreneurship, with emphasis on top man-agement teams, corporate governance and valuation, and entrepreneurial initiatives.
Yan Ling ([email protected]) is an assistant professor of management at George Mason University. She received herPhD from the University of Connecticut. Her current research interests are in the area of strategic management andentrepreneurship, with emphasis on top management teams and corporate entrepreneurial initiatives.
John F. Veiga ([email protected]) earned his DBA from Kent State University; he holds theNortheast Utilities Chair in Business Ethics, is a Board of Trustees Distinguished Professor, and head of theManagement Department at the University of Connecticut. His current research interests focus on top managementteams, teleworking, strategic entrepreneurship, managerial ethics, and people with disabilities.
672 Journal of Management / October 2006
© 2006 Southern Management Association. All rights reserved. Not for commercial use or unauthorized distribution. at PENNSYLVANIA STATE UNIV on April 17, 2008 http://jom.sagepub.comDownloaded from