Embed Size (px)
Citation preview

JOURNAL OF LATEX CLASS FILES, VOL. 11, NO. 4, DECEMBER 2012 1
Winding Number Constrained Contour DetectionYansheng Ming, Student Member, IEEE, Hongdong Li, Member, IEEE, and Xuming He, Member, IEEE
Abstract—Salient contour detection can benefit from inte-gration of both contour cues and region cues. However, thistask is difficult due to different nature of region representationand contour representation. To solve this problem, this paperproposes an energy minimization framework based on windingnumber constraints. In this framework, both region cues such ascolor/texture homogeneity and contour cues such as local contrastand continuity are represented in a joint objective function whichhas both region and contour labels. The key problem is how todesign constraints which ensure the topological consistency of thetwo kinds of labels. Our technique is based on the topologicalconcept of winding number. Using a fast method for windingnumber computation, a small number of linear constraints isderived to ensure label consistency. Our method is instantiatedby ratio-based energy functions. By successfully integrating bothregion and contour cues, our method shows advantages overcompetitive methods. Our method is extended to incorporate userinteraction, which lead to further improvements.
Index Terms—contour detection, image segmentation, windingnumber
I. INTRODUCTION
OBJECT contours play an important role in image un-derstanding. They not only localize the support region
of objects, but also reveal their shape which is a strong cuefor recognition. Therefore, extracting a small set of clean andsemantically meaningful contours may simplify subsequenthigh-level image understanding tasks [48]. However, salientcontour extraction is a challenging task. First of all, theproblem is highly under-constrained. Without any knowledgeof objects, there are few prior constraints on the number ofcontours and their shape. Secondly, various factors such astexture, shadow, and lack of contrast could undermine theaccuracy of contour detection.
To deal with these difficulties, a robust strategy is to usemultiple types of cues. Many contour detection methods havebeen developed based on different cues, e.g. figure/backgroundcontrast [42], [50], [9], contour smoothness [39], closure [3],[30] and symmetry [43]. These cues often call for differentrepresentations. Region cues, such as the figure/backgroundcontrast, are more conveniently represented in 2D regionsegmentation methods [42], [50], [9], whereas contour cuessuch as smoothness are better represented in edge domain. Forexample, methods such as active contour method [19] focuson 1D contour detection.
Over the years, there has been a trend of jointly usingcontour cues and region cues for object contour detection.They can be roughly categorized as continuous or discrete
Y. Ming is with the College of Engineering and Computer Science,Australian National University, Australia, e-mail: [email protected].
H. Li is with ANU and NICTA, e-mail: [email protected]. He is with NICTA and ANU, e-mail: [email protected] material in this paper appeared in part at the 2013 IEEE conference
on pattern recognition and computer vision.
methods. In continuous domain, the active contour model wasadapted to use both region and contour cues [45] [53]. Indiscrete domain, contour cues (such as curvature) have beenintroduced to region segmentation methods (e.g. [44], inter-vening contour approach in [23]). However, their techniquesfor cue integration are often tailored to their specific problemse.g. relying on heuristic or an unduly complicated model [55],and lack explicit interaction between region and contour labels.
This paper attempts a more general, yet efficient approachthat tightly integrates both region cues and contour cues. Weconsider the contour extraction problem within an energyminimization framework. Our objective function is designedto encode various region and contour cues by explicitly intro-ducing both 2D region labels and 1D contour labels. Then weuse a set of constraints to ensure the consistency of region andcontour labels. Compared to previous methods, this frameworkallows for higher flexibility in choosing energy functions.
The key to this framework is the design of constraints,which should have the following three properties. First of all,these constraints should ensure the topological correctness ofsolutions. For example, regions with different labels shouldbe separated by contours, and object boundaries should notbe fragmented. Second, these constraints should not be toorestrictive such that there is no feasible solution. Last butnot least, constraints should be encoded efficiently, and thusinduce minimal computational costs, e.g., preferably a smallnumber of linear constraints. However, it is recognized that,constraints satisfying these conditions are not easy to design.Recent work [3] argued that in order to ensure the closednesscondition, exponentially many constraints are needed.
In this work, we propose a novel and simple method todescribe the region-contour consistency relationship, basedon the classic “winding number” concept from the field ofalgebraic topology [29]. By definition, a winding number,which involves several closed ( but not necessarily simple)planar curves and a point in the plane, refers to the number oftimes the curves revolve around this point. Our key techniqueis to restrict region labels to be the winding numbers ofcontours, so that a small number of linear constraints canprovably ensure region/contour consistency.
Our approach can be considered as an example of the“duality” relationship between region and contour. Being dual,the property of one can be converted into the property ofthe other. A well-established example is the application ofGreen’s theorem in the plane. Draw a simple Jordan curve (i.e.closed and non-self-intersecting contour) in the plane. Manyquantities (such as its areas) defined on the 2D region can becomputed efficiently via 1D line integral along the contour.
We apply our framework to the scenario in which regionshave binary labels, and focus on the foreground contourdetection. Using the winding number technique, we integrate

JOURNAL OF LATEX CLASS FILES, VOL. 11, NO. 4, DECEMBER 2012 2
region segmentation cues into the ratio-based contour detectionformulation [49], [44]. Our objective function includes threecomponents for contour saliency, region similarity and contoursmoothness, respectively, and can be efficiently solved bylinear programming.
Our method is evaluated on several public datasets, and iscompared with pure contour or region based approaches. Ourmethod is also extended to incorporate user interaction forinteractive image segmentation. Although this paper focuseson middle-level perceptual grouping, we believe that ourmethod is applicable to high-level tasks where both contourcues and region cues are helpful (e.g. object detection).
The paper is organized as follows. Section II discussesrelevant methods in the literature. Section III introduces thewinding number concept. Section IV presents our generalenergy minimization framework for cue combination. In Sec-tion V, this framework is instantiated by ratio-based energyfunctions. Experimental results by these energy functions areshown in Section VI, and conclusion is in Section VII. Com-pared to our conference paper [31], this paper has many newmaterials. First, our method is compared with more methodson more datasets, and we include additional results for visualcomparisons. Second, our method is extended to incorporateuser interaction for the purpose of interactive segmentation.Third, several illustrations for key concepts are also added.
II. RELATED WORK
Our work is closely related to contour detection and imagesegmentation methods. Contour detection methods aim toextract one dimensional curves which have physical meaningin an image. For example, these curves may correspond toobject boundaries or surface markings. Human labeling, suchas those in [5], is often used as ground truth for benchmarking.
Most of contour grouping methods start with local edgedetection. Early work applies filters of special design to animage and estimates edge location from filter responses [10],[36]. Later, learning based methods obtain more robust per-formance. e.g. [27], [37], [21], due to their ability for usingmultiple cues such as texture, brightness, and color. However,ambiguities in local information prevent local detectors fromobtaining clean results. A recent study [57] shows that somebest local edge detectors have comparable accuracy withhuman, suggesting that the superiority of human contourdetection lies in high-level image understanding.
Many methods have employed mid-level cues, often in-spired by Gestalt laws of grouping [34]. For example, theGestalt law of good continuity is popularly employed as aprominent contour cue [26], [52], [39] [20], [49]. In addition,the contour closure prior, based on a psychological study [22],has been addressed in [3], [30]. The global Pb method, anintegration of several successful techniques, has state of theart performance on the BSDS dataset [5]. In addition to mid-level grouping cues, category-specific information is also usedfor detecting semantic contours [56], [16]. Interested readersare referred to [35] for a comprehensive review.
Image segmentation methods aim to partition image pixelsinto coherent and meaningful regions. For example, figure-ground segmentation methods separate whole objects from the
background. Supervised segmentation methods can segmentan image into regions and recognize the category of eachregion [17]. Not using supervised information, our methodbelongs to the category of unsupervised segmentation methodsincluding active contours [19], level set [41] and watershedmethod [47]. We pay special attention to methods belongingto graph partition framework. By representing image pix-els as coupled graph nodes, image segmentation problem istransformed into a graph partition problem. Notable methodsunder this framework include the max-flow method [9], nor-malized cuts [42] and the ratio cut [50]. Moreover, spectralK-means [6], Felzenszwalb et al.’s graph-based method [13],SWA method [2] can also be considered as instances ofthis framework. In addition, the idea of graph partition alsounderlies interactive segmentation methods such as [38].
Some work has attempted to incorporate both region cuesand contour cues. Intervening contour [23] is one of the earlyefforts to use local contour saliency for region segmentation.This method is built into a state of the art segmentationalgorithm [5]. Yu et al. [54] incorporate edge information intheir Markov random field. Tabb and Ahuja integrate bothcues for low-level structure detection [46]. GPAC method [45]is one of the best variational method for cue integration incontinuous domain. However their gradient descend inferencemethod is susceptible to local minimal. Our method, however,solves linear programs for globally optimal solutions. Stahland Wang [44] modify the ratio contour method [49] inorder to extract more regular shape. The same ratio objectivefunction is implemented by superpixels in [25], and improvedresults are obtained. In Nicolls and Torr’s work [33], edgelabels are determined by a linear transform of region labels,based on discrete topology of planar graph. However, eachedge in their method has a predetermined orientation. Forinteractive segmentation, [40] uses local constraints to achieveboundary-region consistency. In contrast, the winding numberconstraints used by our method are global constraints. Thewinding number concept not only leads to a smaller numberof constraints but also provides a clearer understanding aboutregion contour interaction. Winding numbers have recentlybeen used for extracting volume representation from 3Dmeshes [18].
Winding number is one of the basic concept in topol-ogy [32] [14]. Unfortunately, it is often confused with anothertopological concept, rotation index, which is defined as thetotal rotation angle of tangent if one travels along a curve [51].Rotation index is often called rotation number, even windingnumber in the literature [28]. In computer vision field, rotationindex has been used for ensuring contour topology in [12].To the best of our knowledge, winding number has not beenapplied in perceptual grouping contexts.
III. WINDING NUMBER AND ITS FAST COMPUTATION
In this work, contours are considered as curves in twodimensional Euclidean plane E2. A curve is defined as theimage of a continuous map from an interval of real line tothe plane. A curve is closed if its end point coincides withthe start point. A closed curve is also called a loop. The
JOURNAL OF LATEX CLASS FILES, VOL. 11, NO. 4, DECEMBER 2012 3
1
-1
1
0
1
2
Fig. 1. Winding numbers induced by closed contours.
P q
γ γ
P q
Fig. 2. Left: wnp = wnq−1. Right: wnp = wnq+1. wnp and wnq
are the winding numbers of point p and q respectively.
winding number of a loop about a point is defined as thenumber of times the loop travels around the point in counter-clockwise direction. Here, the loop does need to be simple,i.e. it is allowed to intersect with itself. As shown in [14], anyconnected component of the plane has a constant and integralwinding number. Therefore, we can assign a single windingnumber to a connected region. We further extend windingnumber concept to a plane with a finite number of curves.The winding number of a region is defined as the sum of thewinding numbers of all loops. Figure 1 shows the windingnumbers of different regions induced by two closed curves.Take the region labeled with a winding number 2 for example,both two curves travel around this region in counter-clockwisedirection, and each curve induces a winding number 1 to theregion.
If winding numbers were to be computed according to thedefinition, we have to perform integration along loops in theplane. However, there is a fast method to compute windingnumbers using the crossing rule [32]: “If a loop is movingfrom our left to our right [our right to our left] as we cross it,its winding number around us increases [decreases] by one.”
Let wnp denote the winding number of point p, and yαdenote the binary label of edge α indicating whether the edgeis active. The edge extraction step is explained in Section IV-A.An illustration of the crossing rule is shown in Figure 2.
According to the crossing rule, if we draw an path frompoint p to point q, the winding number difference is
wnp − wnq =∑α∈Lpq
yα −∑β∈Rpq
yβ (1)
where Lpq and Rpq denote the indices of edges crossingfrom right to left, and edges crossing from left to right on
1
-1
1
0
1
2
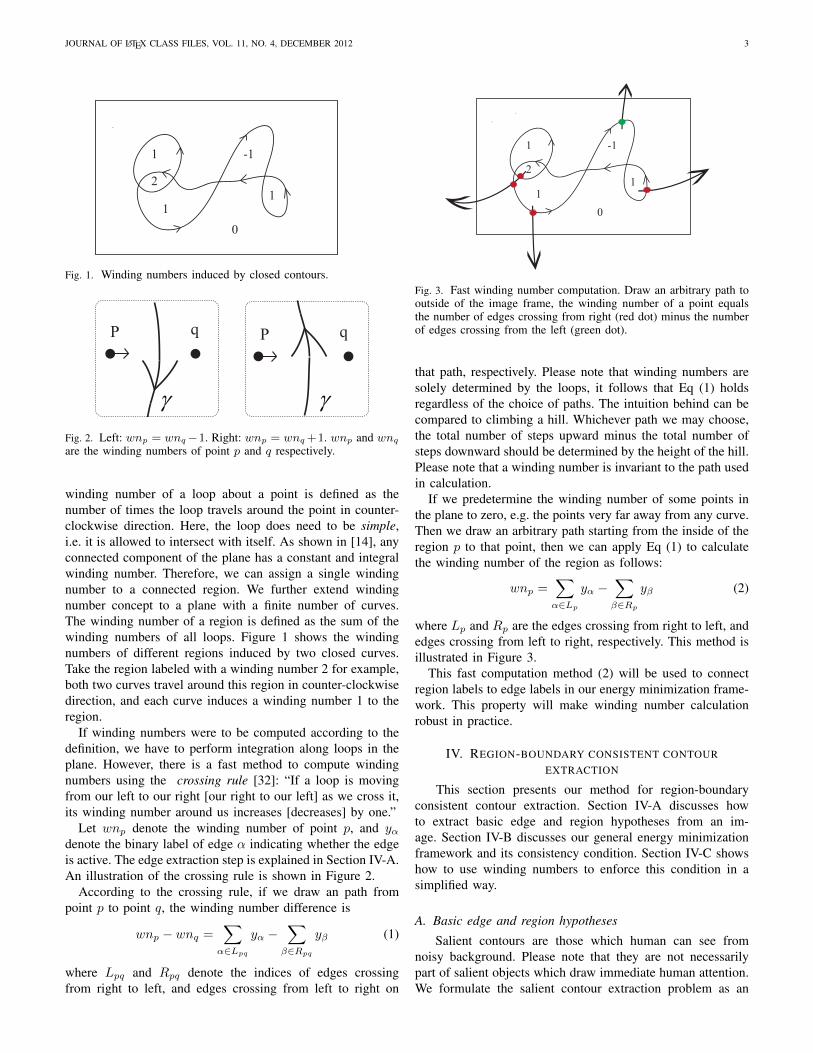
Fig. 3. Fast winding number computation. Draw an arbitrary path tooutside of the image frame, the winding number of a point equalsthe number of edges crossing from right (red dot) minus the numberof edges crossing from the left (green dot).
that path, respectively. Please note that winding numbers aresolely determined by the loops, it follows that Eq (1) holdsregardless of the choice of paths. The intuition behind can becompared to climbing a hill. Whichever path we may choose,the total number of steps upward minus the total number ofsteps downward should be determined by the height of the hill.Please note that a winding number is invariant to the path usedin calculation.
If we predetermine the winding number of some points inthe plane to zero, e.g. the points very far away from any curve.Then we draw an arbitrary path starting from the inside of theregion p to that point, then we can apply Eq (1) to calculatethe winding number of the region as follows:
wnp =∑α∈Lp
yα −∑β∈Rp
yβ (2)
where Lp and Rp are the edges crossing from right to left, andedges crossing from left to right, respectively. This method isillustrated in Figure 3.
This fast computation method (2) will be used to connectregion labels to edge labels in our energy minimization frame-work. This property will make winding number calculationrobust in practice.
IV. REGION-BOUNDARY CONSISTENT CONTOUREXTRACTION
This section presents our method for region-boundaryconsistent contour extraction. Section IV-A discusses howto extract basic edge and region hypotheses from an im-age. Section IV-B discusses our general energy minimizationframework and its consistency condition. Section IV-C showshow to use winding numbers to enforce this condition in asimplified way.
A. Basic edge and region hypotheses
Salient contours are those which human can see fromnoisy background. Please note that they are not necessarilypart of salient objects which draw immediate human attention.We formulate the salient contour extraction problem as an

JOURNAL OF LATEX CLASS FILES, VOL. 11, NO. 4, DECEMBER 2012 4
Fig. 4. Examples of region and edge hypotheses. The left shows twotriangular image regions and their edges. The right shows the edgeand region hypotheses extracted from the image. Two circles denotethe variables of two regions, and each arrow represents a variable ofa directed edge.
energy minimization problem defined on both region and edgehypotheses. We choose superpixel over-segmentation [24] asa means to provide sufficient edge and region hypotheses.Each superpixel provides an atom region hypothesis. Theboundary of each superpixel are linearized into a numberof edge-elements. For each element, two oppositely directed(bi-directional) edge hypotheses called conjugate edges areintroduced. It is important to note that our winding numberformulation is not restricted to the superpixel setup, but appliesto general boundary-region graphs as well. An illustration ofthis setup is shown in Figure 4. These two triangles give riseto two atom regions and eight directed edges.
Let the variable x = {xi|i = 1...Nr} denote the labelsof Nr atom regions, and y = {yj |j = 1...Ne} denote thebinary labels of Ne edges. The edge label space is denotedas Y = {0, 1}Ne . The label space of all region variables isdenoted as X . Although the winding number concept is poten-tially applicable for multiple-label segmentation problems, ourwork focuses on the binary-label figure/ground segmentationproblem. In other words, we let X = {0, 1}Nr .
B. Energy function and consistency condition
The problem of salient contour extraction is consideredin the energy minimization framework, as many previouswork did [19], [44], [21], [42]. The energy function E(x,y)represents various cues, such as figure-background contrastand contour smoothness, depending on applications. Our maincontribution is a set of constraints which ensure the topo-logical correctness of solutions. Together, the basic energy-minimization problem has the following form:
minx,y
E(x,y) (3)
s.t. ΦW (x,y) = 0 (4)ΦC(x,y) = 0 (5)x ∈ X ,y ∈ Y (6)
In order to guarantee the topological validity of labels, twosets of constraints are set up. The constraint set ΦC is theedge continuity constraints, as follows:∑
i∈jin
yi =∑i∈jout
yi, ∀j ∈ V, (7)
1
0
0
0
1
0
Fig. 5. The left image shows a consistent region and edge config-urations. The middle figure is not consistent because two regionsseparated by the contour have the same labels. The right figure is notconsistent because two adjacent regions with different labels are notseparated by contour.
where j is from the vertex index set V ; jin and jout denoteedges indices heading into and moving out of the vertex j,respectively. These constraints say that the net flow at everyvertex is zero. For a flow network without source and sink, allthe flows can be decomposed into a set of cycles. Therefore,our method aims to extract a set of closed curves as contours.
The constraints ΦW denote the winding number constraintswhich ensure the consistency of region and contour labels. Thespecific consistency condition used in this paper is that:
If an edge is active, its adjacent (i.e. incident) regionsmust have different region labels; if two adjacent regions havedifferent labels, one of the edge elements in-between must beactive.
This condition guarantees that every edge must be part ofa region boundary, and every region is enclosed contours.Figure 5 shows one correct labeling and two incorrect casesthat violate the condition. At first glance, this condition doesnot have anything to do with winding numbers. Instead, it canbe formulated as follows:
|ym − yn| = 1 (xi − xj = 0) , ∀(i, j) ∈ G, (8)
where xi and xj denote the labels of two adjacent regions,and G denotes the set of indices of adjacent regions. Variablesym and yn denote two conjugate edges separating these tworegions. The function 1(·) equals one if its argument istrue, and equals zero otherwise. Although constraints (8) aresufficient for the consistency condition, they are expensiveto implement due to their non-linearity. Even if the energyfunction E is convex, the whole energy minimization problemwill generally turn out to be non-convex with these non-linear constraints. Next section will show that this condition isguaranteed by linear constraints based on the winding numberconcept.
C. Winding number constraints
We realize that the winding number concept, from topo-logical study, provides an elegant and effective means to pa-rameterize the region-contour consistency condition for imagesegmentation. We have reached the following key step calledwinding number technique:
The label of a region can be identified by its winding numberinduced by contours.
The winding numbers can be used as region labels due toproperties discussed in Section III. For example, region labelsneed to be integral and have the same value in connectedregions. These conditions are proved to be true for winding

JOURNAL OF LATEX CLASS FILES, VOL. 11, NO. 4, DECEMBER 2012 5
numbers. More importantly, the winding number constraintsguarantee the consistency between region labels and contourlabels. First of all, due to Eq (9), the winding numbers ofadjacent regions will be different if one of the conjugate edgesbetween them is active.1 Secondly, Eq (9) also suggests thattwo regions which are not separated by any edges must havethe same winding number. In other words, these two regionscannot have different labels. Thirdly, the existence of windingnumbers also guarantee the feasibility of our problem (3).In conclusion, this winding number scheme does encode theregion-contour consistency condition.
The benefit of such winding number scheme also lies in that:it leads to a small number of linear constraints. This can bemade evident by examining the fast computation procedureof winding number computation in Eq (2). To adapt it toour problem, we assume that every image is enclosed by arectangular border, region outside of the image has a labelzero. Therefore, the winding number of region i is computedas:
xi =∑α∈Pi
yα −∑β∈Ni
yβ , ∀i (9)
where Pi and Ni are the edges crossing from right to left,and edges crossing from left to right, respectively. Eq (9) forall atom regions together can be represented as the followingwinding number constraint, denoted as ΦW in Eq (4):
x = My, (10)
where M is a matrix whose entries are 0, 1, or −1. Take thei-th row of M for example, M(i, α) = 1,∀α ∈ Pi; M(i, β) =−1,∀β ∈ Ni; and the rest of entries are zero. The number ofconstraints is the same as the number of atom regions.
The winding number constraints in theory do not dependon the choice of path from each atom region to the outside ofthe image. However, determining the adjacency relationshipnumerically can be difficult in the neighborhood of junctions.To minimize the risk of incorrect adjacency estimation, ourmethod chooses a path such that the total number of regionson this path is small, and the edges crossing this path are long.Some examples of paths are shown in Figure 6.
Since region labels are determined by edge labels linearly,the winding number constraints may restrict the set of feasibleregion labels. However, if region labels are binary, the follow-ing proposition shows that the winding number constraints donot restrict solutions of segmentation at all.
Proposition 1. For any segmentation in which region labelscan only be zero or one, there always exists a set of orientedboundaries such that the regional labels equal the windingnumbers induced by these boundaries.
Proof. First of all, we assume that edges do not overlap andeach edge is only adjacent to two regions. If this assumptionis not valid, the edges can be divided into smaller segments tosatisfy the assumption. Then, for an atom region whose labelis one, we set a cycle of its adjacent edges in counterclockwisedirection to be active. This cycle of edges will induce a
1If both of the conjugate edges are active, the two regions must share thesame label in the same way as when both edges are inactive.
Fig. 6. The left shows an image in BSDS dataset. The right showspaths by which the winding number of the superpixels (red dots) arecalculated.
winding number one to this region, and a winding numberzero to other regions. Since edges are not shared by morethan two regions, this operation can be done to every atomregion without conflict. Consequently, every atom region inthe foreground has a winding number one. Last, conjugateedges which are both active can be removed without affectingthe winding number of any region. Therefore, the final contourmap is consistent with the given segmentation.
V. APPLICATION TO RATIO-BASED ENERGY FUNCTIONS
Many energy functions have been proposed for imagesegmentation and contour grouping. Here, we pay specialattention to the ratio-based contour detection and segmentationmethods which have been studied in [49], [44], [25], [39]. Oneadvantage of ratio-based energy functions is that they havelittle bias towards either large or small regions. Also, they arenot biased towards equal partitions such as normalized cuts.Another advantage is that these energy functions are relativelyeasy to optimize.
Therefore, ratio-based energy functions are used as anexample to demonstrate the effectiveness of our windingnumber technique. Section V-A shows how contour cues areintegrated with region similarity cues through our constraints.Section V-B shows how the curvature cue is integrated. Sec-tion V-C extends our method to incorporate user interaction.Implementation details are presented in Section V-E. We alsodiscuss other energy functions in Section V-F.
A. Incorporation of region similarity cue
The contour-based energy function our method adopts is theratio between contour gaps and areas of foreground, definedas ([44]):
EB(y)
A(x)(11)
The boundary term measures the total gap length withincontours:
EB(y) = αb∑i
viyi (12)
where vi is the gap length in edge i. The parameter αb controlsstrength of the boundary term. This term will favor foreground

JOURNAL OF LATEX CLASS FILES, VOL. 11, NO. 4, DECEMBER 2012 6
objects with salient boundaries. The denominator is the totalareas of foreground:
A(x) =∑i
aixi (13)
where ai is the area of region i. In [44], areas are convertedinto second edge weights of a graph, and an optimal solution isobtained by solving a graph cycle-finding problem. A problemwith Eq (11) is that there may be strong distracting contoursinside an object or in background. Here a region similarityterm ER is added to improve robustness to such noise. Thenew objective function is defined as:
E(x,y) =ER(x) + EB(y)
A(x)(14)
The new addition, the region term is defined as the sum of theaffinity measures between figure and background superpixels:
ER(x) = αr∑
(i,j)∈PR
wij |xi − xj | (15)
where PR denotes pairs of regions whose distance is smallerthan a threshold. The weight wij encodes the color differencebetween regions i and j. αr is a parameter to control thestrength of the region term. This term favors large figure-ground contrast.
To ensure region-contour consistency, we use three sets ofconstraints. The first two sets of constraints are the continuityconstraints Eq (5) and the winding number constraints Eq (4).They have been discussed in Section IV. Following the binarylabel assumption, we limit any region and edge label to bebinary. In sum, our ratio-based segmentation model is asfollows:
minx,y
ER(x) + EB(y)
A(x)(16)
s.t. ΦW (x,y) = 0
ΦC(y) = 0
x ∈ X ,y ∈ Y
where the label spaces are defined as X = {0, 1}Nr andY = {0, 1}Ne . Although Eq (16) is good enough for ensuringthe region-contour consistency, the formulation can be furthersimplified by replacing region labels with edge labels usingEq (10), which leads to an energy function of edge variables.
B. Incorporation of curvature cues
Recognized as the Gestalt law of good continuity, thehuman vision system has a preference for grouping smoothcontours together. Our method can be extended to take intoaccount of contour smoothness. The smoothness of contourscan measured by integral of squared curvature. Let PE denotethe indices of all pairs of edges sharing one vertex. The binaryjunction variable zij is associated with the junction formed byedge yi and yj . Let z = {zij |(i, j) ∈ PE} denote all Njjunction variables, and Z = {0, 1}Nj is the label space ofjunction variables. In our model, the total curvature cost isdefined as:
EC(z) = αc∑
(i,j)∈PE
uijzij (17)
1y
2y
3y
4y5
y
6y
2,5z
2,4z
Fig. 7. Our junction model. The first figure shows one junctiondetected in the image. The second figure shows the 6 variablesrepresenting the associated edges. The third and forth figures showtwo possible L-junctions if edge y2 is active.
where the parameter αc controls the strength of the curvatureterm as a whole.The curvature weight uij is the sum of squaredcurvature along both edges. In [25], only curvature costswithin edge fragments are taken into account. However, ourcurvature term also penalizes sharp turns at junctions.
Our junction model is illustrated in Figure 7. To ensurecorrect junction configuration, junction constraints are devised.They are denoted as ΦJ(y, z) ≤ 0. These constraints areadapted from the connectedness constraints for undirectededges [30]. These constrains consist of two parts. First, everyactive edge should form transition to at least one edge whosetail connects to the head of the current edge. Second, everyjunction variable can be active only when both of its associatededges are active. The junction constraints are translated intothe following linear inequities:∑
j|(i,j)∈PE
zij ≥ yi, ∀i (18)
zij ≤ yi, ∀(i, j) ∈ PE (19)zij ≤ yj , ∀(i, j) ∈ PE (20)
The inequities (18) correspond the first part of junctionconstraints. The inequities (19) (20) correspond to the secondpart of junction constraints. In sum, the energy minimizationproblem is as follows:
minx,y,z
ER(x) + EB(y) + EC(z)
A(x)(21)
s.t. ΦW (x,y) = 0
ΦC(y) = 0
ΦJ(y, z) ≤ 0
x ∈ X ,y ∈ Y, z ∈ Z
The effectiveness of adding curvature terms is illustrated bythe example in Figure 8. The left is an input image. A starshape is favored by the boundary term and the region term dueto its stronger contrast to background. Therefore, our modelwithout the curvature term chooses the star as shown in themiddle of Figure 8. When the curvature term is added, thesmoother disk is extracted as shown in the right of Figure 8.
C. Incorporation of user interaction
Our method described so far only uses low and mid-levelgrouping cues. It is recognized that the use of high-levelinformation can make a grouping process more robust [5].A major source of high-level information is user interaction.

JOURNAL OF LATEX CLASS FILES, VOL. 11, NO. 4, DECEMBER 2012 7
Fig. 8. An example in which the curvature term affects our model’soutput. The first image is an input image. The second image showsour method’s output without the curvature term. Last image showsthe output under the influence of the curvature term. (Best viewed incolor.)
Our method can be conveniently extended for this purpose.We assume that an user has specified some of edge and regionlabels by clicking on an input image. Our model can representthese inputs as a set of constraints. For examples, let RF standfor the regions which the user considers as foreground, and RBdenote those considered as background. The correspondingconstraints are:
xi = 1, ∀i ∈ RF (22)xi = 0, ∀i ∈ RB (23)
D. Inference by linear relaxation
The energy minimization problems Eq (16) and Eq (21) arenonlinear integer programs. In the following, they are relaxedinto linear programs which can be solved in polynomial time.Since Eq (16) is a special case of Eq (21), we only need todiscuss the latter. First, the domain of all labels is relaxed tobe interval [0, 1]. Second, note that all terms in the objectivefunction are linear except for ER which is the sum of theabsolute values according to Eq (15). Each absolute value|xi − xj | is replaced by a variable tij , and two constraintswhich are tij > xi − xj , and tij > xj − xi. Then ourmodel becomes a standard linear fractional program (24). Letthe real-valued vector ξ here refer to all the variables, i.e.ξT = [xT yT zT tT ].
Since the denominator representing total areas is strictlypositive, the fractional program can be transformed into alinear program [8]. This method is also used in a contourgrouping work [20]. In general, the linear fractional programis written as follows:
minξ
cT ξ + d
eT ξ + f(24)
Aξ = b
ξ ≥ 0
where A to f are constants. The denominator is positive, i.e.eT ξ + f > 0. Let η = ξ
eT ξ+f,τ = 1
eT ξ+f, then the equivalent
linear program is:
minη,τ
cT η + dτ (25)
Aη = bτ
η ≥ 0
eT η + fτ = 1
The solution of the fractional program can be obtained as ξ =η/τ . In general, ξ is not necessarily integral. However, in ourexperiments, solutions are usually very close to be integral.
Fig. 9. Weizmann horse dataset. The horse images are in the first andthird columns, and the corresponding groundtruth contours are in thesecond and forth columns.
E. Implementation details
The boundary gap measure vi in Eq (12) equals thenumber of edge pixels in the segment minus the sum of theprobabilities of each edge pixel being a true contour point. Theprobability is estimated according to [25]. The region affinitymeasure wij in Eq (15) is the sum of affinity values of all pairsof pixels in these two regions, i.e. wij =
∑pq|p∈i,q∈j w(p, q).
The pixel-wise weight w(p, q) is computed based on thesimilarity of colors and locations using a RBF kernel.
We use LP SOLVE library to solve the linear program-ming problem. An image is usually oversegmented intoabout 300 superpixels, and our algorithm consists of ten totwenty thousand variables and several thousands of constraints.LP SOLVE solves the problem in about twenty seconds on amodest laptop with Intel 2G Centrino 2 core processor/3GRAM.
F. Extension to other objective functions
Other well established objective functions such as nor-malized cuts can also be transformed into energy functionsbased on edge labels. Although this objective function is moredifficult to optimize, it is included in this paper for discussions.The objective function of normalized cuts [42] is defined as:
minx∈X
∑ij wij |xi − xj |
(∑i wixi)(
∑i wi(1− xi))
(26)
where wij are affinity between superpixel i and j. Theparameter wi =
∑j wij denotes the volume of xi. x denotes
all the region labels. Our transformation leads to the followingedge-based segmentation problem:
miny
∑ij wij |mT
i y −mTj y|
(∑i wim
Ti y)(
∑i wi(1−mT
i y))(27)
s.t. ΦC(y) = 0
My ∈ Xy ∈ Y
VI. EXPERIMENTS
Our method is compared with several related methods on theWeizmann horse dataset [7] and the Weizmann segmentationdataset [1]. Then our method is extended to incorporateuser interaction which is effective for more complex BSDSdataset [5].

JOURNAL OF LATEX CLASS FILES, VOL. 11, NO. 4, DECEMBER 2012 8
A. Tests on the Weizmann horse dataset
As shown in Figure 9, this image set contains salient horsesin the middle of images. However, obtaining complete con-tours of horses is still challenging due to several reasons. Forexample, there are strong distracting contours in backgroundand inside horse regions. True contours on the other handmay be faint or missing because of low contrast. Since horsesusually are not camouflaged, we expect the incorporation ofregion cues to be helpful in obtaining cleaner contours.
Our method is compared with several closely related meth-ods. To demonstrate the effectiveness of cue combination, theregion-based normalized cuts method (Ncuts) [42] and thesuperpixel grouping method (SC) [25] are used for qualitativecomparisons. Ncuts is based on pairwise regional affinities,similar to the region term used in our method. SC implementsthe ratio contour method [44] (RC) in superpixel domain,and our method uses the same superpixel implementation asSC. For quantitative comparisons, we also include RC, andGPAC [45] which is one of the best variational methods forcue combination.
Both SC and our method are initialized on Pb detectionresults. Ncuts and GPAC implementations are obtained fromauthors’ websites. The parameters of our method are adjustedon a validation set. The results are shown in Figure 10.SC outputs ten solutions for each image, the one with thehighest F-value is shown in the figure. We can see that ouroutputs better separate the horse regions from background. InSC’s outputs, horse legs are often connected as a single blobregion. However, region similarity cues used in our model helpdistinguish background regions from foreground regions. Two-way Ncuts often cuts out a homogeneous background area.Ten-way Ncuts, however, tends to produce spurious edges(e.g. those in the sky and grass). These results show thateither contour cues or region cues alone are not enough forsegmenting salient foreground regions. Note that our results inFigure 10 appear to be a single contour due to our choice of theobjective function. The winding number constraints, however,do not require the solution to be a Jordan curve.
We quantitatively evaluate related methods using F-measureon 100 horse images. The F-value of each solution is computedby comparing its segmentation mask with the groundtruthmask. The F-value is close to 100% if and only if the detectedcontours are close to the groundtruth contours, and the F-valuedeclines gradually when the output contours deviate fromgroundtruth. For methods producing more than one solutionsper image (e.g. SC, Ncuts), the overall F-value of an imageis the best F-value of all the solutions. Figure 11 shows theF-values of SC reported in [25] which converges to 79.7%with 10 solutions per image. In our experiment, it convergesto 76.5%. However, in either [25] or our experiment, theperformance is much worse when the number of solution issmall. Our model outputs only one solution for each imageand achieves an F-value of 74.1%. RC reaches an F-value of68.1%. We let Ncuts to produce two or ten solutions for oneimage by partition the image into two or ten segments. The F-value of two-way Ncuts is 43.7% while that of ten-way Ncutsis 64.9%. The F-value of GPAC is 54.5%. Using the bound-
0 2 4 6 8 100
0.2
0.4
0.6
0.8
1
Number of Outputs
F−
valu
e
SCRCNcutsGPACOur method
Fig. 11. The F-values of related methods on Weizmann horse dataset.SC method achieves hight F-value with 10 the solutions. However,our method is better when considering only one solution. (Bestviewed in color.)
ary term alone, our method achieves an F-value of 64.8%,demonstrating that the region homogeneity cue is effectivefor this dataset. Note that with additional constraints [11],our method could output more solutions at the expense ofincreased computation time.
B. Tests on the Weizmann segmentation dataset
Our method is also tested on the Weizmann segmentationdataset [1] which contains one hundred single-object imagesand one hundred images with two objects. Our method isadjusted on the two-object images and is tested on the single-object images. We follow the same protocol as in the previoussection. Qualitatively, our method can produce good results asshown in Figure 12. SC, Ncuts, RC, and GPAC methods areused in the comparison by F-measure. When compared withthe best of ten solutions, our method’s single solution F-value(78.02%) is inferior to SC (87.19%), and is comparable to RC(77.82%). However, as shown in Figure 13, our method hasclear advantage for the single output. In addition, for someimages our method can produce better outputs than the bestsolutions of SC and Ncuts. The F-value of two-way Ncutsis 45.7%, and that of ten-way Ncuts is 56.8%. The F-valueof GPAC is 63.6%. We have analyzed the contributions ofeach term. When there is only boundary term in the objectivefunction the F-value of our solutions reduce to 76%. Ourmethod using the boundary term and the region term but notthe curvature term achieves 78%. The improvement by thecurvature term is largely in details which do not affect F-valuemuch.
C. Incorporating user interaction on BSDS300 dataset
To demonstrate the effectiveness of incorporating user in-teraction, our baseline method is firstly evaluated on theBSDS300 dataset which contains a variety of urban andnatural scene images. The BSDS dataset is more challengingbecause many images contain multiple foreground objectsand background clutter. Some sample results are shown in

JOURNAL OF LATEX CLASS FILES, VOL. 11, NO. 4, DECEMBER 2012 9
Images SC Our method Ncuts
2 Regions
Ncuts
10 Regions
GPAC
Fig. 10. Comparison with the superpixel closure method (SC) and the normalized cuts method (Ncuts). The first column shows the inputimages. The second column shows our results. The third column shows the SC results. Only the best solution (with the highest F-value)of each image is shown out of 10 solutions. The fourth column shows the 2-way segmentation results by Ncuts. The fifth column shows10-way segmentation results by Ncuts. The last column shows GPAC results. (Best viewed in color.)
Figure 14, and they match our perception of salient objects. Asshown in the first row of Figure 15, the addition of region cuessometimes bias results towards homogenous parts of objects.When several objects have similar colors, our solution oftencannot differentiate these objects, as shown in the second row.In addition, we observe the difficulty of detecting camouflagedobjects for which neither cue is effective. The satisfactoryresults are only produced for images in which the foregroundobject/region is evident. Overall, these observations confirmthat our results indeed reflect both region and contour cues
but high-level cues are needed for more accurate results.
Our method is extended to use interaction as follows. Theautomatic contour detection result of an input image is firstshown to a user. An interface is then provided to record theuser’s clicks on the input image. Mouse positions of the leftclicks are assumed to be in the figural region, and those ofright clicks to be in the background. We detect the atomregions which are clicked on. The labels of these regions areconstrained to be zero or one depending on the type of clicks.These constraints derived from user interaction are added into

JOURNAL OF LATEX CLASS FILES, VOL. 11, NO. 4, DECEMBER 2012 10
Images SC Our method Ncuts
2 Regions
Ncuts
10 RegionsGPAC
Fig. 13. Some images in Weizmann segmentation dataset for which our method’s contour outputs are either more concentrated on the objects(row 1 to row 5) or smoother (last two rows), due to the influence of the region and curvature terms. The first column shows the inputimages. The second column shows our results. The SC results displayed in the second column are the best ones (in terms of F-value) outof ten solutions. The Ncuts results are shown in fourth and fifth columns. GPAC results are in the last column.
0 2 4 6 8 100
0.2
0.4
0.6
0.8
1
Number of Outputs
F−
valu
e
SCRCNcutsGPACOur method
Fig. 12. The F-values of related methods on Weizmann segmentationdataset (single-object images).
the system and a new solution is obtained and presented to theuser. The user can provide additional inputs until the solutionbecomes satisfactory. Figure 16 shows that our method canfind solutions which are consistent with human inputs. Clearimprovements are observed on these challenging images dueto the high-level inputs.
Results by the popular interactive segmentation methodsGrabcuts [38] and Random Walker [15] are also shownfor comparison, using codes implemented by Blumenthal2,and [4], respectively. The quality of a segmentation resultis measured by an index which is the intersection of thesegmentation mask and its groundtruth mask over the unionof two masks. The value of this index is between zeroand one. For these four images, the average indices of ourmethod, Grabcuts, and Random Walker are 0.89, 0.87 and0.76, respectively. Grabcuts has comparable performance toour method. However, labeling a bounding polygon is more
2http://grabcut.weebly.com/index.html

JOURNAL OF LATEX CLASS FILES, VOL. 11, NO. 4, DECEMBER 2012 11
Image Contour Directed edges
Fig. 14. Sample results on BSDS300 dataset. The first column is theinput images. The second column is the output contour overlaid onthe input images. The third column shows the directed active edges.(Best viewed in color.)
Fig. 15. Examples of segmentation bias resulted from the homogene-ity cue. For images in the first row, the extracted contour focusedon homogenous regions rather than whole objects. For images in thesecond row, our method cannot separate different objects with similarcolor. (Best viewed in color.)
laborious than labeling several seeds. Random Walker methodalso uses seeds as input. However, it requires a larger set ofseeds in order to obtain good results for those images. In thisexperiment, the seed set for Random Walker is a superset ofours. Besides human input, our method can be extended to useobject detector’s output.
1) Seeds selection: Our method’s results depend on theuser input, as shown in Figure 17. However, all these re-sults show improvements over the one without interaction.This demonstrates the robustness of our method under inputvariations. An important question is how to select an optimalset of seeds. Our experience is that the seeds are better placed
Our initial results
User input
Our final results
User input
for Grabcut
Grabcut results
User input for
Random Walker
Random Walker
results
Groundtruth
Fig. 16. Improved contour extraction results by user interaction. Thefirst row shows our outputs not using interaction. The second rowshows user inputs. The red dots denote the regions in foregroundand the blue dots denote the regions in the background. The thirdrow shows our outputs under the guidance of the user inputs. Theuser input for GrabCut, and its results are shown in the forth andfifth rows, respectively. The next two rows show input for RandomWalker method and its results. The last row shows the groundtruthsegmentation masks. (Best viewed in color.)
Fig. 17. Different user inputs (first row), and the correspondingsegmentation results (second row) by our method.
near the boundaries where the segmentation is not accurate.To save human effort, our interactive segmentation methodcan feedback the current segmentation result to the user afterevery click. In this way, the user can correct the segmentationerrors greedily. In contrast, an user must provide a whole set ofpolygon vertices to the Grabcuts before getting any feedback.
VII. CONCLUSION AND FUTURE WORK
This paper introduces a method for combining regionand contour representations efficiently, based on the windingnumber concept. This model is simple and appealing, as itonly involves a compact set of linear constraints to ensure

JOURNAL OF LATEX CLASS FILES, VOL. 11, NO. 4, DECEMBER 2012 12
the consistency of both representations. As an applicationof this method, region similarity cues and region-based userinteraction are added into our ratio-based contour detectionframework, and lead to improved results. This method is fur-ther extended to incorporate user interaction as a special kindof region cues. In future, we believe that more sophisticateddesign of region/contour cues could help to extract contours ofcomplicated objects. We are also interested in finding efficientoptimization methods for other objective functions and extendthis method to the multiple-label case.
ACKNOWLEDGMENT
This work is in part funded by Australian Research Councilthrough ARC Discovery grants. NICTA is funded by Aus-tralian Government and by ARC. We thank Srimal Jayawar-dena for proofreading.
REFERENCES
[1] S. Alpert, M. Galun, R. Basri, and A. Brandt, “Image segmentationby probabilistic bottom-up aggregation and cue integration.” in Proc.CVPR, 2007.
[2] S. Alpert, M. Galun, A. Brandt, and R. Basri, “Image segmentation byprobabilistic bottom-up aggregation and cue integration,” IEEE TPAMI,vol. 34, no. 2, pp. 315–327, 2012.
[3] B. Andres, J. H. Kappes, T. Beier, U. Kothe, and F. Hamprecht,“Probabilistic image segmentation with closedness constraints,” in Proc.ICCV, 2011.
[4] S. Andrews, G. Hamarneh, and A. Saad, “Fast random walker with priorsusing precomputation for interactive medical image segmentation,” inLecture Notes in Computer Science, Medical Image Computing andComputer-Assisted Intervention (MICCAI), 2010, pp. III:9–16.
[5] P. Arbelaez, M. Maire, C. Fowlkes, and J. Malik, “Contour detectionand hierarchical image segmentation,” IEEE TPAMI.
[6] C. M. Bishop, Pattern Recognition and Machine Learning (InformationScience and Statistics). Secaucus, NJ, USA: Springer-Verlag New York,Inc., 2006.
[7] E. Borenstein and S. Ullman, “Class-specific, top-down segmentation,”in Proc. ECCV, 2002, pp. 109–124.
[8] S. Boyd and L. Vandenberghe, Convex Optimization. New York, NY,USA: Cambridge University Press, 2004.
[9] Y. Boykov, O. Veksler, and R. Zabih, “Fast approximate energy mini-mization via graph cuts,” IEEE TPAMI, 2001.
[10] J. Canny, “A computational approach to edge-detection,” IEEE TPAMI,vol. 8, no. 6, pp. 679–698, 1986.
[11] J. Carreira and C. Sminchisescu, “Cpmc: Automatic object segmentationusing constrained parametric min-cuts,” IEEE TPAMI, vol. 34, no. 7, pp.1312–1328, 2012.
[12] J. H. Elder and S. W. Zucker, “Computing contour closure,” in Proc.ECCV, 1996, pp. 399–412.
[13] P. F. Felzenszwalb and D. P. Huttenlocher, “Efficient graph-based imagesegmentation,” IJCV, pp. 167–181, 2004.
[14] J. Gallier and D. Xu, “The fundamental group, orientability,” in A Guideto the Classification Theorem for Compact Surfaces, ser. Geometry andComputing. Springer, 2013, vol. 9.
[15] L. Grady, “Random walks for image segmentation,” Pattern Analysisand Machine Intelligence, IEEE Transactions on, vol. 28, no. 11, pp.1768–1783, 2006.
[16] B. Hariharan, P. Arbelaez, L. Bourdev, S. Maji, and J. Malik, “Semanticcontours from inverse detectors,” in Computer Vision (ICCV), 2011 IEEEInternational Conference on. IEEE, 2011, pp. 991–998.
[17] X. He, R. S. Zemel, and M. A. Carreira-Perpinan, “Multiscale con-ditional random fields for image labeling,” in Proc. CVPR, 2004, pp.695–702.
[18] A. Jacobson, L. Kavan, , and O. Sorkine-Hornung, “Robust inside-outside segmentation using generalized winding numbers,” ACM SIG-GRAPH, vol. 32, no. 4, pp. 33:1–33:12, 2013.
[19] M. Kass, A. Witkin, and D. Terzopoulos, “Snakes - active contourmodels,” IJCV, vol. 1, no. 4, pp. 321–331, 1987.
[20] I. Kokkinos, “Highly accurate boundary detection and grouping,” inProc. CVPR, 2010, pp. 2520–2527.
[21] ——, “Boundary detection using f-measure-, filter- and feature- (f3)boost,” in Proc. ECCV, 2010, pp. 650–663.
[22] I. Kovacs and B. Julesz, “A closed curve is much more than anincomplete one - effect of closure in figure ground segmentation,”PNAS,USA, vol. 90, no. 16, pp. 7495–7497.
[23] T. Leung and J. Malik, “Contour continuity in region based imagesegmentation,” in Proc. ECCV, 1998, pp. 544–559.
[24] A. Levinshtein, A. Stere, K. Kutulakos, D. Fleet, S. Dickinson, andK. Siddiqi, “Turbopixels: Fast superpixels using geometric flows,” IEEETPAMI, vol. 31, no. 12, pp. 2290 –2297, 2009.
[25] A. Levinshtein, C. Sminchisescu, and S. Dickinson, “Optimal contourclosure by superpixel grouping,” in Proc. ECCV, 2010, pp. 480–493.
[26] S. Mahamud, L. R. Williams, K. K. Thornber, and K. L. Xu, “Seg-mentation of multiple salient closed contours from real images,” IEEETPAMI, vol. 25, no. 4, pp. 433–444, 2003.
[27] D. R. Martin, C. C. Fowlkes, and J. Malik, “Learning to detect naturalimage boundaries using local brightness, color, and texture cues,” IEEETPAMI, vol. 26, no. 5, pp. 530–549, 2004.
[28] M. McIntyre and G. Cairns, “A new formula for winding number,”Geometriae Dedicata, vol. 46, no. 2, pp. 149–159, 1993.
[29] A. L. F. Meister, Generalia de genesi figurarum planarum et independentibus earum affectionibus, 1769.
[30] Y. Ming, H. Li, and X. He, “Connected contours: A new contourcompletion model that respects the closure effect,” in Proc. CVPR, june2012, pp. 829 –836.
[31] ——, “Winding number for region-boundary consistent salient contourextraction,” in Computer Vision and Pattern Recognition (CVPR), 2013IEEE Conference on. IEEE, 2013, pp. 2818–2825.
[32] T. Needham, Visual Complex Analysis. Oxford University Press, USA,Feb. 1999.
[33] F. Nicolls and P. H. Torr, “Discrete minimum ratio curves and surfaces,”in Computer Vision and Pattern Recognition (CVPR), 2010 IEEEConference on. IEEE, 2010, pp. 2133–2140.
[34] S. E. Palmer, J. L. Brooks, and R. Nelson, “When does groupinghappen?” Acta Psychologica, vol. 114, no. 3, pp. 311–330, 2003.
[35] G. Papari and N. Petkov, “Edge and line oriented contour detection:State of the art,” Image and Vision Computing, vol. 29, no. 2-3, pp.79–103, 2011.
[36] P. Perona and J. Malik, “Detecting and localizing edges composed ofsteps, peaks and roofs,” Third ICCV, pp. 52–57 759, 1990.
[37] S. B. Piotr Dollar, Zhuowen Tu, “Supervised learning of edges and objectboundaries,” in Proc. CVPR, 2006, pp. 1964–1971.
[38] C. Rother, V. Kolmogorov, and A. Blake, “”grabcut”: interactive fore-ground extraction using iterated graph cuts,” in ACM SIGGRAPH, 2004,pp. 309–314.
[39] T. Schoenemann, S. Masnou, and D. Cremers, “The elastic ratio:Introducing curvature into ratio-based image segmentation,” IEEE TIP,pp. 2565–2581, 2011.
[40] T. Schoenemann, F. Kahl, S. Masnou, and D. Cremers, “A linear frame-work for region-based image segmentation and inpainting involvingcurvature penalization,” IJCV, vol. 99, no. 1, pp. 53–68, 2012.
[41] J. A. Sethian, Level set methods and fast marching methods: evolvinginterfaces in computational geometry, fluid mechanics, computer vision,and materials science. Cambridge university press, 1999, vol. 3.
[42] J. Shi and J. Malik, “Normalized cuts and image segmentation,” IEEETPAMI, vol. 22, pp. 888–905, 2000.
[43] J. S. Stahl and S. Wang, “Globally optimal grouping for symmetricclosed boundaries by combining boundary and region information,”IEEE TPAMI, vol. 30, no. 3, pp. 395–411, 2008.
[44] ——, “Edge grouping combining boundary and region information,”IEEE TIP, vol. 16, no. 10, pp. 2590–2606, 2007.
[45] B. Sumengen and B. S. Manjunath, “Graph partitioning active contours(gpac) for image segmentation,” IEEE TPAMI, pp. 509–521, 2004.
[46] M. Tabb and N. Ahuja, “Multiscale image segmentation by integratededge and region detection,” IEEE TIP, vol. 6, no. 5, pp. 642 –655, may1997.
[47] L. Vincent and P. Soille, “Watersheds in digital spaces: an efficientalgorithm based on immersion simulations,” IEEE transactions onpattern analysis and machine intelligence, vol. 13, no. 6, pp. 583–598,1991.
[48] D. B. Walther, B. Chai, E. Caddigan, D. M. Beck, and L. Fei-Fei,“Simple line drawings suffice for functional mri decoding of naturalscene categories,” Proceedings of the National Academy of Sciences,vol. 108, no. 23, pp. 9661–9666, 2011.
[49] S. Wang, T. Kubota, J. M. Siskind, and J. Wang, “Salient closedboundary extraction with ratio contour,” IEEE TPAMI, vol. 27, no. 4,pp. 546–561, 2005.

JOURNAL OF LATEX CLASS FILES, VOL. 11, NO. 4, DECEMBER 2012 13
[50] S. Wang and J. M. Siskind, “Image segmentation with ratio cut,” IEEETPAMI, vol. 25, pp. 675–690, 2003.
[51] H. Whitney, “On regular closed curves in the plane,” CompositioMathematica, vol. 4, pp. 276–284, 1937.
[52] L. R. Williams and K. K. Thornber, “A comparison of measures fordetecting natural shapes in cluttered backgrounds,” IJCV, vol. 34, no.2-3, pp. 81–96, 1999.
[53] X. Xie and M. Mirmehdi, “Rags: Region-aided geometric snake,” IEEETIP, pp. 640–652, 2004.
[54] S. X. Yu, T. S. Lee, and T. Kanade, “A hierarchical markov randomfield model for figure-ground segregation,” EMMCVPR, 2001.
[55] L. Zhang and Q. Ji, “Image segmentation with a unified graphicalmodel,” IEEE TPAMI, vol. 32, no. 8, pp. 1406–1425, 2010.
[56] S. Zheng, A. Yuille, and Z. Tu, “Detecting object boundaries usinglow-, mid-, and high-level information,” Computer Vision and ImageUnderstanding, vol. 114, no. 10, pp. 1055–1067, 2010.
[57] C. Zitnick and D. Parikh, “The role of image understanding in contourdetection,” in Proc. CVPR, june 2012, pp. 622 –629.