Embed Size (px)
Citation preview

ISSN 2189-9592
Journal of Japanese ManagementVol. 1, No.1, November 2016
JFMRAJapan Federation of Management Related
Academies

Editor-in-Chief
Fangqi Xu (Japan Creativity Society, Kindai University)
Editors
Yukio Takagaki (Japan Academy of Management, Surugadai University)
Nobuchika Kaido (Japan Academy of Business Administration, Kwansei Gakuin University)
Editorial Board
Shintaro Abe (Japan Academy of Consumer Education, Josai International University)
Noriyuki Hamaoki (Japan Academy of Enterprise and Business Administration, Chuo Gakuin
University)
Masataka Hashimoto (Japan Logistics Society, Meiji University)
Masayuki Horie (Japan Auditing Association, Nihon University)
Yasuo Hoshino (The Japanese Association of Administration Science, International Pacific
University)
Yoshiharu Hyakuta (Japan Association for the Comparative Studies of Management,
Komazawa University)
Taketoshi Ikeda (Association for the Study of Industrial Management (Japan), Chiba University
of Commerce)
Masato Kamekawa (The Japanese Association for Research in Disclosure, Rikkyo University)
Isuke Kohtoh (Japan Academy of Management Philosophy, Chukyo Gakuin University)
Hideo Narimichi (Japan Tax Accounting Association, Seikei University)
Kosuke Ogawa (Japan Institute of Marketing Science, Hosei University)
Shigeo Ohtsuka (Japan Accounting Association, Chiba University)
Hironori Otsuka (Japan Accounting Association, Saitama Gakuen University)
Nobuhiko Sato (Japan Accounting Association, Kumamoto Gakuen University)
Osam Sato (Japan Society for Information and Management, Tokyo Keizai University)
Makoto Takahashi (Japan Creativity Society, Japan Professional School of Education)
Masayasu Takahashi (Japan Academy of Business Administration, Meiji University)
Hideki Ueki (Knowledge Management Society of Japan, Tokyo Keizai University)
Masamichi Yoshioka (The Japanese Association of Management Accounting, Tokyo University
of Science)
Advisory Board
Kazuo Hiramatsu (Japan Accounting Association, Kwansei Gakuin University)
Nobutaka Kazama (Association for the Study of Industrial Management (Japan), Meiji
University)
Takayuki Nonoyama (Japan Association for Management Systems, Aichi Sangyo University)
Takao Nuki (Association for the Study of Industrial Management (Japan), Musashi University)
Koji Okubayashi (Japan Society of Human Resource Management, Osaka International
University)

ISSN 2189-9592
Journal of Japanese Management
Vol.1, No.1, November 2016
Japan Federation of Management Related
Academies
JJFMRA

Journal of Japanese Management Vol.1, No.1, November 2016
©2016 Japan Federation of Management Related Academies All rights reserved. This journal may not be translated or copied in whole or in part without the written
permission except for brief excerpts in connection with reviews or scholarly analysis. Use in connection
with any form of information storage and retrieval, electronic adaptation, computer software, or by similar
or dissimilar methodology new known or hereafter developed is forbidden.
The original English language edition published by JFMRA.

i
Greetings on the First Issue of
the Journal of Japanese Management
The journal of the Japan Federation of Management Related Academies (JFMRA) is an
official publication of JFMRA. I am very pleased with this first electronic publication of a
scholarly journal of the Japan Federation of Management Related Academies. Through this
journal, we aim to contribute to international academic progress through advanced studies in
wide-ranging research fields related to management, management information, commerce, and
accounting in Japan. JFMRA was established through the affiliation of 57 academic societies in
the fields of management, accounting, and commerce on 23 November 2006. It emerged out of
the gap left by the disappearance of what were the three Research Liaison Committees
(management, accounting, and commerce)—due to re-organization the Science Council of Japan
(SCJ)—and now has 61 affiliated academic societies in Japan. I think that JFMRA now has a
very significant presence in Japanese academies, and is far more than merely the successor
organization of the previous Liaison Committees in the SCJ.
To date, economic inequality, global environmental issues, ageing and depopulating of
societies, accelerated development of new emerging markets, or innovations like the internet
of things (IoT), artificial intelligence(AI), open innovation and linkages-innovation, etc. have
changed our social life and cast a lot of research themes to our researchers, which need a wide-
ranging interdisciplinary approach that calls for cooperation going beyond the existing academic
frameworks of individualistic society. Therein lies the significance of JFMRA.
JFMRA has been working with the following aims: (1) Development of research and spread
of knowledge in fields related to management, management information, accounting, and
commerce; (2) Research and contribution to society through education related to management;
(3) Exchanges between various academies and researchers associated with management; (4)
Promotion of cooperation with researchers overseas related to management, and; (5) Promotion
of cooperation with the Science Council of Japan and the academic research communities
working in cooperation with the Council. The association also organizes public lectures twice
every year, as well as an annual symposium. One of the positive results has been publications
such as "The Creation of a New Business Management" (Chuokeizai-sha, 2014).
I rejoice at the release of the first issue, and would like to thank the members of the JJM
editorial board, especially Prof. Fangqi Xu, the vice-president of JFMRA. I am sure that this
journal is beyond the expected levels of many academic researchers at home and abroad and
will intellectually stimulate the readers.
Dr. Nobutaka Kazama
President, Japan Federation of Management Related Academies
Professor, School of Commerce, Meiji University, Tokyo, Japan

ii
Preface
We often hear that the global competitiveness of Japanese firms has been declining in recent
years. However, once you consider the long-term sustainability of firms as “going concerns”,
Japanese managerial practices might prove to be more viable than Western style short-term
profit orientation. It is incumbent on us to continue to conduct research on Japanese managerial
practices that emphasize sound business management and further disseminate it to the world.
Unfortunately, while many academic associations exist in Japan, few appear to be active in
disseminating Japanese knowledge abroad, particularly in the field of social sciences. Needless
to say, even if individual academic associations were interested in actively doing so, limited
resources make it difficult to accomplish such a task. Fortunately, 61 academic associations
representing management, commerce, accounting and management information are
participating in the Japan Federation of Management Related Academics (JFMRA).
One of the main means of knowledge dissemination is the publication of an academic journal
in English. In particular, in today’s highly networked society thanks to the internet, there is no
doubt that electronic journals should be the most appropriate media accessible to anyone
anytime anywhere around the world.
Under the leadership of the new board of directors, the JFMRA had in earnest initiated
action in this direction, and after about 20 months of efforts, launched as planned the first issue
of the Journal of Japanese Management (JJM) in 2015. As the representative of the editorial
board, I would like to acknowledge our appreciation to those academic associations that
participated in this effort, manuscript contributors, and reviewers for their cooperation.
We continue to work hard for the further development of JJM in the future.
Dr. Fangqi Xu
Editor-in-Chief, Journal of Japanese Management Vice-president, Japan Federation of Management Related Academics
Professor, Faculty of Business Administration, Kindai University, Osaka, Japan

iii
Contents
Greetings on the First Issue of the Journal of Japanese Management・・・・・・・・・・ ・ⅰ
Nobutaka Kazama
Preface ・・・・・・・・・・ ・ⅱ
Fangqi Xu
Effects of Incorporated Psychiatric Institutions’ Internal and External Control on
Their Local Distributions and Hierarchical Formation: Case of Osaka・・・・・・・・・・ p.1
Masahiko Takaya
Entrepreneurial Activities and Residential Networks of Creative Areas
in Japan and Korea ・・・・・・・・・・ p.15
Rihyei Kang & Takahiro Kawaji
Impacts of Overtime Reduction on Psychological Well-Being for Japanese
Research and Development Engineers:
Positive and Negative Sides of Work Time Regulations ・・・・・・・・・・ p.27
Tetsushi Fujimoto, Hideki S. Tanaka & Shiming Xia
Family firms’ transformation to non-family firms during 1920’s-2015・・・・・・・・・ p.44
Toshio Goto
SOCO’s Impact on Individual Sales Performance: The Mediating Role of
Cross-functional Integration ・・・・・・・・・・ p.60
Eunji Seo


Journal of Japanese Management Vol.1, No.1, November 2016 ISSN 2189-9592
1
Effects of Incorporated Psychiatric Institutions’ Internal and
External Control on Their Local Distributions and Hierarchical
Formation: Case of Osaka
Masahiko Takaya
Faculty of Medicine, Kindai University, Japan
Association for Research on NPOBP E-mail: [email protected]
Abstract
Medical institutions in Japan can be classified as either public or private, with both being
basically nonprofit organizations. However, most private medical institutions are incorporated
and have equity; in this sense, they operate as for-profit organizations. Moreover, their data are
not freely disclosed, making their internal controls too difficult to investigate. On the other hand,
the Ministry of Health, Labour and Welfare control the public medical and care system either
directly or indirectly; for example, the Ministry regularly revises the medical-fee system.
However, it is difficult to decide whether this system works well or not because the system of
medical institutions is too complex. To investigate a simpler model, this study examined private
psychiatric hospitals. This study aimed to examine the local competitiveness of incorporated
psychiatric hospitals, in order to reveal whether internal and external control works well or not.
In this study, 30 out of 49 private psychiatric hospitals listed on the homepage of Osaka
Association of Psychiatric Hospitals were investigated. The selected sample represents
“dedicated” psychiatric hospitals, offering only psychiatric beds. “Having a license to charge a
psychiatric emergency hospitalization fee” is an indicator of external control, and can be also
considered as an indicator of clinical activity in each hospital. Distribution of psychiatric beds
as well as of hospitals with the license was examined in each medical area. This study concluded
that the uneven distribution of psychiatric beds as well as psychiatric emergency hospitals and
the hierarchical formation of the incorporated psychiatric hospitals system can be observed.
Keywords
Incorporated medical institution, Psychiatric hospital, Control, Hierarchy, Distribution, Medical
area
(1) Introduction
1. Equity and limitedly disclosed information
The total number of medical hospitals and
clinics in Japan is 8,493 and 100,461,
respectively, while incorporated medical
hospitals and incorporated medical clinics total
5,721 and 39,455, respectively, as of the 1st of

Journal of Japanese Management Vol.1, No.1, November 2016 ISSN 2189-9592
2
October, 20141.
Most incorporated medical institutions in
Japan are known to have equity. Typical
incorporated medical institutions are called
Iryou-houjin in Japanese. Kawabuchi reported
that in 2014, of the total 49,889 Iryou-houjins,
the number of incorporated foundations was
391, while the number of incorporated
associations was 49,498. Of the 49,498
incorporated associations, 41,476 associations
have equity, while the remaining 8,022 do not2.
That is, 83% (41,476/49,889) of incorporated
medical institutions own equity (Figure 1).
However, data that would enable similar
analysis of incorporated psychiatric institutions,
whether hospitals or clinics, are not available;
thus, it is not possible to compare equity status
among other types of institutions.
Figure 1. Incorporated medical institutions in Japan
Source: This figure is created by the author based on
(Kawabuchi , 2014, p.43)
In this study, incorporated hospitals and
incorporated psychiatric hospitals are defined
as “hospitals” and “psychiatric hospitals” which
belong to incorporated medical institutions,
respectively. The data on each incorporated
1 Toukei-Hyou (in Japanese), the Ministry of Health,
Labor and Welfare:
http://www.mhlw.go.jp/toukei/saikin/hw/iryosd/14/dl/03_
toukei.pdf
hospital that can be accessed by using registries
(Toukibo in Japanese) are too limited. The
number of the members of the board of directors
(Riji in Japanese) within an incorporated
medical institution is decided by law3. There
must be three or more members of the board of
directors, and at least one auditor (Kanji in
Japanese). Registries only need to include the
chief ’s (of the board of directors) (Riji-chou in
Japanese) name but not those of all the
members of the board of directors4. Registries
are not required to state whether the hospital is
an association or a foundation. Moreover, when
an incorporated hospital is an association, its
equity status is not disclosed in the registry.
Similar to small and medium-sized enterprises,
incorporated hospitals pose the problem of
limited data.
2. Public roles of private psychiatric medical
institutions
In this study, the term “private” is defined
as “non-public” (in a broad sense).
Private psychiatric institutions play
important roles in Japan. The total number of
psychiatric beds in Japan is 338,174, with
267,578 of those operated by incorporated
psychiatric hospitals. Therefore, incorporated
psychiatric hospitals represent 79% of all
psychiatric beds. The total number of
psychiatric hospitals was 1,067, with 912 of
them incorporated psychiatric hospitals.
Therefore, 85% of psychiatric hospitals are
incorporated psychiatric hospitals. These
statistical data are accurate as of the 1st of
2 Kawabuchi, 2014, pp.43-44 3 Iryou Hou in Japanese:
http://law.e-gov.go.jp/htmldata/S23/S23HO205.html 4 Kumiai-tou Touki Rei (in Japansese) : http://law.e-
gov.go.jp/htmldata/S39/S39SE029.html

Journal of Japanese Management Vol.1, No.1, November 2016 ISSN 2189-9592
3
October, 2014, according to the Ministry of
Health, Labour and Welfare5.
Whether incorporated or not, hospitals
providing psychiatric care in Japan must obey
the Act on Mental Health and Welfare for the
Mentally Disabled (Seishin Hoken Fukushi
Hou in Japanese), which was enacted in 1995.
Several laws mostly protecting human rights of
psychiatric patients enacted after the end of the
Second World War. These laws were responses
to major violations of the human rights of
psychiatric patients. There have been several
revisions to this legislation over the years,
leading it to evolve into the Act on Mental
Health and Welfare for the Mentally Disabled
(Seishin Hoken Fukushi Hou).
Thus, although psychiatric care is governed
by Japan’s public departments, most
psychiatric-hospital treatment takes place in
private hospitals, most of which are
incorporated psychiatric hospitals. This
presents a paradox.
3. Second medical areas in Japan
In Japan, 344 in 2013; medical
administration areas called “second medical
areas” 6 have been established to provide
general hospital treatment, which is based on
the Medical Care Act7 . In Osaka prefecture,
eight second medical areas were established in
20158. Under the act, the number of hospital
beds in each area is controlled and reviewed
every five years by each prefectural governor.
The same is also true for psychiatric hospital
bed numbers. The number of beds that each
5 Toukei-Hyou (in Japanese)
http://www.mhlw.go.jp/toukei/saikin/hw/iryosd/14/dl/03_
toukei.pdf 6 Iseikyoku (in Japanese), the Ministry of Health, Labor
and Welfare:
http://www.mlit.go.jp/common/001086652.pdf
hospital is allowed depends on the total number
of beds in the area in which the hospital is
located. Each hospital gets its share in
competition with the other hospitals in the same
area. However, this competition is not
completely free, and strong vested interests
may exist.
4. The competitive system among
incorporated psychiatric hospitals
Medical fees for treatment covered by
health insurance are the remit of the Ministry
of Health, Labor and Welfare in Japan.
Therefore, medical fees (excluding fees for
medical treatment not covered by health
insurance) are subject to a de facto official price,
and in fact can be policy variables. The
government is able to run and improve a
medical policy by controlling the variables.
Medical treatments and technologies
performed in general hospitals are generally
more complex than those in psychiatric
hospitals. Therefore, the medical-fee system of
general hospitals is more difficult for
nonprofessionals to understand. On the other
hand, the medical-fee system in psychiatric
hospitals is easier to understand because these
hospitals’ functions and abilities are simpler at
a glance.
Therefore, to investigate the governance of
incorporated hospitals, psychiatric hospitals
were selected due to the narrower range of
medical skills and technologies involved
compared with general hospitals9.
However, medical care in psychiatric
7 Iryou Hou (in Japanese): http://law.e-
gov.go.jp/htmldata/S23/S23HO205.html 8 Osaka Prefectural Government:
http://www.pref.osaka.lg.jp/attach/2502/00118050/02_16
_02_fuikiban_02_syou_03_setsu.pdf 9 Takaya, 2016, p.41

Journal of Japanese Management Vol.1, No.1, November 2016 ISSN 2189-9592
4
hospitals has been differentiated and graded
these days. For example, the system of needing
a license to charge a psychiatric emergency
hospitalization fee was established in the 2002
revision of medical fees10.
Hospital systems (including the
certification system of specialists) have evolved
under the control of the Ministry of Health,
Labor and Welfare since the Meiji government,
a process that was discussed in terms of general
hospitals11. Now, national and public hospitals
play leading roles in providing clinical
treatment, undertaking medical research, and
offering specialist training. In contrast,
psychiatric hospital systems have historically
differed from those of general hospitals.
Therefore, the system of competition among
incorporated psychiatric hospitals seems
different from that among general hospitals.
However, investigation of the former could offer
insight into the latter.
5. Literature Review of governance of
incorporated medical institutions
5.1. Governance model of hospitals
When investigating the governance of
incorporated hospitals, there are two theoretical
approaches: the governance theory for nonprofit
organizations and the governance theory for
medical institutions. The former holds that no
standard governance model fits all nonprofit
organizations 12 . The latter is a theory
specifically tailored to medical institutions.
Several previous studies about governance
of medical organization were reviewed 13 .
10 On the psychiatric Emergency Care system:
http://www.mhlw.go.jp/shingi/2009/03/dl/s0326-8c.pdf 11 Takaya, 2015, pp.108-120 12 Hotta, 2012, p.787 13 Fujioka, 2013, pp.167-197
Fujioka described Japan’s medical-institution
governance models as reflecting two influences.
One is the “clinical governance” model of the
United Kingdom (UK), and the other is the
“hospital governance” model of the United
States (USA). The former focuses mainly on
offering safe and high-quality health care,
whereas the latter focuses on a governance style
akin to those utilized by for-profit
organizations14. Additionally, Fujioka referred
to the internal control of medical organizations
as risk-based by management, and opined that
management solely by family groups (relatives)
should be abolished in medical institutions15.
However, governance theories such as that
espoused by Fujioka16 are confusing because
they fail to distinguish between public and
private hospitals when discussing governance,
including internal and external sources of
control. For example, Fujioka did not classify
hospitals by type (e.g., general, special
functioning)17. Matsubara, et al. discussed ideal
governance styles of incorporated medical
institutions in Japan. However, they used the
term “public interest” in an ambiguous way
without precisely defining it; they insisted on
the necessity of governance only in incorporated
medical institutions18
Most Japanese incorporated medical
institutions are managed by family groups
(relatives), and information about them is
closely held, thus frustrating attempts at data
collection. This may make studies of
management of incorporated medical
institutions too difficult. On the other hand,
14 Fujioka, 2013, pp.151-166 15 Fujioka, 2013, pp.167-181 16 Fujioka, 2013, pp.151-198 17 Fujioka, 2013, pp.167-197 18 Matsubara, et al. 2004, pp. 4-8.

Journal of Japanese Management Vol.1, No.1, November 2016 ISSN 2189-9592
5
case studies of non-incorporated medical
institutions have examined successful
innovations by way of internal control systems
implemented in hospitals19.
The Medical Care Act (Iryou Hou in
Japanese), which was established in 1948, has
been improved several times, including
establishment of rules that should be applied to
incorporated medical institutions; however,
these were later revised for the sake of “public
interest” in Japanese medical systems20. As a
result, even now, information on incorporated
medical institutions is not sufficiently disclosed,
as mentioned above.
Though the discussion on whether non-
profit medical institutions are better has been
long-running, no clear conclusion has emerged
in a theoretical sense. This is partly because the
term “public interest” cannot be defined strictly
in theoretical economics21. However, in Japan,
medical institutions need to be officially non-
profit, whether or not they are incorporated. As
mentioned above, most medical institutions in
Japan are substantially incorporated
enterprises. The separation of ownership and
management is not realized for many small and
medium-sized institutions, which is also true of
incorporated psychiatric medical institutions.
5.2. Relationship between governance and
activities of private psychiatric hospitals
Takaya investigated the relationship
between the separation of ownership and
management of the incorporated psychiatric
medical institutions in Osaka, Japan, and their
institutional activities by examining the
possession of three elements: (1) a license to
19 Matsuo, 2009, pp.1-223 20 Iryou Hou (in Japanese): http://law.e-
gov.go.jp/htmldata/S23/S23HO205.html 21 Takaya, 2015, pp.108-109
charge a psychiatric emergency hospitalization
fee, (2) a specialist psychiatry training facility
authorized by the Japanese Society of
Psychiatry and Neurology (JSPN), and (3)
authorization from the Japan Council for
Quality Health Care (JCQHC). The first
represents the hospital’s clinical competence22.
The second represents the educational
competence of the hospital’s specialists. The
third represents overall hospital competence23.
It is not impossible to conclude that the
separation of ownership and management in
incorporated psychiatric hospitals bears a
relation to any of these three activities24. The
reasons for this can be thought of as follows.
First, the separation of ownership and
management of incorporated psychiatric
medical institutions may be only nominal and,
in fact, cannot be performed. Second, hospital
activities might be influenced by the inter-
relationship of administrative units, which
helps establish medical facilities or controls
their activities and competence25.
6. Aim of this study
As mentioned earlier, the activities and
competences of incorporated psychiatric
hospitals cannot be determined based on the
separation of ownership and management. This
suggests that other factors may influence
competitiveness among incorporated
psychiatric hospitals in Japan.
This study investigated private psychiatric
hospitals in Osaka prefecture, Japan. In the
first phase, the private psychiatric hospitals
were surveyed, most of which are incorporated
22 Takaya, 2016, pp.42-47 23 Takaya, 2016, pp.42 24 Takaya, 2016, pp.46-47 25 Takaya, 2016, pp.40-49

Journal of Japanese Management Vol.1, No.1, November 2016 ISSN 2189-9592
6
hospitals. In the second phase, a sample of
“dedicated” psychiatric hospitals was selected,
and their local distribution and hierarchical
structures were investigated, using cross-
sectional data.
(2) Empirical analysis
In this study, statistical analysis was
performed using the software jmp10 (SAS
Institute Inc., Cary, NC, USA).
1. Private psychiatric hospitals in Osaka,
Japan
Psychiatric hospitals in Japan are
generally classified as in Figure 2, according to
their types of establishers.
Figure 2. Types of psychiatric hospitals in Japan.
Source: This Figure is modified from the original
version shown in the website;
http://www.mhlw.go.jp/toukei/saikin/hw/iryosd/14/dl/
03_toukei.pdf
The website of the Osaka Association of
Psychiatric Hospitals 26 lists 49 private
psychiatric hospitals as members (Table 1). In
Table 1, the column “Name of hospital
(Abbreviation)” shows alphabetical
abbreviations of corresponding hospital names
in Japanese.
The terms A, B, and C in “governance type”
mean, respectively, “the chief of the board of
directors (Riji-chou in Japanese) and the
26 http://www.daiseikyo.or.jp/
director of the hospital (Byuoin-chou in
Japanese) is the same person,” “the chief of the
board of directors is thought to be a relative of
the director of the hospital,” and “the chief of the
board of directors is not the same as, nor is a
relative of the director of the hospital.”
“Psychiatric emergency beds” in Table 1 is the
numbers of beds for which a psychiatric
emergency fee can be charged (approved by a
regulatory agency). This approval represents
psychiatric hospitals’ clinical activity (or
competence) 27 . “Approval year” indicates the
year when each hospital was licensed to collect
the psychiatric emergency fee. “Opening year” is
chiefly based on the homepage of each hospital.
Cases when “the opening year” cannot be found
are denoted by a “ * ” symbol.
Hospitals whose “Governance type” is
classified into “B” were excluded from this study
because the separation of ownership and
management is unclear even in a nominal sense.
Hospitals 16 and 17 are run by the same chief of
the board of directors, as are Hospitals 18-20. In
Hospitals 16 and 18, the chief of the board of
directors holds the director of the hospital.
Therefore, Hospitals 17, 19, and 20 were
removed from the analysis to reduce complexity.
We usually maintain the phrase
“psychiatric hospitals.” but psychiatric hospitals
are not precisely defined. Some general
hospitals have psychiatric beds, and some
hospitals, for example Hospital 48 in Table 1,
are thought to be “psychiatric hospitals” even
though they can be classified as “general
hospitals.” Therefore, “psychiatric hospitals” are
defined in this empirical analysis as hospitals
that provide psychiatric beds only. According to
this definition, 13 hospitals in Table 1 were ex-
27 Takaya, 2016, pp.42-47

Journal of Japanese Management Vol.1, No.1, November 2016 ISSN 2189-9592
7
Table 1. Private psychiatric hospitals in Osaka, Japan
Source:
(1) Table 1 is a modified version of the original table in (Takaya, 2016, p.44)
(2) Statistical data are derived from the homepage of each hospital and the following websites:
Osaka Association of Psychiatric Hospitals: http://www.daiseikyo.or.jp/
Kinki Regional Bureau of Health and Welfare: https://kouseikyoku.mhlw.go.jp/kinki/
Japanese Association for Emergency Psychiatry: http://www.jaep.jp/
NumberName of hospital
(Abbreviation)Governance
typeOpening
yearRegular doctor
Psychiatricbeds
Recuperationbeds
Beds forgeneralpatients
Total bedsPsychiatricemergency
bedsApproval year
1 Mizuma A 1959 11 541 0 0 541 0 *
2 Kijima A 1963 13 492 0 0 492 0 *
3 Yoshimura A 1976 6 222 0 0 222 0 *
4 Sakane A 1965 3 150 0 0 150 0 *
5 Tamenaga A 1965 7 266 0 50 316 0 *
6 Watanabe A 1965 9 336 100 0 436 0 *
7 Keihan A 1954 9 306 0 0 306 0 *
8 Shichiyama A 1599 13 640 0 0 640 48 2011
9 Neyagawa A 1965 10 267 0 0 267 60 2014
10 Kaizukachuou A * 9 406 0 0 406 0 *
11 Orenji A 1965 3 240 0 0 240 0 *
12 Kumeda A 1962 9 494 0 0 494 0 *
13 Osakasayama A 1966 6 279 0 0 279 0 *
14 Kosaka A 1948 17 537 0 0 537 0 *
15 Kouai A 1964 10 221 0 0 221 0 *
16 Sawa A 1953 30 455 0 0 455 114 2005
17 Hokuto C * 8 50 0 0 50 50 2008
18 Aobaoka A 1986 16 357 270 54 681 0 *
19 Aino C 1965 45 600 144 225 969 0 *
20 Ainohanazono C 1984 13 606 0 0 606 0 *
21 Esaka B 1965 8 360 0 0 360 0 *
22 Ibaragi B 1952 8 350 0 0 350 0 *
23 Kokubu B 1961 9 201 0 0 201 48 2008
24 Hanna B 1967 5 213 48 0 261 0 *
25 Kanaokachuou B * 10 486 0 0 486 0 *
26 Shinseikai B 1981 3 148 0 0 148 0 *
27 Kansaisanatoriumu C 1968 2 192 0 0 192 0 *
28 Kansaikinen C 1983 4 270 0 46 316 0 *
29 Sakamoto C 1892 16 546 0 0 546 0 *
30 Hanwaizumi C 1965 11 354 90 0 444 0 *
31 Mikunigaoka C 1960 5 144 0 0 144 0 *
32 Hannan C 1956 46 690 0 0 690 168 2007
33 Kokoroa C * 11 450 0 0 450 0 *
34 Izumichuou C * 5 206 0 0 206 0 *
35 Mihara C 1963 5 562 0 0 562 0 *
36 Higashikori C * 10 38 39 45 122 0 *
37 Minou C 1960 8 345 0 0 345 0 *
38 Yao C 1913 14 513 0 0 513 0 *
39 Kaede C * 4 150 0 0 150 0 *
40 Shinabuyama C 1971 8 273 0 0 273 0 *
41 Tanpisou C 1956 12 310 0 0 310 0 *
42 Shirai A 1965 9 322 48 29 399 0 *
43 Kisen C 1967 3 260 0 0 260 0 *
44 Hamadera C 1930 20 749 0 0 749 0 *
45 Ozone C 1956 16 557 0 0 557 0 *
46 Izumigaoka C 1963 6 257 0 4 261 0 *
47 Shionomiya C 1969 10 384 60 0 444 0 *
48 Asakayama C 1922 67 948 38 185 1171 102 2008
49 Hirakataryoiku C 1969 28 50 0 440 490 0 *
Journal of Japanese Management Vol.1, No.1, November 2016 ISSN 2189-9592
8
Table 2. Private Psychiatric Hospitals with Psychiatric Beds Only
Source:
(1) This table has been modified from one presented by (Takaya, 2016, p.45).
(2) Data for analysis are derived from the homepage of each hospital and the following websites:
Osaka Association of Psychiatric Hospitals: http://www.daiseikyo.or.jp/
Kinki Regional Bureau of Health and Welfare: https://kouseikyoku.mhlw.go.jp/kinki/
Japanese Association for Emergency Psychiatry: http://www.jaep.jp/
Osaka Prefectural Government: http://www.pref.osaka.lg.jp/iryo/keikaku/keikaku2013to2017.html
The Japanese Society of Psychiatry and Neurology: https://www.jspn.or.jp/
Japan Council for Quality Health Care: http://jcqhc.or.jp/
NumberName of hospital(Abbreviation)
Governancetype
Medicalarea
Opening yearRegulardoctor
Psychiatricbeds
Psychiatricemergency
beds
Approvalyear
Approvedtraining facility
Accreditedfacilitity
16 Sawa A A 1953 30 455 114 2005 1 1
20 Ainohanazono C A 1984 13 606 0 * 1 0
37 Minou C A 1960 8 345 0 * 1 0
45 Ozone C A 1956 16 557 0 * 0 0
11 Orenji A B 1965 3 240 0 * 0 1
15 Kouai A B 1964 10 221 0 * 1 0
40 Shinabuyama C B 1971 8 273 0 * 1 1
7 Keihan A C 1954 9 306 0 * 1 0
9 Neyagawa A C 1965 10 267 60 2014 1 1
14 Kosaka A D 1948 17 537 0 * 1 1
29 Sakamoto C D 1892 16 546 0 * 1 0
38 Yao C D 1913 14 513 0 * 1 0
3 Yoshimura A E 1976 6 222 0 * 1 0
13 Osakasayama A E 1966 6 279 0 * 1 0
41 Tanpisou C E 1956 12 310 0 * 1 1
31 Mikunigaoka C F 1960 5 144 0 * 1 1
32 Hannan C F 1956 46 690 168 2007 1 1
35 Mihara C F 1963 5 562 0 * 1 0
1 Mizuma A G 1959 11 541 0 * 1 0
2 Kijima A G 1963 13 492 0 * 1 1
4 Sakane A G 1965 3 150 0 * 0 0
8 Shichiyama A G 1599 13 640 48 2011 1 1
10 Kaizukachuou A G * 9 406 0 * 1 0
12 kumeda A G 1962 9 494 0 * 0 0
27 Kansaisanatoriumu C G 1968 2 192 0 * 0 0
33 Kokoroa C G * 11 450 0 * 1 0
34 Izumichuou C G * 5 206 0 * 1 1
39 Kaede C G * 4 150 0 * 1 0
43 Kisen C G 1967 3 260 0 * 1 0
44 Hamadera C G 1930 20 749 0 * 1 1
Journal of Japanese Management Vol.1, No.1, November 2016 ISSN 2189-9592
9
cluded from the analysis. Following these
exclusions, 30 private psychiatric hospitals re-
mained, as listed Table 2. Values of 1 and 0 for
“approved training facility” mean, respectively,
that the Japanese Society of Psychiatry and
Neurology approved or did not approve of each
facility as a psychiatric specialist training
facility. Values of 1 and 0 for “accredited facility”
mean, respectively, that Japan Council for
Quality Health Care (JCQHC) has or has not
accredited the facility (hospital).
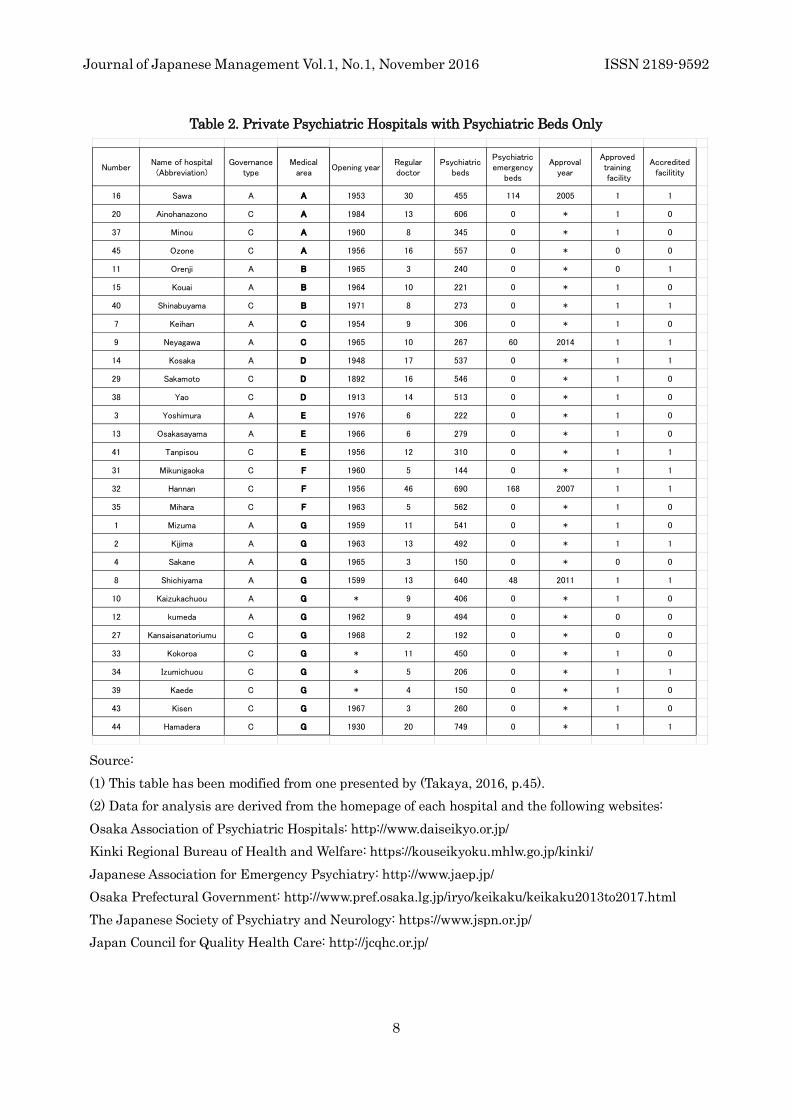
Notations “A”–“G” for “medical area” in
Table 2, which correspond to those in Figure 3
and Table 3, indicate the second medical areas
in Osaka, Japan, to which each hospital belongs.
Medical areas are arranged alphabetically.
Figure 3 displays Osaka’s medical areas
geographically.
2. Uneven distribution of private psychiatric
hospitals in terms of clinical activity
As mentioned above, Takaya pointed out
that it is not possible to say that having a license
to charge a psychiatric emergency
hospitalization fee, which represents clinical
activity, is related to either a hospital’s
governance type or the separation of ownership
and management28 . Takaya also pointed out
that except for the Mishima and
Minamikawachi medical areas, every medical
area has at least one hospital licensed to charge
a psychiatric emergency hospitali-zation fee29.
These are shown in Figure 3 and Table 3, where
each “hospital number” corresponds to that
used in Table 1 and Table 2. Hospitals with
numbers in parentheses in Table 3 are included
in Table 1 but not in Table 2.
28 Takaya, 2016, pp.41-47
Figure 3. Second Medical areas in Osaka, Japan.
Source: This Figure is modified, by the author, from
the original version shown in the data in the website;
http://www.pref.osaka.lg.jp/iryo/keikaku/keikaku201
3to2017.html
Table 3. Private hospitals licensed to charge a
psychiatric emergency hospitalization fee and
their medical areas
Source: This Table is modified from Tables 1 and 2,
and Figure 3.
According to Table 3, an uneven
distribution of hospitals having “a license to
charge a psychiatric emergency hospitalization
29 Takaya, 2016, p.48

Journal of Japanese Management Vol.1, No.1, November 2016 ISSN 2189-9592
10
fee” can be observed among each medical area.
3. Relationship between the numbers of regular
doctors and psychiatric beds
This study considers having a license to
charge a psychiatric emergency hospitali-zation
fee as an indicator of clinical activities in each
hospital. Each hospital is assigned a specific
number of hospital beds by each prefectural
government, a number that is indirectly, under
the control of the Ministry of Health, Labour
and Welfare. The allocated number of beds
corresponds to the area of the hospital wards.
Therefore, the number of beds can be considered
as an initial value. On the other hand, the
number of regular doctors can be considered a
variable in each hospital’s evolutional process
because each hospital can or should recruit or
control the number of the doctors in order to
improve its activity. However, Takaya found
multico-llinearity between number of beds and
number of regular doctors in the 30 private
psychiatric hospitals30.
4. Clinical competence and the number of
regular doctors or psychiatric beds
The result of bivariate logistic regression
analysis between the number of regular doctors
(independent valuable) and having a license to
charge a psychiatric emergency hospitalization
fee (dependent valuable) showed no significant
correlation (parameter estimate: -0.2020, p-
value: 0.0525). Neither did the result of
bivariate logistic regression analysis between
the number of psychiatric beds (independent
valuable) and having a license to charge a
psychiatric emergency hospitalization fee
(dependent valuable) show (parameter
30 Takaya, 2016, p.46
estimate: -0.00485, p-value: 0.1638).
5. Overall hospital competence and the number
of regular doctors or psychiatric beds
The result of bivariate logistic regression
analysis between the number of regular doctors
(independent valuable) and JCQHC
authorizations (dependent valuable) showed no
significant correlation (parameter estimate: -
0.1183, p-value: 0.0922). Neither did the result
of bivariate logistic regression analysis between
the number of psychiatric beds (independent
valuable) and JCQHC authorizations
(dependent valuable) show (parameter
estimate: -0.0013, p-value: 0.5459).
6. Competitiveness in each medical area
6.1. Clinical competence as a result of internal
control
The relationship between clinical activity
and number of regular doctors in private
psychiatric hospitals will be discussed below by
medical area, based on the data in Table 2.
Of the four hospitals in medical area A,
hospital 16 has the most stable number of
doctors (30). In medical area C, Hospital 9 has
the most stable number of doctors (10). In
medical area F, Hospital 32 has the largest
number of regular doctors (46), and in medical
area G, Hospital 8 has the second highest
number of regular doctors of all 12 hospitals.
These results suggest that the number of
regular doctors seems to have an important
effect on the clinical activities of each medical
area’s hospitals. A strict standard is imposed to
obtain a license to charge a psychiatric
emergency hospitalization fee. This
organizational hurdle can be an indicator for the

Journal of Japanese Management Vol.1, No.1, November 2016 ISSN 2189-9592
11
presence of internal control as well as external
control; however, the mechanism of this internal
control is unclear.
6.2. Overall hospital competence as a result of
internal control
On the other hand, the factor “accredited
facility,” which indicates JCQHC approval, can
be an indicator representing the outcome of
hospitals’ activities as well as an indicator of
external control. In Table 2, all hospitals
licensed to charge a psychiatric emergency
hospitalization fee are “accredited facilities”
according to JCQHC. However, not all hospitals
approved by JCQHC have a license to charge
psychiatric emergency hospitalization fee.
Therefore, a license to charge a psychiatric
emergency hospitalization fee is more difficult
to get.
6.3. Relationship between internal and external
control
Official information and data for each
private hospital are too limited, as mentioned
above, and internal control mechanisms and
governance functions are not revealed:
therefore, we cannot help consider the
mechanism of internal control as being
performed in a “black box”. Therefore, indicators
for external controls described above could be a
useful tool for estimating the results of internal
controls.
6.4. Evolution of private psychiatric hospitals
Private “psychiatric hospitals” (in a broad
sense) in Japan were founded after the Second
World War perhaps in response to the public
demand. This can be considered “the initial
state” of the subsequent evolutionary path of
the modern Japanese psychiatric hospital
system. Most private psychiatric hospitals were
founded in the 1950s and 1960s (Kazamatsuri,
2001, p.68). As indicated in Table 1, seven
hospitals were founded in the 1950s and 23 in
the 1960s (in all, opening-year data was
available for 26 hospitals). Thirty hospitals out
of 42 (71%) were founded in the 1950s or 1960s.
As shown in Table 2, six hospitals were founded
in the 1950s, and 12 hospitals in the 1960s (in
all, opening-year data was available for 26
hospitals) Eighteen hospitals out of 26 (69%)
were founded in the 1950s or 1960s.
Figure 4. Evolutional processes under a combination
of internal and external controls, about (1) the
hospital’s clinical competence and (2) the overall
hospital’s competence
Source: Author
The discussions in Sections 5-1, 5-2, and 5-
3 are depicted by Figure 4. Numbers (1) and (2)
in Figure 4 show the systematic evolutional
processes of private psychiatric hospitals in

Journal of Japanese Management Vol.1, No.1, November 2016 ISSN 2189-9592
12
terms of internal and external controls. From an
external perspective, internal control is usually
conducted in a “black box” region because the
data and information are tightly held as
confidential to the institution.
On the other hand, external control, which
is usually performed by regulatory agencies or
the like, is exerted in the presence of available
information. The term of “external control”
shown in (1) and (2) in Figure 4 seems different
from “external control” defined in (Fujioka, 2013,
p.197), but can be an indicator of external
control or official approval from external
regulatory agencies or the like. In this sense, the
system of private psychiatric hospitals has
evolved by strengthening internal controls in
each hospital, and by receiving a license to
and/or official accreditation as excellent
hospitals.
7. Hierarchical formation in terms of clinical
competence
Despite multiple attempts by the author,
previously disclosed data and information
related to the number of regular doctors and
number of psychiatric beds has been elusive to
retrieve, even from disclosure system of the
regulatory agency. Therefore, a cross-sectional
study was conducted to investigate hierarchical
formation of the private psychiatric hospital
system in this study.
Table 4 is modified version of Table 2, in
that the PB/RD Ratio (PB:RD), which is defined
as psychiatric beds per regular doctor, and
PED/PB Ratio (PEB:PB), which is defined as
psychiatric emergency beds per psychiatric bed,
are calculated, and the PB/RD Ratio column
rearranged in ascending order (unnecessary
columns in this section are omitted).
The first, second, and fifth-ranking
hospitals in PB: RD in Table 4 (Hospitals 32, 16,
and 9, respectively) are licensed to charge a
psychiatric emergency hospitalization fee. The
PEB: PB of these hospitals is 0.24, 0.25, and
0.22, respectively. Hospital 8 (Shichiyama) is an
exception because it’s PED: PB is 0.075, which
is much lower than those of the other three
hospitals mentioned above.
Table 4. Psychiatric Beds per Regular Doctor and
Psychiatric Emergency Beds per total bed (PB/RD
ratio and PED/PB ratio, respectively)
Source: This Table is modified from Table 2.
Hospital 8 (Shichiyama) in Table 4 is
located in medical area G in Figure 3. The PB:
RD of Hospital 8 is ranked eighth among all 12
hospitals in medical area G (Table 2), which
means Hospital 8 seems to be an ordinary
private psychiatric hospital. On the other hand,
Hospitals 32, 16, and 9 have top-ranked PB:RD
in their respective medical areas (F, A, and C).
NumberHospitals
(Abbreviation)Medicaldistrict
Regulardoctor(RD)
Psychiatricbeds(PB)
PB/RDRatio
Psychiatricemergency
beds(PEB)
PEB/PBRatio
32 Hannan F 46 690 15 168 0.24
16 Sawa A 30 455 15.2 114 0.25
15 Kouai B 10 221 22.1 0 0
41 Tanpisou E 12 310 25.8 0 0
9 Neyagawa C 10 267 26.7 60 0.22
31 Mikunigaoka F 5 144 28.8 0 0
14 Kosaka D 17 537 31.6 0 0
7 Keihan C 9 306 34 0 0
40 Shinabuyama B 8 273 34.1 0 0
29 Sakamoto D 16 546 34.1 0 0
45 Ozone A 16 557 34.8 0 0
38 Yao D 14 513 36.6 0 0
3 Yoshimura E 6 222 37 0 0
39 Kaede G 4 150 37.5 0 0
44 Hamadera G 20 749 37.5 0 0
2 Kijima G 13 492 37.8 0 0
33 Kokoroa G 11 450 40.9 0 0
34 Izumichuou G 5 206 41.2 0 0
37 Minou A 8 345 43.1 0 0
10 Kaizukachuou G 9 406 45.2 0 0
13 Osakasayama E 6 279 46.5 0 0
20 Ainohanazono A 13 606 46.6 0 0
1 Mizuma G 11 541 49.2 0 0
8 Shichiyama G 13 640 49.2 48 0.075
4 Sakane G 3 150 50 0 0
12 kumeda G 9 494 54.9 0 0
11 Orenji B 3 240 80 0 0
43 Kisen G 3 260 86.7 0 0
27 Kansaisanatoriumu G 2 192 96 0 0
35 Mihara F 5 562 112.4 0 0

Journal of Japanese Management Vol.1, No.1, November 2016 ISSN 2189-9592
13
In this sense, PB:RD=49.2 and PEB:PB=0.075
for Hospital 8 may be an outlier among
Hospitals 32, 16, 9, and 8.
Hospital 16 in Table 2, 3 and 4 is the only
private psychiatric institution licensed as a
Social medical corporation (Shakai Iryou-houjin
in Japanese), which suggests the hospital
undertakes a very high level of public-interest
activity. The system of social medical
corporation was established in 2008 31 . This
system aims to act strongly in the public
interest. The number of social medical
corporations in Osaka, Japan is 31 as of 1 April,
201632.
Hospital 14 in Table 2 and 4 is the only
hospital established by Social Welfare
Corporation (Shakaifukushi-houjin in
Japanese)33. The other hospitals in Table 2 and
4 are established by incorporated medical
institutions.
8. Uneven distribution of psychiatric beds
A working paper No. 352 of the Japan
Medical Association Research Institute
reported the distribution of psychiatric beds in
Osaka (www.jmari.med.or.jp). The reported
deviation value of the number of psychiatric
beds per person for each medical area is shown
in Table 5,. Letters A–H in Table 5 corresponds
Table 5. Uneven distribution of psychiatric beds
Source: This Table is created based on the data in the
website; www.jmari.med.or.jp.
31 http://www.mhlw.go.jp/topics/bukyoku/isei/igyou/
dl/shakaiiryouhouzin1.pdf 32 http://www.mhlw.go.jp/file/06-Seisakujouhou- 10800000-
to the letters in Figure 3, and Tables 3 and 4. In
Table 5, the deviation values were derived based
on the averages and standard deviations in
Japan.
The deviation value of medical area G and
H is significantly high and low, respectively,
which shows the uneven distribution of
psychiatric beds in Osaka, Japan. The causal
factors for situation remain to be investigated,
though the result here is similar to that offered
in the discussion of Table 4. Medical area G
received excessive total psychiatric beds (Table
5), but was not successful in obtaining
psychiatric emergency beds (Table 4).
(3) Conclusion
This study showed that, psychiatric beds as
well as incorporated psychiatric hospitals that
have “a license to charge a psychiatric
emergency hospitalization fee,” are distributed
unevenly among medical areas in Osaka.
On the other hand, a hierarchical structure
of private psychiatric hospitals was observed in
each medical area where an incorporated
psychiatric hospital possessing “a license to
charge a psychiatric emergency hospitalization
fee” is located.
The result of this study might provide a
framework for investigating other types of
hospitals in the absence of internal hospital
data.
A limitation of this study is that the
internal controls utilized in each hospital could
not be discerned because of too limitedly
disclosed data, and that the hierarchical
formation process of incorporated psychiatric
Iseikyoku/0000073016_10.pdf 33 The Ministry of Health, Labor and Welfare:
http://www.mhlw.go.jp/bunya/seikatsuhogo/shakai-
fukushi-jigyou3.html

Journal of Japanese Management Vol.1, No.1, November 2016 ISSN 2189-9592
14
hospitals could not be investigated utilizing
time-series data.
In the future, the process formation of the
psychiatric hospital system remains to be
investigated from an historical viewpoint in
order to reveal the systems influencing Japan’s
medical institutions.
References
Fujioka, Eiji (2013). Iryokikan no Gavanansu to
Kansa (The governance and inspect of
medical institutions). Tokyo: Chuokeizai-
Sha.
Hotta, Kazuhiro (2012). Hi-eirisoshiki no Riron
to Konnichitekikadai (The theories about
nonprofit organizations and current
subjects of research). Tokyo: Maruzen
Publishing.
Kawabuchi, Koichi (2004). Dairokuji Iryohou
kaisei no Pointo to Taiousenryaku (The
points of the 6th revision of the Medical
Care Act, and the strategies for it). Tokyo:
Japan Medical Planning.
Kazamatsuri, Hajime (2001). Wagakuni no
Seishinka-iryou wo Kangaeru (On the
psychiatric medical care in Japan). Tokyo:
Nippon Hyoronsha.
Matsuo, Makoto (2009). Gakushu-suru Byoin
Soshiki (Self-reforming Medical
Institutions). Tokyo: Dobunkan Shuppan.
Matsubara, Yumi, and Tanaka, Shigeru (2004).
Iryou-houjin no gavanansu ni tsuite (On
the governance of incorporated medical
institutions). Tokyo: The ministry of Health,
Labour and Welfare. (http://www.mhlw.go.
jp/topics/bukyoku/isei/igyou/igyoukeiei/ken
toukai/4k)
Takaya, Masahiko (2015). Nihon ni okeru
Byouin-seido no Sinka to Kouekisei ni
Kansuru Kousatsu - Ipanbyouin to
Senmon-i Seido wo Reitoshite - (On
Evolution of Hospital System in Japan and
Public Interest of Japanese Hospitals -
Especially on Regular Hospitals and on
Training for Specialists -). Journal of
Association for Research on NPOBP, Vol.17,
pp.107-120.
- (2016). Iryou-houjin ni okeru gavanansu to
akutibiti -Seishinkabyouin ni okeru
Jishoubunsekijyoron- (The Relationship
between Forms of Governance and Activity
in Incorporated Medical Institutions-
Preliminary Research for Empirical
Analysis of Psychiatric Hospitals-). Journal
of Association for Research on NPOBP,
Vol.18, pp.39-49.
(Received: May 31, 2016)
(Accepted: August 29, 2016)

Journal of Japanese Management Vo.1, No.1, November 2016 ISSN 2189-9592
15
Entrepreneurial Activities and Residential Networks of
Creative Areas in Japan and Korea
Rihyei Kang
Niigata University of Pharmacy and Applied Life Sciences
Japan Creativity Society E-mail: [email protected]
Takahiro Kawaji
Kurume University
Japan Creativity Society E-mail:[email protected]
Abstract
This study surveyed and compared the creative and entrepreneur activities of small-size
local areas in Japan and Korea adopting creative city policies with qualitative analysis. The
result showed that the tolerance of these areas had influence on the entrepreneur activities, and
the strength of social network among citizens had related with the effect of creative city policies.
Along with the findings from the previous studies, this study proposes a new finding that
residential network, which has not been discussed in the original creative city theory, and its
strength could be essential factors affecting success of creative city policy and entrepreneur
activities.
Keywords
Creative city, Entrepreneurship, Residential Networks
(1) Introduction
The theoretical background of creative city
policy can roughly be divided into two streams.
One is based on Landry (1995) and the other is
on Florida (2004). This study is based on the
latter as it is more widely adopted.
As a bearer of modern economy, Florida
pointed out the existence of “creative class,” a
group of people engaged in economic activities
with their creativity as initial capital, and
“creative economy” sustained by them. He
criticized conventional policy which tried to
increase population by inviting large-size
factories, and insisted that local area could
attract creative class, give birth to creative firms,
and finally succeed in regional vitalization
through making its environment attractive for
creative workers. Specifically, he classified
professions such as scientists, artists, designers,
entertainers as “Super Creative Core” and
defined adjacent professions, such as managers,
as “Creative Professions.” People belonging to
these classes exceeded 30 percent of total
population in the United States according to
Florida (Florida, 2004).
Creative industry excels others in
production effectiveness. For example, although
workers of creative industry accounted only four

Journal of Japanese Management Vo.1, No.1, November 2016 ISSN 2189-9592
16
to six percent of the total workforce in the
United Kingdom, its output of about 21 trillion
yen far exceeded that of financial sector
(NESTA, 2004). According to Yoshimoto (2009,
p.42), Japanese creative industry had 250
thousand offices and 2.19 million employees in
2006, which accounted for 4.4% and 4.0% of the
whole offices and employees respectively.
According to the trial calculation of Nomura
(2012, p.23), the output of Japanese creative
industry was 64.4 trillion yen, comparable to
those of agriculture (8 trillion yen), financial
industry (98 trillion yen), steel industry (16
trillion yen), automobile industry (including
parts industry) (42 trillion yen), medical welfare
industry (42 trillion yen). This indicates that
creative industry is one of highly efficient
industries which can produce large output with
small workforce.
Florida (2004) pointed that three Ts - Tech-
nology, Talent and Tolerance - were required in
order to enhance creative economic activities of
these classes. The area with these three
elements were said to be able to bear creativity,
attract creative workers, give birth to creative
firms created by entrepreneurs, and keep
growing regionally.
Figure 1. Florida's 3Ts for Creative City
Source: Florida, 2004
(2) Background in Japan and Korea
Florida’s theory was introduced into Japan
in the beginning of the 21th century, and some
of local governments had adopted it as the
theoretical basis for their policies.
First of all, Kanazawa Association of
Corporate Executives started an international
conference “Kanazawa Creative City Confe-
rence” in 2001. Then Yokohama came to the first
city to adopt creative city policy by establishing
“Creative City Promotion Section” and starting
“Creative City Yokohama” project in 2004.
Sendai, Kobe and some other cities followed
Yokohama, but this movement was mainly
observed in large cities such as ordinance-
designated cities in Japan (Sasaki, 2012).
Japanese Agency for Cultural Affairs
launched “Creative Cities Network Japan” in
2013, which held small-size autonomies such as
Higashikawa town in Hokkaido prefecture
(population 7,800), Nakanojo town in Gunma
prefecture (population 17,000). The Agency
announced that it would promote the creative
city policy even for areas populated below
100,000.
However, most of researches have focused
on large cities, and few of them have discussed
whether this creative city policy model worked
even for a small-size autonomy. Kang and
Kawaji (2015) conducted fieldwork on a
marginal settlement implementing the policy,
and found that although it was effective for
entrepreneur activities and business
performance in the area, unexpected reverse
economic effect was caused by the fact that
regional intolerance drove out immigrated
entrepreneurs and artists from the area.
Creative city policy has been aggressively
pursued in not only Japan but also Korea,
mainly among large to middle cities. For
instance, Incheon city joined UNESCO Creative

Journal of Japanese Management Vo.1, No.1, November 2016 ISSN 2189-9592
17
Cities Network in the field of Craft and Folk Art,
Seoul city did in the field of Design and Jeonju
did in the field of Gastronomy.
In addition to this, Korean government
started to implement creative city policy1.
Figure 2. Creative & innovative cities and supporting
companies in Korea.
Source: Korean Creative Economy & Innovation
Center, 2016.
The government designated eighteen cities
throughout Korea, where leading companies
were designated as implementing entities, and
started “Creative Economy Innovation Center”
project aiming at creation of creative economy
by a policy-driven approach. This is a
mechanism in which each company is
responsible for promotion of creative economy in
the area.
On the contrary to the governmental
approach, there is an area famous for its
1 In President Park Geun-hye’s first press conference in
Jan 6th 2014 after her inauguration. 2 We encountered some of tours from various places, such
as Tottori prefecture in Japan. Many other tours were held
residential approach. That is Seongmisan
Village in Mapo district of Seoul city, where
community development has been led by
residents. They started business such as
theaters, schools and cafes consecutively, and
became popular even among Japanese citizens
engaging in regional vitalization. Related books
were published (Empublic & Nihon Kibou
Seisakujo, 2011) and visiting tours were
conducted in Japan2.
(3) Research
1. Research Question
Creative city policy has come to be
implemented in not only large cities, but also
small-size areas as stated above. Kang and
Kawaji (2015) conducted a survey on a marginal
settlement implementing the policy, and found
the unexpected economic effect caused by the
fact that regional intolerance ousted creative
workers to entrepreneur activities outside the
area. In order to explore the difference between
characteristics specific to the creative city
activities of small-size areas and those of large
cities, we decided to conduct surveys in wider
areas.
Specifically, our objectives are to explore (1)
whether creative city policy is effective even for
small areas, (2) if it is so, how it contributes to
development of the area, (3) what kind of
influence entrepreneur activities receive, by
surveying typical cases of small-size areas
vitalizing communities with creativity (two in
Japan, one in Korea).
2 Research Method
at that time, some of which included “Seongmisan Coope-
rative Visiting Project” by NPO Corporation Akatsuki,
“Let’s go to see, as ‘town development’ in Seoul is awesome”
by Bukasu Do! Regional Revitalization Section.

Journal of Japanese Management Vo.1, No.1, November 2016 ISSN 2189-9592
18
We adopted qualitative approach for small
areas vitalizing communities using creativity.
Specifically, we visited related facilities and
interviewed policy makers. The interviews were
recorded, converted into text, and analyzed with
SCAT 4-step coding method (Otani, 2007).
The surveyed areas were Yanedan district
in Kanoya city, Kagoshima prefecture
(conducted in 2014), central area of Kurume city,
Fukuoka prefecture (2015), and Seongmisan
Village in Mapo district of Seoul city, Korea
(2016).
Figure 3. Creative cities in Japan and Korea
Source: Prepared by authors.
Let us explain the reason why these areas
were chosen. There are four research fields
regarding creative cities (Table 1), large city
with population decreasing, large city with
population increasing, small area with
population decreasing, and small area with
population increasing.
For large creative cities (with population
around more than 0.5 million), there are various
reports already. For example, City of Yokohama
and Suzuki (2010, p.130-231) summarized
characteristics of twelve creative cities, and
Kang (2013) studied Sendai and Kobe cities.
For small creative areas, there are few
studies conducted at this point, but the study of
small area with population decreasing could
mislead us to the problem of depopulation. Thus
we excluded this field and concentrated on
“creative small area with population increasing,”
and selected three typical areas, Yanedan,
Kurume city and Seongmisan Village. They are
not only small size population increasing areas,
but also famous for creative activities. Yanedan
has its own source of income based on its
creative regional management philosophy
(Toyoshige, 2004). Creative regional economic
activities of Kurume city are supported by
entrepreneurs (Kawaji et al., 2016, p.1-4).
Seongmisan Village has built its local
infrastructure from the point of building
resident associations (Empublic & Nihon Kibou
Seisakujo, 2011, pp.40-45).
Table 1. Creative city research matrix
Population Large City Small Area
Decreasing Kobe Depopulation
Increasing Yokohama
Sendai Not studied
(4) Results
1. Yanedan district
Yanedan district is a small settlement in
Kanoya city, Kagoshima prefecture. It had
about three hundred residents and aging rate of
over 30 percent in 2015. It had carried out
aggressive reforms (starting town businesses
producing and selling Shochu (Japanese
traditional white liquor), selling deodorants,
etc.) since Mr. T (age 75) was installed as a
president of a residents' association.

Journal of Japanese Management Vo.1, No.1, November 2016 ISSN 2189-9592
19
Table 2. Concepts extracted from interviews (Yanedan district)
Source: Prepared by authors.
The reform was successful and its
residential internal revenue sources totaled to
be over five million yen, which made it possible
to distribute bonus of ten thousand yen to each
of one hundred twenty two households.
An artists invitation project had been
started since 2006, aiming at enhancing
cultural level of the area by letting artists live
vacant houses with low rent fee. Houses of
immigrated artists were named as Geihinkan
(VIP guest house), galleries reformed from
vacant houses were scattered around the
district, and an art festival was held once a year.
We interviewed Mr. T and all artists living in
the district at the time of survey. The
interviewed contents were converted into text,
coded, and reconstructed by concepts (Table 2).
The table indicates the creative city policy
in the area caused discontent, dissonance and
disagreement on future direction in both sides
of residents and artists.
Residents had little interest in creativity of
artists or enhancement of regional creativity.
On the other hand, artists suffered from such
indifference, had difficulty in adapting
themselves to old conventions in the area, and
were apt to disconnect from association with
local residents. Tolerance of the area was at the
worst level, which made the artists discontent.
As a result, the artists got out of the district
to outside area and achieved good performance
by actively engaging in entrepreneur activities
with firms and organizations there. This made
the district lose some of the outcome of creative
economy, but they still could establish its brand
as “village of artists.” Thus both of residents and
artists accomplished part of their objectives.
In contrast to this, one of the essential
objectives of creative city policy, “development of
regional creativity,” was not observed in the
area, whereas it was active outside the area.
Judging from this finding, we confirmed that a
creative economy model was effective even for
small-size autonomies, but the largest inhibitor
was tolerance.
Interviewee T A B C D E
Concepts
70s
Male
President of
a residents'
association
40s
Male
Photo
Design
30s
Female
Grass
Sculpture
30s
Male
Painting
60s
Male
Bronze
Sculpture
60s
Male
Ceramics
Enhancing creativity
of the area ++ - - -- -- +
Enhancing creativity
of his/her own - -- - +++ - -
Enhancing skills
of his/her own N/A +++ ++ +++ ++ +
Tolerance of the area ++ --- --- --- --- --
Entrepreneur activities
in the area ++ + - - - +
Entrepreneur activities outside
the area N/A +++ - +++ +++ +
Willing to live continuously +++ --- --- --- --- +
Total Valuation +++ ++ ++ +++ ++ ++

Journal of Japanese Management Vo.1, No.1, November 2016 ISSN 2189-9592
20
2. Central area of Kurume City
Kurume city is a core city holding thirty
million people, and one of few cities with
increasing population in Japan. Nishinippon
Shinbun (2014) listed three reasons for the
increase as follows; (1) low house acquiring cost,
(2) reliable medical system, (3) increased
employment by local firms, which reduced
draining out of young workforce.
For promoting creative activities in city,
Kurume city invited Ms. Yuko Yamashita to
Highmart Kurume, a third sector company. She
was a regional vitalization producer and
succeeded in promoting creative activities in
urban areas such as Toyama city (Yamashita,
2013). Under her planning and guidance, we
conducted non-structured interviews to
residents involving creative activities in
Kurume city. Note that we moved from place to
place on foot, indicating that creative activities
were carried out within walkable distance.
Subjects were Ms. Yuko Yamashita
(indicated as Mr. Y), Mr. F, a designer/producer
of Kurume Kasuri (a traditional splashed
textile), Mr. G, a Kurume Kasuri wholesaler
and a cheap sweet shop owner, Mr. H, a video
creator, Mr. I, a business conductor, and Mr. J, a
real estate renovator. All of them were
managers, as young as their thirties, had
territorial relation-ship, and engaged in
entrepreneur activities.
Most of interviewees started their
businesses after working or studying outside
Kurume city. All of them strongly respected Ms.
Yamashita, and stated that she brought weak
ties into strong territorial and blood ties of
Kurume, which had influenced on their creative
activities at that time.
Yamashita said “my job is to connect person
with person.” According to Mr. I, each subject
engaged in a job which he/she believed to realize
his/her “belief” and worked separately before
she came to Kurume. They tried to vitalize the
area using various methods, but such trials
were not successful. One of the reasons could be
lack of connection among them. “We knew each
other’s face, but that is all.”
After meeting at an event held by city
government and noticing this problem, they
started “Wisdom Connection Project,”
(Yamashita, 2015, p.18) in which participants
connected their pieces of wisdom. “It did not
come out in a good shape actually” (Yamashita,
2015, p.17) at first, but “Wisdom such as vision,
idea, network in each area began to connect
each other” (Yamashita, 2015, p.21) after
finding that “there are many active people!”
(Yamashita, 2015, p.19) in each area of Kurume
city according to Yamashita.
In general, the eager activity gets, the
stronger human relation gets. Such tendency is
strong in local cities, where territorial, blood and
educational relation-ships temper the tendency.
Under such situation, Yamashita succeeded
in not only connecting people, but also bringing
many points connecting Kurume residents and
outside people. For example, she invited Ms.
Tomsuma Alternative, who is a contemporary
art performer, from Toyama prefecture in “2016
Wisdom Connection Lecture” held in Feb 2016.
By asking her to explain cases and information
nothing to do with Kurume, she tried to break
firm relationships in the area. She continues
this kind of activities, which are thought to
bring weak ties into the area.
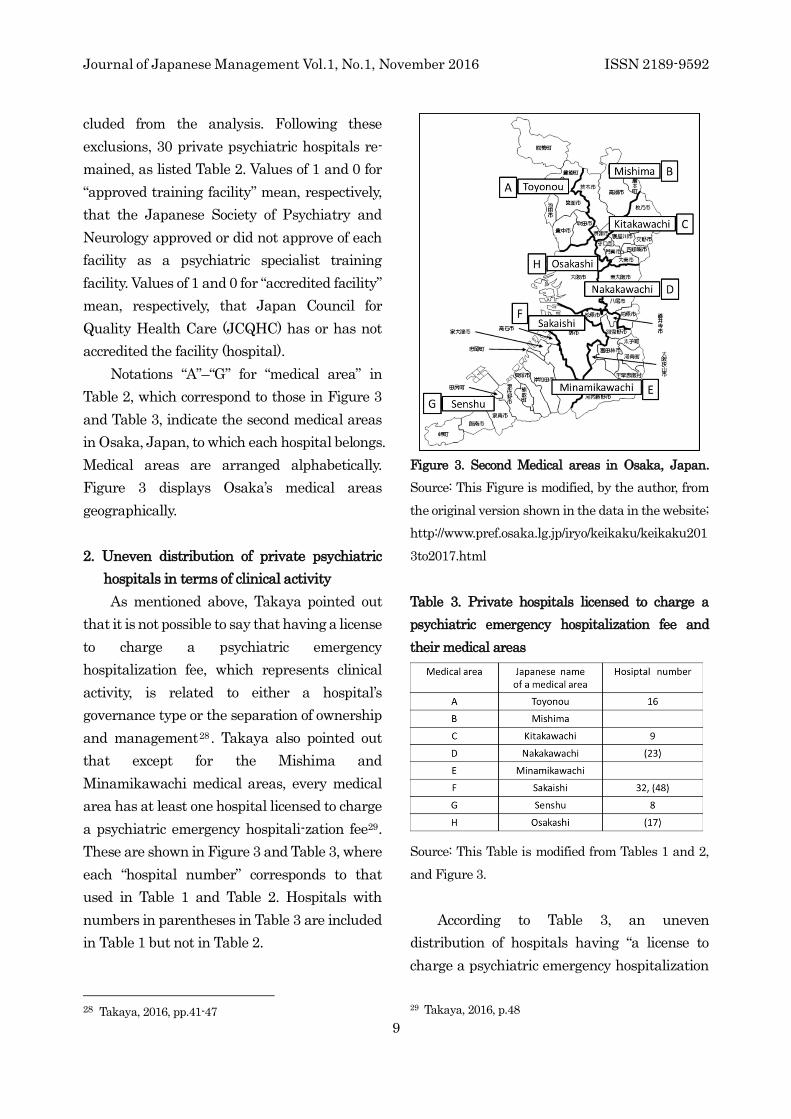
3. Seongmisan Village in Mapo District of
Seoul, Korea
Journal of Japanese Management Vo.1, No.1, November 2016 ISSN 2189-9592
21
Table 3. Concepts extracted from interviews (Kurume city)
Source: prepared by authors
A part of residential area adjacent to
downtown Seoul is known as Seongmisan
Village. Twenty-five households began to
connect each other and engaged in regional
activities, taking the opportunity of building a
nursery by themselves. They have continuously
engaged in entrepreneur activities, making the
area known as a creative activity area.
Today,residents there run cooperatives,
restaurants, groceries, cafes, theaters and so on
by themselves.
The area holds around 0.1 million residents.
Two thousand citizens partici-pate in regional
activities, of which ten percent live outside the
area (Empublic & Nihon Kibou Seisakujo, 2011).
We interviewed Mr. S, a leader of
residential activities of Seongmisan Village,
visited facilities in the area, and conducted a
literature survey in March 2016. The result is
shown in Table 4.
The residents in Seongmisan Village do not
receive any public fund, and engage in creative
activities with their own funds. Mr. S told that
“we came to know that housewives usually have
secret savings of ten million won (US$ 10,000)
or so.” Actually, most investors participating in
entrepreneur projects invested around ten
million won to cooperatives, restaurants,
groceries, cafes or theaters.
The environment of these residential
businesses is, however, harsh. One of the
difficulties is specific to Korean lease contract,
in which rent increases each time of renewal.
“Rent rises more than twice, making us hard to
continue business,” said Mr. S. Despite of it,
more than twenty businesses have started by
residents for more than twenty years, indicating
their competency in entrepreneurship.
As stated earlier, not all of residents
participate in these creative or entrepreneur
activities. 1.8 thousand of 0.1 million residents
participate, meaning that a participation ration
is only 1.8 percent. Moreover, people living
outside can also participate them. Thus,
although these activities are strongly related to
the area, they can be regarded as being
Interviewee Y F G H I J
Concepts
40s
Female
Regional
activation
Coordinator
30s
Female
Textile
Design
30s
Male
Textile
Shop
30s
Male
Video
Artist
30s
Male
Share
Office
Business
30s
Male
Rental
House
Business
Entrepreneurial
Environment ++ ++ + +++ +++ +++
Experience outside
Kurume +++ ++ — +++ ++ +
Business Performance —— + ++ + + +
Willingness to make
regional contribution ++ +++ +++ +++ +++ +++
References to Strong
Network +++ ++ ++ ++ +++ ++
References to Weak
Network +++ ++ ++ ++ +++ ++
Respect to Yamashita N/A +++ +++ +++ +++ +++

Journal of Japanese Management Vo.1, No.1, November 2016 ISSN 2189-9592
22
supported by weak ties, which hold residents
together with shared wishes such as “I want to
protect regional environment,” “I want to stick
to my own lifestyle.”
However, there were not only weak ties but
also strong ties, connecting entrepreneurs who
have strong and clear will of “want to start my
business,” “want to be successful in business” in
specific fields.
Table 4. Concepts extracted from an interview and literature (Seongmisan Village)
Concepts S Articles & Fieldworks
40s
Female
Books, Thesis
Visiting, Observation etc.
Entrepreneurial environment ++ ++
Spontaneous creative activities ++ +++
Business performance — +
Willingness to make regional contribution ++ ++
References to strong network +++ ++
References to weak network +++ ++
Source: Prepared by authors.
(5) Discussion
Viewing from the aspect of theory of
“strength of weak ties” (Granovetter, 1973), both
of weak and strong ties had influence on
creative and entrepreneur activities in three
cases described in this research.
“The strength of weak ties” is a theory
addressing that information of high novelty and
value can be obtained more from weakly
connected network (weak ties), such as “friend’s
friend,” than from strongly connected network
(strong ties), such as blood or territory relation.
This theory implies that weak ties enhance
exchange of information of high novelty and
value, thus stimulate creative and entrepreneur
activities.
In Yanedan district, artists invited from
outside felt intolerance to strong regional ties,
and sought weak ties outside the district.
Consequently, the entrepreneur activities were
vitalized and content level of immigrated artists
increased.
In Kurume city, although activities and
relationships restricted inside the area had a
limitation (they tend to become strong ties),
thanks to the construction of connections among
people spatially separated by Mr. Y, human
relations with weak ties among them were
successfully formed. This type of network exerts
powerful influence of exchanging useful and
novel information, which is not visible from
inside of network with strong ties.
In Seongmisan Village, strong ties aiming
at starting business together were naturally
spawned among people tied weakly. This
mixture of weak and strong ties was observed to
vitalize the area.
Weak ties bridge gap between strong ties,
and play an important role in conveying
valuable information. This study thinks that a
mixture of weak and strong ties facilitates
communication and vitalizes creative and
entrepreneur activities.
The previous studies of creative cities have
not put much emphasis on the connection
among residents so far. For example, Florida

Journal of Japanese Management Vo.1, No.1, November 2016 ISSN 2189-9592
23
(2004, 2005) insisted that creative workers
gathered to the area naturally as the level of
regional creativity increased, regardless of blood
or territorial relationship.
Our results, however, cast a doubt on it, as
connection among residents is found to be an
important factor affecting creative activities.
Some studies also reported the similar
results. An international research team of EU
committee (ACRE project) conducted a
questionnaire survey on thirteen creative cities
in EU (Martin-Brelot et al., 2010). Their result
showed that creative workers’ willingness to
live in creative cities was much more strongly
affected by personal connections (such as family
members or friends live in the same cities, or
close places) than working environment. This
fact was inconsistent with the widely accepted
theory that good working environment with
sufficient tolerance attracted creative workers.
Their and our findings jointly indicate that
residential network might be essential for
creative activities, and research on it should be
promoted.
Kang (2013) surveyed three advanced cities
implementing creative city policy Sendai,
Yokohama and Kobe in Japan, and pointed out
that although these cities helped creative
workers by offering abandoned facilities, such
help might hinder spontaneous development of
creativity.
Creative economy theory originally states
that creative environment develops and attracts
creative works naturally without public support.
This statement and our findings suggest that
not only public support of facility or fund, but
also policy aiming at bringing strong and weak
ties to residents might enhance spontaneous
creative activities when adopting creative city
theory.
Although we made some contribution to
creative studies, our findings should not be
generalized as they are based on the surveys in
limited areas and time interval. To be
specifically, we focused on small population
growing areas in Japan and Korea, where
creative activities were observed (Table 1). Let us
summarize the space and time boundary
conditions of our study as follows:
a. Part of Eastern Asia centered in Japan and
Korea.
b. Area where creative economic activities can
be observed.
c. Not large region, but small area.
d. Not population decreasing, but increasing
area.
e. At the time from Dec. 2013 to Mar. 2016,
when our surveys were conducted.
(6) Conclusion
This research found out three important
facts.
a. In Yanedan district, immigrants engaging
creative activities escaped from strong ties
of old residents, and sought for weak ties
outside the district.
b. In central area of Kurume city, a producer
invited from outside brought weak ties and
creativity from outside.
c. In Seongmisan Village, regional active-ties
were supported by weak ties among
residents as they were started as
volunteers’ weak connections. Note that
some activities, such as starting a business
with joint investment, could be supported
by strong ties.
Judging from these three findings, we
Journal of Japanese Management Vo.1, No.1, November 2016 ISSN 2189-9592
24
concluded that when implementing creative city
policy in small-scale area, two points should be
considered.
a. Social tie is one of the required components
(both of strong and weak ties are
important).
b. Weak tie is necessary for creative city policy.
The previous study of creative cities had
seldom focused on residential network, and
Florida’s creative city/economy theory insisted
that creative workers migrate among cities
looking for talent, skills, and tolerance without
minding such network. Our findings and
Martin-Brelot et al. (2010), however, cast doubt
on such a simple view.
Our findings imply that strong and weak
ties of residential network interact each other,
and exert influence on will of living and creative
activities of creative workers. The underlain
mechanism is, however, unknown. Further
research is needed for clarifying processes and
variables in it. Moreover, the way of building
these ties should be studied.
One way of approach to this problem could
be management resource needed for starting
creative or business activities. That is, by
scrutinizing benefits of strong/ weak ties which
vary from resource to resource, we may clarify
the processes where these ties exert influence on
the activities. For example, the benefit of strong
ties on human resource when starting the
activities may be “obtaining core management
staff” since they are glued with strong ties. On
the other hand, that of weak ties could be
“obtaining various talents” as they come from
weakly tied human network. Thus, we may
infer that both of strong/weak ties play
important roles in the process of obtaining
human resource, but with different approaches.
Another approach is society type theory,
Gemeinschaft and Gesellschaft. Gemeinschaft
means a community where its members are
strongly connected with territorial and blood
ties, while Gesellschaft is an association where
its members are weakly connected with benefits
or contracts. The former often refers to a pre-
modern society where people gather on
community events, while the latter to a modern
global society where people communicate with
SNS. By linking weak/strong tie theory with
Gesellschaft- Gemeinschaft theory, we may
approach to the problem of building ties. For
example, we may say that community activities
are effective for building strong ties in
Gemeinshaft while SNS are beneficial for weak
ties in Gesellschaft.
Acknowledgment
This research was kindly assisted by policy
makers and staff of related organizations and
facilities of Sendai city, Yokohama city and Kobe
city. Specifically, the survey in Sendai city was
assisted by the guidance and cooperation from
Kenichi Sato, a professor of University of
Electronic Communications. The survey in
Yanedan district was kindly helped by residents
and Ms. Rie Kurose, a businesswoman living in
Kanoya city. We deeply appreciate their
cooperation.
Reference
City of Yokohama, and Suzuki, Nobuyoshi (Ed.)
(2010). Sozosei ga Toshi wo Kaeru (The
Creativity Changes the Cities), Kyoto:
Gakugei Shuppan Sha.
Empublic and Nihon Kibou Seisakujo (2011).
Machi no Kigyou ga Dondon Umareru
Journal of Japanese Management Vo.1, No.1, November 2016 ISSN 2189-9592
25
Komyunityi (Community where Town
Business Starts out One after Another),
Tokyo: Nihon Kibou Seisakujo.
Florida, R. (2004). The rise of the creative class.
New York: Basic books.
― (2005). The flight of the creative class. New
York: Harper Business.
Granovetter, M. (1973). The Strength of Weak
Ties, American Journal of Sociology, Vol. 78,
Issue 6, pp.1360-1380.
Kang, R. (2013). 10nen me no kurieitibu siti:
Sendai, Yokohama, Kobe no jirei kara,(The
10th Creativi Cities: Sendai, Yokohama and
Kobe cases), Proceedings of The 35th Annual
Conference of Japan Creativity Society,
pp.119-122.
Kang, R., and Kawaji, T. (2015). A Qualitative
Study to Explore the Difference Between
Creative Cities and a Village in Japan,
Proceedings of The 10th International
Conference on Knowledge, Information and
Creativity Support Systems (KICSS2015),
pp. 265-274
Kawaji, T., Kang, R., and Park, J. (2016).
Creative Economic Activities and Citizen
Network in Kurume City, Proceedings of the
1st Conference of West Japan Branch of
Japan Creativity Society, pp.1-4.
Martin-Brelot, H., Grossetti, M., Eckert, D.,
Gritsai, O., and Kovacs, Z. (2010). The
spatial mobility of the ‘creative class’, A
European perspective. International
Journal of Urban and Regional Research,
34(4), pp.854-870.
National Endowment for Science, Technology
and the Arts (NESTA) (2004). Creating
value: How the UK can invest in new
creative businesses.
Nishinippon Shinbun (2014). Kurumeshi no
Jinkou, Irei no 13 kagetsu Renzokuzou, Ima
Naze? (Population of Kurume city,
Unordinary 13 Months Continuously
Increase, Why Now?). qBiz, Nishinippon
Shinbun Digital Version, May 26th 2014,
http://qbiz.jp/article/38474/1/ (viewed March
13th 2016).
Nomura Research Institute (2012). Heisei 23
Nendoban - Chitekizaisanken Wahkingu
Gurupu nado Shingaitaisaku Kyoukajigyou
Houkokusho (Heisei 23 Financial Year
Version - Report of Enhancing Preventive
Measures Business against Invasion such
as Working Group of Intellectual Property
Right). Tokyo: Nomura Research Institute.
Official Statistics of Japan. The 2015 Population
and Housing Census (Preliminary report),
http://www.e-stat.go.jp/SG1/estat/GL08020
103.do?_toGL08020103_&tclassID=000001
068779&cycleCode=0&requestSender=sea
rch (viewed August 16th 2016).
Sasaki, Masayuki (2012). Souzoutoshi he no
Chousen – Sangyou to Bunka no Ikiduku
Machi he (Challenge to Creative City –
Towards a City where Industry and Culture
are Thriving). Tokyo: Iwanami Gendai
Bunko.
Sendai City. Estimate of the Population ,
www.city.sendai.jp/kikaku/seisaku/toukei/ji
nkou/graph1.html (viewed August 12th
2016).
Toyoshige, Tetsuro (2004). Chiiki Saisei
(Regional Revitalization). Kagoshima:
Asantesana.
Yamashita, Yuko (2013). Nigiwai no Ba, Toyama
Gurando Puraza: Kadouritsu 100% no
Kokyo Kuukan no Tsukurikata (Field of
Bustling, Toyama Grand Plaza: How to
Make Public Space with 100% Operation

Journal of Japanese Management Vo.1, No.1, November 2016 ISSN 2189-9592
26
Rate). Tokyo: Gakugei Shuppan sha.
― (2015). Sozo toshi teki katudou Kurume-hen
(Creative City Kurume). Power Point
Document.
Yoshimoto, Mitsuhiro (2009). Souzou-sangyou
no Chouryuu 2: Tokusei ga Kiwadatsu
Seireishiteitoshi (Stream of Creative
industry 2: Ordinance-Designated Cities
with Outstanding Characteristics). NLI
Research Institute Report, 2009, pp.40-47.
(Received: May 31, 2016)
(Accepted: September 1, 2016)
Journal of Japanese Management Vol.1, No.1, November 2016 ISSN 2189-9592
27
Impacts of Overtime Reduction on Psychological Well-Being
for Japanese Research and Development Engineers:
Positive and Negative Sides of Work Time Regulations
Tetsushi Fujimoto
Doshisha University, Japan
The Japanese Association of Administrative Science
Hideki S. Tanaka
Aomori Public University, Japan
Japan Society of Human Resource Management
Shiming Xia
Doshisha University, Japan
The Japanese Association of Administrative Science
Abstract
In recent years, Japanese employers increasingly impose restrictions on employees’ work time.
Reduced overtime work has impacted a large number of engineers employed in private firms,
making it more difficult to put in extra hours to complete their work. As a result, the incidences of
experiencing incompletion and non-accomplishment in work have grown among Japanese engineers.
This study investigates whether and how the overtime reduction affects engineers’ work experiences
and their psychological well-being. Results show that intensification in overtime reduction
negatively affects engineers’ work experiences regardless of their managerial status. It increases
their job demands and unfinished work, while it reduces their workplace communication.
Furthermore, overtime reduction is likely to deteriorate engineers’ psychological well-being.
Reduced overtime exhibited negative indirect influence on their work engagement and mental
health via increased demands and reduced communication. Findings suggest that managing
overtime work is an important aspect of human resource management of engineers, and it is
imperative that we recognize immoderate work time regulations may bring about unintended
negative consequences in engineers’ work.
Keywords
overtime reduction, engineers, work engagement, depression, Japan

Journal of Japanese Management Vol.1, No.1, November 2016 ISSN 2189-9592
28
(1) Introduction
Long hours of work have been regarded for
many years as an important characteristic of
Japanese work lives (cf. Kuroda & Yamamoto,
2012; Ogura, 2007). It is officially reported that
the annual work hours in Japan between 1999
and 2009 were over 1800 hours, and that the
average annual hours worked exceeded 2,000
hours1 in several years during this period (See
Table1; Ministry of Health, Labour and Welfare,
2011). Full-time employees in Japan worked
approximately 2000 hours per year, and this
was 400 hours longer than the hours their
counterparts in Germany and France worked
(The Japan News, 2012).
Japanese employers, however, started to
cut back on the hours of employees’ overtime
work soon after the financial crisis hit the
economy in 2008 (See Table 1). Employer’s
restriction of overtime work has impacted a
large number of R&D engineers employed in
private firms, making it increasingly difficult for
them to put in extra hours in work. As a result,
the incidences of experiencing incompletion and
non-accomplishment in work grew among
Japanese engineers.
Japan is an island country with limited
natural resources, so that innovative,
technological contributions that R&D engineers
make are a crucial requisite for Japan’s
economic development. In order to elicit their
continued contributions, it is important to look
carefully at R&D engineers’ work conditions.
Up till today, a limited number of studies
have explored the psychological experiences of
R&D engineers in Japan. Fujimoto and Nakata
(2007) reported that Japanese engineers’
motivation had declined between 1994 and 2005.
They found that the negative effect of
dissatisfaction with HRM on work motivation
1 The average annual hours of work between 2002 and
had become exacerbated during the 9 years
between 1994 and 2005. Such results imply that
Japanese R&D engineers’ psychological well-
being may have deteriorated during the past
two decades. Psychological well-being is
conceptualized as a combination of positive
affective states such as happiness (the hedonic
element) and functioning with optimal
effectiveness in individual and social life (the
eudaimonic element) (Deci & Ryan, 2008).
Huppert (2009) claims that psychological well-
being is about lives going well, and it is the
combination of feeling good and functioning
effectively. Based on Schaufeli & Bakker (2004),
we view engagement in work and mental health
as two important factors of psychological well-
being. While we believe that “living well” is
important to all people regardless of occupations,
it is highly likely that well-being is an important
psychological resource which enables R&D
engineers’ creative performance at work. Yet,
only a limited attention has been paid to this
day to the Japanese R&D engineers’
psychological well-being in relation to the
circumstances of their employment.
The purpose of this study is to investigate how
the intensified reduction of overtime work in
Japanese firms after the financial crisis in 2008
affected R&D engineers’ work experiences and
their psychological well-being. Specifically, we
address the following research questions: (1)
Does reduction in overtime work increase
Japanese engineers’ job demands and decrease
their workplace communication? If so, does it
exert stronger impacts on managerial engineers
than on non-managerial engineers? (2) Does
overtime reduction deteriorate engineers’ work
engagement and mental health? If so, does it
exert an indirect influence on them via
increased job demands and decreased
2007 exceeded 2000 hours. In 2007, the average reached
2033 hours.

Journal of Japanese Management Vol.1, No.1, November 2016 ISSN 2189-9592
29
communication, or does it exert direct impacts
on them?
This paper is organized in the following order.
First, we overview the situations surrounding
engineers’ work in Japan, and we briefly review
our theoretical framework and analytic model.
Then, we provide details of our method and
report the results of statistical analysis. Finally,
we discuss our findings and conclude this paper
by indicating the direction for future research.
Table 1. Changes in Annual Work Hours between 1999 and 2009
Year
Average of Official
Work Hours
Average of Actual
Work Hours
Average of Overtime
Work Hours
1999 1834 1990 156
2000 1835 1999 164
2001 1835 1990 155
2002 1836 2000 164
2003 1843 2016 173
2004 1836 2015 179
2005 1832 2012 180
2006 1837 2024 187
2007 1841 2033 192
2008 1820 1996 176
2009 1807 1972 165
Source: Ministry of Health, Labour and Welfare (2011)
Note: The survey was conducted among full-time employees in Japan.
(2) Backgrounds
1. Work Hours in Japan
In Japan, the importance of work-life
balance is increasingly recognized by employers
and employees, as well as the government. Most
of the past research on work-life balance evolved
around the key issue of how to reduce long hours
of work in order to ensure sufficient time for
private life. Needless to say, regulating long
hours of work is important to improve workers’
well-being. In this sense, it is probably true that
overtime restriction in and of itself is a blessing
for a majority of Japanese workers.
A cross-national comparison of the average
annual hours actually worked by employees
2 This comparison included both full-time and part-time
workers.
shows that Japan is not the only country with
long hours of work, but workers in Japan, U.S.
and Korea work equally long hours 2 (Japan
Institute for Labour Policy and Training
[JILPT], 2013)3. In addition, the proportion of
employees who work more than 60 hours per
week is over 10 percent in Japan (Ministry of
Internal Affairs and Communications, 2013),
and the proportion of those who put in long
hours of work is not only larger compared with
other industrialized nations but is also as large
as in other developing countries (Ogura, 2008).
The average annual hours of overtime for
Japanese workers between 2006 and 2008
(before the financial crisis) exceeded 180 hours.
3 Note that there are differences in the ways work hours are
defined between OECD countries (JILPT, 2013; Ogura,
2008).

Journal of Japanese Management Vol.1, No.1, November 2016 ISSN 2189-9592
30
Also, Research Institute for Advancement of
Living Standards (2009) pointed that the
average daily hours of overtime for Japanese
workers, especially men, exceeded 100 minutes.
Note that this number does not include hours of
unpaid overtime, or so-called “service overtime.”
Therefore, if we are to include those hours,
overtime work for Japanese workers will
become even longer.
Historically, overtime work has been an
integral part of Japanese management, and this
“structured overtime” is one of the
characteristics of the management in Japan.
While firms are to pay extra to employees who
work overtime,4 Japanese employers in many
cases load their employees with an amount of
work that easily exceeds what an employee can
handle within standard work hours (Sato, 2008).
Japanese employers tend to view this mismatch
necessary since it allows them to adjust flexibly
the volume of work without firing employees
during the time of recession. This mismatch is
one of the important background factors that
sustained Japanese long-term employment,
and both employers and employees tacitly agree
to maintain the system. However, just after the
financial crisis in 2008, most Japanese
employers started to impose restrictions on
overtime work in order to reduce labor costs. A
survey on Japanese employers’ employment
adjustment practices between 2009 and 2011
revealed that, followed by a temporary
suspension of business and layoff,
approximately 30% of Japanese enterprises
regulated overtime work after the financial
crisis (JILPT, 2014). In this survey, 42.1% of
4 As a common practice in Japan, employees in managerial
positions are treated as exempt. However, “the level and
timing of assigning employees as exempt vary among firms
depending on their own long standing practices” (Kuroda &
Yamamoto, 2012, pp.252). 5 Discretionary labor system is an example of the flexible
work hour system, and it is designed to allow employees in
certain designated jobs to decide on how they utilize their
Japanese respondent firms reduced overtime
work in 2008 (immediately after the financial
crisis), and 34.7% in 2009 (See Table 2; JILPT,
2014). Due to this employer reduction of
overtime, work hours for Japanese employees,
including R&D engineers, were significantly cut
down.
2. Changes in Japanese R&D Engineers’ Work
Intensification in employer reduction of
overtime after the financial crisis has caused
unexpected problems in Japanese engineering
workplaces. An earlier interview research
conducted in Japanese manufacturing firms
reported that engineers underwent a serious
time shortage due to the overtime reduction,
and as a result the incidences of experiencing
incompletion/ non-accomplishment in work
were growing among them (Fujimoto,
Shinohara, Tanaka, & Nakata, 2013). In
addition, managerial engineers and team
leaders, who normally worked in discretionary
labor system5, were likely to be left with the job
tasks that their subordinates could not complete
within standard hours, so that the total amount
of their work significantly increased, and more
time pressure and stress were added on them.
In general, reduced overtime may be a
blessing for workers. However, Fujimoto et al.
(2013) pointed out that due to the intensified
overtime reduction after the crisis a large
number of Japanese employees, R&D engineers
in particular, became increasingly unable to put
in sufficient amount of time in work. Findings
in this study showed that reduction of R&D
engineers’ work hours had a significant negative
time when trying to accomplish their work. Research and
development is one of the “professional services” jobs
designated in the discretionary labor system. In addition,
managers’ work hours are usually not regulated by Japan’s
Labor Standards Act.

Journal of Japanese Management Vol.1, No.1, November 2016 ISSN 2189-9592
31
impact on the sense of accomplishment for
Japanese engineers.
These results imply that reduction of
overtime may carry a connotation for R&D for
engineers different from what we typically
believe about reducing workers’ overtime.
Table 2. Employment Adjustment Practices between 2008 and 2011 in Japan
Year 2008 2009 2010 2011
Total Number of respondent companies N
%
974
100.0
2,108
100.0
1,997
100.0
1,913
100.0
Cutback in Overtime Work N
%
410
42.1
731
34.7
591
29.6
529
27.7
Standstill/Reduction of Employment of
New School Leavers
N
%
203
20.8
344
16.3
337
16.9
309
16.2
Standstill/Reduction of Mid-Career
Recruitment
N
%
231
23.7
377
17.9
317
15.9
276
14.4
Temporary Suspension of Business and
Layoff (Daily)
N
%
477
49.0
1,499
71.1
1,342
67.2
1,281
67.0
Temporary Suspension of Business and
Layoff (Hourly)
N
%
154
15.8
379
18.0
373
18.7
406
21.2
Source: JILPT (2014), p.60.
Note: Numbers in the table represent multiple responses.
(3) Theoretical Framework
Our main focus in this study is whether and
how overtime reduction affects Japanese
engineers’ work experiences and their
psychological well-being. We explore how
reduced overtime influences engineers’ job
demands, unfinished work and workplace
communication, and then how these in turn
affect their work engagement and depression.
We draw on the job demands-resources model to
framework these relationships among Japanese
R&D engineers.
1. Job Demands-Resources Model
Job demands-resources (JD-R) model
(Demerouti, Bakker, Nachreiner & Shaufeli,
2001) focuses on two types of work conditions,
i.e., job demands and job resources. Job
demands refer to “characteristics of the job that
potentially evoke strain, in case they exceed the
employee’s adaptive capability” (Bakker,
Hakanen, Demerouti & Xanthopoulou, 2007).
Specifically, job demands are “physical, social,
or organizational aspects of the job that
require sustained physical and/or psychological
effort on the part of the employee, and are
therefore associated with certain physiological
and/or psychological costs” (Demerouti, Bakker,
Nachreiner & Shaufeli, 2001). Examples of job
demands include work pressure (including time
pressure), emotional demands, adverse physical
work environment, role ambiguity, role conflicts
and overload.
Job resources, on the other hand, refer to
work conditions that provide supportive means
for employees when trying to accomplish their
work. Specifically, job resources are “physical,
psychological, social, or organizational aspects
of the job that may (a) reduce job demands and
the associated physiological and psychological

Journal of Japanese Management Vol.1, No.1, November 2016 ISSN 2189-9592
32
costs, (b) are functional in achieving work goals,
and (c) stimulate personal growth, learning and
development” (Demerouti, Bakker, Nachreiner
& Shaufeli, 2001). Job resources may be located
in several different levels, including
organization (e.g., salary, career opportunities,
job security), inter-personal (e.g., supervisor and
co-worker support), organization of work (e.g.,
role clarity, participation in decision-making),
and task (e.g., performance feedback, skill
variety, autonomy) (Bakker, Demerouti &
Verbeke, 2004).
Generally, past research suggests that job
demands and resources are negatively related
to each other, because high demands are likely
to prevent the mobilization of job resources, and
availability of job resources are likely to reduce
job demands (Bakker and Demerouti, 2007).
JD-R model suggests that an increase in job
demands and a decrease in job resources may
deteriorate individuals’ psychological well-being
and reduce their work engagement.
Work engagement is defined as a positive
work-related state of mind that is characterized
by vigor, dedication and absorption (Shaufeli et
al., 2002). Since vigor and dedication are
considered as a reverse condition of exhaustion
and cynicism, engagement is assumed to be
negatively related to burnout (Shimazu et al.,
2008). As Schaufeli et al. (2006) stress, work
engagement and depression are negatively
related, and engagement in work ameliorates
individual mental health.
2. Analytic Model
The JD-R model emphasizes that job
demands and resources are the two key
determinants of employee well-being, and it is
predicted that an increase in job demands and
reduction in job resources are likely to result in
deterioration of employees’ work engagement
and mental health. We argue that time is a job
resource that engineers particularly value when
they try to accomplish their work, and therefore
overtime reduction necessarily decreases their
valued resource of time, affecting the ways in
which engineers engage in work.
Since overtime work is often allowed for
when Japanese employers estimate the amount
of work assigned to engineers, unless the total
amount of work assignment is significantly cut
back when overtime is reduced, they are likely
to experience work overload and become unable
to complete their assignment without extra
work time to put in. Also in a situation like this,
engineers may feel they have so little time for
communication with others at work. Therefore,
we expect that overtime reduction increases job
demands and unfinished work for engineers,
while it decreases the level of their workplace
communication, and these in turn negatively
affect engineers’ work engagement and mental
health.
Note that overtime reduction usually
affects work hours for non-managerial
engineers, making it more difficult for them to
complete their work within standard work
hours. However, the work that non-managerial
engineers are unable to complete has to be
finished by their managers and team leaders.
Managerial engineers and team leaders in
general take charge of a wider range of jobs. In
addition, leaders and managers in R&D
divisions tend to participate in multiple R&D
teams/ projects. In consequence, their job
demands may increase significantly when they
must take on additionally their subordinates’
unfinished tasks. Hence, the reduction of
overtime work may affect managers and non-
managers differently. We predict that overtime
reduction has stronger impacts on engineers in
managerial status, and it is likely to exert
stronger influence on work engagement and
mental health for managerial engineers. In this

Journal of Japanese Management Vol.1, No.1, November 2016 ISSN 2189-9592
33
study, we test an analytic model as shown in
Figure 1, using data collected from among R&D
engineers in Japan.
(4) Methodology
1. Data
The data used in this study come from an
online survey “Survey on Work and Life among
Research and Development Workers” conducted
by Fujimoto in March, 2012. Samples were
taken from over 22,500 Japanese engineers
registered at one online survey company, which
consisted of 6,740 research and development
engineers, 6,480 systems development
engineers, 5,341 systems planning engineers.
While the target number of respondents was set
for 4,500, 4,482 engineers completed the survey.
Our analytic sample for this study was 4,374
engineers, which consisted of 2,226 engineers in
managerial positions and 2,148 engineers in
non-managerial positions.
Figure 1. Analytic Model
2. Variables
2.1. Dependent Variable (1): Work Engagement
Work engagement was measured by using
the shortened Japanese translation of Utrecht
Work Engagement Scale (UWES, Schaufeli,
Bakker, & Salanova, 2006; Shimazu et al., 2008).
The 9 items in the shortened UWES
represented 3 facets of engagement (vigor,
dedication, and absorption), including items
such as “At my work, I feel that I am bursting
with energy (vigor),” “My job inspires me
(dedication),” and “I get carried away when I am
working (absorption).” Responses ranged from
“1= strongly disagree” to “4= strongly agree”,
such that higher scores indicated stronger
engagement in work. We computed the average
of these 9 items and used it as a composite scale.
The internal reliability (Cronbach’s alpha) of the
scale was .93 for managerial engineers and .94
for non- managerial engineers.
2.2. Dependent Variable (2): Depression
Depression was measured by using 10
items from the Japanese version of Self-
reporting Depression Scale (Zung, 1965).
Respondents were asked their physical and
mental conditions (e.g., “I feel down and
melancholy,” “I cannot sleep at night” etc.) with
a 4-point response scale (1 = hardly ever to 4 =
always.) We computed the average of these 10
items and used it as a composite scale. The
internal reliability of the scale was .60 for both
managerial and non-managerial engineers.
2.3. Intervening Variable (1): Job Demands
Job demands was measured by a scale
Increase in Job Demands
Increase in Unfinished Tasks &
Decrease in Workplace
Communication
Intensification of Overtime Reduction
Depression
Engagement
+
-
Reduced Temporal Resource
Journal of Japanese Management Vol.1, No.1, November 2016 ISSN 2189-9592
34
which is the unweighted average of the
following three items: “Do you think that the
volume of work is balanced with the amount of
time available in your workplace? (4=strongly
disagree, 3=disagree, 2=agree, 1= strongly
agree.) ” “Because of a shorter delivery period,
many people at my work cannot work
satisfactorily.” “During the past year, I have had
very little time in delivering my
work.”(4=strongly agree to 1= strongly
disagree.) The internal reliability of the scale
was .64 for both managerial and non-
managerial engineers.
2.4. Intervening Variable (2): Increase in
Unfinished Work
Increase in unfinished work was measured
by using a single item phrased “During the past
year, I am increasingly being unable to finish
my job (1= strongly disagree to 4= strongly
agree).”
2.5. Intervening Variable (3): Decrease in
Workplace Communication
Decrease in workplace communication was
tapped by a single item phrased “During the
past year, the atmosphere for communication
has deteriorated at my work (1= strongly
disagree to 4= strongly agree).”
2.6. Focal Independent Variable (1): Reduction
in Overtime Work
The focal independent variable in this
study was intensification of overtime reduction.
Respondents were asked whether reduction in
overtime work had been intensified during the
five years prior to the survey (i.e., between 2007
and 2012). In our analysis, the variable was
dummy-coded as 1= intensified, 0= no change or
relaxed.
2.7. Focal Independent Variable (2): Managerial
Status
Managerial status was coded as 1=manager,
0=non-manager.
2.8. Control Variables
We included the following independent
variables as controls. First, years working for
current employer were measured in years. We
controlled for years working for current
employer, instead of respondents’ age, because
these two variables are significantly and highly
correlated each other (r=.662). Educational
attainment was measured as 1=junior high
school or high school, 2=some college, 3=college,
4=master degree, and 5=doctoral degree.
Income in the past year (in Japanese yen) was
coded as 1=less than 3 million yen (equivalent
to approximately US $35,000 or less), 2=3.00-
3.49 million yen (approximately US $35,000-
40,000), 3=3.50-3.99 million yen, … 15=9.50-
9.99 million yen, and 16= 10 million yen
(approximately US $120,000) or over. Monthly
overwork hours were measured in hours.
Number of projects currently involved was also
controlled. Type of industry was dummy-coded,
such as communication/IT (reference category),
manufacturing, or other types of industry.
Finally, area of work was dummy-coded as
research (reference category), develop-
ment/planning, information processing/soft-
ware development, or other areas.
3. Statistical Procedure
Our analysis proceeded in two steps. First,
we conducted mean comparisons between
managerial and non-managerial engineers in
overtime reduction, work engagement,
depression and other major job outcome
variables. Then, Ordinary Least Squares (OLS)
regression models were estimated to examine
(1) whether intensified overtime reduction
exerts differential impacts on job demands,
increase in unfinished work, and decrease in
workplace communication for managerial and
non-managerial engineers, and (2) whether and
how the above work intervening variables in
turn affect engineers’ engagement and mental
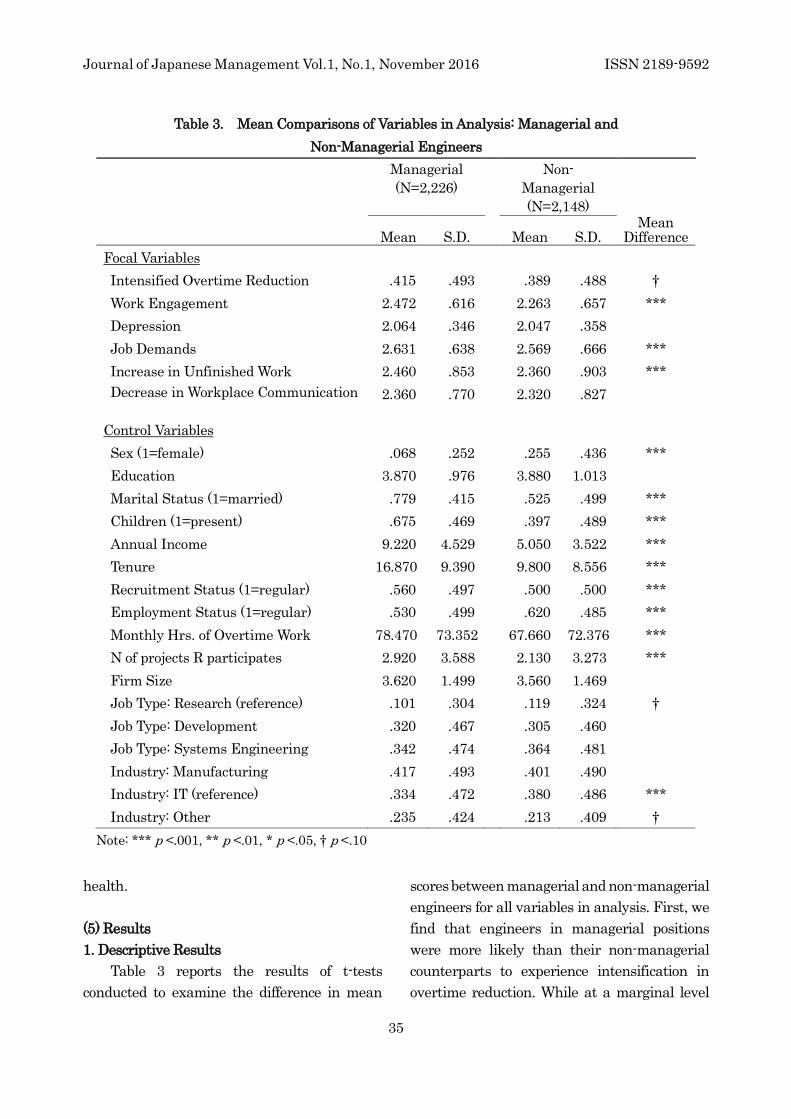
Journal of Japanese Management Vol.1, No.1, November 2016 ISSN 2189-9592
35
Table 3. Mean Comparisons of Variables in Analysis: Managerial and
Non-Managerial Engineers
Managerial
(N=2,226)
Non-
Managerial
(N=2,148)
Mean
S.D.
Mean
S.D.
Mean Difference
Focal Variables
Intensified Overtime Reduction .415 .493 .389 .488 †
Work Engagement 2.472 .616 2.263 .657 ***
Depression 2.064 .346 2.047 .358
Job Demands 2.631 .638 2.569 .666 ***
Increase in Unfinished Work 2.460 .853 2.360 .903 ***
Decrease in Workplace Communication 2.360 .770 2.320 .827
Control Variables
Sex (1=female) .068 .252 .255 .436 ***
Education 3.870 .976 3.880 1.013
Marital Status (1=married) .779 .415 .525 .499 ***
Children (1=present) .675 .469 .397 .489 ***
Annual Income 9.220 4.529 5.050 3.522 ***
Tenure 16.870 9.390 9.800 8.556 ***
Recruitment Status (1=regular) .560 .497 .500 .500 ***
Employment Status (1=regular) .530 .499 .620 .485 ***
Monthly Hrs. of Overtime Work 78.470 73.352 67.660 72.376 ***
N of projects R participates 2.920 3.588 2.130 3.273 ***
Firm Size 3.620 1.499 3.560 1.469
Job Type: Research (reference) .101 .304 .119 .324 †
Job Type: Development .320 .467 .305 .460
Job Type: Systems Engineering .342 .474 .364 .481
Industry: Manufacturing .417 .493 .401 .490
Industry: IT (reference) .334 .472 .380 .486 ***
Industry: Other .235 .424 .213 .409 †
Note: *** p <.001, ** p <.01, * p <.05, † p <.10
health.
(5) Results
1. Descriptive Results
Table 3 reports the results of t-tests
conducted to examine the difference in mean
scores between managerial and non-managerial
engineers for all variables in analysis. First, we
find that engineers in managerial positions
were more likely than their non-managerial
counterparts to experience intensification in
overtime reduction. While at a marginal level

Journal of Japanese Management Vol.1, No.1, November 2016 ISSN 2189-9592
36
(p<.10), the mean of overtime reduction was
higher for managers (.415) than for non-
managers (.389).
Mean comparison revealed that managers
were more likely than non-mangers to engage in
work. Mean scores of work engagement were
2.472 for managers and 2.263 for non-managers.
Managers exhibited a significantly higher mean
score in job demands (2.631) than non-
managers (2.569). Also, managers perceived a
significantly higher level of increase in
unfinished work (2.460) than non-managers
(2.360). However, we found no significant mean
differences in depression and decrease in
workplace communication between engineers in
managerial and non-managerial positions.
Mean scores for indicators of demographic
characteristics also showed differences between
managerial and non-managerial engineers. For
instance, significantly more non-managers were
women (25.5%) than managers (6.8%).
Managers’ tenure in the current employer was
significantly longer (16.87 years) than non-
managers (9.80 years). While we observed no
significant mean difference in educational
attainment, managers earned a higher level of
annual income (9.220) than non-managers
(5.050). Managers worked significantly longer
monthly hours of overtime (78.470 hours)
compared with non-managers (67.660 hours),
and managers were also involved in more
projects (2.920) than non-managers (2.130).
Thus, managers were working more intensively
than non-managers in our sample. We found no
statistically significant mean differences in firm
size and type of industry. As to job type, non-
managers were slightly more likely (11.9%)
than managers (10.1%) to work in research,
while approximately equal proportion of
managers and non-managers were working in
development/planning and systems engineering.
In terms of family status, managers were much
more likely (77.9%) than non-managers to have
spouse (52.5%). Managers were significantly
more likely (67.5%) than non-managers (39.7%)
to have children in the household.
2. Multivariate Results
Table 4 reports the result of OLS regression
predicting job demands, increase in unfinished
work, and decrease in workplace
communication. First, the regression result for
job demands indicate that intensified overtime
reduction is likely to increase engineers’ job
demands, and managerial engineers were
significantly more likely than non-managerial
engineers to feel burdened with their high job
demands. Yet, we found no significant
interaction effect of over time reduction and
managerial status. Several demographic
characteristics were significantly associated
with job demands. For instance, women were
less likely to experience high job demands
compared with men. Higher income level and
longer tenure were negatively associated with
job demands, while longer hours of overtime
and more projects currently involved were
positively related to job demands. Those who
were in manufacturing industry were more
likely to experience a higher level of job
demands than those in other industries.
Engineers in development and systems
engineering were more likely to be burdened
with demands, compared to those who were in
research.
Second, we find that intensification of
overtime reduction tends to increase engineers’
unfinished work, and that those in managerial
positions were significantly more likely than
their counterparts in non-managerial positions
to experience an increase in unfinished work,
when controlling for demographic conditions.
Yet here again, we found no significant
interaction effect of over time reduction and

Journal of Japanese Management Vol.1, No.1, November 2016 ISSN 2189-9592
37
Table 4. OLS Regression Coefficients for Models of Job Demands, Increase in Unfinished Work,
and Decrease in Workplace Communication
Job
Demands
Increase in
Unfinished
Work
Decrease in
Workplace
Communication
beta Sig beta Sig beta Sig
Overtime Reduction .206 *** .101 *** .098 ***
Manager .057 *** .072 *** .016
《Interaction Term》
Overtime Reduction * Manager .010 .016 -.003
Sex (1=female) -.059 *** -.037 * -.049 **
Education .023 .020 .021
Marital Status (1=married) .013 .021 .011
Children (1=present) -.018 -.042 * .010
Annual Income -.063 ** -.016 -.048 *
Tenure -.045 * -.095 *** .033 +
Recruitment Status (1=regular) .034 * .068 *** -.038 *
Employment Status (1=regular) -.020 -.033 * .032 *
Monthly Hrs. of Overtime Work .033 * .049 *** .031 *
N of Projects R Participates .085 *** .067 *** -.007
Firm Size -.021 .004 .005
Development .144 *** .030 .013
Systems Engineering .117 *** .011 -.008
Other Job Types .034 -.033 .006
Manufacturing .036 * .022 .017
R2 .073 .035 .015
Note: + p<.10, * p<.05, **p<.01, ***p<.001
Coefficients indicated in table are standardized beta coefficients.
Reference category for job type is basic & applied research.
managerial status. Several demographic
characteristics were significantly associated
with increase in unfinished work. For instance,
women were less likely than men to experience
increase in unfinished work. Longer tenure was
negatively associated with the increased
unfinished work, while working longer hours of
overtime and being involved in more projects
were positively related to the increase.
Third, while overtime reduction does
decrease workplace communication, we
found no significant effect of being in
managerial position on the decreased
communication at work. Here again, sex
exhibited a significant negative effect,
indicating that women were less likely than
men to feel the decrease in workplace
communication. Those who earn higher annual

Journal of Japanese Management Vol.1, No.1, November 2016 ISSN 2189-9592
38
Table 5. OLS Regression Coefficients for Model of Work Engagement
Note: + p<.10, * p<.05, **p<.01, ***p<.001
Coefficients indicated in table are standardized beta coefficients.
Reference category for job type is basic & applied research.
income are less likely to feel the decrease in
communication. Longer tenure was positively
associated with the decreased communication,
while longer overtime was negatively related to
the decrease.
Tables 5 and 6 show the results of OLS
regression predicting work engagement and
depression. First, we examined whether
intensification in overtime reduction exerted a
direct impact on each dependent variable
(Model 1). Then we entered additionally job
demands, increase in unfinished work, and
decrease in order to examine whether and how
these intervening variables affect engagement
and depression, and whether intensification of
overtime reduction affect engagement and de-
Work Engagement
Model 1 Model 2
beta Sig beta Sig
Overtime Reduction -.057 *** -.022
Manager .091 *** .093 ***
《Interaction Term》
Overtime Reduction * Manager -.016 -.017
Sex (1=female) .058 *** .047 **
Education .006 .010
Marital Status (1=married) .029 .029
Children (1=present) .029 .033
Annual Income .113 *** .098 ***
Tenure .021 .030
Recruitment Status (1=regular) -.022 -.029 +
Employment Status (1=regular) -.055 *** -.050 ***
Monthly Hours of Overtime Work .029 + .031 *
Number of Projects R Participates .065 *** .070 ***
Firm Size -.047 ** -.051 **
Development -.096 *** -.071 **
Systems Engineering -.158 *** -.138 ***
Other Job Types -.079 *** -.067 **
Manufacturing .023 .029 +
Job Demands -.197 ***
Increased in Unfinished Work .155 ***
Decrease in Workplace Communication -.109 ***
R2 .069 .114

Journal of Japanese Management Vol.1, No.1, November 2016 ISSN 2189-9592
39
Table 6. OLS Regression Coefficients for Model of Depression
Note: + p<.10, * p<.05, **p<.01, ***p<.001
Coefficients indicated in table are standardized beta coefficients.
Reference category for job type is basic & applied research.
pression only through these intervening
variables.
As reported in Table 5, the result in Model
1 for work engagement shows that intensified
overtime reduction exerted a significant
negative impact on work engagement. However,
when we added job demands, increase in
unfinished work, and decrease in workplace
communication in Model 2, the negative effect of
overtime reduction was reduced to non-
significance. These results suggest that
intensification in overtime reduction affects
work engagement only via these intervening
variables.
Depression
Model 1 Model 2
beta Sig beta Sig
Overtime Reduction -.012 -.033 *
Manager .025 .016
《Interaction Term》
Overtime Reduction * Manager -.007 -.009
Sex (1=female) .098 *** .105 ***
Education .034 + .031 +
Marital Status (1=married) .016 .013
Children (1=present) -.017 -.013
Annual Income .042 * .048 *
Tenure -.015 -.006
Recruitment Status (1=regular) .013 .007
Employment Status (1=regular) .004 .006
Monthly Hours of Overtime work .027 + .020
Number of Projects R Participates .074 *** .065 ***
Firm Size -.018 -.017
Development .012 .002
Systems Engineering -.043 -.050 +
Other Job Types .015 .016
Manufacturing -.022 -.026
Job Demands .048 **
Increased in Unfinished Work .082 ***
Decrease in Workplace Communication .027 +
R2 .017 .032

Journal of Japanese Management Vol.1, No.1, November 2016 ISSN 2189-9592
40
All three intervening variables entered
Model 2 exhibited statistically significant effects
on work engagement. Job demands and
decreased workplace communication were
likely to reduce work engagement, whereas
increased unfinished work was likely to
enhance engagement for engineers.
The regression results in Models 1 and 2
also show that managerial engineers were
significantly more likely than non-managerial
engineers to be engaged in work, controlling for
various demographic characteristics. Here
again, we found no significant interaction effect
of over time reduction and managerial status.
Several demographic characteristics were
significantly related to work engagement
(Model 2). For instance, women were more
likely to be engaged in work compared with men.
Higher income level and more projects currently
involved were positively associated with
engagement, while working in larger firms was
negatively related to engagement. Those who
worked in manufacturing industry were more
likely to engage in work than those in other
industries. Work engagement for engineers in
research and development tends to be higher
than those who were in other types of
engineering jobs. Turning to the results for
depression (Table 6), intensified overtime
reduction exerted no significant effect on
depression. In Model 2, however, the negative
effect of overtime reduction turned statistically
significant after controlling for job demands,
increase in unfinished work, and decrease in
workplace communication. These results
suggest that intensification in overtime
reduction has a direct impact on depression, in
addition to the indirect effects via job demands,
increase in unfinished work, and decreased
workplace communication.
The results in Model 2 revealed that higher
job demands and increase in unfinished work
are likely to deteriorate engineers’ mental
health. Decreased workplace communication
also exerted a positive influence on depression,
yet the effect was only marginally significant
(p<.10).
The regression results for depression
(Model 2) also revealed that women were more
likely than men to be depressed, and those who
earned higher income and had more project
assignments were more likely to feel depressed.
We found no significant effect of managerial
status on depression in Models 1 and 2.
(6) Discussion and Conclusion
Present results show that recent
intensification in overtime reduction in
Japanese firms has negatively affected
Japanese R&D engineers’ work. We found that
overtime reduction increased their job demands
and unfinished work, while it decreased the
level of their workplace communication. We also
found that Job demands and decreased
workplace communication were likely to reduce
work engagement, whereas an increase in
unfinished work was likely to enhance
engagement for Japanese engineers. We
predicted that overtime reduction would exhibit
stronger impacts on engineers in managerial
status, and that it would exert a stronger
influence on work engagement and mental
health for managerial engineers. While
managers were marginally more likely than
their non- managerial counterparts to perceive
the intensification of overtime reduction, we
observed no differences in the effect of overtime
reduction on work engagement and depression
for engineers in managerial and non-
managerial positions. Thus, intensified
reduction of overtime work has negative
influence on Japanese engineers irrespective of
their managerial status.
We also found that intensification in

Journal of Japanese Management Vol.1, No.1, November 2016 ISSN 2189-9592
41
overtime reduction only indirectly affects
engineers’ work engagement via job demands,
increase in unfinished work, and decreased
workplace communication, whereas it has both
direct and indirect impacts on depression.
Findings in the present study raised
questions about the commonly held perception
of long hours of work for Japanese employees.
Overtime reduction for Japanese engineers may
have both positive and negative sides, and while
on one hand it enhances the time availability for
their life outside paid employment, on the other
hand it reduces the adequacy in time spent for
work. As Yoshimura (2007) claims, scientists in
general are highly involved in their jobs,
meaning that work tends to be their central life
interest, and it is an important source of their
identity. While we found a positive association
between an increase in unfinished work and
work engagement, it may be that engineers
become all the more absorbed in work when
they feel their work-centered identity is
threatened by not being able to accomplish their
work.
In order to strike an adequate balance
between work and life, it is not sufficient to just
reduce time at work, but it is also necessary to
evaluate the adequacy in work time
simultaneously. Although employers may
generally believe that reducing employees’
overtime work is an effective means to reduce
labor costs, it is important that they realize
immoderate work time regulation may bring
about unintended negative consequences in
engineers’ work. In order to improve the well-
being and creativity for R&D engineers believed
to be motivated by intrinsic aspects of work (fun,
challenges etc.), it is necessary to carefully
examine the role of “time management.” Our
finding that work engagement for engineers in
development and systems engineering is lower
than those in basic research has an implication
that we must pay attention to how engineers in
different job types work. We will need to
compare how time at work is differentially
experienced by those who work under tight
schedule control and those who do not, in order
to evaluate the role of “time management” for
engineers in different job types.
Finally, the limitations of the present study
need be mentioned. First, the data used in this
study did not allow us to look more carefully at
how overtime reduction affected other aspects of
engineers’ work, such as voluntary unpaid
overtime. While some may argue that reduced
paid overtime is compensated by increase in
unpaid overtime, our data did not include
information to examine whether this was true,
and to our best knowledge there is no public
data available to see whether unpaid “service”
overtime increased between 2007 and 2012.
Perhaps our conceptual model requires a
wider scope to capture the processes through
which overtime reduction affects engineers’
work. In addition, although we looked at the
impact of managerial status in our analysis and
how the effect of overtime reduction is
conditioned by incumbency in a managerial
position, we did not carefully compare the ways
that managerial and non-managerial engineers
worked. Future research should also look at
whether and how intensified overtime reduction
has exerted differential impacts on the work
and non-work lives for managerial and non-
managerial engineers.
References
Bakker, A. B., and Demerouti, E. (2007). The
Job Demands-Resources Model: State of
the Art. Journal of Managerial Psychology,
22, pp.309-328.

Journal of Japanese Management Vol.1, No.1, November 2016 ISSN 2189-9592
42
Bakker, A. B., Demerouti, E., and Verbeke, W.
(2004). Using the Job Demands-
Resources Model to Predict Burnout and
Performance. Human Resource
Management, 43, pp.83-104.
Bakker, A. B., Hakanen, J. J., Demerouti, E.,
and Xanthopoulou, D. (2007). Job
Resources Boost Work Engagement,
Particularly When Job Demands Are High.
Journal of Educational Psychology, 99,
pp.274-284.
Deci, E. L., and Ryan, R. M. (2008). Hedonia,
Eudaimonia, and Well-Being: An
Introduction. Journal of Happiness
Studies, 9, pp.1-11.
Demerouti, E., Bakker, A. B., Nachreiner, F.,
and Schaufeli, W. B. (2001). The Job
Demands-Resources Model of Burnout.
Journal of Applied Psychology, 86, pp.499-
512.
Fujimoto, T., and Nakata, Y. (2007). Has Work
Motivation among Japanese Workers
Declined? Asian Business & Management,
6, S.1, pp. 57-88.
Fujimoto, T., Shinohara, S., Tanaka S. H., and
Nakata, Y. (2013). Overtime Reduction,
Work-Life Balance, and Psychological
Well-Being for Research and Development
Engineers in Japan. Proceedings of the
2013 IEEE IEEM, pp.1510-1514.
Huppert, F. A. (2009). Psychological Well-Being:
Evidence Regarding Its Causes and
Consequences. Applied Psychology:
Health and Well-Being, 1, pp. 137-164.
Japan Institute for Labour Policy and Training
(JILPT) (2013). Deetabukku Koukusai
Roudou Hikaku (Datebook of
International Labour Statistics) (in
Japanese). Tokyo: JILPT.
Japan Institute for Labour Policy and Training
(JILPT) (2014). Koyo-Chousei no Jisshi to
Koyo-Chousei Joseikin no Katsuyou ni
Kansuru Chousa (Survey for Employment
Adjustment and Utilization of
Government Subsidies for Employment
Adjustment) (in Japanese). Tokyo: JILPT.
Kuroda, S., and Yamamoto, I., (2012). Impact of
Overtime Regulations on Wages and Work
Hours. Journal of the Japanese and
International Economics. 26, pp.249-262.
Ministry of Health, Labour and Welfare (2011).
Maitsuki Kinro Toukei Chousa (Monthly
Labour Survey) (in Japanese). Tokyo:
Ministry of Health, Labour and Welfare.
Ministry of Internal Affairs and
Communications (2013). Heisei 24-Nen
Shugyo Kouzou Kihon Chousa Kekka no
Gaiyou (Summary of the Results of 2012
Employment Status Survey) (in Japanese).
Tokyo: Ministry of Internal Affairs and
Communications.
Ogura, K. (2007). Endoresu Waakaazu:
Hatarakisugi Nihonjin no Jitsuzou
(Endless Workers: Real Images of
Overworked Japanese) (in Japanese).
Tokyo: Nihon Keizai Shimbunsha.
Ogura, K. (2008). Nihon no Choujikan Roudou
(Long Working Hours in Japan:
International Comparison and Research
Subjects) (in Japanese). The Japanese
Journal of Labour Studies, 575, pp.4-16.
Research Institute for Advancement of Living
Standards (2009). Seikatsu- Jikan no
Kokusai Hikaku (International
Comparison of Time Use) (in Japanese).
Tokyo: Research Institute for
Advancement of Living Standards.
Sato, A. (2008). Shigoto-Kanri to Roudou-Jikan

Journal of Japanese Management Vol.1, No.1, November 2016 ISSN 2189-9592
43
(Work Management and Working Hours:
Mechanism That Generate Prolonged
Working Hours) (in Japanese). The
Japanese Journal of Labour Studies, 575,
pp.27-38.
Schaufeli, W. B., and Salanova, M., Gonzalez-
Romá, V., & Bakker, A. B. (2002). The
Measurement of Engagement and
Burnout: A Confirmative Analytic
Approach. Journal of Happiness Studies, 3,
pp.71-92.
Shimazu, A., Schaufeli, W. B., Kosugi, S.,
Suzuki, A., Nashiwa, H., Kato, A.,
Sakamoto, M., Irimajiri, H., Amano, S.,
Hirohata, K., and Goto, R. (2008). Work
Engagement in Japan: Validation of the
Japanese Version of the Utrecht Work
Engagement Scale. Applied Psychology:
An International Review, 57 (3), pp.510-
523.
Schaufeli, W. B., and Bakker, A. B. (2004). Job
Demands, Job Resources, and Their
Relationship with Burnout and
Engagement: A Multi-Sample Study.
Journal of Organizational Behavior, 25,
pp.293-315.
Schaufeli, W. B., Bakker, A. B., and Salanova, M.
(2006). The Measurement of Work
Engagement with a Short Questionnaire:
A Cross-National Study. Educational and
Psychological Measurement, 66, pp.701-
716.
Yoshimura, A. (2007). Kiso-Kenkyusha no
Shokumu Kanyo to Jintekishigenkanri
(Job Involvement and Human Resource
Management for Scientists in Basic
Research) Tokyo: Keio Daigaku
Shuppankai.
Zung, W. W. K. (1965). A Self-Rating Depression
Scale. Archives of General Psychiatry, 12,
pp.63 -70.
Web Site
Ogura, K. (2012). Opinion: Overtime Work in
Japan-No Easy Way to Reduce Working
Hours. The Japan News.
(http://www.yomiuri.co.jp/adv/wol/dy/opini
on/society_120206.html) (Referenced on
January 6, 2015)
(Received: May 30, 2016)
(Accepted: September 6, 2016)

Journal of Japanese Management Vol.1, No.1, November 2016 ISSN 2189-9592
44
Family Firms’ Transformation to Non-family Firms
During 1920’s-2015
Toshio Goto
Japan University of Economics, Japan
The Academic Association for Organizational Science
E-mail: [email protected]
Abstract
This paper sheds light on the transformation of the listed family business during almost a
century (1920’s - 2015) in Japan, to analyze the erosion of family influence upon the firm from
the resource-based view perspective. Family business, broadly defined as any firm under family
influence, are known for their major role in the national economy and superior performance both
in developed and developing countries. Despite the importance of the continuation of the family
firms for generations, little research has been done to analyze its transformation to non-family
status.
This paper examines the family firm transformation process as the family capital committed
to the firm decreases, to identify the sequence and causes of the transformation. Major findings
of the research include:
(1) Family capital is essential to maintain the family business status.
(2) Erosion of the family financial capital is the most important force that causes the
transformation.
(3) Major causes of the transformation include the decision-making at the business
expansion phase, separation of ownership and management, disposal of the shares and
resignation from the board of directors.
(4) The transformation process to the non-family status, once occurred, is seldom reversible.
With the above findings, this paper contributes to the existing literature to enrich
understanding of the transformation and importance of family capital to maintain the family
influence on the firm. This paper presents academic, practical and administrative implications
before arriving at the conclusion.
Keywords: family business, ownership, succession, board of directors
(1) Introduction
This paper sheds light on the
transformation of the listed family business
during almost a century (1920’s - 2015) in Japan,
to analyze the erosion of family influence upon
firms from the resource-based view (RBV)
perspective. As a theoretical lens to view the
resources of the firm as the source of its
Journal of Japanese Management Vol.1, No.1, November 2016 ISSN 2189-9592
45
competitiveness (Barney, 1991), RBV is
employed to analyze the erosion of the various
resources of the family business and its impact
upon the family influence. The research
questions are; in what sequence the
transformation takes place, and what major
factors cause the transformation.
Family business research is one of the
emerging fields, reflecting the major role of the
family business in the national economy both in
developed and developing countries, its unique
characters, and its superior performance
compared to the non-family business. Since the
inception of the research in our field, succession
has remained as the main subject, reflecting the
short life span of the family business and the
strong desire of business families for longevity
for future generations. Despite the importance
of the continuation of the family firms for
generations, little research has been done to
analyze its transformation to non-family status.
The paper aims to contribute to the
literature with major findings about the erosion
of family capital, which eventually terminates
life as a family firm, and provides implications
in the academic, pragmatic, as well as the
administrative perspectives. The rest of the
paper is composed of the literature review,
method and the major results, discussions, and
implications before arriving at the conclusion.
(2) Literature review
Family business, broadly defined as any
firm under a family’s influence (Newbauer &
Lank, 1998), has quickly gained considerable
attention both in the developing and the
developed countries. The main reasons for this
attention include but are not limited to; the
major role family business plays in the national
economy over the world, its superior
performance and its unique characteristics.
Both contradict the famous declaration of a
separation of ownership and control (Berle &
Means, 1932) and Chandler (1977), which
assesses the family business as outdated.
It is conservatively estimated that family
businesses comprise between 65% and 80% of
all existing firms worldwide (Gersick et al.,
1997). Among the big firms, family businesses
also take a significant share. In the United
States, for example, 35% of the S&P firms
(excluding financial institutions) are family
businesses. It is also well known that family
businesses outperform other types of firms
(Anderson & Reeb, 2003).
Literature addresses the unique character
of the family business from various viewpoints.
A family business is typically presented as a
three circle model (Gersick et al., 1997), which is
composed of family, ownership and business
subsystems. The family’s involvement and its
influence on the ownership and business/
management make the family business
distinctive from other types of organizations.
F-PEC (Astrachan et al., 2002) is a concept,
composed of power, experience and culture,
proposed to assess the family influence on a
continuous scale rather than artificially
dichotomizing family and non-family firms.
Familiness (Habbershon & Williams, 1999) is
another concept to model a family business from
the RBV perspective. Familiness represents a
useful all-encompassing term for the sources,
processes, and consequences of family
involvement in terms of ownership,
management, and intergenerational intention.
F-PEC and familiness have been discussed but
not operationalized in a quantitative manner.

Journal of Japanese Management Vol.1, No.1, November 2016 ISSN 2189-9592
46
Measuring the family’s influence on the
ownership and management, Goto (2016)
analyzes all firms listed on the stock markets in
Japan, to identify the family firms and evaluate
the level of family influence. The ownership
influence is judged by the level of the stocks
owned by the family, both as individuals and
firms under the family’s influence, while the
management influence is judged by the
magnitude of the family’s representation on the
board of directors.
The research categorizes listed family firms
into three groups based upon the level of the
family’s influence and proposes that the family’s
influence tends to be eroded both in the
ownership and management, which eventually
brings family firms to the non-family status.
This process of the family business
transformation to the non-family firm was
preliminarily examined in the automotive
industry (Goto, 2016).
Following this approach, the present paper
further expands it with the RBV approach, and
adds the temporal dimension to examine the
transformation process in a historical manner.
As Pramodita et al. (2014) emphasize, time is an
important factor in our research field, especially
when we research the ownership and
leadership transitions across generations.
The present paper examines the
transformation of the listed family firms to the
non-family status between the 1920’s and 2015
in Japan. During the post-WW2 period, Japan
has experienced radical social changes and
rapid economic growth, while the pre-war
period remained relatively stable. There is no
literature focusing on the longitudinal changes
of family business during a century of such
drastic changes, anywhere in the world.
(3) The method and major results
This section explains the research method,
definitions, information sources, and major
results. In order to find the transformation of
the family firms to the non- family status over
nearly a century, we chose to focus on the listed
firms, which were family firms in 1950 but lost
its family business status in or before 2015. The
year 1950 is chosen as the first observation
period since the Stock exchanges reopened in
1949 after WW2 in Japan. After observing the
transformation since 1950, the observation
period is expanded back to the 1920’s. Such a
retrospective manner is chosen to make the
comparison meaningful, because data
availability before 1950 varies among the firms
due to the different times of listing and
foundation.
Information sources include all securities
reports published by the firms, the Joint-stock
company almanacs (Yamaichi Securities, Toyo
Keizai Shinposha), company history books,
‘who’s who’ directories, which are supplemented
by the following databases: Business Archive
Center (http://j-dac.jp) & eol (http://www.dl.itc.
u-tokyo.ac. jp /gacos).
Family business is defined, as an extension
of Newbauer & Lank (1998), as any firm with
multiple members from the same family serving
sequentially or simultaneously either as the
major shareholders and/or board members
(Goto, 2012: 3). Family shareholders are the ten
largest shareholders, as listed in the securities
reports of the subject firms, whose name,
number of the stocks owned and ownership
share are available in the securities reports. The
members of the board of directors are also
available from the same information sources as
the shareholders. Board members include all

Journal of Japanese Management Vol.1, No.1, November 2016 ISSN 2189-9592
47
directors and auditors, either full time or not.
Family members include relatives by blood
within the sixth degree, the spouse, and
relatives by affinity within the third degree, as
defined by Civil Code Article 725.
While family names give important clues to
identify the family members, some people with
the same family name may not belong to the
same family. Some family members, on the
other hand, may have different family names
because of marriage. This needs to be examined
by referring to directories and company history
books. Lastly, on the occasion of the merger &
acquisition, we focus on the legal surviving
company.
The following are the major research
results. Table 1 summarizes the transformation
of the family business status between 1950 and
2015, where firms are listed in the order of the
timing of reaching non-family business status.
Table 2 shows the transformation of the family
business between the 1920’s and 1950, where
firms are listed in the descending order of the
family business status in 1940.
Following Goto (2016), family firms are
categorized into three major groups (Group A, B
and C), which are further subdivided into two
levels. Explanations are as follows: Group A,
composed of level 6 and 5, includes family firms
with the family members positioned together
among the major (ten largest) shareholders, and
with at least one family member in the board of
directors. The difference between level 6 and 5
is that the family together is the largest
shareholder in level 6, while the family together
is positioned between the 2nd and 10th
shareholders in level 5. Group B, composed of
level 4 and 3, includes family firms with the
family positioned together among the major
shareholders but no representative in the board
of directors. The difference between level 4 and
3 is, same as the above, that the family together
is the largest shareholder in level 4, while the
family together is between the 2nd and 10th
shareholders in level 3. Group C, composed of
level 2 and 1, includes family firms with at least
one board member but with no family
shareholders among the top ten. The difference
between level 2 and 1 is that the family has a
president or chairperson in level 2, while the
family has a board member(s) other than a
president or chairperson in level 1.
Out of 57 cases which experienced the total
loss of family influence between 1950 and 2015,
5 firms lost by 1970, an additional 16 firms by
1980, 7 firms by 1990, 15 firms by 2000, 13 firms
by 2010, and 1 by 2015. 10 firms moved directly
from Group A to the non-family status (level 0),
while 47 moved from Group C and no firms from
Group B moving to nonfamily status. There are
3 events in 2 firms, which witnessed a loss of
family influence and its recovery before finally
arriving at the non-family status.
(4) Discussion
This section discusses the research results
starting with the general overview, followed by
the importance of the family influence and
family capital, route to the non-family status,
major factors that cause the transformation,
and the reversibility of the transformation
process in this order.
1. General overview
First, let us review Table 1, which
highlights quick and gradual transformation in
most cases. There are 5 firms (8.8%), which
became nonfamily by 1970 and another 40.3%

Journal of Japanese Management Vol.1, No.1, November 2016 ISSN 2189-9592
48
Table 1. Family status of the listed family business in the post-WW2 period (1950-2010)
Code Name Industry 1950 1960 1970 1980 1990 2000 2010
5233 Taiheiyo Cement Co. Construction materials 1 1 0 0 0 0 0 CN
3106 KURABO Industries Textile goods 0 1 0 0 0 0 0 CN
8013 Naigai Corp Textile goods 1 2 0 0 0 0 0 CN
4503 Astellas Pharma Inc. Pharmaceutical 5 5 0 0 0 0 0 AN
7752 RICOH Co. Electronics 6 6 0 0 0 0 0 AN
5331 Noritake Company
Glass & Ceramics
Products 6 1 1 0 0 0 0 CN
3501 Suminoe Textile Co. Textile goods 5 1 1 0 0 0 0 CN
4461 DKS Co. Chemicals 5 1 1 0 0 0 0 CN
4613 KANSAI PAINT CO. Chemicals 3 1 1 0 0 0 0 CN
7122 The Kinki Sharyo Co. Transportation
machinery 1 1 1 0 0 0 0 CN
3110 Nitto Boseki Co. Textile goods 2 2 1 0 0 0 0 CN
4043 Tokuyama Corp. Chemicals 6 5 1 0 0 0 0 CN
6508 Meidensha Corp. Electrical equipment 6 5 1 0 0 0 0 CN
6326 Kubota Corp. Machinery 6 2 2 0 0 0 0 CN
5352 Kurosaki Harima Corp. Glass & Ceramics
Products 5 2 2 0 0 0 0 CN
6742 Kyosan Electric Mfg. Co. Electrical equipment 2 2 2 0 0 0 0 CN
4902 KONICA MINOLTA,
INC. Electrical equipment 6 5 5 0 0 0 0 AN
4112 Hodogaya Chemical Co. Chemicals 5 5 5 0 0 0 0 AN
3201 THE JAPAN WOOL
TEXTILE CO. Textile goods 4 5 5 0 0 0 0 AN
5332 TOTO LTD.
Glass & Ceramics
Products 4 5 5 0 0 0 0 AN
7913 Tosho Printing Co. Miscellaneous goods 6 6 5 0 0 0 0 AN
3405 KURARAY CO. Chemicals 5 2 0 1 0 0 0 CN
5333 NGK INSULATORS,
LTD.
Glass & Ceramics
Products 5 1 1 1 0 0 0 CN
6461 Nippon Piston Ring Co. Machinery 5 1 1 1 0 0 0 CN
7701 Shimadzu Corp. Precision Instruments 1 1 1 1 0 0 0 CN
4004 Showa Denko K.K. Chemicals 0 5 2 1 0 0 0 CN
7971 TOLI Corp. Chemicals 5 5 5 1 0 0 0 CN
7992 THE SAILOR PEN CO. Miscellaneous goods 6 6 2 2 0 0 0 CN
6473 JTEKT Corp. Machinery 6 5 2 1 1 0 0 CN
7261 MAZDA Motor Corp. Automotive 6 5 2 1 1 0 0 CN
4452 Kao Corp. Chemicals 5 3 3 1 1 0 0 CN
4508 Mitsubishi Tanabe
Pharma Corp. Pharmaceutical 6 5 5 1 1 0 0 CN
3408 Sakai Ovex Co. Textile goods 6 2 2 2 1 0 0 CN
6103 Okuma Corp. Machinery 6 5 2 2 1 0 0 CN

Journal of Japanese Management Vol.1, No.1, November 2016 ISSN 2189-9592
49
4516 Nippon Shinyaku Co. Pharmaceutical 5 5 5 2 1 0 0 CN
6841 Yokogawa Electric Corp. Electrical equipment 5 2 1 2 2 0 0 CN
2533 Oenon Holdings, Inc. Food processing 5 2 2 2 2 0 0 CN
7951 Yamaha Corp. Miscellaneous goods 2 2 2 2 2 0 0 CN
6367 DAIKIN INDUSTRIES,
Ltd. Machinery 6 5 5 2 2 0 0 CN
6506 YASKAWA Electric
Corp. Electrical equipment 5 5 5 2 2 0 0 CN
4912 Lion Corp. Chemicals 6 6 5 2 2 0 0 CN
4028 Ishihara Sangyo Kaisha,
Ltd. Chemicals 3 5 5 5 5 0 0 AN
9017 Niigata Kotsu Co.
Ground transportation 2 6 6 6 6 0 0 AN
9048 Nagoya Railroad Co.
Ground transportation 2 1 1 1 1 1 0 CN
5334 NGK SPARK PLUG Co. Glass & Ceramics
Products 6 5 2 1 1 1 0 CN
7905 DAIKEN Corp.
Construction materials 5 5 5 2 1 1 0 CN
7723 Aichi Tokei Denki Co. Precision Instruments 6 1 1 1 2 1 0 CN
9064 YAMATO HOLDINGS
CO. Ground transportation 6 5 5 5 2 1 0 CN
2802 Ajinomoto Co. Food processing 6 5 6 5 2 1 0 CN
6474 Nachi-Fujikoshi Corp. Machinery 5 5 0 0 1 2 0 CN
9044 Nankai Electric Railway
Co. Ground transportation 1 1 2 2 1 2 0 CN
4911 Shiseido Co. Chemical 5 3 1 1 2 2 0 CN
2002 Nisshin Seifun Group
Inc. Food processing 2 2 2 2 2 2 0 CN
6203 Howa Machinery, Ltd. Machinery 2 2 2 2 2 2 0 CN
6332 Tsukishima Kikai Co. Machinery 6 5 5 5 2 2 0 CN
8244 KINTETSU
Department Store Co. Retail 6 5 5 5 5 5 0 AN
3526 Ashimori Industry Co. Industrial materials 6 3 1 2 2 2 1 CN
Note 1: Each column shows the level of the family influence as defined in the text.
Note 2: Company names are shown in the current manner.
Note 3: Dark columns show the total loss of the family’s influence (level 0).
Note 4: Black columns in 1950 indicate the extraordinary erosion of the family influence.
Note 5: In the extreme right column, “CN” shows the erosion of the family influence from Group C to non-family,
while “AN” shows the direct loss of the family influence from Group A.
Source: Compiled by author.
became nonfamily by 1990. The number of firms
in Group C show a sharp decrease from 29 (in
1960), to 18 (1970), 6(1980), 3 (1990) and
1(2000). The majority of the firms (47 firms or
82.5%) experienced gradual erosion, i.e. moving
from Group C (the weakest family status) to non-
family status. In contrast, 17.5% of the firms
made a direct move from Group A (the strongest

Journal of Japanese Management Vol.1, No.1, November 2016 ISSN 2189-9592
50
Table 2 Family status of the listed family business in the pre-WW2 period (1920’s-1950)
Code Name Founded S M 1920's 1930 1940 1950
7971 TOLI Corp. 1919 3 1 6 6 6 5
3106 KURABO Industries 1888 1 2 6 6 6 0
3501 Suminoe Textile Co. 1883 7 2 6 6 6 5
4613 KANSAI PAINT CO. 1917 5 3 6 6 6 3
3110 Nitto Boseki Co. 1923 6 3 6 6 6 2
6326 Kubota Corp. 1890 11 4 6 6 6 6
3201 THE JAPAN WOOL TEXTILE CO. 1896 4 2 6 6 6 4
5332 TOTO LTD. 1917 5 3 6 6 6 4
5333 NGK INSULATORS, LTD. 1919 6 2 6 6 6 5
6841 Yokogawa Electric Corp. 1915 10 3 6 6 6 5
2802 Ajinomoto Co. 1907 9 5 6 6 6 6
4043 Tokuyama Corp. 1918 3 2 6 6 6
3405 KURARAY CO. 1926 2 1 6 6 5
7701 Shimadzu Corp. 1875 6 3 6 6 1
7992 THE SAILOR PEN CO. 1911 11 2 6 6 6
6103 Okuma Corp. 1898 4 2 6 6 6
2533 Oenon Holdings, Inc. 1900 5 1 6 6 5
4911 Shiseido Co. 1872 4 3 6 6 5
4461 DKS Co. 1909 5 1 5 5 6 5
7752 RICOH Co. 1936 2 1 6 6
6508 Meidensha Corp. 1897 1 6 6
5352 Kurosaki Harima Corp. 1918 4 2 6 5
4112 Hodogaya Chemical Co. 1915 2 2 6 5
6473 JTEKT Corp. 1921 1 2 6 6
4452 Kao Corp. 1887 1 2 6 5
3408 Sakai Ovex Co. 1891 3 3 6 6
6367 DAIKIN INDUSTRIES, Ltd. 1924 2 2 6 6
6506 YASKAWA Electric Corp. 1915 1 5 6 5
4028 Ishihara Sangyo Kaisha, Ltd. 1920 1 3 6 3
5334 NGK SPARK PLUG Co. 1936 4 1 6 6
8013 Naigai Corp 1920 5 5 5 1
7723 Aichi Tokei Denki Co. 1904 1 1 5 6 5 6
2002 Nisshin Seifun Group Inc. 1900 4 2 5 6 5 2
7261 MAZDA Motor Corp. 1921 3 1 6 5 6
9048 Nagoya Railroad Co. 1894 1 1 6 5 2
6474 Nachi-Fujikoshi Corp. 1928 1 1 6 5 5
6332 Tsukishima Kikai Co. 1905 1 1 6 5 6
5331 Noritake Company 1904 5 1 6 5 5 6
5233 Taiheiyo Cement Co. 1881 1 2 5 5 5 1
7951 Yamaha Corp. 1927 1 1 5 5 2
6461 Nippon Piston Ring Co. 1931 5 5
4004 Showa Denko K.K. 1926 5 2 5 0

Journal of Japanese Management Vol.1, No.1, November 2016 ISSN 2189-9592
51
9017 Niigata Kotsu Co. 1913 3 2 5 2
3526 Ashimori Industry Co. 1878 4 1 5 6
6203 Howa Machinery, Ltd. 1932 3 1 5 2
8244 KINTETSU Department Store Co. 1920 3 1 5 6
4516 Nippon Shinyaku Co. 1911 3 2 6 5
4503 Astellas Pharma Inc. 1923 5
7122 The Kinki Sharyo Co. 1920 4 1
6742 Kyosan Electric Mfg. Co. 1917 2
4902 KONICA MINOLTA, INC. 1873 6 6 6
7913 Tosho Printing Co. 1911 6
4508 Mitsubishi Tanabe Pharma Corp. 1678 6
4912 Lion Corp. 1891 3 6
7905 DAIKEN Corp. 1945 1 1 5
9064 YAMATO HOLDINGS CO. 1919 4 2 6
9044 Nankai Electric Railway Co. 1884 1 1
Note 1 & 2: Ditto
Note3: Dark columns show the strong family influence (Group A).
Note4: Black columns in 1950 indicate the extraordinary erosion of the family influence.
Note5: Column “S” and “M” show the largest number of the family shareholders and family board
members respectively.
Note6: Column with a slash indicates the firm didn’t exist then. Vacant column indicates data
isn’t available.
Source: Compiled by author.
family status) to non-family status.
The general overview of Table 2 shows, in
contrast to Table 1, the minor transformation,
keeping the highest level of family influence
both in the ownership and the management. All
firms were in Group A, and after experiencing
an erosion from level 6 to level 5 in general, 30
firms (65.2%) still maintained level 6 status in
1940.
This is natural at the infant stage of family
business development (Carlock & Ward, 2001).
Most of the firms started as a small family firm,
which grew and eventually went public, as
described in the company history books (ex.
Ajinomoto, 1972:29-30, Nachi-Fujikoshi Corp.,
1978).
Before discussing the specific subjects, we
1 [ ] designates the security code.
need to look at 1950, which witnessed
extraordinary transformations. Immediately
after WW2, Japan was occupied by the General
Headquarters (GHQ), which dissolved the
Zaibatsu. The dissolution first targeted 5 major
Zaibatsu, and later the minor and local ones.
Their controlling families' assets were seized
and holding companies were eliminated. There
are 8 Zaibatsu targeted in our sample firms,
whose family influence in 1950 was eroded to
the following levels:
Non-family: KURABO[3106] 1 , Showa Denko
[4004]
Level 2: Nitto Boseki [3110]
Level 4: JAPAN WOOL TEXTILE [3201]
Level 3: Ishihara Sangyo Kaisha [4028]
Level 5: Kurare [3405], DAIKEN [7905], DAI-

Journal of Japanese Management Vol.1, No.1, November 2016 ISSN 2189-9592
52
KIN INDUSTRIES [6367]
There are several family firms, which took
voluntary actions to protect themselves from
dissolution, and as a result, significantly eroded
their family influence. For example, Ajinomoto
[2802] made a series of decisions to avoid the
dissolution, which included: name change of the
firm, liquidation of Suzuki & Co. the holding
company, and the retirement of Saburosuke
Suzuki III, the head of the family and Suzuki &
Co. The company history book states, “Change
in major shareholders: Suzuki Sanei Co. and the
Suzuki family held 44.7% of the shares in June
1946. Three years later, this number was down
to roughly 7% by June 1949.
Table 3. Extraordinary status in 1950 &
normalized status
Name Code Original Normalized
KURABO 3106 0 1
Nitto Boseki 3110 2 2
JAPAN WOOL
TEXTILE
3201 4 5
Kurare 3405 5 5
Showa Denko 4004 0 5
Ishihara
Sangyo Kaisha
4028 3 5
TOTO 5332 4 5
DAIKIN
INDUSTRIES
6367 5 5
DAIKEN 7905 5 5
Naigai 8013 1 2
Niigata Kotsu 9017 2 6
Note 1 & 2: Ditto
Source: Compiled by author.
Shimadzu [7701] retired all family
members from the board of directors. Though
successfully avoiding the dissolution, its family
influence wasn’t recovered. Other factors that
erode family influence include huge property
taxes and the decreasing of value of holding
stocks (Mishima, 1983). Labor unions were
another factor to force management concession
in Niigata Kotsu [9017].
Some families recovered family influence
from the extraordinary damage, as presented in
the securities reports of 1960. In such cases, the
paper conservatively normalizes the family
status of 1950 to the level of 1960 (Table3).
2. Importance of family influence and the family
capital
Family firms’ uniquenesses arise from their
family/firm integration, as presented by the
three-circle model (Gersick et al., 1997). The
transformation of the family firm, as we’ve seen,
is nothing but the disintegration of such a
unique relationship between the family and its
firm, which results in the partial loss of the
family firms’ uniqueness and finally loses life as
a family firm.
From the resource-based view,
disintergration of such a unique family-firm
relationship means the detachment of family
capital from the firm. Family capital, defined as
totally owned family resources composed of
human, social, and financial capital (Danes et
al., 2009), is vital to the sustainable growth of
the family business through the family’s
involvement in ownership and management.
Erosion of family influence in its ownership and
management means the decrease of the family’s
financial and human capital committed to the
firm respectively.
It is critical for the family to maintain
family influence on the firm, not only from the
family viewpoint but also from the perspective

Journal of Japanese Management Vol.1, No.1, November 2016 ISSN 2189-9592
53
of the national economy. For the business family,
especially for the founder, the family business is
an intense source of energy and interest, which
represents an extension of himself (Levinson,
1971).
Considering such a special relationship, it
is in the nature of founders/entrepreneurs to
have a difficulty “giving up what they have
created” (Shein, 1985: 275). Erosion of family
capital committed to the firm means the partial
or total separation of the family from the firm as
a shareholder or board member, severing a
special relationship and accompanied emotional
ties. Such a separation is the last thing for the
business family to accept.
From the perspective of the national
economy, erosion of the family capital
committed to the firm means the weakening of
the unique character of the family firms, which
ultimately results in loss of the major role the
family business plays in the national economy
as addressed in the beginning of the paper.
Therefore, the erosion of the family influence, or
family capital, should be avoided by all means,
both from the family and the national economy’s
perspectives.
3. Routes to the non-family status
Concluding the general overview with the
above, we now move to the three main subjects
relevant to the transformation of the family
business. First is the route and sequence to non-
family status. Our question is to find the causal
relationship between the erosion of the family’s
influence in its ownership and management. In
order to answer the question, two models are
prepared to explain the process to become a non-
family business; one model to put the Group B
& C phase between A and nonfamily status (ie.
A→B→C→ non-family), and another model to
put Group C & B in-between (ie. A→C→B→
non-family), and find which model explains the
process better (with less number of deviations).
The result shows that the former model has
10 deviations in 9 firms, while the latter model
has 13 deviations in 9 firms. Therefore, we
conclude that the former model explains the
process better than the latter model. The model
positions the erosion of the family’s shareholder
position as the fundamental force to transform
the family business, which triggers the erosion
of the family’s position in the board of directors
and ultimately brings the firm to non-family
status.
Although the margin is slim, the result is
supported by the importance of the ownership
in a joint-stock company, where the board of
directors is appointed at the annual
shareholders’ meeting and work as agents of
shareholders. Therefore, family influence as the
shareholder(s) is most essential, and it must be
maintained to keep the firm under the family’s
control.
Ownership influence
High
B
Low
Low High
Management influence
Figure 1. Transformation of the family firm
Note1: Solid and dotted lines show the main route
and its short-cuts respectively.
Note 2: NF designates non-family.
Source: Compiled by author.
Group
A
A
B
C NF

Journal of Japanese Management Vol.1, No.1, November 2016 ISSN 2189-9592
54
Beside the main route and the sequence as
discussed above, two shortcuts need to be added.
One is the direct route from Group A to C, and
another is from Group A to non-family status.
Table 1 shows that ten firms, or 17.5%, followed
this route, while most of our sample followed the
major route.
Summarizing the above discussion, Figure
1 illustrates the main route/sequence of the
transformation of the family business, with two
short-cuts.
4. Major factors to cause transformation
4.1. Decision-making during the business
expansion period
Significant erosion of family influence
between 1960 and 1990 coincides with the rapid
growth of the Japanese economy. The
transformation to the non-family status started
in 1970s, and most significantly in the 1980s
and 1990s. One of the most relevant factors to
this end was the dilution of the family’s
shareholding position, which was caused by the
capital increase during 1970s and 1980s,
especially through the public stock offerings.
Stock dilution resulted from the issue of
additional common shares by the firms to
finance the business expansion.
While the firms benefited from the
additional capital and improved profitability,
the dilution lowered the family’s positions as
shareholders, i.e. ownership percentage and
voting control. For the family and its business,
this meant the decrease of the family’s influence
as shareholders. The increase of capital after
WW2 was significant in Japan. Compared to
the 1950s, when the total amount of the capital
increase was 1,270.9 billion yen, the amount of
the new capital issuance increased more than
ten-fold to 19,350.2 billion yen during the 1980s
(Suzuki, 2013: 41).
Furthermore, public stock offerings became
the major method of the capital increase
(51.38% during 1970s and 79.42% during
1980s) in contrast to 3.75% in 1950s and 5.67%
in 1960s (Suzuki, 2013: 41). While the rights
issue, which was the major method of the
capital increase until the 1960s, doesn’t affect
the existing shareholders’ position, public stock
offerings certainly result in the dilution of the
existing shareholders’ positions. The result
shows that most of the business families
couldn’t maintain the same family influence as
the shareholders under such circumstances.
Summing up, the findings show that the
business family’s decision during the business
expansion period benefited the firm, which
resulted in the sacrifice of family influence. In
order to maintain the family capital and family’s
influence on the firms, the family always needs
to pursue the optimal balance between the
benefits of both the family and it’s firm when
making a business decision.
4.2. Separation of the ownership and
management
Another factor that accelerated the
decrease of the family’s influence after WW2 is
the separation of the ownership and
management, and the appointment of the non-
family members to president. Such practices
were considered to be modernization of the
management, and started implementation
before the war (ex. Ajinomoto, 1972:30, 113). It
became popular after the war, especially at the
time of rapid business expansion, when the
family couldn’t afford to provide enough human
resources both in quantity and quality.
Just like the above discussion, the business
Journal of Japanese Management Vol.1, No.1, November 2016 ISSN 2189-9592
55
family needs to carefully consider what is good
for the family and the firm in the long run.
Separation of ownership and management, and
the introduction of professional executives may
work well only under certain conditions (Goto,
2012: 81-83). It is necessary for the business
family to fully understand its advantages as
well as disadvantages before making the final
decision.
4.3. Disposal of shares
The disposal of shares is another main
factor for the erosion of family influence in
ownership. There are various reasons for the
shares disposal, including the inheritance tax
payment, financial needs for personal purposes
etc., which are not easy to observe from the
outside. There were two cases, which were
made public. K. Ichimura, founder of RICOH
[7752], decided not to pass the baton to a family
member and most of his assets (3 billion yen)
were donated to the newly established New
Technology Development Foundation. M. Ogura,
after retiring from YAMATO HOLDINGS
[9064], donated 4.6 billion yen to establish
Yamato Welfare Foundation (Mori, 2016). Today,
neither of these foundations have family
influence, without having family members in
the executive board.
Whatever the motivation and necessity is,
disposal of the company shares means less
commitment of the family capital as the
shareholder. The business family needs to
consider the outcome of disposal in the long run.
4.4. Removal from the board of directors
There are at least 6 firms which
experienced the family executive’s removal from
the board of directors, either as a president or
chairperson, reportedly taking responsibility for
the poor performance (2 firms), management
crisis (2 firms), and occasionally scandalous
incidents (2 firms). Removal from the board of
directors means not only the erosion of the
family influence, but also the loss of revenue as
the executive. Loss of such revenue makes it
difficult to buy newly issued stocks to maintain
family influence as a shareholder.
Some of the cases, such as scandalous
incidents, were expected and avoidable, for
which the family executives are responsible.
Family executives are also responsible for the
poor performance and management crisis, at
least to some extent. It is the business family’s
responsibility to take every possible measure to
avoid such incidences beforehand, in order to
maintain the commitment of the family capital.
5. Reversibility of the transformation process
Once the family influence is damaged, is it
possible to recover it? Our research shows that
the family’s influence in the management can be
recovered, while it is very difficult to recover the
influence in the ownership. Table 1 shows 10
incidences of the reverse moves: there are 7
upward movements in the board member(s),
composed of 2 moves from non-family to level 1,
7 moves from level 1 to 2. In contrast, there is
only one upward move regarding the
shareholder’s position (from level 5 to 6).
It is possible to recover the position in the
board of directors as long as the ownership is
maintained at a certain level, such as among the
top ten shareholders (e.g. moves from level 4 to
5). We contend that it is quite difficult to move
upward in the shareholder’s position unless the
family continues its conscious effort to this end.
In conclusion, family capital and its
commitment to the firm is fundamental to the
status of the family firm, and the family needs
Journal of Japanese Management Vol.1, No.1, November 2016 ISSN 2189-9592
56
to continue a conscious effort to maintain it, as
it is very difficult to recover once it is damaged
or lost.
(5) Implications
This section presents implications, which
are academic, practical and administrative
respectively. Academically, the research has
three major implications. First, the paper
presents a new definition of family business to
quantitatively measure the family involvement
on a continuous scale. Traditional definitions
artificially dichotomize family vs. nonfamily
firms when no such clear-cut dichotomy exists
(Astrachan et al, 2002: 46). To avoid the problem,
F-PEC is proposed, which however isn’t
operationalized.
This paper presents a quantitative
measurement of the family involvement, both in
the ownership and management, on a
continuous rather than dichotomous scale,
overcoming the weakness of both the
conventional definitions and FPEC. It has a
potential to tap different qualities of businesses,
making it possible to differentiate levels of
family involvement, and providing a framework
integrating different theoretical and
methodological approaches to the study of
family business.
Secondly, as discussed in the last section,
this paper addresses the importance of the
optimal solution of the conflict between the
family and its business. In order to pursue the
optimal balance between the benefits of both the
family and it’s firm, this research emphasizes
the importance of maintaining the family’s
perspective when making a business decision. It
is therefore critical to research the optimal point,
to balance the benefit of both the family and its
business in the long run.
The third academic implication, the
modeling of the sustainable family business, is
relevant for family firms to achieve sustainable
growth for generations. The family business
today is facing various challenges due to ever-
changing environmental conditions. The
sustainable family business model, once
constructed under such ever-changing
environmental conditions, is expected to
evaluate each family firm for its sustainability,
succession capability and address its obstacles.
Practical implications are varied, out of
which the following two are briefly remarked
about. One is the importance of the family’s
conscious effort to keep control of the business
within the family. The importance of the
family’s control of its business is echoed by
Ernst Young (2015), summarizing the 2012
survey of 280 family businesses in 30 countries,
which says that “two-thirds of all businesses
questioned said that they planned to keep the
control of the business in the family.” This
strong desire should be pursued consciously and
continuously, otherwise business decisions will
be easily made in favor of the firm’s interest.
Another practical implication, important to
the business family, is the significance of all
possible measures to maintain the family’s
influence in a long-term horizon. Education of
the next generation is one of the most important
factors to this end, which requires at least one
or two decades to successfully accomplish as
planned. Therefore, such a practice can’t be
overemphasized.
Last but not the least important is the
administrative implication. For the
policymakers, this paper indicates the
importance of maintaining the family status,

Journal of Japanese Management Vol.1, No.1, November 2016 ISSN 2189-9592
57
nevertheless administrations in Japan and
other nations seem to be geared toward non-
family succession. In Japan, succession is one of
the very imminent issues for family firms
(Small and Medium Enterprise Agency, 2006).
Less and less numbers of members of the next
generation choose to succeed, and as a result,
family firms are obliged to cease operation. In
such a situation, the Small and Medium
Enterprises Agency, moves to support various
alternate successions, including succession to
non-family members, following advanced
nations which have already geared toward this
direction, typically the European Community
(European Commission, 2011: 78), and
especially France (Murakami, 2008: 16).
It may be argued that various alternate
successions serve to the benefit of the family and
its firms. Literature tells the opposite since
extra-family succession yields better financial
performance than intra-family succession in the
short run, but it is inferior in continuity
(Wennberg et al., 2011). Policymakers should be
aware of the outcome of the policy in the long
run and should take every possible means to
promote intra-family succession.
(6) Conclusion
Tracing 57 listed family firms in Japan for
their transformation process to become non-
family firms over almost a century (1920’s -
2010), this paper examined the family business
transformation process as family capital
committed to the firm eroded, to identify the
sequence and the causes of the erosion.
By addressing the family capital as most
essential to maintain the family business status,
this paper emphasized the erosion of the
family’s financial capital as the most important
force to cause the transformation, and identified
decision- making during the business expansion
period, separation of ownership and
management, disposal of shares and
resignation from the board of directors as the
major causes for the transformation. Since the
transformation process to the non-family status
is difficult to reverse once occurred, it is critical
for the business family to continue the conscious
effort to maintain family capital to influence its
firm. This paper presented academic, practical
and policy-related implications.
The limitation of the research is the lack of
comparisons with those firms that have
maintained the family firm status until today.
Also, the comparison with family firms’
transformations in other countries is expected
to give universal applicability to the findings of
the paper.
References
Ajinomoto Co. (1972). Ajinomoto
Kabushikikaisha Shashi (Company history
of Ajinomoto Co.). Japan Business History
Institute.
Anderson, R., and Reeb, D. (2003). Founding-
Family Ownership and Firm Performance:
Evidence from the S&P500. The Journal of
Finance, 58 (3), pp.1301- 1327.
Astrachan, J., Klein, S., and Smyrnios, K. (2002).
The F‐PEC scale of family influence: a
proposal for solving the family business
definition problem. Family Business
Review, 15 (1), pp.45-58.
Barney, J. (1991). Special theory forum the
resource-based model of the firm: origins,
implications, and prospects. Journal of
management, 17, pp.99-120.
Berle, A., and Means, G. (1932). The modern
Journal of Japanese Management Vol.1, No.1, November 2016 ISSN 2189-9592
58
corporation and private property. Harcourt
Brace Jovanovich.
Carlock, R., and Ward, J. (2001). Strategic
Planning for the Family Business: Parallel
Planning to Unify the Family and Business.
Palgrave Macmillan.
Chandler, A. (1977). The Visible Hand: The
Managerial Revolution in American
Business. Harvard University Press.
Danes, S., Stafford, K., Haynes, G., and
Amarapurkar, S. (2009). Family Capital of
Family Firms Bridging Human, Social, and
Financial Capital. Family Business Review,
22 (3), pp.199-215.
Ernst Young (2015). Built to last: family
businesses lead the way to sustainable
growth. Retrieved from http://www.ey.com
[Online available: May 30, 2016]
European Commission (2011). Business
dynamics: start-ups, business transfers
and bankruptcy. European Commission.
Gersick, K., Davis, J., and Hampton, M. and
Lansberg, I. (1997). Generation to
Generation: Life Cycles of the Family
Business. Harvard Business School Press.
Goto, T. (2012). Famiri bijinesu: Shirarezaru
jitsuryoku-to kanousei (Family business: its
capability and potential ). Tokyo: Hakuto
shobo.
― (2016). Famiri bijinesu Hakusho 2015
(Family business yearbook 2015). Tokyo:
Doyukan.
Habbershon, T., and Williams, M. (1999). A
resource-based framework for assessing the
strategic advantages of family firms. Family
Business Review, 12 (1), pp.1-25.
Kobayashi, K. (2014). Senji torihikisho tougo-
kara heiji tougo-made: torihikijo
seturitu/kaisan seisaku-no do-to sei
(History of the securities exchange: its
merger during and after WW2 ). Shouken
keizai Kenkyu, 88, pp.1-15.
MassMutual (2008). American Family Business
Survey. Retrieved from https://www.
massmutual.com [Online available: May30,
2016]
Mishima, Y. (1983). Yamaguchi Zaibatsu no
Hatten to Kaitai (The development and the
dissolution of Yamaguchi zaibatsu). Japan
Business History Review, 18 (2), pp.23-51.
Mori, K. (2006). Ogura Masao: Inori-to Keiei
Yamato “Takkyuubin-no chichi” ga
tatakatteita mono (Masao Ogura: Prey and
management: what the Father of Yamato
courier delivery service strived for). Tokyo:
Shougakukan.
Murakami, Y. (2008). Furansu-no jigyou-
shoukei-to jigyou-shoukei siensaku
(Business succession and succession
supporting policies in France). Chosa kiho,
84, pp.15-17.
Nachi-Fujikoshi Corp. (1978). Fujikoshi 50-
shuunenshi (50 years history book of
Fujikoshi).
Nemoto, T. (2007). Doitsu-no famiri bijinesu-
niokeru jigyo-shoukei-no genjou-to kadai
(Business succession of German family
business: current situation and the issues
in Japanese). Chosa kiho, 81, pp.38-63.
Newbauer, F., and Lank, A. (1998). The Family
Business: Its Governance for Sustainability.
New York: Routledge.
Pramodita, S., Salvato, C., and Reay, T. (2014).
Temporal Dimensions of Family Enterprise
Research. Family Business Review, 27 (1),
pp.10-19.
Small and Medium Enterprise Agency (2006)
Chushoukigyou hakusho (White Paper on

Journal of Japanese Management Vol.1, No.1, November 2016 ISSN 2189-9592
59
Small and Medium Enterprises).
Suzuki K. (2013). Nihon no Equity finance no
ayumi (The History of Equity Finance in
Japan). Kokumin Keizai Zasshi, 207 (2),
pp.39-63.
Toyo Keizai Shinposha (1926-1942). Toyo Keizai
Kabusikikaisha Nenkan (Joint-stock
company almanacs).
Wennberg, K., Wiklund, J., Hellerstedt, K., and
Mattias Nordqvist (2011). Implications of
Intra-Family and External Ownership
Transfer Of Family Firms: Short Term and
Long Term Performance. Ratio Working
Paper, No.172, pp.1-50.
Yamaichi Shoken kabusikikaisha (1940-1956).
Kabusikikaisha Nenkan (Joint-stock
company almanacs).
(Received: May 31, 2016)
(Accepted: September 12, 2016)

Journal of Japanese Management Vol.1, No.1, November 2016 ISSN 2189-9592
60
SOCO’s Impact on Individual Sales Performance:
The Mediating Role of Cross-functional Integration
Eunji Seo
Fukuyama-heisei University, Japan
Japan Academy of Business Administration E-mail:[email protected]
Abstract
The effects of sales orientation (SO) and customer orientation (CO) on individual
performance and the mediating effects of cross-functional integration are examined in this
research. The assumption, two types of selling motivation (SOCO) differentially influence
individual performance, is modified by evaluating the mediating role of cross-functional
integration based upon the rationale is that SO emphasizes self-interest whereas CO involves
knowledge sharing and internal communication. Hypotheses are tested with structural equation
modeling using survey data from 236 salespeople in a Japanese industrial company and it is
found that SO directly influenced individual performance but cross-functional integration
completely mediated the relationship between CO and individual performance. Based on these
results, the importance of SOCO both in order to increase upper performance is emphasized and
a new perspective on the cross-functional integration of salespeople is provided.
Keywords
sales orientation, customer orientation, salespeople, Japanese industrial company, integration,
individual performance
(1) Introduction
In the context of increased domestic and
international market competition, the
importance of formulating diverse sales
strategy and managing the behavior of
salespeople has been the focus of considerable

Journal of Japanese Management Vol.1, No.1, November 2016 ISSN 2189-9592
61
academic attention and research interest
(Franke and Park, 2006). Although
satisfaction with and maintenance of long-
term relationships with customers are critical,
firms also pursuit short-term interests even
though in business-to-business transactions.
Therefore, salespeople should adapt diverse
sales strategy with exclusive psychological
orientations.
This study tests that how salesperson-
level sales orientation (SO) and customer
orientation (CO) affect the performance of
those salespeople by evaluating mediating
effect of cross-functional integration behavior.
SO is the degree to which salespeople
prioritize their own needs and/or the needs of
the firm over those of their customers by
attempting to sell as much as possible.
Conversely, CO means that the degree to
which salespeople try to help customers make
purchase decisions to satisfy the needs of the
latter and the extent to which they enjoy
doing so (Saxe and Weitz, 1982; Brown et al.,
1997). Most researches on the selling
behavior of salespeople have usually
discussed SO as being inversely related to CO
(e.g., Saxe and Weitz, 1982). However, SOCO
is not exactly inversed concepts because their
effects to performance unseparated
(Schwepker, 2003). Related empirical
research has reported a positive or a non-
influential relationship between SO and
performance (e.g., Boles et al., 2001; Wachnel
et al., 2009) and has argued for additional
research to test this relationship further by
addressing whether both components of
SOCO have a positive impact on performance
(Wachnel et al., 2009; Goad and Jaramillo,
2014).
In addition, the academic literature
examining SOCO has revealed that this
phenomenon enhances individual sales
performance, but it has ignored the possibility
that the observed effect is the result of
intervening variables. According to a
personality-performance perspective, which
provide a framework for how personality
affects behavior at work, a specific
psychological state affects individual
performance through proactive processes
(Goad and Jaramillo, 2014). As a sales-related
concept, SOCO may affect individual
performance through the activation of a
particular stage of organizational
development, such as integration with other
knowledgeable members. The integration of
salespeople with a variety of functional
members is critical for exchanging
information and activating organizational
learning, which may affect the effectiveness
and ability of a salesperson (Rouzes et al.,
2005). This behavior of salespeople may
reasonably be expected to influence
individual performance. In particular, CO
may prompt the delivery of high customer
value by increasing internal dissemination of
market-related information and enhancing
coordination with other functional members.
By examining the effects of SOCO on
individual performance and investigating the
mediating role of integration, it may be
possible to identify the real effects of SOCO
which clarify their implications for sales
managers.
The remainder of this paper is organized
as follows. First, I discuss the extant
literature on the sales behavior of salespeople
and their integration with other functional

Journal of Japanese Management Vol.1, No.1, November 2016 ISSN 2189-9592
62
members. Then it is developed related
hypotheses. Next, I present the methods used
in our empirical research and discuss the
results. Then the theoretical and managerial
implications of findings are presented. Finally,
it is discussed the limitations of this study
and implications for future research.
(2) Conceptual background
1. Sales motivation of salespeople
Research regarding the sales motivation
of salespeople has developed the SOCO
criterion to estimate the degree to which tasks
are effectively accomplished by salespeople.
The degree of SOCO is important for
organizations because it influences the job-
related attitudes and goals of salespeople
(Schwepker, 2003; Jaramillo et al., 2007).
The SOCO scale incorporates two
subscales: SO (sales-oriented selling) and CO
(customer-oriented selling). The SOCO scale
addresses the following characteristics of a
customer-oriented sales process: the desire to
help customers make satisfactory purchase
decisions, helping customers assess their
needs, offering products that will satisfy
manipulative tactics, and avoiding the use of
high-pressure selling (Saxe and Weitz, 1982).
Based on these assumptions, one line of
research on SOCO has proceeded from the
notion that both types of sales effectiveness
can be investigated using only one
measurement (Pettijohn et al., 2007).
Drawing on the stance that SO should be
limited to encourage CO, several studies have
examined the more effective aspects of the
SOCO approach and the antecedents of the
CO approach in particular (Widmier, 2002).
On the other hand, another line of
research is based on the view that SOCO are
distinct rather than opposite constructs and
that they should be assessed with separate
measures (Guenzi et al., 2011). Specifically,
the antecedents and benefits of CO, such as
job satisfaction, commitment, organizational
citizenship, and the behavior of members,
have been outlined (Cross et al., 2007).
Despite numerous studies have
attempted to identify and explore the
relationship between performance and sales
motivation, no consensus has developed in
this regard (Goad and Jaramillo., 2014).
Indeed, few researchers have focused on SO
as a significant contributor to performance
because they have assumed that SO is
negatively related to organizational outcomes
under the rationale that the use of a primarily
sales-oriented sales strategy involves less
concern for customers’ interests (e.g., Guenzi
et al., 2009). However, the impact of SO on
sales performance remains uncertain
(Schwepker, 2003).
In addition, only a few potential
moderating factors, such as differences in
performance measurements (subjective or
objective) (Jaramillo et al., 2007) and the level
of skill of salespeople (Wachner et al., 2009),
have been examined with regard to the
relationship between SOCO and sales
performance. These studies have shown that
various external and individual factors can
affect the relationship between SOCO and
performance, but the impact of internal
factors, such as integration with other
functional members of the organization, has
not been well studied.
2. Cross-functional integration of salespeople

Journal of Japanese Management Vol.1, No.1, November 2016 ISSN 2189-9592
63
In general, the sale of products and services
is not the exclusive province of marketing or
sales but also involves multiple functional
members (Le Meunier-FitzHugh and Piercy,
2007). Cross-functional integration, a structure
that maximizes a firm’s effectiveness, has been
addressed by three approaches within the
relevant literature: the interaction,
collaboration, and composite perspectives
(Kahn and Mentzer, 1998). According to Kahn
(1996), interaction includes physical activities,
such as meetings, e-mails, telephone calls, and
cross-functional training, whereas collaboration
involves intangible elements, such as mutual
understanding, common vision, and
information sharing or building.
Some empirical research has shown that
collaboration is a feature of successful
performance that promotes market satisfaction
and identifies the behavior that is most
important for new product development (NPD)
(Kahn and Mentzer, 1998; Kahn, 2001).
However, since interaction and collaboration are
closely parallel, the composite perspective has
been accepted, according to the goals of
integration, for discussing cross-functional
integration (Song & Montoya-Weiss, 2001;
Rouzie et al., 2005). In this research,
salesperson’s integration with other functional
members is focused, using “integration” to refer
to the extent of information exchange and
personal interaction. Integration is an internal
option available to salespeople and that it
creates value for customers. The important
functions of integration are discussed in
terms of the cross-functional relationships
related to marketing, such as those involving
R&D (Kahn and Mentzer, 1998), human
resources (Chimhanzi and Morgan, 2005),
and sales (Le Meunier-FitzHugh et al., 2007).
Research in these areas has suggested
that integration is vital to overall
performance on both individual and group
levels. For example, Kahn and Mentzer
(1998) showed that integration among
different functional members has a positive
influence on performance in terms of
department success, overall firm performance,
and NPD because information exchange that
is intrinsic to integration allows members to
reduce uncertainty, thereby facilitating
different types of performance. Similarly, Le
Meunier-FitzHugh and Piercy (2007)
empirically determined that collaboration
between sales and marketing is positively
associated with business performance. At the
individual level, Chimhanzi and Morgan
(2005) found that informal interaction in the
dyadic relationship between marketing and
human resources increases familiarity but
reduces competitiveness by prompting
mutual understanding of others’ personality
traits and preferences. Moreover, Guenzi and
Troilo (2006) showed that salespeople can
foster marketing capability (e.g., marketing
sense, understanding market trends, and
customer relations) by increasing the
relevance of their interactions with
marketing.
(3) Model and hypotheses
The conceptual model, which illustrates
the relationship between constructs, is shown
in Figure 1. Although extant research
suggests that SO by itself negatively affects
customer loyalty and job satisfaction as it
prioritizes short-term interests over customer
satisfaction (Boles et al., 2001; Schwepker,

Journal of Japanese Management Vol.1, No.1, November 2016 ISSN 2189-9592
64
2003), SO is often the most effective sales
strategy for improving individual
performance. Wachnel et al. (2009) reported
that SO directly increased individual sales
performance in B-to-B market settings and
found that this tendency was stronger when
salespeople were less skilled at selling.
Moreover, SO develops certain types of
customer relationships. Boles et al. (2001)
accurately observed that SO was not harmful
for relationships with customers in in-store
retail settings because customers expect
salespeople to engage in selling-oriented
behavior to some degree. Similarly, according
to Singh and Koshy (2011), SO is positively
associated with the development of customer
relationships in the short- or medium-term.
On the other hand, Schwepker (2003) argued
that salespeople are more likely to utilize SO
in an effort to meet relevant demands and
goals when management employs outcome-
based measurements (e.g., financial
performance) to evaluate their performance.
Harries et al. (2005) found that performance
orientation positively influenced SO,
suggesting that highly performance-oriented
salespeople are focused on short-term rather
than long-term success, and that they, in turn,
behave in a way to maximize their extrinsic
rewards. This may imply that when
salespeople adopt a stronger sales-oriented
approach, they increase their attention to the
act of selling itself and place the highest
priority on finding effective methods for
increasing performance. These discussions
show that SO is influential in increasing sales
performance. Building on the aforementioned
theoretical and empirical foundations, first
hypothesis is as follows:
H1. Sales orientation positively affects
individual sales performance.
CO is considered as a long-term sales
approach. Various studies have shown that
CO improves individual performance by
encouraging salespeople to focus on
increasing long-term customer satisfaction
and avoiding behaviors that may lead to
customer dissatisfaction (Franke and Park,
2006; Boles et al., 2001; Arndt and Karande,
2012). Franke and Park (2006) argued that a
customer-oriented salesperson finds the
process of satisfying customers’ needs to be
intrinsically pleasing. Cross et al. (2007) also
showed a positive effect of CO on performance.
Their rationale was that a salesperson is
often the only representative of the
organization to interact with the customer,
and the individual salesperson’s focus on
satisfying customer needs is therefore a
crucial subject of inquiry. Moreover,
salespeople who have a high-CO approach
tend to build stronger customer relationships
(Bole et al., 2001). Such relationships lead to
more frequent repeat sales, more word-of-
mouth referrals, and overall, a more desirable
image for the selling firm.
H2. Customer orientation positively
affects individual sales performance.
Improved information flow and flexibility
of responses by team members can allow
resources to be quickly and easily disengaged
from unproductive uses and applied to new
opportunities (Ford and Randolph, 1992). By
transmitting information and interacting
with members who work in complementary
functions, salespeople are more likely to
increase their product knowledge and
effectively control their schedules. Moreover,

Journal of Japanese Management Vol.1, No.1, November 2016 ISSN 2189-9592
65
Figure 1. Conceptual model and hypothesized relationships
Note: SO=sales orientation, CO=customer orientation
CI=cross-functional integration, P= salespersons’ performance
a network can supplement an individual’s
ability to respond well to new challenges
when that individual knows from whom to
seek information or expertise (Cross and
Cumming, 2004). In this regard, salespeople
who are more aware of other functional
members’ expertise are likely to contact the
right people at the right time when
information and technical support is required
for their tasks. Based on these considerations,
the following hypothesis is developed:
H3. Cross-functional integration
positively affects individual sales
performance.
This research proposes that SO is
negatively related to integration with other
functional members. Because SO emphasizes
that a salesperson’s self-interest over that of
customers, it is stimulated by the general
output evaluation systems of organizations
(Sujan et al., 1994). Auh and Menguc (2013)
reported that a reward practice that links pay
increases to performance is negatively related
to knowledge-sharing behaviors. This
relationship involves a self-interested
perspective that holds that “people choose
after assessing the probable gains and losses
in well-being from a set of alternative actions”
(Knoke, 1990, p. 31). When knowledge
sharing with other functional members is not
part of a formal job description, it is difficult
to motivate self-interested salespeople
because they engage primarily in efforts to
achieve rewards.
H4. Sales orientation negatively affects
cross-functional integration.
Customers in B-to-B contexts require a
full array of services, including help with
problem-solving processes and efforts to
increase the productivity of their sales force
(Leigh and Marshall, 2001). Therefore, the
role of salespeople is increasingly associated
with account management and solution
development. For example, Storbacka et al.
(2009, p. 982) argued that “for salespeople to
succeed in a servitised sales process they
require knowledge held not just by marketing
but also by operations and finance, resulting
in the need for greater internal
communication.” This means that, for
SO
CO
CI P
H1
H2
H3
H4
H5

Journal of Japanese Management Vol.1, No.1, November 2016 ISSN 2189-9592
66
salespeople who emphasize customer
satisfaction, integration with other functional
members is especially important to their
ability to perform their fundamental role;
thus, CO is likely to motivate salespeople to
interact or collaborate with other functional
members.
H5. Customer orientation positively
affects cross-functional integration.
(4) Research methodology
1. Sample and measure
This study was conducted in a company
whose sales of individual services and
products involved real state and auto and
financial insurance. I chose this special
company because its salespeople are
motivated to accept SOCO approaches, and
they are generally integrated with other
functional members. In total, 382
questionnaires were distributed, and 236
salespeople, including sales managers,
responded, reflecting a response rate of
61.78%. Scales for measuring SOCO,
integration, and individual performance were
adapted from previous research for this study.
Likert scales, ranging from one to indicate
“not at all” to five to indicate “a lot,” were used.
Based on Wachner et al. (2009), SO was
measured with a three-item index, as shown
in Table 1. It is modified these measures from
those used by Wachner et al. (2009) to reflect
the short-term transactional emphasis on
superior financial performance of SO. It is
modified instruments drawn from those used
by Thakor and Joshi (2005) to measure CO. In
addition, integration with other functional
members, which was referenced by Kahn and
Mentzer (1998), is included. Finally,
individual performance was measured using
two items developed by Churchill, Ford,
Hartley, and Walker (1985) to emphasize the
view of performance in the sales role. All
items measured self-reported performance
relative to other salespeople.
2. Results
2.1 Measurement model
The validity and dimensionality of our
reflective constructs are assessed by
performing a confirmatory factor analysis
(CFA). CFA model addressed SO (three items,
α= .706), CO (four items, α= .732), integration
(four items, α= .835), and performance (two
items, α=.912). The model showed an
acceptable fit with the data, with a χ2 value of
135.609 (df = 59, p< .001), a comparative fit
index (CFI) of .941, an adjusted goodness-of-fit
index (AGFI) of .872, and a root mean square
error of approximation (RMSEA) of .074. These
data imply that the fit of the model was good.
Item loadings are presented in Table 1. One
item related to cross-functional integration had
a low loading, <.5 is founded, it is accepted
because it is necessary to directly estimate how
salespeople perceive the possibility as to
integrate with other functional members.
Moreover, the overall composite reliability and
average variance extracted (AVE) were strong
for all latent variables, as shown in Table 2.
Because the square root of the AVE for each
construct was greater than the correlation
between any pair of constructs in the
measurement model, all model constructs
exhibited discriminant validity with respect to
the standard.
In addition, a Harman’s one-factor tests
performed on the four conceptually crucial

Journal of Japanese Management Vol.1, No.1, November 2016 ISSN 2189-9592
67
variables in our research model: SO, CO, cross-
functional integration, and individual
performance (Podsakoff, MacKenzie, Lee, &
Pdsakoff, 2003). Results from this test showed
that four factors were present and that the most
covariance explained by one factor was 28.62%.
This suggests that our data sample was most
likely not contaminated by common method bias.
2.2. Structural model
To test hypotheses related to the structu-
Table 1. Variables and measures
Table 2. Descriptive statistics and correlations
Scale items
Model
Estimate*
Sales orientation
SO1 when a company appraises salespeople, only financial performance has to be
considered.
.474
SO2 I try to focus attention on the degree of sales performance compared with
others
.828
SO3 high sales performance is more important than how to accomplish it .657
Customer orientation
CO1 It is important to fully understand the customer's needs .573
CO2 I try to determine how I can satisfy customers .794
CO3 I try to determine how I can best help the customer solve his/her problem .674
CO4 I spend much of my time listening to the customer talk about his/her firm's
needs
.557
Cross-functional integration
CL1 the integration between sales and other functions is possible .351
CL2 critical information is shared between colleagues with different functions .901
CL3 I am actively gathering information from colleagues with different
functions
.859
CL4 I frequently exchanges information with other functional members .922
Individual Performance
P1 the degree to which the salesperson commits to the target sales figure .943
P2 the sales figures are achieved .889
Composite
reliability
AVE 1 2 3 4
1.Sales orientation 0.74 0.50 1
2.Customer orientation 0.86 0.61 -.009 1
3.Cross-functional integration 0.88 0.67 .034 .245** 1
4.Individual performance 0.92 0.84 .285** .074 .322** 1

Journal of Japanese Management Vol.1, No.1, November 2016 ISSN 2189-9592
68
Table 3. Structural model estimates
Structural paths
Path Estimate
(t-value)
Sales orientation → Cross-functional integration 0.13(1.20)
Customer orientation → Cross-functional integration 0.67(3.37)***
Cross-functional integration → Individual performance 0.28(4.08)***
Sales orientation → Individual performance 0.63(5.11)***
Customer orientation → Individual performance 0.05(0.30)
*p < 0.05; **p < 0.01; and ***p < 0.001
ral model, AMOS is used to examine model;
the fits of the models (χ2 = 135.609, d.f. = 59,
p < 0.001; CFI = 0.941; TLI = 0.923; and
RMSEA = 0.074) were good. In terms of the
effects of direct paths, four of the six
relationships directly supported three of our
hypotheses as shown in Table 3. Specifically,
H1, which addresses the direct effect of SO on
individual performance, was supported. The
parameter estimate for the path was 0.627 (t
= 5.112). H5, which also addresses the direct
effect of CO on cross-functional integration,
was supported, and the parameter estimate
for the path was 0.670 (t = 3.365). In addition,
H3, which deals with the direct effect of cross-
functional integration on individual
performance, was supported, and the
parameter estimate for the path was 0.284 (t
=4.082). The other two structural parameters
were non-significant; therefore, H2 and H4
were not supported in our model.
(5) Discussion
1. Theoretical and managerial implications
This research investigated the impact of
SOCO on the individual performance of
salespeople because most extant research on
the sales motivation of salespeople has
underscored the positive effects of CO and
neglected the impact of SO. It is also studied
the direct and mediating effects of integration
with other functional members on individual
performance. These findings contribute to
existing knowledge about sales organization.
First, this research clarified how and why
SOCO affects individual performance by
showing that cross-functional integration
mediates the effects of CO on individual
performance. A significant result is that SO
directly increases sales performance, but that
CO indirectly increases it by prompting
interaction and activities with individuals
with different areas of exert knowledge.
This finding underscores the differences
between the two components of SOCO,
although previous research has reported that
both positively influence performance (e.g.,
Bole et al., 2001).
In terms of function, the relevant
literature has shown that CO stimulate
innovativeness and information sharing
(Lukas and Ferrell, 2000). For example,
Lukas and Ferrell (2000) empirically showed
that CO increases the introduction of new-to-

Journal of Japanese Management Vol.1, No.1, November 2016 ISSN 2189-9592
69
the-world products and reduces the number
of me-too products launched. Moreover, Foss
et al. (2011) reported that interaction with
customers promotes the increased internal
communication through delegating
responsibility in the organization. Our study
advances knowledge in this regard by
suggesting that CO increases the
performance of salespeople through their
innovative behavior, such as interacting with
other functional members and improving the
value of their products and services by
adopting a variety of perspectives.
From this perspective, it is possible that
these two psychological states will lead to
different customer service and products.
Services and products provided from CO are
likely be more higher quality than those
provided from SO, as the former involves
efforts to achieve superior customer value
that derive from a combination of different
perspectives and areas of expertise. This
expectation should be discussed in further
research. Second, our study expands on prior
research regarding cross-functional
integration by showing that personal CO
stimulates this phenomenon. Internal and
external facilitators, such as reward
procedures, top management support, and
environmental uncertainty have been
identified as antecedents to cross-functional
integration (e.g., Rouziès et al., 2005; Guenzi
and Trolo, 2006). This research advances
knowledge in this domain by suggesting that
CO is critical for upper-tier cross-functional
integration on the individual level and that
the antecedents of cross-functional
integration should be further explored.
Finally, considering that few studies have
been conducted outside the United States and
it is possible that this behavior has different
effects in other countries (Guenzi et al., 2011),
this research on salespeople in an industrial
company of Japan contributes to expanding
the existing knowledge on SOCO and its
consequences outside the United States.
Findings of this research have
managerial implications for sales managers
and marketing executives. They should
encourage salespeople to adopt both selling
approaches and to adapt their management
style in terms of salesforce selection, training,
motivation, reward, and control systems
accordingly (Weitz and Bradford, 1999).
Although the importance of shifting
strategies from hard selling to smart selling
has been asserted (Guenzi, 2011), salespeople
are still expected to attain short-term sales
results in a competitive market. Achievement
of superior short-term performance requires
that the work and training curriculum of
salespeople be based on sales. This may be
more critical for salespeople who naturally
prioritize the long-term prospective customer
over short-term compensation. At the same
time, salespeople with a high SO should also
be encouraged to increase their integration
with other functional members, such as R&D,
marketing, and manufacturing personnel.
For example, the use of cross-functional
teams with common financial goals may be
effective in this regard (Rouziès et al., 2005).
In summary, sales managers must coach and
support salespeople in attempts to maintain
high levels of both components of SOCO and
facilitate opportunities for salespeople,
especially those with high SO, to interact
with colleagues with different knowledge

Journal of Japanese Management Vol.1, No.1, November 2016 ISSN 2189-9592
70
bases.
2. Limitations and future research
Examinations of the additional
conditions that reduce the negative
dimension of SO and increase motivation for
short-term performance will be critical.
Although SO has a positive effect on
individual performance as our findings
suggest, it also presents considerable
challenges, such as reducing customer loyalty,
endangering the job satisfaction of
salespeople, and fostering low levels of
learning orientation (Boles et al., 2001;
Schwepker, 2003; Harries et al., 2005); thus,
this topic requires more discussion and
careful consideration. Moreover, we used
individual performance as the consequence of
SOCO, which was measured by self-
assessments completed in terms of
comparison with colleagues. Future research
should rely on objective data, which may be
more effective for estimating individual
effectiveness because it is likely that workers
to do not have accurate information about
their colleagues’ performance.
References
Arndt, Aaron. D., and Karande, Kiran (2012).
Is It Better for Salespeople to have the
Highest Customer Orientation or a
Strong Fit with Their Group’s Customer
Orientation? Findings from Automobile
Dealerships. Journal of Retailing and
Consumer Services, 19, pp. 353-359.
Auh, Seigyoung., and Menguc, Bulent (2013).
Knowledge Sharing Behaviours of
Industrial Salespeople: An Integration of
Economic, Social Psychological, and
Sociological Perspectives. European
Journal of Marketing, 47, pp. 1333-1355.
Boles, James. S., Babin, Barry. J., Brashear,
Thomas. G., and Brooks, Charles (2001).
An Examination of the Relationships
between Retail Work Environments,
Salesperson Selling Orientation-
Customer Orientation and Job
Performance. Journal of Marketing
Theory and Practice, 9(3), pp. 1-13.
Brown, Steven. P., Cron, William. L., and
Slocum Jr, John, W. (1997). Effects of
Goal-Directed Emotions on Salesperson
Volitions, Behavior, and Performance: A
Longitudinal Study. Journal of
Marketing, 61, pp. 39-50.
Chimhanzi, Jacqueline, and Morgan, Robert.
E. (2005). Explanations from the
Marketing/Human Resources Dyad for
Marketing Strategy Implementation
Effectiveness in Service Firms. Journal
of Business Research, 58, pp. 787-796.
Churchill Jr, Gilbert. A., Ford, Neil. M.,
Hartley, Steven. W., and Walker Jr,
Orville. C. (1985). The Determinants of
Salesperson Performance: A Meta-
Analysis. Journal of marketing research,
22(2), pp. 103-118.
Cross, Rob, and Cummings, Jonathon. N.
(2004). Tie and Network Correlates of
Individual Performance in Knowledge-
Intensive Work. Academy of Manage-
ment Journal, 47, pp. 928-937.
Cross, Mark. E., Brashear, Thomas. G.,
Rigdon, Edward. E., and Bellenger,
Danny. N. (2007). Customer Orientation
and Salesperson Performance. European
Journal of Marketing, 41, pp. 821-835.
Ford, Robert. C., and Randolph, W. Alan

Journal of Japanese Management Vol.1, No.1, November 2016 ISSN 2189-9592
71
(1992).
Cross-functional Structures: A Review
and Integration of Matrix Organization
and Project Management. Journal of
management, 18, pp. 267-294.
Foss, Nicolai. J., Laursen, Keld, and
Pedersen, Torben (2011). Linking
Customer Interaction and Innovation:
The Media-ting Role of New
Organizational Practices, Organization
Science, 22(4), pp. 980-999.
Franke, George. R., and Park, Jeong-Eun
(2006). Salesperson Adaptive Selling
Behavior and Customer Orientation: A
Meta-Analysis. Journal of Marketing
Research, 43(4), pp. 693-702.
Goad, Emily. A., and Jaramillo, Fernando
(2014). The Good, the Band and the
Effective: A Meta-Analytic Examination
of Selling Orientation and Customer
Orientation on Sales Performance.
Journal of Personal Selling & Sales
Management, 34(4), pp. 285-391.
Guenzi, Paolo, and Troilo, Gabriele (2006).
Developing Marketing Capabilities for
Customer Value Creation Through
Marketing-Sales Integration. Industrial
Marketing management, 35(8), pp. 974-
988.
Guenzi, Paolo, Georges, Laurent, and Pardo,
Catherine (2009). The Impact of
Strategic Account Managers’ Behaviors
on Relational Outcomes: An Empirical
Study. Industrial Marketing Manage-
ment, 38(3), pp. 300-311.
Guenzi, Paolo, De Luca, Luigi. M., and Troilo,
Gabriele (2011). Organizational Drivers
of Salesperople’s Customer Orientation
and Selling Orientation. Journal of
Personal Selling & Sales Management,
31(3), pp. 269-285.
Jaramillo, Fernando., Ladik, Daniel. M.,
Marshall, Greg. W., and Mulki, Jay.
Prakash (2007). A Meta-Analysis of the
Relationship between Sales Orientation-
Customer Orientation (SOCO) and
Salesperson Job Performance. Journal of
business & Industrial marketing, 22(5),
pp. 302-310.
Kahn, Kenneth. B. (1996). Interdepartmental
Integration: A Definition with Implica-
tions for Product Development Perfor-
mance, Journal of Product Innovation
Management, 13(2), pp. 137-151.
Kahn, Kenneth. B. (2001). Market
orientation, interdepartmental integra-
tion, and product development perfor-
mance. Journal of Product Innovation
Management, 18(5), pp. 314-323.
Kahn, Kenneth. B., and Mentzer, John. T.
(1998). Marketing’s integration with
other departments, Journal of Business
Research, 42(1), pp. 53-62.
Knoke, David (1990), Organizing for
Collective Action: The Political
Economies of Associations, in Rossi, P.H.,
Useem, M. and Wright, J.D. (Eds), Social
Institutions and Social Change, Aldine
de Gruyter, New York, NY, pp. 27-45.
Le Meunier-FitzHugh, Ken, and Piercy, Nigel.
F. (2007). Exploring Collaboration
between Sales and Marketing. European
Journal of Marketing, 41(7/8), pp. 939-
955.
Leigh, Thomas. W., and Marshall, Greg. W.
(2001). Research Priorities in Sales
Strategy and Performance. Journal of
Personal Selling & Sales Management,

Journal of Japanese Management Vol.1, No.1, November 2016 ISSN 2189-9592
72
21(2), pp. 83-93.
Lukas, Bryan. A., and Ferrell, O. C. (2000).
The Effect of Market Orientation on
Product Innovation. Journal of the
Academy of Marketing Science, 28, pp.
239-247.
Pettijohn, Charles. E., Pettijohn, Linda. S.,
and Taylor, A. J. (2007). Does
Salesperson Perception of the
Importance of Sales Skills Improve Sales
Performance, Customer Orientation, Job
Satisfaction, and Organizational
Commitment, and Reduce Turnover?
Journal of Personal Selling & Sales
Management, 27(1), pp. 75-88.
Podsakoff, Philip. M., MacKenzie, Scott. B.,
Lee, Jeong-Yeon, and Podsakoff, Nathan.
P. (2003). Common Method Biases in
Behavioral Research: A Critical Review
of the Literature and Recommended
Remedies. Journal of Applied Psychology,
88(5), pp. 879-903.
Rouziès, Dominique., Anderson, Erin., Kohli,
Ajay. K., Michaels, Ronald. E., Weitz,
Barton. A., and Zoltners, Andris. A.
(2005). Sales and Marketing Integration:
A Proposed Framework. Journal of
Personal Selling & Sales Management,
25(2), pp. 113-122.
Saxe, Robert, and Weitz, Barton. A. (1982).
The SOCO Scale: A Measure of the
Customer Orientation of Salespeople.
Journal of marketing research, 19(3), pp.
343-351.
Schwepker Jr. Charles. H. (2003). Customer-
Oriented Selling: A Review, Extension,
and Directions for Future Research,
Journal of Personal Selling & Sales
management, 23(2), pp. 151-171.
Song, Michael, and Montoya-Weiss, Mitzi. M.
(2001). The Effect of Perceived
Technological Uncertainty on Japanese
New Product Development. Academy of
Management Journal, 44(1), pp. 61-80.
Storbacka, Kaj., Ryals, Lynette., Davies, Iain,
and Nenonen, Suvi. (2009). The
Changing Role of Sales: Viewing Sales as
a Strategic, Cross-Functional Process.
European Journal of Marketing, 43(7/8),
pp. 890-906.
Singh, Ramendra, and Koshy, Abraham.
(2011). Does Salesperson’s Customer
Orientation Create Value in B2B
Relationships? Empirical Evidence from
India. Industrial Marketing Manage-
ment, 40(1), pp. 78-85.
Sujan, Harish., Weitz, Barton. A., and Kumar,
Nirmalya. (1994). Learning Orientation,
Working Smart, and Effective Selling.
Journal of Marketing, 59(3), pp. 39-52.
Thakor, Mrugank. V., and Joshi, Ashwin. W.
(2005). Motivating Salesperson Custo-
mer Orientation: Insights from the Job
Characteristics Model, Journal of
Business Research, 58(5), pp. 584-592.
Wachner, Trent., Plouffe, Christopher. R., and
Grégoire, Yany. (2009). SOCO’s Impact
on Individual Sales Performance: The
Integration of Selling Skill as a Missing
Link. Industrial Marketing Management,
38(1), pp. 32-44.
Weitz, Barton. A., and Bradford, Kevin. D.
(1999). Personal Selling and Sales
Management: A Relationship Marketing
Perspective. Journal of the academy of
marketing science, 27(2), pp. 241-254.
Widmier, Scott. (2002). The Effects of
Incentives and Personality on

Journal of Japanese Management Vol.1, No.1, November 2016 ISSN 2189-9592
73
Salesperson’s Customer Orientation.
Industrial Marketing Management,
31(7), pp. 609-615.
(Received: May 31, 2016)
(Accepted: September 16, 2016)

Publisher: JFMRANovember 2016