Embed Size (px)
Citation preview


Journal of Innovation Management in Small and
Medium Enterprise Vol. 2016 (2016), Article ID 725886, 46 minipages.
DOI:10.5171/2016.725886
www.ibimapublishing.com
Copyright © 2016. Farhad Nejadi, Ezutah Udoncy Olugu and Salwa
Hanim Abdul-Rashid. Distributed under Creative Commons CC-BY
4.0

Research Article
Investigation on Quality Conformance: A Case Study on
Electrical and Electronic SME Industries in Malaysia Authors
Farhad Nejadi, Ezutah Udoncy Olugu and Salwa Hanim Abdul-
Rashid
Centre for Product Design and Manufacturing, Department of Mechanical
Engineering, Faculty of Engineering, University of Malaya, Kuala Lumpur,
Malaysia
Received date: 12 October 2015;
Accepted date: 31 December 2015;
Published date: 15 June 2016
Academic Editor: Joriah Muhammad

Cite this Article as: Farhad Nejadi, Ezutah Udoncy Olugu and
Salwa Hanim Abdul-Rashid (2016), “Investigation on Quality
Conformance: A Case Study on Electrical and Electronic SME
Industries in Malaysia”, Journal of Innovation Management in
Small and Medium Enterprise, Vol. 2016 (2016), Article ID
725886, DOI: 10.5171/2016. 725886

Abstract
The level of quality management implementation is defined
based on the enterprises’ vision for the future. Since today's
electrical and electronic industries are supposed to have high-
tech enterprises, it is sensible to periodically assess them in
terms of level of quality management through empirical studies.
There is hardly any study that extensively investigates the
relevant factors which contribute into quality conformance level
in electrical and electronic industries. Also there is no study that
investigates the differences and similarities between electrical
industry and electronic industry in terms of obstacles of
implementation. Seven hypotheses are generated based on
extensive literature review in order to intensively analyze the
impacts of firm's size, ISO certification standards and length of

quality management maturity on quality conformance
comprehensively. The data were collected from 187 small and
medium size electrical and electronic industries in Malaysia. This
empirical study has been conducted using online survey
methodology. This study illustrates the results of statistical
techniques which are used in order to investigate the
correlations and interaction of contributed factors into quality
conformance, investigation of the purpose of quality
management implementation and comparison of obstacles
between electrical and electronic industries in Malaysia. Findings
of this study emphasized that ISO certification standards and
adoption of quality maturity practices can significantly affect the
quality conformance. It is noticeably stressed that the low to
moderate response rate of responses and restricted access to

numeric data related to quality conformance can be considered
as limitations of this study.
Keywords: Quality conformance; SMEs; ISO; Obstacles.
Introduction
Many organizations have implemented QM principles for quality
improvement. Quality management improves competitiveness as
well as productivity and reduces negative impacts of challenges
(Yamada et al, 2013). Currently, many enterprises struggle to
compete for the global business market status (Fekete, & Bocskei,
2011). Thus, it is always one of the critical challenging decisions
for manufacturing managers to employ efficient quality initiators
towards attaining organizational excellence.
One of the thrusts impacted to competitiveness is ASEAN Free
Trade Agreement (AFTA). Ahmad et al., (2014) stated that
globalization, capital movement and trade liberalization within
the framework of AFTA have led to extremely challenging

environment for Malaysian organizations to compete in open
markets. They observed that AFTA circumstance is not favorable
news for local industries, which has less competitive advantage
subsidizing in business in contrast with overseas enterprises.
SMEs’ today need to learn how to interconnect customers along
with their expectations (Ošenieks & Babauska, 2014). To
overcome this, some organizations utilize improvement process
through the ISO certification link to the TQM framework to
ensure quality and enhancement of the process (Lai & Cheng,
2003). In Malaysia, the level of quality in process and
performance of electrical and electronic industries has been
measured and observed to be lower than expected to attain the
high tech enterprises view of 2020 (Best & Rasiah, 2003; Idris et
al., 1996). Also, some studies investigate quality management
practices in electrical and electronic industries (Agus, 2005),

Malaysian organizations (Eng & Yusof, 2003; Ismail et al., 1998),
size of organization (Price & Chen, 1993), years of adoption
(Ahire, 1996) but there is a few empirical studies conducted on
electrical and electronic industries in Malaysia stated by Abdullah
et al. (2008). In addition there is no study that comprehensively
examines all possible variables affecting performance, their
correlations and interactions.
This study supports understanding to what extent factors such as
size of organization, ISO certification standards and adoption of
quality maturity contribute into their performance achievement
throughout TQM framework. It is believed that the outcomes of
the study would effectively help electrical and electronic
enterprises especially local organizations in their efforts to be
ahead and be sustaining at a competitive level in the market in
the future. It might be helpful to Malaysian SMEs to survive from
the negative impacts of AFTA and attain the high-tech level in
2020.
Literature review
The reasons for selecting quality conformance as the main extent
in this study are: It is measureable as cited in some TQM
empirical studies (Arumugam et al., 2008; Prajogo & Sohal, 2006;
Yang, 2006; Ahire et al., 1996; Flynn et al., 1994). Another reason
is that, quality performance is used as a measure in MBNQA
model as quality result. World-wide many researchers accepted
MBNQA model which represents TQM practices (Prajogo & Sohal,
2004; Dean & Bowen, 1994). Finally, measuring through quality
conformance is strongly stressed by experts in content validity of

questionnaire. Since there is the fact that ISO standards has
similarity in terms of structure as well as dissemination
processes (Corbett & Kirsch, 2001; Corbett, 2006; Marimón, et al.,
2006; Molina-Azorín, et al, 2009), it is sensible to jointly analyses
the effects of ISO 9001, ISO 14001 and ISO 27001 on quality
conformance indicated by industry experts in this study.
Based on extensive literature review, it is found that in different
industries and regions of the world, different obstacles arise. Jun
et al. (2004), Kaynak (2003) and Whalen & Rahim (1994)
believed that even though top management support is crucial, the
lack of leadership engagement as well as shortage of proper
training definitely leads organization to unsuccessful status in
QM program. In addition to this concern, Yamada et al. (2013)
stated that plentiful bureaucracy of implementation in Brazil can

result into failure of QM implementations. However, in addition
to top management leadership and proper training, Tari &
sabater (2004) observed that lack of knowledge about quality
tools and practices is an essential issue to consider in QM
implementation in Spain. Masters (1996) listed a wide range of
barriers which if properly managed can lead to TQM success. He
listed the barriers as: Lack of management commitment, weak
comprehension of quality management, inability to change
organizational cultures, lack of quality planning, lack of training
and lack of resources. Adebanjo & Kehoe (1998) stated that QM
obstacles can be seen as a quality culture in implementing QM
progress. The following obstacles is provided by Adebanjo &
Kehoe (1998) which concentrate on communicational issues and
cultural matters; Lack of measurement system, lack of training to
enhance employees’ skills involving quality improvement

activities, lack of communication with customer, lack of supplier
involvement and lack of teamwork. Considering studies
conducted in Malaysia, Ooi et al. (2012) figured out that culture
of organizations can be a critical issue in TQM implementation of
Malaysia’s manufacturing organizations.
Methodology
The data of this study were collected through online survey
sending via email. The electrical and electronic SMEs in Malaysia
were considered as target population. The construction of this
survey was generated after extensive literature review and
conducting some field interviews with experts in electrical and
electronic industries in Malaysia in order to testify the impacts of
firm’s size, ISO certification standards and length of quality

management maturity on quality conformance. It was
emphasized by experts that ISO 9001, ISO 14001 and ISO 27001
have been agreed to be effective on quality conformance in this
particular industry. Prior to data analyses, factors such as
reliability, validity and normality of the entire data and variables
must be strictly examined (Landau & Everitt, 2004). The next
section will therefore attempt to ascertain the validity, reliability,
etc of the study.
Content validity, response rate, Reliability and Construct
validity
After developing the survey, a pilot study was conducted to
assess the content validity. For this purpose, 15 questionnaires
were distributed to academician and industry experts. The

response rate of 40% was achieved. Hence, it is believed that
content validity was achieved. The total number of 872 small and
medium size (SMEs) electrical and electronic companies involved
in export trading was selected from the Federation of Malaysia
Manufacturing (FMM) website of company listing. The online
survey was developed based on literature review and was sent to
the companies through emails. At first, 135 responses were
received. For the purpose of improving the response rate,
reminder follow up emails were sent to companies. By this
action, the number of respondents increased to 187. In total, the
response rate of 21.44% was obtained. In comparison with the
response rate obtained in studies by the scope of Malaysia, Jusoh
et al. (2008) achieved 12.3%, Ahmed et al. (2004) obtained 9.1%
and Ahmed & Hassan (2003) achieved 12.3%. Jusoh et al. (2008)
stressed that low response rate is not wondering in Malaysia for

postal surveys. Therefore, it is believed that 21.44% is
sufficiently enough to start analysis of the data. To ensure the
reliability of survey instrument, Cronbach’s alpha is utilized to
assess and evaluate the reliability by using SPSS 20. Any item
which is lower than 0.7 must be dropped. Through the analysis
conducted on CSFs of implementation, Cronbach value of 0.799,
0.743, 0.835 and 0.853 were obtained for CSFs in these industries
and obstacles in electrical and electronic industries respectively.
These values are higher than 0.7 which is a critical value. Thus,
no item is deleted. For the purpose of validity test, Kaiser-Meyer-
Olkin (KMO) measurement of sampling adequacy (KMO) test was
performed. The value of 0.639, 0.577, 0.652 and 0.562 were
obtained for electrical and electronic industries respectively.
KMO values more than 0.5 shows that the survey is valid.

Normality test
Normality test was conducted to ascertain whether the data are
based on normal distribution. The parametric tests must be
conducted on normal data and non-parametric tests run on non-
normal data (Landau & Everitt, 2004). Thus, the following
hypothesis is generated.
H1: The data are normally distributed.
Normality test is conducted on all the data variables collected
through survey. Since the sample size is less than 2000, the
Shapiro-Wilk value is considered. Since (Sig. < α), the null
hypothesis (H1) is rejected and the data are not normally
distributed. Therefore, the action was taken to make the data

normal. Through transformation of computed variable, Lg 10
function was used. After testing the transformed data, it was
observed that, the data are not normally distributed. Since the
data are not normal, thus the non-parametric tests must be
conducted on all the data of this study. Fig 1 demonstrates the
overall research design overview based on non-parametric tests
as well as comparisons.
Please See Figure 1 in the PDF Version
Results and discussion
Data collected and assessed form several hypotheses and series
of statistical tests using SPSS 20.

Association of variables in electrical and electronic
industries
Success rate, ISO, Size, Type of industry and adoption length are
defined as categorical variable in this study. The most common
method to summarize two categorical observations is drawing
and analyzing Contingency tables (Landau & Everitt, 2004). To
test hypotheses related to association between factors, the
Pearson-Chi square and crosstabs were performed.
H2a: There is no evidence of association between size categories
and type of industry.
H2b: There is no evidence of association between adoption
categories and type of industry.
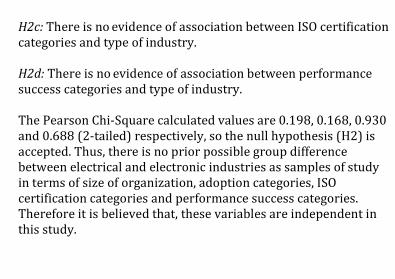
H2c: There is no evidence of association between ISO certification
categories and type of industry.
H2d: There is no evidence of association between performance
success categories and type of industry.
The Pearson Chi-Square calculated values are 0.198, 0.168, 0.930
and 0.688 (2-tailed) respectively, so the null hypothesis (H2) is
accepted. Thus, there is no prior possible group difference
between electrical and electronic industries as samples of study
in terms of size of organization, adoption categories, ISO
certification categories and performance success categories.
Therefore it is believed that, these variables are independent in
this study.
Data analysis of performance success rate
As the categorical variables in this study are independent
variables, it is therefore sensible to find out whether categorical
variables predict performance success or not in electrical and
electronic industries. In other words, it was analyzed that
performance success is related to other categorical variables in
this study. So the hypotheses generated are as follows:
H3: There is no evidence of significant correlation between
quality performance success and adoption, ISO and Size in
electrical and electronic industries.
For this purpose, the Spearman value must be calculated to
assess whether there is any correlation between performance

success and other independent variables. Since there are
correlations in some extent between adoption and ISO. Landau, &
Everitt (2004) stated that when there are correlations in some
extents, it is helpful to run partial correlation coefficients. It
measures the strength of individual linear relationship between
quality performance and other variables individually. So the
hypothesis is broken down into 2 sub-hypotheses.
H3a: There is no evidence of significant correlation between
quality performance success and adoption in electrical and
electronic industries.
H3b: There is no evidence of significant correlation between
performance success and ISO in electrical and electronic
industries.

After run of partial correlation between performance success and
adoption, and sig. < α, so the null hypothesis (H3a & H3b) is
rejected. Therefore there is a significant correlation between
performance success and adoption by strength of 0.463 and
0.429 respectively. The correlation increased from 0.435 to 0.463
and from 0.410 to 0.429 after run of partial correlation for H3a
and H3b respectively. The reason could be that part of the
relationship being attributed to ISO and Size variables.
Interaction of ISO and adoption on quality performance
success
To extensively analyze the effects of ISO and adoption on quality
conformance success, it is needed to run factorial design. For this
purpose, the hypothesis was generated to find out how the length

of QM practices’ adoption and ISO can affect the mean of
performance success. To test the hypothesis, general linear
model is performed. It is determined that length of adoption has
been defined by 3 levels, while the ISO has been defined by 6
different levels.
H4: There is no evidence of interaction between adoption and ISO
on performance success.
H5: The mean of quality performance success is equal between
ISO certification levels.
H6: The mean of quality performance success is equal between
years of adoption groups.

As shown in Table 1, since the Sig. = 0.854 > α, so the null
hypothesis (H10) is accepted and there is no significant
interaction between adoption and ISO through affecting
performance success. Similarly, since Sig. < α, thus it implies that
the mean of performance success differs between the levels of
ISO certification. Likewise, since Sig. < α, thus it implies that the
mean of performance success differs based on the length of QM
practices’ implementation. Therefore, the pairwise comparison is
needed for variables of ISO and years of QM practices adoption to
analyze how the mean of conformance success differs between
individual levels.
Estimation of success rate through ISO certification
Even though p-value is important to identify major effects, it is
generally advised to quantify the effects through constructing

confidence intervals (Landau, & Everitt, 2004). As the ISO has
significant effects on conformance success and there is no
interaction, it is sensible to estimate the differences in the mean
of conformance success among ISO certification levels. It is
noticeable that SPSS only offers comparison between levels
where there is no interaction. In other words, only factors that do
not have interaction with each other must be used (Landau, &
Everitt, 2004).
Based on the estimates of success through ISO, the highest mean
is obtained by the category of all ISO levels by the mean of 4. The
lowest mean conformance success is obtained by non-ISO
certification companies by the mean of 2.580. It is clear that,
through attaining ISO certifications the mean of quality
performance success improves from 2.580 to 4.

According to Pairwise Comparisons of success and ISO, as
comparison of non-ISO certification level with other levels, it is
clearly seen that the mean difference is negative. It means
categories of certification companies have higher mean of
performance success. As Sig. < α, thus all these differences are
significant. As comparison of ISO 9001 to other levels, as Sig. < α,
all the differences are significant. To compare the organizations
which are certificated by ISO 9001 & 14001 with other levels, the
difference is significant with non-ISO and ISO 9001 certification
but there is no evidence of significant differences to
organizations which additionally obtained ISO 27001 certificate.
Please See Table 1 in the PDF Version
Estimation of success rate through adoption years
Since the length of adoption has significant effects on
conformance success and there is no interaction with ISO, it is
sensible to estimate the differences in mean of performance
success among adoption levels.
Please See Table 2 in the PDF Version
The mean of performance success increased from 2.405 to 3.461
through the increase in the length of implementation within
levels. The organizations by implementation of quality tools and
practices less than 5 years obtained the mean of 2.405. It is
increased to 2.775 and 3.461 for organizations which

implemented quality management for 5 to 10 years and up to 10
years respectively.
Based on pairwise of success and adoption, for the category of
less than 5 years QM adoption, the mean difference is significant
(Sig. < α) and negative in comparison with other levels. For the
category of 5 to 10 years, the Sig. < α. and the mean performance
success for the organization with more than 10 years
implementation is more.
Please See Table 3 in the PDF Version
Fig 2 demonstrated a visual result. Through considering the plot,
there is significant differences of performance success mean
between non-ISO and ISO 9001 certification. Through years of

QM practices implementation, performance success increased
significantly for both ISO and Non-ISO certification groups. The
lines are almost parallel through less than 5 years and 5 to 10
years of QM implementation. The lines get non-parallel through
period of 5 to 10 years to up to 10 years. It seems that when QM
adoption approaches up to 10 years, the difference of
performance success reduces but the difference level is still
significant.
Please See Figure 2 in the PDF Version
Comparison of QM implementation obstacles
According to Table 4, the most effective problems faced by
electrical industry is culture of being reluctant to change, lack of

supervision skill and lack of communication. In electronic
industry, the problem faced is indicated as culture, lack of
knowledge about the tools, lack of supervision skill and lack of
actual supports, commitment of top management.
Please See Table 4 in the PDF Version
Since the mean rank compares difference in both industries, it
would be sensible to investigate whether there is any evidence of
significant differences in the average mean of obstacles between
electrical and electronic industries.
H7: There is no evidence of obstacles mean differences between
electrical industry and electronic industry.

To assess this hypothesis, as the data distribution is not normal,
the Wilcoxon signed rank test for non-parametric data analysis
was performed to find out whether there is any significant
evidence of differences for each individual obstacle between the
two industries. For extensive analysis, H7 was examined through
all 12 obstacles individually. Based on table 4, the Sig. > 2α for
lack of knowledge about benefit of tools and lack of
communication, thus for these 2 practices categories, the null
hypothesis (H7) is rejected. Therefore, the mean differences for
these 2 obstacles are significant from each other in electrical and
electronic industries.
Conclusion
The data gathered from the sample of 187 SMEs out of 872
electrical and electronics companies in Malaysia which are active
in export were testified through several hypotheses and series of
statistical analyses using SPSS 20 and summarized as follows. It
was found that 52.4%, the majority of organizations
implemented quality management practices up to 5 years
maturity. While 53.5% of organizations have not been
certificated by any type of ISO. The result showed, 61.5% of
companies in Malaysia indicated themselves as successful and
very successful in terms of quality performance. In this study it
was extensively testified that independent factors such as ISO,
size of organization and length of quality management practices’
adoption predict performance success rate. It was found that ISO
certification standards and levels of quality management
implementations individually affect performance success rate.
The result showed that there is no evidence of significant
interaction between ISO certification standards and years of

quality management implementation on performance success
rate. It was clearly demonstrated that through the increase in
years of adoption in organizations of up to 10 years, performance
success rate increased significantly. It was also clear that being
certified by a type of ISO standards can lead to very successful
quality performance level. Overall, it was found that there is a
significant difference between non-ISO and ISO 9001 certificated
organizations before 10 years of quality management practices
implementation. Among obstacles, the result showed that there
are significant differences between electrical industry and
electronic industry in terms of lack of knowledge about benefit of
tools and lack of communication. This study is unique due to the
fact that it considered almost all variables contributing to success
comprehensively.

Acknowledgment
Authors wish to express gratitude to University of Malaya for
funding the research (Grant no. RP018C-13AE
References
1. Abdullah, M. M. B., Ahmad, Z. A., & Ismail, A. (2008). The
Importance of Soft Factors for Quality Improvement: Case Study
of Electrical and Electronics Firms in Malaysia. International
Journal of Business and Management, 3(12), P60.
2. Adebanjo, D., & Kehoe, D. (1998). An Evaluation of Quality
Culture Problems in UK Companies. International Journal of
Quality Science, 3(3), 275-286.

3. Agus, A. (2005). The Structural Linkages between TQM,
Product Quality Performance, and Business Performance:
Preliminary Empirical Study in Electronics Companies. Singapore
Management Review, 27(1), 87-105.
4. Ahire, S. L. (1996). TQM Age versus Quality: An Empirical
Investigation. Production and Inventory Management Journal, 37,
18-23.
5. Ahmad, M. F., Zakuan, N., Jusoh, A., Yusof, S. M., & Takala, J.
(2014). Moderating Effect of ASEAN Free Trade Agreement
between Total Quality Management and Business
Performance. Procedia-Social and Behavioral Sciences, 129, 244-
249.
6. Ahmed, S., & Hassan, M. (2003). Survey and Case
Investigations on Application of Quality Management Tools and
Techniques in SMEs. International Journal of Quality & Reliability
Management, 20(7), 795-826.
7. Ahmed, S., Hassan, M. H., & Taha, Z. (2004). State of
Implementation of TPM in SMEs: A Survey Study in
Malaysia. Journal of Quality in Maintenance Engineering, 10(2),
93-106.
8. Arumugam, V., Ooi, K. B., & Fong, T. C. (2008). TQM Practices
and Quality Management Performance: An Investigation of Their
Relationship Using Data from ISO 9001: 2000 Firms in
Malaysia. The TQM Journal, 20(6), 636-650.

9. Best, M. H., & Rasiah, R. (2003). Malaysian Electronics: At the
Crossroads. UNIDO, Programme Development and Technical
Cooperation Division.
10. Corbett, C.J., & Kirsch, D.A. (2001). International Diffusion of
ISO 14000 Certification. Production and Operations Management,
10, 327-42.
11. Corbett, C.J. (2006). Global Diffusion of ISO 9000 Certification
through Supply Chains. Manufacturing and Service Operations
Management, 8, 330-50.
12. Dean, J. W., & Bowen, D. E. (1994). Management Theory and
Total Quality: Improving Research and Practice through

Theory Development. Academy of Management Review, 19(3),
392-418.
13. Eng, Q. E., & Yusof, S. R. M. (2003). A Survey of TQM Practices
in the Malaysian Electrical and Electronic Industry. Total Quality
Management and Business Excellence, 14, 63-78.
14. Fekete, H., & Bocskei, E. (2011). Cultural Waves in Company
Performance. Research Journal of Economics, Business and
ICT, 3.
15. Idris, M. A., Mcewan, W., & Belavendram, N. (1996). The
Adoption of ISO 9000 and Total Quality Management in
Malaysia. The TQM Magazine, 8(5), 65-68.
16. Ismail, M. Y., Baradie, M. E., & Hashmi, M. S. J. (1998). Quality
Management in the Manufacturing Industry: Practice vs.
Performance. Computers and Industrial Engineering, 35(3), 519-
522.
17. Jun, M., Cai, S., & Peterson, R. (2004). Obstacles to TQM
implementation in Mexico's Maquiladora industry. Total Quality
Management & Business Excellence, 15(1), 59-72.
18. Jusoh, R., Ibrahim, D. N., & Zainuddin, Y. (2008). The
Performance Consequence of Multiple Performance Measures
Usage: Evidence from the Malaysian Manufacturers. International
Journal of Productivity and Performance Management, 57(2),
119-136.

19. Kaynak, H. (2003). The Relationship between Total Quality
Management Practices and Their Effects on Firm
Performance. Journal of Operations Management, 21(4), 405-435.
20. Lai, K. H., & Cheng, T. C. E. (2003). Initiatives and Outcomes of
Quality Management Implementation across
Industries. Omega, 31(2), 141-154.
21. Landau, S., & Everitt, B. (2004). A Handbook of Statistical
Analyses Using SPSS (Vol. 1). Boca Raton, FL: Chapman and
Hall/CRC.
22. Marimón, F., Casadesús, M., & Heras, I. (2006). ISO 9000 and
ISO 14000 Standards: An International Diffusion Model.

International Journal of Operations and Production Management,
26, 141-65.
23. Molina-Azorín, J.F., Tarí, J.J., Claver-Cortés, E., & López-
Gamero, M.D. (2009). Quality Management, Environmental
Management and Firm Performance: A Review of Empirical
Studies and Issues of Integration. International Journal of
Management Reviews, 11(2), 197- 222.
24. Masters, R. J. (1996). Overcoming the Barriers to TQM's
Success. Quality Progress, 29(5), 53.
25. Ooi, K. B., Cheah, W. C., Lin, B., & Teh, P. L. (2012). TQM
Practices and Knowledge Sharing: An Empirical Study of
Malaysia’s Manufacturing Organizations. Asia Pacific Journal of
Management, 29(1), 59-78.
26. Ošenieks, J., & Babauska, S. (2014). The Relevance of
Innovation Management as Prerequisite for Durable Existence of
Small and Medium Enterprises. Procedia-Social and Behavioral
Sciences, 110, 82-92.
27. Prajogo, D. I., & Sohal, A. S. (2006). The Relationship between
Organization Strategy, Total Quality Management (TQM) and
Organization Performance - The Mediating Role of
TQM. European Journal of Operational Research, 168(1), 35-50.

28. Price, M. J., & Chen, E. E. (1993). Total Quality Management in
a Small, High-Technology Company. California Management
Review, 35(3), 96-117.
29. Tarı́, J. J., & Sabater, V. (2004). Quality Tools and Techniques:
Are They Necessary for Quality Management? International
Journal of Production Economics, 92(3), 267-280.
30. Whalen, M. J., & Rahim, M. A. (1994). Common Barriers to
Implementation and Development of A TQM Program. Industrial
Management, 36(2), 19-21.
31. Yamada, T. T., Poltronieri, C. F., Gambi, L. D. N., & Gerolamo,
M. C. (2013). Why Does the Implementation Of Quality
Management Practices Fail? A Qualitative Study of Barriers in

Brazilian Companies. Procedia-Social and Behavioral
Sciences, 81, 366-370.
32. Yang, C. C. (2006). The Impact of Human Resource
Management Practices on the Implementation of Total Quality
Management: An Empirical Study on High-Tech Firms. The TQM
Magazine, 18(2), 162-173.