Embed Size (px)
Citation preview

Journal of Industrial and Engineering Chemistry xxx (2016) xxx–xxx
G ModelJIEC 3229 No. of Pages 10
Controlled pH- and glucose-responsive drug release behavior ofcationic chitosan based nano-composite hydrogels by using grapheneoxide as drug nanocarrier
Xiaowen Zhao, Xue Zou, Lin Ye*State Key Laboratory of Polymer Materials Engineering, Polymer Research Institute of Sichuan University, Chengdu 610065, China
A R T I C L E I N F O
Article history:Received 26 October 2016Received in revised form 13 December 2016Accepted 25 December 2016Available online xxx
Keywords:Cationic chitosanGraphene oxide (GO)Drug nano-carrierpH-/glucose-sensitivityInitial burst release
A B S T R A C T
To realize tight control of hyperglycemia for diabetic patients, cationic chitosan (HTCC) based nano-composite hydrogels were prepared by using graphene oxide (GO) as nano-carrier for the model drug(bovine serum albumin, BSA). BSA intercalated into the layers of GO and the intercalation process wasmainly driven by the mutual electrostatic interaction. By introducing GO-BSA, a more compact GO-centered network structure formed for the hydrogel. Compared with HTCC/BSA, HTCC/2.0wt%GO-BSAhydrogels exhibited a more distinct pH-/glucose-sensitivity and a much lower initial burst release, whichwas attributed to the compact structure and strong interactions among HTCC, GO and BSA in the hydrogelsystem.© 2016 The Korean Society of Industrial and Engineering Chemistry. Published by Elsevier B.V. All rights
reserved.
Contents lists available at ScienceDirect
Journal of Industrial and Engineering Chemistry
journal homepa ge: www.elsev ier .com/locate / j ie c
Introduction
Diabetes mellitus, a disorder of glucose regulation, is a globalburden affecting 366 million people across the world [1]. For tightcontrol of hyperglycemia and prevention of the resultingcomplications in diabetic patients, it is highly desirable to developsimple, effective, and continuously self-regulated drug deliverysystems [2]. Glucose-responsive hydrogels, known as stimuli-responsive or “intelligent” systems, can adapt the rate of drugrelease in response to changes in glucose concentration in order tomaintain blood glucose levels within the normal range. Enzymeglucose oxidase (GOD), a widely used natural receptor, can beentrapped or immobilized within a pH-sensitive matrix, whichresults in enzyme-catalyzed conversion of glucose to gluconic acid,thereby lowering the pH in the microenvironment of the hydrogeland causing drug release [3–5].
Chitosan (CS), a copolymer of D-glucosamine and N-acetylglu-cosamine derived from chitin, is a potentially useful pharmaceuti-cal material owing to its good biocompatibility and low toxicity[6,7]. In our previous study, it was demonstrated that chitosanmicrospheres based on the amino group were pH-sensitive in awide range of pH 1.0–9.0, which was not suitable in the field ofglucose responsive drug release systems with a narrow
* Corresponding author. Fax: +86 28 85402465.E-mail address: [email protected] (L. Ye).
http://dx.doi.org/10.1016/j.jiec.2016.12.0231226-086X/© 2016 The Korean Society of Industrial and Engineering Chemistry. Publis
Please cite this article in press as: X. Zhao, et al., Controlled pH- and glucocomposite hydrogels by using graphene oxide as drug nanocarrier, J. In
physiological pH-sensitive variation range from 7.4 to 6.8 for theconversion of glucose to gluconic acid through GOD [8]. Meanwhilethe cationic chitosan (HTCC) synthesized by grafting withglycidyltrimethylammonium chloride (GTMAC) showed moredistinct pH sensitivity as compared with chitosan and satisfiedthe above mentioned narrow physiological pH variation forglucose responsive drug release systems [9]. However, the initialburst effect was the main problems for the application of suchHTCC hydrogels systems. The burst release of drugs is usually dueto the weak interaction between polymer matrix and drugs, andthe quick swollen rate of the polymer gel during the initial releaseprocess.
Recently, the preparation and application of novel biopolymer/nanomaterial composites [10–12] as controlled drug deliveryvehicles have attracted much attention owing to their uniquestructure and properties. Graphene oxide (GO), an oxidativederivative of graphene, has attracted extensive interests in drugdelivery. GO sheets are enriched with oxygen-containing func-tional groups such as hydroxyl and epoxy group on the basal planesand carbonyl and carboxylic groups at the sheet edges. Thus, theGO sheets with one-atom thickness and two-dimensional planestructure can provide large specific surface area to carry drugs viasurface adsorption, hydrogen bonding, and other types ofinteractions [13], which makes it a promising material for drugcarrier [14–21].
Very limited works have been published regarding the use ofCS/GO nano-composites for drug delivery. Justin and Ben [22]
hed by Elsevier B.V. All rights reserved.
se-responsive drug release behavior of cationic chitosan based nano-d. Eng. Chem. (2016), http://dx.doi.org/10.1016/j.jiec.2016.12.023

2 X. Zhao et al. / Journal of Industrial and Engineering Chemistry xxx (2016) xxx–xxx
G ModelJIEC 3229 No. of Pages 10
studied the drug release behavior of CS/GO nano-composite film,which offered a faster and a more substantial release of drug thanCS, and the pH-sensitive release functionality of the nano-composite was also demonstrated, releasing 48% less drug in anacidic condition than that in a neutral environment. Chen et al. [23]prepared a series of porous CS/GO composite xerogels, which canabsorb and slowly release an anticancer drug, doxorubicinhydrochloride (DOX). The cumulative release percentage of DOXfrom the xerogels at pH 4 was much higher than that at pH 7.4. Insummary, for the current reported intelligent CS/GO drug releasesystems, the pH-sensitive variation range was too wide to satisfythe glucose-responsive drug release systems. And up to now, noliterature can be available for the effect of GO on the glucose-responsive drug release behavior of CS.
In this study, GO was used as nanocarrier for bovine serumalbumin (BSA) as the model drug. A series of GO-BSA intercalationcomplexes were prepared at first, and then, by using the cationicchitosan (HTCC) prepared in our previous study as the pH-sensitivepolymer matrix and enzyme glucose oxidase (GOD) as the glucose-sensitive receptor, GO-BSA loaded intelligent hydrogels (HTCC/GO-BSA) were prepared. The intercalation behavior of GO-BSA wasstudied, and the network structures as well as pH- and glucose-responsive drug release behavior of HTCC/GO-BSA hydrogels wereinvestigated.
Experimental
Materials
Chitosan (molecular weight 1 �106Da, degree of deacetylation85%) was purchased from Zhejiang Jinke Biochemical Co. Ltd.(Zhejiang, China). Epichlorohydrin and sodium tripolyphosphate(TPP) were purchased from Tianjin Tianda Chemical Reagent Co.(Tianjin, China). Glycidyltrimethylammonium chloride (GTMAC)was obtained from Dongyingguofeng Fine Chemical Co. Ltd.(Shandong, China). Bovine serum albumin (BSA) was providedby Huayi Bioengineering Co. Ltd. (Hubei, China). Glucose, enzymeglucose oxidase (GOD) and insulin were purchased from BaoxinBiotechnology Co. Ltd. (Chengdu, China). All other reagents were ofanalytic reagent grade. Double distilled water was used through-out.
Preparation of GO-BSA intercalation complexes
The preparation procedure for the GO-BSA intercalationcomplexes was carried out as follows: 0.5 g of GO was dispersedin 200 ml of deionized water under ultrasound for 30 min at roomtemperature, and in this process the stable GO/H2O dispersionsolution formed. Then BSA was added and the mixture solutionwas stirred for another 4 h. Afterwards, GO-BSA dispersion solutionwas centrifugated and washed with distilled water to remove thefree BSA. The resulting solids were freeze-dried for 12 h, finallyyielding GO-BSA intercalation complexes.
Preparation of HTCC/GO nano-composite hydrogels
Chitosan was dispersed in water/isopropanol media at 37 �C andstirred for 30 min prior to dropwise addition of GTMAC. Then thereaction mixture was stirred at 60 �C for another 6 h. After beingprecipitated and washed with cold acetone, cationic chitosan(HTCC) was obtained by filtration.
Afterwards, HTCC with GO-BSA and GOD was dissolved indistilled water at room temperature and crosslinking agent (TPP)was added. After incubating at 37 �C for 2 h, HTCC/GO-BSAhydrogels formed. The samples were freeze-dried for 24 h andstored at 4 �C before use.
Please cite this article in press as: X. Zhao, et al., Controlled pH- and glucocomposite hydrogels by using graphene oxide as drug nanocarrier, J. In
Measurements
X-ray diffraction analysis (XRD)The interlayer spacing of the samples of GO and GO-BSA was
measured at room temperature over the scanning range of 2u = 3–20� with Rigaku D/max III B x-ray diffraction equipment (Japan).Copper (Cu) Ka radiation (l = 0.154 nm) was used at a generatorvoltage of 40 kV, current of 35 mA, and the scanning speed was2.4 deg min�1. The d-spacing of the GO-BSA layers was calculatedwith the Bragg equation:
2dsinu ¼ nl ð1Þwhere u is the diffraction angle; n is the order of diffraction, and lis the incident wavelength.
Thermo-gravimetric analysis (TGA)The thermo-gravimetric analysis (TGA) was used to character-
ize the thermal stability and intercalation ratio of GO-BSA. TGA wasperformed with a TA2950 thermo-balance from TA Co. (USA) undernitrogen atmosphere with the flow rate of 50 ml/min. Thegranulated samples of about 10 mg were heated from ambienttemperature to approximately 800 �C at a heating rate of 10 �C/min.
Atomic force microscopy (AFM)The surface morphologies and thickness of GO and GO-BSA
were examined by AFM. The AFM measurements were performedwith a SPM-9700 Scanning Probe Microscope (Japan) in a tappingmode from Digital Instruments with a Nanoscope IV controller.Samples for AFM imaging were prepared by drop-casting the GOand GO-BSA dispersions onto freshly cleaved mica substrates,which were then allowed to dry in air at ambient temperature andpressure.
Scanning electron microscopy analysis (SEM)The morphology of the fractured surface of HTCC/GO-BSA
hydrogels was observed with a JEOL JSM-5900LV scanning electronmicroscopy (SEM) (Japan). The operating voltage was 5 kV. Thesamples were ion beam sputter-coated with gold and the thin layerthickness was about 1–20 nm.
Transmission electron microscopy analysis (TEM)The morphologies of GO-BSA intercalation complexes were
observed with a Titan G2 60-300 transmission electron microscopy(TEM) (U.S.A.) at an accelerating voltage of 300 kV. Samples weredispersed in distilled water and dropped onto 200-mesh coppergrids for TEM observation.
Rheological behaviorThe visco-elasticity behaviors of HTCC/GO-BSA hydrogels were
analyzed with Rheometer System Gemini 200 of MalvernInstrument Co. (UK), using parallel plates with 25 mm diameterand 1–2 mm plate-to-plate distance. For the strain scan experi-ment, the shear elastic modulus (G0) and viscous modulus (G00)were measured at 0.01–100% strain and 1 Hz frequency. For thefrequency scan experiment, G0 and G00 were measured in the linearvisco-elastic region, at 0.01–100 Hz frequency and 0.1% maximumstrain.
Swelling ratioThe swelling properties of the HTCC/GO-BSA hydrogels were
investigated in phosphate buffered saline (PBS) with pH 6.8.Hydrogels of a known weight (W0) were immersed in PBS buffersolutions at 37 �C. Then, the hydrogels were taken out atpredetermined intervals and weighed after removing excesssolution on the surface. The swelling ratio can be determined
se-responsive drug release behavior of cationic chitosan based nano-d. Eng. Chem. (2016), http://dx.doi.org/10.1016/j.jiec.2016.12.023
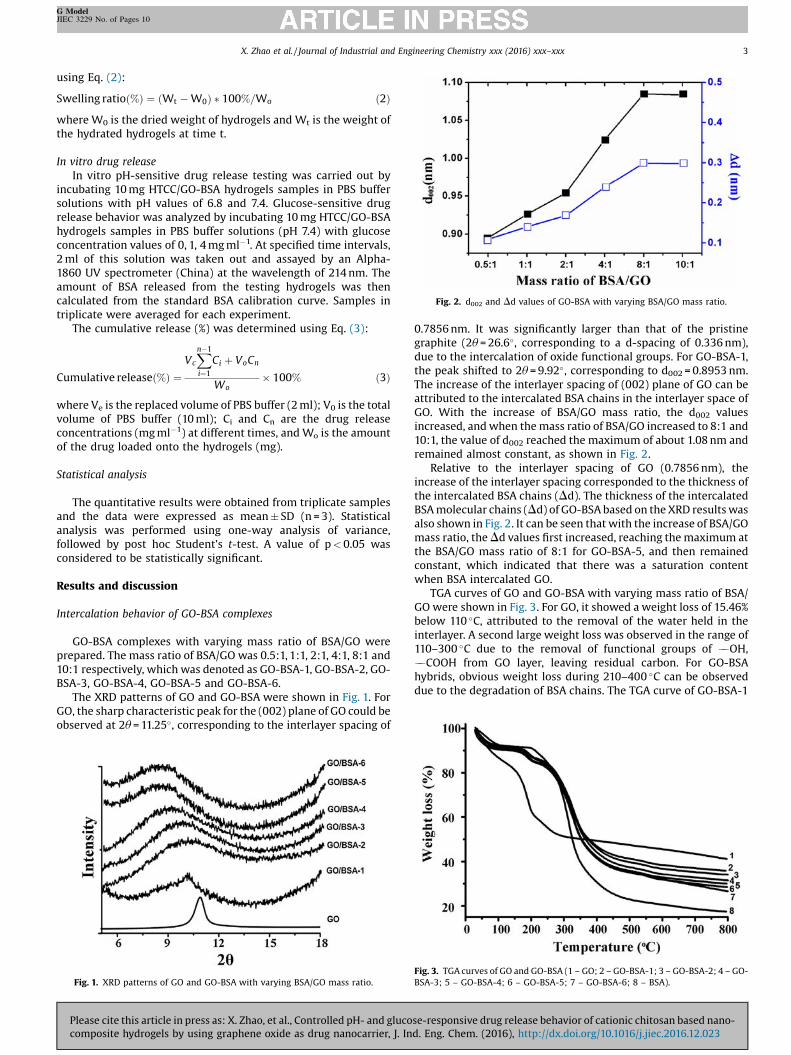
Fig. 2. d002 and Dd values of GO-BSA with varying BSA/GO mass ratio.
X. Zhao et al. / Journal of Industrial and Engineering Chemistry xxx (2016) xxx–xxx 3
G ModelJIEC 3229 No. of Pages 10
using Eq. (2):
Swelling ratioð%Þ ¼ ðWt � W0Þ � 100%=Wo ð2Þwhere W0 is the dried weight of hydrogels and Wt is the weight ofthe hydrated hydrogels at time t.
In vitro drug releaseIn vitro pH-sensitive drug release testing was carried out by
incubating 10 mg HTCC/GO-BSA hydrogels samples in PBS buffersolutions with pH values of 6.8 and 7.4. Glucose-sensitive drugrelease behavior was analyzed by incubating 10 mg HTCC/GO-BSAhydrogels samples in PBS buffer solutions (pH 7.4) with glucoseconcentration values of 0, 1, 4 mg ml�1. At specified time intervals,2 ml of this solution was taken out and assayed by an Alpha-1860 UV spectrometer (China) at the wavelength of 214 nm. Theamount of BSA released from the testing hydrogels was thencalculated from the standard BSA calibration curve. Samples intriplicate were averaged for each experiment.
The cumulative release (%) was determined using Eq. (3):
Cumulative releaseð%Þ ¼Vc
Xn�1
i¼1
Ci þ VoCn
Wo� 100% ð3Þ
where Ve is the replaced volume of PBS buffer (2 ml); V0 is the totalvolume of PBS buffer (10 ml); Ci and Cn are the drug releaseconcentrations (mg ml�1) at different times, and Wo is the amountof the drug loaded onto the hydrogels (mg).
Statistical analysis
The quantitative results were obtained from triplicate samplesand the data were expressed as mean � SD (n = 3). Statisticalanalysis was performed using one-way analysis of variance,followed by post hoc Student’s t-test. A value of p < 0.05 wasconsidered to be statistically significant.
Results and discussion
Intercalation behavior of GO-BSA complexes
GO-BSA complexes with varying mass ratio of BSA/GO wereprepared. The mass ratio of BSA/GO was 0.5:1, 1:1, 2:1, 4:1, 8:1 and10:1 respectively, which was denoted as GO-BSA-1, GO-BSA-2, GO-BSA-3, GO-BSA-4, GO-BSA-5 and GO-BSA-6.
The XRD patterns of GO and GO-BSA were shown in Fig. 1. ForGO, the sharp characteristic peak for the (002) plane of GO could beobserved at 2u = 11.25�, corresponding to the interlayer spacing of
Fig. 1. XRD patterns of GO and GO-BSA with varying BSA/GO mass ratio.
Please cite this article in press as: X. Zhao, et al., Controlled pH- and glucocomposite hydrogels by using graphene oxide as drug nanocarrier, J. In
0.7856 nm. It was significantly larger than that of the pristinegraphite (2u = 26.6�, corresponding to a d-spacing of 0.336 nm),due to the intercalation of oxide functional groups. For GO-BSA-1,the peak shifted to 2u = 9.92�, corresponding to d002 = 0.8953 nm.The increase of the interlayer spacing of (002) plane of GO can beattributed to the intercalated BSA chains in the interlayer space ofGO. With the increase of BSA/GO mass ratio, the d002 valuesincreased, and when the mass ratio of BSA/GO increased to 8:1 and10:1, the value of d002 reached the maximum of about 1.08 nm andremained almost constant, as shown in Fig. 2.
Relative to the interlayer spacing of GO (0.7856 nm), theincrease of the interlayer spacing corresponded to the thickness ofthe intercalated BSA chains (Dd). The thickness of the intercalatedBSA molecular chains (Dd) of GO-BSA based on the XRD results wasalso shown in Fig. 2. It can be seen that with the increase of BSA/GOmass ratio, the Dd values first increased, reaching the maximum atthe BSA/GO mass ratio of 8:1 for GO-BSA-5, and then remainedconstant, which indicated that there was a saturation contentwhen BSA intercalated GO.
TGA curves of GO and GO-BSA with varying mass ratio of BSA/GO were shown in Fig. 3. For GO, it showed a weight loss of 15.46%below 110 �C, attributed to the removal of the water held in theinterlayer. A second large weight loss was observed in the range of110–300 �C due to the removal of functional groups of ��OH,��COOH from GO layer, leaving residual carbon. For GO-BSAhybrids, obvious weight loss during 210–400 �C can be observeddue to the degradation of BSA chains. The TGA curve of GO-BSA-1
Fig. 3. TGA curves of GO and GO-BSA (1 – GO; 2 – GO-BSA-1; 3 – GO-BSA-2; 4 – GO-BSA-3; 5 – GO-BSA-4; 6 – GO-BSA-5; 7 – GO-BSA-6; 8 – BSA).
se-responsive drug release behavior of cationic chitosan based nano-d. Eng. Chem. (2016), http://dx.doi.org/10.1016/j.jiec.2016.12.023

Fig. 4. Typical tapping-mode AFM images of (a) GO, (b) GO-BSA and 3D view images of (a’) GO, (b’) GO-BSA.
Table 1Thermal analysis data of GO and GO-BSA complexes.
Samples M0 (mg) W (%) M1 (mg) D1 (%)
GO 3.8 58.84 – –
GO-BSA-1 2.8 70.00 0.76 37.20GO-BSA-2 1.8 70.74 0.52 40.67GO-BSA-3 2.4 73.10 0.83 53.01GO-BSA-4 1.6 75.61 0.65 68.76GO-BSA-5 1.9 77.78 0.87 85.24GO-BSA-6 1.4 77.76 0.64 85.07
4 X. Zhao et al. / Journal of Industrial and Engineering Chemistry xxx (2016) xxx–xxx
G ModelJIEC 3229 No. of Pages 10
(curve 2) showed a total of 70% weight loss in the wholetemperature range, and with the increase of the BSA content,the weight loss increased indicating that the intercalated BSAmolecules in the GO layers increased.
The mass percent of the intercalated BSA molecules in the unitmass of GO (per gram) can be calculated according to the TGA data.
M1 ¼ M0 � WGO�BSA � ðM0 � M1Þ � WGO ð4Þ
that is; M1 ¼ WGO�BSA � WGO
1 � WGO� M0 ð5Þ
D1 ¼ M1=ðM0 � M1Þ � 100% ð6Þwhere WGO and WGO-BSA are the residual ratio of thermal loss of GOand GO-BSA, respectively; M1 is the mass of BSA intercalated in theGO layers; M0 is the mass of the added GO-BSA; D1 is theintercalation ratio of BSA molecules for per gram of GO.
The intercalation mass (M1) and intercalation ratio (D1) of BSAmolecules in GO layers calculated according to Eqs. (4)–(6) wereshown in Table 1. With increasing mass ratio of BSA/GO, theintercalation ratio (D1) of GO-BSA first increased, and thenmaintained almost constant, reaching the maximum and satura-tion as high as 85.24% for GO-BSA-5, which was consistent with theXRD data.
Fig. 4 showed the typical AFM images and their 3D view imagesof GO and GO-BSA samples. For GO, the thickness of the individualnano-sheet was about of 0.9 nm, while for GO-BSA sample, thethickness increased to �1.9 nm due to the binding of BSA moleculesonto GO surface. Moreover, it was noticeable that the BSA
Please cite this article in press as: X. Zhao, et al., Controlled pH- and glucocomposite hydrogels by using graphene oxide as drug nanocarrier, J. In
molecular chains covered the whole plane of GO surface withrelatively even height, indicating that BSA molecules wereabsorbed onto the GO surface homogeneously.
The dispersion state of GO in BSA was observed by TEM, asshown in Fig. 5. It can be seen that most of the GO layers,corresponding to the dark flakes, were well distributed in the BSAmatrix.
BSA is a kind of globular protein consisting of a single peptidechain with 583 amino acids. It can be loaded on a variety ofsubstrates which contain cations, anions, amino acids and so on.Therefore, the adsorption process of BSA onto the GO layers wasmainly driven by the mutual electrostatic interaction betweennegatively charged GO sheets and positively charged ��NH2 groupon BSA chains, together with some hydrogen bonding, as shown inFig. 6.
Network structure of HTCC/GO-BSA hydrogel
By using HTCC as pH-sensitive polymer matrix, GOD as glucose-sensitive receptor and TPP as cross-linking agent, GO-BSA-5 loaded
se-responsive drug release behavior of cationic chitosan based nano-d. Eng. Chem. (2016), http://dx.doi.org/10.1016/j.jiec.2016.12.023
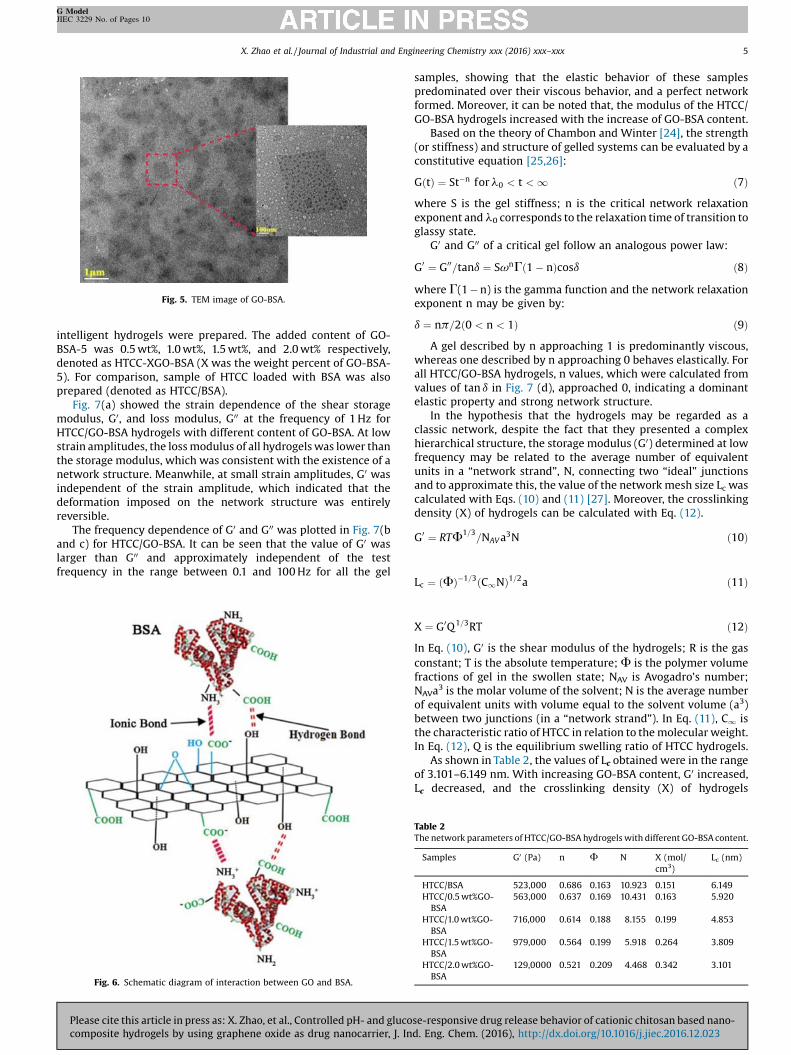
Fig. 5. TEM image of GO-BSA.
X. Zhao et al. / Journal of Industrial and Engineering Chemistry xxx (2016) xxx–xxx 5
G ModelJIEC 3229 No. of Pages 10
intelligent hydrogels were prepared. The added content of GO-BSA-5 was 0.5 wt%, 1.0 wt%, 1.5 wt%, and 2.0 wt% respectively,denoted as HTCC-XGO-BSA (X was the weight percent of GO-BSA-5). For comparison, sample of HTCC loaded with BSA was alsoprepared (denoted as HTCC/BSA).
Fig. 7(a) showed the strain dependence of the shear storagemodulus, G0, and loss modulus, G00 at the frequency of 1 Hz forHTCC/GO-BSA hydrogels with different content of GO-BSA. At lowstrain amplitudes, the loss modulus of all hydrogels was lower thanthe storage modulus, which was consistent with the existence of anetwork structure. Meanwhile, at small strain amplitudes, G0 wasindependent of the strain amplitude, which indicated that thedeformation imposed on the network structure was entirelyreversible.
The frequency dependence of G0 and G00 was plotted in Fig. 7(band c) for HTCC/GO-BSA. It can be seen that the value of G0 waslarger than G00 and approximately independent of the testfrequency in the range between 0.1 and 100 Hz for all the gel
Fig. 6. Schematic diagram of interaction between GO and BSA.
Please cite this article in press as: X. Zhao, et al., Controlled pH- and glucocomposite hydrogels by using graphene oxide as drug nanocarrier, J. In
samples, showing that the elastic behavior of these samplespredominated over their viscous behavior, and a perfect networkformed. Moreover, it can be noted that, the modulus of the HTCC/GO-BSA hydrogels increased with the increase of GO-BSA content.
Based on the theory of Chambon and Winter [24], the strength(or stiffness) and structure of gelled systems can be evaluated by aconstitutive equation [25,26]:
GðtÞ ¼ St�n for l0 < t < 1 ð7Þwhere S is the gel stiffness; n is the critical network relaxationexponent and l0 corresponds to the relaxation time of transition toglassy state.
G0 and G00 of a critical gel follow an analogous power law:
G0 ¼ G00=tand ¼ SvnGð1 � nÞcosd ð8Þwhere G(1 � n) is the gamma function and the network relaxationexponent n may be given by:
d ¼ np=2ð0 < n < 1Þ ð9ÞA gel described by n approaching 1 is predominantly viscous,
whereas one described by n approaching 0 behaves elastically. Forall HTCC/GO-BSA hydrogels, n values, which were calculated fromvalues of tan d in Fig. 7 (d), approached 0, indicating a dominantelastic property and strong network structure.
In the hypothesis that the hydrogels may be regarded as aclassic network, despite the fact that they presented a complexhierarchical structure, the storage modulus (G0) determined at lowfrequency may be related to the average number of equivalentunits in a “network strand”, N, connecting two “ideal” junctionsand to approximate this, the value of the network mesh size Lc wascalculated with Eqs. (10) and (11) [27]. Moreover, the crosslinkingdensity (X) of hydrogels can be calculated with Eq. (12).
G0 ¼ RTF1=3=NAVa3N ð10Þ
Lc ¼ ðFÞ�1=3ðC1NÞ1=2a ð11Þ
X ¼ G0Q1=3RT ð12ÞIn Eq. (10), G0 is the shear modulus of the hydrogels; R is the gasconstant; T is the absolute temperature; F is the polymer volumefractions of gel in the swollen state; NAV is Avogadro’s number;NAVa3 is the molar volume of the solvent; N is the average numberof equivalent units with volume equal to the solvent volume (a3)between two junctions (in a “network strand”). In Eq. (11), C1 isthe characteristic ratio of HTCC in relation to the molecular weight.In Eq. (12), Q is the equilibrium swelling ratio of HTCC hydrogels.
As shown in Table 2, the values of Lc obtained were in the rangeof 3.101–6.149 nm. With increasing GO-BSA content, G0 increased,Lc decreased, and the crosslinking density (X) of hydrogels
Table 2The network parameters of HTCC/GO-BSA hydrogels with different GO-BSA content.
Samples G0 (Pa) n F N X (mol/cm3)
Lc (nm)
HTCC/BSA 523,000 0.686 0.163 10.923 0.151 6.149HTCC/0.5 wt%GO-BSA
563,000 0.637 0.169 10.431 0.163 5.920
HTCC/1.0 wt%GO-BSA
716,000 0.614 0.188 8.155 0.199 4.853
HTCC/1.5 wt%GO-BSA
979,000 0.564 0.199 5.918 0.264 3.809
HTCC/2.0 wt%GO-BSA
129,0000 0.521 0.209 4.468 0.342 3.101
se-responsive drug release behavior of cationic chitosan based nano-d. Eng. Chem. (2016), http://dx.doi.org/10.1016/j.jiec.2016.12.023
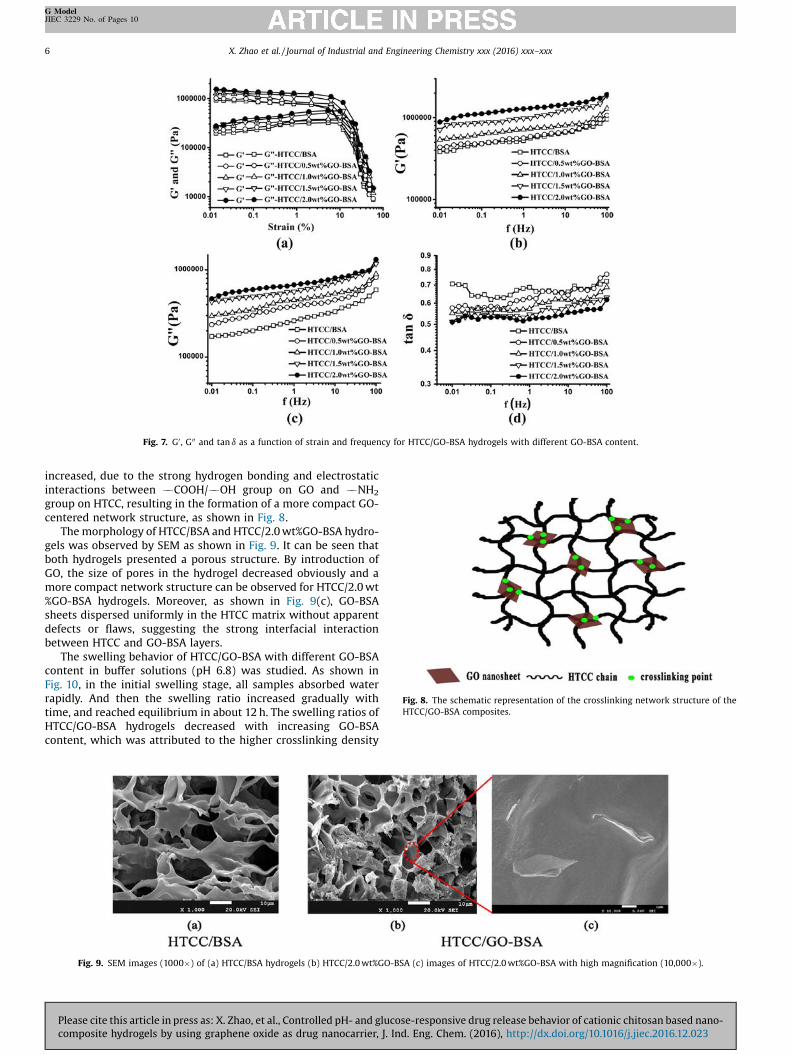
Fig. 7. G0 , G00 and tan d as a function of strain and frequency for HTCC/GO-BSA hydrogels with different GO-BSA content.
Fig. 8. The schematic representation of the crosslinking network structure of theHTCC/GO-BSA composites.
6 X. Zhao et al. / Journal of Industrial and Engineering Chemistry xxx (2016) xxx–xxx
G ModelJIEC 3229 No. of Pages 10
increased, due to the strong hydrogen bonding and electrostaticinteractions between ��COOH/��OH group on GO and ��NH2
group on HTCC, resulting in the formation of a more compact GO-centered network structure, as shown in Fig. 8.
The morphology of HTCC/BSA and HTCC/2.0 wt%GO-BSA hydro-gels was observed by SEM as shown in Fig. 9. It can be seen thatboth hydrogels presented a porous structure. By introduction ofGO, the size of pores in the hydrogel decreased obviously and amore compact network structure can be observed for HTCC/2.0 wt%GO-BSA hydrogels. Moreover, as shown in Fig. 9(c), GO-BSAsheets dispersed uniformly in the HTCC matrix without apparentdefects or flaws, suggesting the strong interfacial interactionbetween HTCC and GO-BSA layers.
The swelling behavior of HTCC/GO-BSA with different GO-BSAcontent in buffer solutions (pH 6.8) was studied. As shown inFig. 10, in the initial swelling stage, all samples absorbed waterrapidly. And then the swelling ratio increased gradually withtime, and reached equilibrium in about 12 h. The swelling ratios ofHTCC/GO-BSA hydrogels decreased with increasing GO-BSAcontent, which was attributed to the higher crosslinking density
Fig. 9. SEM images (1000�) of (a) HTCC/BSA hydrogels (b) HTCC/2.0 wt%GO-BSA (c) images of HTCC/2.0 wt%GO-BSA with high magnification (10,000�).
Please cite this article in press as: X. Zhao, et al., Controlled pH- and glucose-responsive drug release behavior of cationic chitosan based nano-composite hydrogels by using graphene oxide as drug nanocarrier, J. Ind. Eng. Chem. (2016), http://dx.doi.org/10.1016/j.jiec.2016.12.023

Fig. 10. Swelling ratios of HTCC/GO-BSA hydrogels with different GO-BSA contentin buffer solutions (pH 6.8).
X. Zhao et al. / Journal of Industrial and Engineering Chemistry xxx (2016) xxx–xxx 7
G ModelJIEC 3229 No. of Pages 10
and more compact structure of the hydrogels with high content ofGO-BSA.
pH-sensitive drug release behavior of HTCC/GO-BSA hydrogels
To investigate the effect of pH value of the external medium onthe drug release behavior of HTCC/GO-BSA hydrogels, thecumulative release amount of BSA in PBS buffer solution withpH 6.8 and 7.4 was measured. Cumulative release data (as shown inFig. 11) indicated that by increasing the pH value from 6.8 to 7.4, aconsiderable decrease in cumulative release was observed for allhydrogels, suggesting that the drug release profiles of all HTCC/GO-BSA hydrogels were pH-sensitive. With increasing GO-BSA content,the difference of the cumulative release in the medium of pH6.8 and 7.4 became more and more significant, indicating anenhanced pH-sensitivity. Moreover, the release rate was obviouslyslowed down during the initial 5 h by the introduction of GO-BSA.
Fig.11. pH-responsive release behavior of HTCC/GO-BSA hydrogels in different pH conditGO-BSA; D-HTCC/1.5 wt%GO-BSA; E-HTCC/2.0 wt%GO-BSA).
Please cite this article in press as: X. Zhao, et al., Controlled pH- and glucocomposite hydrogels by using graphene oxide as drug nanocarrier, J. In
The drug release kinetics of HTCC/GO-BSA was studied with thefollowing Korsmeyer–Peppas model:
lnMt=M1 ¼ nlnt þ lnk ð13Þwhere Mt/M1 is the fractional drug release at time t; k is a kineticconstant incorporating the structural characteristics of the matrix;and n is the release exponent, indicative of the drug releasemechanism. In the case of Fickian release, n has the limiting valueof 0.43. For case II, transport or relaxation controlled delivery, theexponent n is 0.85 [28,29]. The non-Fickian release or anomaloustransport of drug occurred when the n values were between0.43 and 0.85, which corresponds with the coupled diffusion/polymer relaxation.
As listed in Table 3, the correlation coefficient (r2) approaching0.98 was obtained for all hydrogels, indicating that the release datafitted well to the model. The exponent n values for the release ofBSA from the hydrogel were all less than 0.43, suggesting a Fickianrelease behavior and that diffusion through the swelling ofhydrogels was the main factor in controlling BSA release. Thevalue of constant k for all HTCC/GO-BSA hydrogels in buffersolution with pH 6.8 was larger than that in buffer solution with pH7.4, which indicated that the drug release of all HTCC/GO-BSAhydrogels were pH-sensitive. Moreover, in buffer solution with thesame pH value, the constant k of hydrogels decreased withincreasing GO-BSA content, which indicated that the release of BSAwas slowed down by introduction of GO-BSA.
The pH-sensitive drug release behavior of HTCC/GO-BSAhydrogels should be attributed to a different hydrolysis degreein PBS buffer solution with pH 6.8 and pH 7.4, because the acidicenvironment could promote the hydrolysis of HTCC. At physiologi-cal condition (pH 7.4), the weak degree of ionization along with theless positively charged amine groups of HTCC and more hydrogenbonds resulted in a relatively dense network structure with poresize 4–8 mm (Fig. 12(a)) and restricting BSA release from its carrier.In contrast, the amine groups on the HTCC chains becameprotonated, forming the hydrophilic ��NH3
+ groups and��N+(CH3)3 groups under a subacid environment (pH 6.8). Theresulting electrostatic repulsion between the protonated cationic
ions (pH 6.8 and 7.4) at 37 �C (A-HTCC/BSA; B-HTCC/0.5 wt%GO-BSA; C-HTCC/1.0 wt%
se-responsive drug release behavior of cationic chitosan based nano-d. Eng. Chem. (2016), http://dx.doi.org/10.1016/j.jiec.2016.12.023

Table 3Drug release kinetic data for BSA-loaded modified chitosan hydrogels obtained from fitting drug release experimental data to the Korsmeyer–Peppas equation.
Samples pH Korsmeyer–Peppas model Transport mechanism
Correlation coefficient, r2 Diffusion exponent, n Kinetic constant, k
HTCC/BSA 6.8 0.9810 0.2142 29.8574 Fickian diffusion7.4 0.9425 0.2199 22.9075
HTCC/0.5 wt%GO-BSA 6.8 0.9706 0.2191 28.2306 Fickian diffusion7.4 0.9499 0.2455 18.9770
HTCC/1.0 wt%GO-BSA 6.8 0.9871 0.2502 23.1590 Fickian diffusion7.4 0.9605 0.2507 16.5737
HTCC/1.5 wt%GO-BSA 6.8 0.9867 0.2619 21.4180 Fickian diffusion7.4 0.9734 0.2536 15.6806
HTCC/2.0 wt%GO-BSA 6.8 0.9804 0.2953 18.4620 Fickian diffusion7.4 0.9883 0.3034 11.4842
8 X. Zhao et al. / Journal of Industrial and Engineering Chemistry xxx (2016) xxx–xxx
G ModelJIEC 3229 No. of Pages 10
groups weakened the intermolecular and intramolecular hydrogenbonding interaction of HTCC molecules, and the obvious loosenetwork structure with pore size 10–15 mm (Fig. 12(b)) can beobserved. As a result, the PBS buffer solution can diffuse into theHTCC/GO-BSA network easily, which would facilitate swelling anddrug release.
The morphology of HTCC/BSA and HTCC-2.0wt%GO-BSA hydro-gels after immersion in pH 6.8 PBS buffer solutions for 1 h wasshown in Fig. 13. Due to the strong hydrogen bonding andelectrostatic interactions between ��COOH/��OH group on GO and��NH2 group on HTCC, a more compact network structure formedby introduction of GO-BSA, which could slow down the initial burstrelease rate of hydrogels.
Glucose-responsive drug release behavior of HTCC/GO-BSA hydrogels
The pH-sensitive HTCC/GO-BSA hydrogels entrapped with GODwere used as a glucose responsive drug release system. Fig. 14(a)
Fig. 13. SEM images (�500) of HTCC/GO-BSA hydrogels after immersion in pH 6.8
Fig. 12. SEM images (�500) of HTCC/2.0 wt%GO-BSA hydrogels after immer
Please cite this article in press as: X. Zhao, et al., Controlled pH- and glucocomposite hydrogels by using graphene oxide as drug nanocarrier, J. In
and (b) showed the cumulative release profiles of BSA from HTCC/BSA and HTCC/2.0 wt%GO-BSA hydrogels in response to differentconcentrations of glucose at pH 7.4, 37 �C, respectively. It wasobserved that, for both hydrogels, a much slower release rate wasobtained when the hydrogels were exposed to the controlsolutions (0 mg ml�1) and the basal glucose level (1 mg ml�1) thanthat for the hyperglycemic glucose level (4 mg ml�1), indicating anobvious glucose-sensitivity. Noticeably, the difference betweenBSA release profiles in the medium with glucose concentrations of0 and 4 mg ml�1 was more significant for HTCC/2.0 wt%GO-BSAcompared with HTCC/BSA hydrogel, indicating a more distinctglucose-sensitivity. Moreover, for HTCC/BSA hydrogels, a burstrelease behavior can be observed with different glucose concen-trations during the initial 10 h. While for HTCC-2.0 wt%GO-BSAhydrogels, it exhibited a much lower initial burst release and aslower release rate compared with HTCC/BSA hydrogels.
The glucose-responsive drug release kinetics were studied withthe Korsmeyer–Peppas model (Eq. (13)), and the related
PBS buffer solution at 37 �C for 1 h (a) HTCC/BSA; (b) HTCC/2.0 wt%GO-BSA.
sion in PBS buffer solution at 37 �C for 1 h. (a) At pH 6.8; (b) at pH 7.4.
se-responsive drug release behavior of cationic chitosan based nano-d. Eng. Chem. (2016), http://dx.doi.org/10.1016/j.jiec.2016.12.023

Fig. 15. Glucose responsive release behavior of HTCC/2.0 wt%GO-insulin hydrogelsunder different glucose concentrations: 0, 1, and 4 mg/ml at 37 �C.
Table 4Drug release kinetic data for BSA-loaded HTCC/GO-BSA hydrogels in different glucose concentration obtained from fitting drug release experimental data to the Korsmeyer–Peppas equation.
Samples Glucose concentration (mg/ml) Korsmeyer–Peppas model Transport mechanism
Correlation coefficient, r2 Diffusion exponent, n Kinetic constant, k
HTCC/BSA 0 0.9814 0.2445 9.5780 Fickian diffusion1 0.9517 0.1581 29.3573 Fickian diffusion4 0.9732 0.1881 32.0494 Fickian diffusion
HTCC/2.0 wt%GO-BSA 0 0.9659 0.3765 7.5235 Fickian diffusion1 0.9807 0.3984 8.4125 Fickian diffusion4 0.9897 0.3506 14.4611 Fickian diffusion
Fig. 14. Glucose responsive release behavior of HTCC/BSA hydrogels (a) and HTCC-2.0 wt%GO-BSA hydrogels (b) under different glucose concentrations: 0, 1, and 4 mg/ml at37 �C.
X. Zhao et al. / Journal of Industrial and Engineering Chemistry xxx (2016) xxx–xxx 9
G ModelJIEC 3229 No. of Pages 10
parameters were listed in Table 4. A good correlation coefficient(r2) approaching 0.98 was obtained in all cases. It was shown thatthe exponent n values for the release of BSA from HTCC hydrogelsunder different glucose concentrations were all less than 0.43,suggesting a Fickian release behavior. The values of constant kincreased with an increase in glucose concentration, suggestingthat HTCC/GO-BSA hydrogels showed obvious glucose sensitivity.Moreover, k value of HTCC-2.0 wt%GO-BSA hydrogels was muchlower than that of HTCC/BSA hydrogels under same glucoseconcentrations, indicating that HTCC/2.0 wt%GO-BSA hydrogelsmay achieve a better slow-release effect.
Insulin, which was the conventional drug for diabetes, was usedas the model drug, and HTCC/2.0 wt%GO-insulin drug deliverysystem was prepared. As shown in Fig. 15, the glucose responsiverelease behavior of HTCC/2.0 wt%GO-insulin hydrogel was similar
Please cite this article in press as: X. Zhao, et al., Controlled pH- and glucocomposite hydrogels by using graphene oxide as drug nanocarrier, J. In
with that of HTCC-2.0 wt%GO-BSA hydrogel. However, the releaserate of the former was slightly slower than that of the latter.
Conclusions
In this study, GO was used as the drug nano-carrier and a seriesof GO-BSA intercalation complexes were prepared. With theincrease of BSA/GO mass ratio, the interlayer spacing andintercalation ratio of GO-BSA increased, reaching the maximumand saturation at BSA/GO mass ratio of 8:1. The intercalationprocess of BSA into the GO layers was mainly driven by the mutualelectrostatic interaction between negatively charged GO sheetsand positively charged ��NH2 group on BSA chains. By using HTCCas the pH-sensitive polymer matrix, GOD as the glucose-sensitivereceptor, GO-BSA loaded intelligent hydrogels were prepared. Withincreasing GO-BSA content, the storage modulus and crosslinkingdensity of HTCC/GO-BSA hydrogel increased, which indicated thatthe introduction of GO-BSA resulted in a more-compact hydrogel.The release profiles revealed that all HTCC/GO-BSA hydrogelsshowed distinct pH-sensitivity, and the release of BSA from thehydrogel presented an almost Fickian release behavior. With theincrease of GO-BSA content, the pH-sensitivity increased, and theinitial release rate as well as constant k value decreased. Anobvious glucose-sensitive drug release behavior can be observedfor both HTCC/BSA and HTCC/2.0 wt%GO-BSA hydrogel. Comparedwith HTCC/BSA hydrogels, HTCC/2.0 wt%GO-BSA hydrogels exhib-ited a more distinct glucose-sensitivity and a much lower initialburst release.
References
[1] Z. Gu, A.A. Aimetti, Q. Wang, T.T. Dang, Y. Zhang, O. Veiseh, H. Cheng, R.S.Langer, D.G. Anderson, ACS Nano 7 (2013) 4194.
[2] X. Chen, W. Wu, Z. Guo, Z. Guo, J. Xin, J. Li, Biomaterials 32 (2011) 1759.[3] J. Luo, S. Cao, X. Chen, X. Chen, S. Liu, H. Tan, W. Wu, J. Li, Biomaterials 33 (2012)
8733.[4] S.I. Kang, Y.H. Bae, J. Control. Release 86 (2003) 115.
se-responsive drug release behavior of cationic chitosan based nano-d. Eng. Chem. (2016), http://dx.doi.org/10.1016/j.jiec.2016.12.023
10 X. Zhao et al. / Journal of Industrial and Engineering Chemistry xxx (2016) xxx–xxx
G ModelJIEC 3229 No. of Pages 10
[5] M.K.L. Chu, J. Chen, C.R. Gordijo, S. Chiang, A. Ivovic, K. Koulajian, Y. Sun, LabChip 12 (2012) 2533.
[6] J. Wu, Z.G. Su, G.H. Ma, Int. J. Pharm. 315 (2006) 1.[7] K.Z. Elwakeel, M.A.A. El-Ghaffar, S.M. El-kousy, H.G. El-Shorbagy, Chem. Eng. J.
203 (2012) 458.[8] X. Zou, X. Zhao, L. Ye, J. Ind. Eng. Chem. 21 (2015) 1389.[9] X. Zou, X. Zhao, L. Ye, Chem. Eng. J. 273 (2015) 92.
[10] W.F. Lee, Y.T. Fu, J. Appl. Polym. Sci. 89 (2003) 3652.[11] Q. Yuan, J. Shah, S. Hein, R.D.K. Misra, Acta Biomater. 6 (2010) 1140.[12] X. Zhang, Z. Hui, D. Wan, H. Huang, J. Huang, H. Yuan, J. Yu, Int. J. Biol.
Macromol. 47 (2010) 389.[13] X. Yang, X. Zhang, Z. Liu, Y. Ma, Y. Huang, Y. Chen, J. Phys. Chem. C 112 (2008)
17554.[14] X. Yang, Y. Wang, X. Huang, Y. Ma, Y. Huang, R. Yang, H. Duan, Y. Chen, J. Mater.
Chem. 21 (2011) 3448.[15] Z. Liu, J.T. Robinson, X. Sun, H. Dai, J. Am. Chem. Soc. 130 (2008) 10876.[16] X. Yang, X. Zhang, Z. Liu, Y. Ma, Y. Huang, Y. Chen, J. Phys. Chem. C 112 (2008)
17554.[17] S. Liu, L. Wang, J. Tian, Y. Luo, X. Zhang, X. Sun, J. Colloid Interface Sci. 363
(2011) 615.
Please cite this article in press as: X. Zhao, et al., Controlled pH- and glucocomposite hydrogels by using graphene oxide as drug nanocarrier, J. In
[18] S. Liu, J. Tian, L. Wang, Y. Luo, X. Sun, Catal. Sci. Technol. 2 (2012) 339.[19] J. Tian, R. Ning, Q. Liu, A.M. Asiri, A.O. Al-Youbi, X. Sun, ACS Appl. Mater.
Interfaces 6 (2014) 1011.[20] R. Ning, J. Tian, A.M. Asiri, A.H. Qusti, A.O. Al-Youbi, X. Sun, Langmuir 29 (2013)
13146.[21] J. Tian, S. Liu, H. Li, L. Wang, Y. Zhang, Y. Luo, X. Sun, RSC Adv. 2 (2012) 1318.[22] R. Justin, B. Chen, Carbohydr. Polym. 103 (2014) 70.[23] Y. Chen, Y. Qi, X. Yan, H. Ma, J. Chen, B. Liu, Q. Xue, J. Appl. Polym. Sci. 131 (2014)
1 40006.[24] F. Chambon, H.H. Winter, J. Rheol. 31 (1987) 683.[25] M. Aliaghaie, H. Mirzadeh, E. Dashtimoghadam, S. Taranejoo, Soft Matter 8
(2012) 7128.[26] M.J. Moura, M.M. Figueiredo, M.H. Gil, Rheological study of genipin cross-
linked chitosan hydrogels, Biomacromolecules 8 (2007) 3823.[27] Z. Lian, L. Ye, J. Appl. Polym. Sci. 128 (2013) 3325.[28] O. Zamoume, S. Thibault, G. Regnié, M.O. Mecherri, M. Fiallo, P. Sharrock,
Mater. Sci. Eng. C 31 (2011) 1352.[29] A. Tabak, N. Yilmaz, E. Eren, B. Caglar, B. Afsin, A. Sarihan, Chem. Eng. J. 174
(2011) 281.
se-responsive drug release behavior of cationic chitosan based nano-d. Eng. Chem. (2016), http://dx.doi.org/10.1016/j.jiec.2016.12.023