Embed Size (px)
Citation preview

Ic
Ja
b
c
a
ARRAA
JLO
KIRPDT
1
elcua
wetfrrhddrF
TT
h0
Journal of Health Economics 47 (2016) 20–33
Contents lists available at ScienceDirect
Journal of Health Economics
jo u r n al homep age: www.elsev ier .com/ locate /econbase
nnovation in the pharmaceutical industry: New estimates of R&Dosts�
oseph A. DiMasia,∗, Henry G. Grabowskib, Ronald W. Hansenc
Tufts Center for the Study of Drug Development, Tufts University, United StatesDepartment of Economics, Duke University, United StatesSimon Business School, University of Rochester, United States
r t i c l e i n f o
rticle history:eceived 15 August 2014eceived in revised form 28 January 2016ccepted 29 January 2016vailable online 12 February 2016
EL classification:6531
a b s t r a c t
The research and development costs of 106 randomly selected new drugs were obtained from a surveyof 10 pharmaceutical firms. These data were used to estimate the average pre-tax cost of new drug andbiologics development. The costs of compounds abandoned during testing were linked to the costs ofcompounds that obtained marketing approval. The estimated average out-of-pocket cost per approvednew compound is $1395 million (2013 dollars). Capitalizing out-of-pocket costs to the point of marketingapproval at a real discount rate of 10.5% yields a total pre-approval cost estimate of $2588 million (2013dollars). When compared to the results of the previous study in this series, total capitalized costs wereshown to have increased at an annual rate of 8.5% above general price inflation. Adding an estimate of
eywords:nnovation&D costharmaceutical industryiscount rate
post-approval R&D costs increases the cost estimate to $2870 million (2013 dollars).© 2016 Elsevier B.V. All rights reserved.
echnical success rates
. Introduction
We provide an updated assessment of the value of the resourcesxpended by industry to discover and develop new drugs and bio-ogics, and the extent to which these private sector costs have
hanged over time. The costs required to develop these new prod-cts clearly play a role in the incentives to invest in the innovativectivities that can generate medical innovation. Our prior studies� We thank the surveyed firms for providing data, and individuals in those firmsho kindly gave their time when we needed some of the responses clarified. All
rrors and omissions are the responsibility of the authors. The Tufts Center forhe Study of Drug development (CSDD) is funded in part by unrestricted grantsrom pharmaceutical and biotechnology firms, as well as companies that provideelated services (e.g., contract research, consulting, and technology firms) to theesearch-based industry. Tufts CSDD’s financial disclosure statement can be foundere: http://csdd.tufts.edu/about/financial disclosure. The authors and Tufts CSDDid not receive any external funding to conduct this study. The R&D cost and expen-iture data for individual compounds and companies are proprietary and cannot beedistributed. Other data used were obtained from subscription databases and theood and Drug Administration (FDA) and other websites.∗ Corresponding author at: Tufts Center for the Study of Drug Development,ufts University, 75 Kneeland Street, Suite 1100, Boston, MA 02111, United States.el.: +1 617 636 2116; fax: +1 6176362425.
E-mail address: [email protected] (J.A. DiMasi).
ttp://dx.doi.org/10.1016/j.jhealeco.2016.01.012167-6296/© 2016 Elsevier B.V. All rights reserved.
also have been used by other researchers, including governmentagencies, to analyze various policy questions (US CongressionalBudget Office, 1998, 2006).
The full social costs of discovering and developing new com-pounds will include these private sector costs, but will also includegovernment-funded and non-profit expenditures on basic andclinical research that can result in leads and targets which drugdevelopers can explore. These additional costs can be substantial.1
However, it is difficult to identify and measure non-private expend-itures that can be linked to specific new therapies. Thus, we focushere on the private sector costs.
The methodological approach used in this paper follows thatused for our previous studies, although we apply additional statis-tical tests to the data (Hansen, 1979; DiMasi et al., 1991, 1995a,b,2003, 2004; DiMasi and Grabowski, 2007). Because the methodolo-
gies are consistent, we can confidently make comparisons of theresults in this study to the estimates we found for the earlier stud-ies, which covered earlier periods, to examine and illustrate trends1 For example, for fiscal year 2013, the United States National Institutes of Health(NIH) spent nearly $30 billion on the activities that it funds (http://officeofbudget.od.nih.gov/pdfs/FY15/Approp%20%20History%20by%20IC%20through%20FY%202013.pdf).

ealth
itdcp
mfipesiois
onpsodoaa
dopdtddmatar
2i
dtriopstp
oSdtsy
(
wt
ities (some of which often overlap). Basic and applied researchinitiate the process with discovery programs that result in thesynthesis or isolation of compounds that are tested in assays andanimal models in preclinical development. We do not have the level
J.A. DiMasi et al. / Journal of H
n development costs. These studies used compound-level data onhe cost and timing of development for a random sample of newrugs first investigated in humans and annual company pharma-eutical R&D expenditures obtained through surveys of a numberharmaceutical firms.
We analyze private sector R&D activities as long-term invest-ents. The industrial R&D process is marked by substantial
nancial risks, with expenditures incurred for many developmentrojects that fail to result in a marketed product. Thus, our approachxplicitly links the costs of unsuccessful projects to those that areuccessful in obtaining marketing approval from regulatory author-ties. In addition, the pharmaceutical R&D process is very lengthy,ften lasting a decade or more (DiMasi et al., 2003). This makest essential to model accurately how development expenses arepread over time.
Given our focus on resource costs and how they have changedver time, we develop estimates of the average pre-tax cost ofew drug development and compare them to estimates coveringrior periods. We corroborated the basic R&D cost results in thistudy by examining the representativeness of our sample firms andur study data, and by incorporating a number of independentlyerived results and data relating to the industry and the drug devel-pment process into analyses that provide rough comparators fort least components of our cost results. The details of those analysesre provided in our online supplement.
The remainder of this paper is organized as follows. We brieflyiscuss the literature on pharmaceutical industry R&D costs sinceur 2003 study in Section 2. Section 3 briefly outlines the standardaradigm for the drug development process. In Section 4 weescribe the survey sample data and the population from whichhey were drawn, and briefly outline the methodology used toerive full R&D cost estimates from data on various elements of therug development process. We present base case pre- and post-arketing approval R&D cost estimates in Section 5. Sensitivity
nalyses are presented in Section 6. We describe the representa-iveness of our data, various approaches to validating our results,nd responses to various critiques in Section 7. Finally, we summa-ize our findings in Section 8.
. Previous studies of the cost of pharmaceuticalnnovation
Much of the literature on the cost of pharmaceutical innovationating back decades has already been described by the authors inheir previous two studies (DiMasi et al., 1991, 2003). The interestedeader can find references and discussions about the prior researchn those studies. The earliest studies often involved a case studyf a single drug (typically without accounting for the cost of failedrojects) or they analyzed aggregate data. We will focus here ontudies and reports that have emerged since DiMasi et al. (2003)hat involve the use of new data for at least some parts of the R&Drocess. The basic elements of these analyses are shown in Table 1.
Adams and Brantner (2006, 2010) sought to assess the validityf the results in DiMasi et al. (2003) with some alternative data.pecifically, in their 2006 article, they used a commercial pipelineatabase to separately estimate clinical approval and phase attri-
ion rates, as well as phase development times.2 They found aimilar overall cost estimate ($868 million versus $802 million inear 2000 dollars).3 The authors followed that study with another2 For mean out-of-pocket phase costs, they used the estimates in DiMasi et al.2003).
3 The Adams and Brantner (2006) study used records in the pipeline database thatere reported to have entered some clinical testing phase from 1989 to 2002. Thus,
hey did not follow the same set of drugs through time. The data for the commercial
Economics 47 (2016) 20–33 21
study that featured clinical phase out-of-pocket cost estimatesderived from regressions based on publicly available data on com-pany R&D expenditures (Adams and Brantner, 2010). They founda somewhat higher overall cost estimate ($1.2 billion in year 2000dollars).4
In a paper authored by two of the authors of this study (DiMasiand Grabowski, 2007), we provided a first look at the costs ofdeveloping biotech products (specifically, recombinant proteinsand monoclonal antibodies). The methodological approach was thesame as that used for our studies of traditional drug development.We used some data from DiMasi et al. (2003) combined with newdata on the costs of a set of biotech compounds from a single largebiopharmaceutical company. Biotech drugs were observed to havea higher average clinical success rate than small molecule drugs, butthis was largely offset by other cost components. We found that thefull capitalized cost per approved new compound was similar fortraditional and biotech development ($1.3 billion for biotech and$1.2 billion for traditional development in year 2005 dollars), afteradjustments to compare similar periods for R&D expenditures.
The other studies shown in Table 1 are discussed in detail inthe online supplement. One important finding emerging from thesurvey of cost studies in Table 1 is that clinical success rates are sub-stantially lower for the studies focused on more recent periods. Thisobserved trend is consistent with other analyses of success prob-abilities (DiMasi et al., 2010; DiMasi et al., 2013; Hay et al., 2014;Paul et al., 2010) and our analysis below. Average R&D (inflation-adjusted) cost estimates are also higher for studies focused on morerecent periods, suggesting a growth in real R&D costs. While sug-gestive, these studies are not strictly comparable to our earlieranalyses of R&D costs given methodological differences and dataomissions that are discussed in the online supplement (AppendixA).
3. The new drug development process
The new drug development process need not follow a fixedpattern, but a standard paradigm has evolved that fits the pro-cess well in general. We have described the process in somedetail in previous studies, and the FDA’s website contains aschematic explaining the usual set of steps along the way fromtest tube to new compound approval (http://www.fda.gov/Drugs/DevelopmentApprovalProcess/SmallBusinessAssistance/ucm053131.htm). Marketing approval applications for inves-tigational compounds submitted to the FDA for review bymanufacturers are referred to as new drug applications (NDAs)or biologic license applications (BLAs), depending on the type ofproduct.
In basic form, the paradigm portrays new drug discovery anddevelopment as proceeding along a sequence of phases and activ-
pipeline databases are also thin prior to the mid-1990s. The DiMasi et al. (2003)study covered new drugs that had first entered clinical testing anywhere in theworld from 1983 to 1994 and followed the same set of drugs through time.
4 However, the authors interpreted their estimate as a marginal, as opposed toan average, drug cost. The concept, though, of marginal cost has an unclear mean-ing here. With high fixed costs and a development process that varies by drug, it isdifficult to understand what marginal pharmaceutical R&D cost means in this con-text. It seems that the relevant marginal concept here is marginal profitability. Themarginally profitable drug could have a very high or a very low cost. What’s more,marginal profitability may only have meaning at the firm, not the industry, level.The cost of a marginally profitable drug in the pipeline of a firm may be high for onefirm and low for another firm.

22 J.A. DiMasi et al. / Journal of Health Economics 47 (2016) 20–33
Table 1Prior studies and analyses of pharmaceutical R&D costs (2003–2012).
Study Study period Clinical success rate Real cost of capital Inflation adjustment Cost estimate
DiMasi et al. (2003) First-in-humans, 1983–1994 21.5% 11.0% 2000 dollars $802 millionAdams and Brantner (2006) First-in-humans, 1989–2002 24.0% 11.0% 2000 dollars $868 millionAdams and Brantner (2010) Company R&D expenditures, 1985–2001 24.0% 11.0% 2000 dollars $1.2 billionDiMasi and Grabowski (2007) First-in-humans, 1990–2003 (large molecule) 30.2% (large molecule) 11.5% 2005 dollars $1.2 billionGilbert et al. (2003) 2000–2002 (launch) 8.0% NA 2003 dollars $1.7 billion
A
1.7%
0.7%
oatm
ch2nia
4
paestfdCipRlCkifromwmcL
dwcc
aE
(
tt
to
O’Hagan and Farkas (2009) 2009 (launch) NPaul et al. (2010) ≈2007 1Mestre-Ferrandiz et al. (2012) In clinical development, 1997–1999 1
f granularity to disaggregate R&D expenditure data into discoverynd preclinical development testing costs, so for the purposes ofhis study, as in prior studies, discovery and preclinical develop-
ent costs are grouped and referred to as pre-human costs.5
Clinical (human) testing typically proceeds through three suc-essive, sometimes overlapping phases. Historically, human testingas often been initiated first outside the United States (DiMasi,001). For any of these clinical phases, pharmaceutical compa-ies may pursue development of their investigational compounds
n multiple indications prior to and/or after the initial indicationpproval.
. Data and methods
Ten multinational pharmaceutical firms of varying sizesrovided data through a confidential survey of their new drugnd biologics R&D costs.6 Data were collected on clinical phasexpenditures and development phase times for a randomlyelected sample of the investigational drugs and biologics ofhe firms participating in the survey.7 The sample was takenrom a Tufts Center for the Study of Drug Development (CSDD)atabase of the investigational compounds of top 50 firms. TuftsSDD gathered information on the investigational compounds
n development and their development status from commercialipeline intelligence databases (IMS R&D Focus and Thomsoneuters Cortellis database [formerly the IDdb3 database]), pub-
ished company pipelines, clinicaltrials.gov, and web searches.ost and time data were also collected for expenditures on theind of animal testing that often occurs concurrently with clin-cal trials.8 The compounds chosen were self-originated in theollowing sense. Their development from synthesis up to initialegulatory marketing approval was conducted under the auspicesf the surveyed firm. This inclusion criterion is broader than itight at first seem since it includes compounds of firms thatere acquired or merged with the survey firm during develop-
ent and drugs that originated with the survey firm and wereo-developed (and for which full cost data were available).9
icensed-in and co-developed compounds without partner
5 We capture out-of-pocket discovery costs with our data, but the pre-synthesisiscovery period is highly variable with no clear starting point. For our analysese began our representative discovery and development timeline at the point of
ompound synthesis or isolation. Thus, our estimates of time costs are somewhatonservative.
6 Using pharmaceutical sales in 2006 to measure firm size, 5 of the survey firmsre top 10 companies, 7 are top 25 firms, and 3 are outside the top 25 (Pharmaceuticalxecutive, May 2007).7 A copy of the survey instrument can be found in our online supplement
Appendix G).8 Long-term teratogenicity and carcinogenicity testing may be conducted after
he initiation of clinical trials, and is often concurrent with phase I and phase IIesting.
9 The criterion also does not preclude situations in which the firm sponsors trialshat are conducted by or in collaboration with a government agency, an individualr group in academia, a non-profit institute, or another firm.
NA 2009 dollars $2.2 billion11.0% 2008 dollars $1.8 billion11.0% 2011 dollars $1.5 billion
clinical cost data were excluded because non-survey firms wouldhave conducted significant portions of the R&D.10
We also collected data from the cost survey participants on theiraggregate annual pharmaceutical R&D expenditures for the period1990–2010. The firms reported on total annual R&D expendituresbroken down by expenditures on self-originated new drugs, biolo-gics, diagnostics, and vaccines. Data were also provided on annualR&D expenditures for licensed-in or otherwise acquired new drugs,and on already-approved drugs. Annual expenditures on self-originated new drugs were further decomposed into expendituresduring the pre-human and clinical periods.
The survey firms accounted for 35% of both top 50 firm phar-maceutical sales and pharmaceutical R&D expenditures. Of the106 investigational compounds included in the project dataset,87 are small molecule chemical entities (including three syntheticpeptides), and 19 are large molecule biologics (10 monoclonal anti-bodies and nine recombinant proteins). For ease of exposition, wewill refer to all compounds below as new drugs, unless otherwiseindicated. Initial human testing anywhere in the world for thesecompounds occurred during the period 1995–2007. Developmentcosts were obtained through 2013.
We selected a stratified random sample of investigationalcompounds.11 Stratification was based on the status of testing as ofthe end of 2013. Reported costs were weighted to reflect the devel-opment status of compounds in the population relative to those inthe cost survey sample, so that knowledge of the distribution ofdevelopment status in the population from which the sample wasdrawn was needed. The population is composed of all investiga-tional compounds in the Tufts CSDD investigational drug databasethat met study criteria: the compounds were self-originated andfirst tested in humans anywhere in the world from 1995 to 2007.We found 1442 investigational drugs that met these criteria. Ofthese compounds, 103 (7.1%) have been approved for marketing,13 (0.9%) had NDAs or BLAs that were submitted and are still active,11 (0.8%) had NDAs or BLAs submitted but abandoned, 576 (39.9%)were abandoned in phase I, 19 (1.3%) were still active in phase I, 492(34.1%) were abandoned in phase II, 84 (5.8%) were still active inphase II, 78 (5.4%) were abandoned in phase III, and 66 (4.6%) werestill active in phase III. For both the population and the cost surveysample, we estimated approval and discontinuation shares for the
active compounds by phase so that the population and sample dis-tributions consisted of shares of compounds that were approved ordiscontinued in phase I, phase II, phase III, or regulatory review. The10 Large and mid-sized pharmaceutical firms much more often license-in thanlicense-out new drug candidates. Firms that license-in compounds for further devel-opment pay for the perceived value of the prior R&D typically through up-front fees,development and regulatory milestone payments, and royalty fees if the compoundshould be approved for marketing. For a breakdown of new drugs and biologicsapproved in the United States in the 2000s by business arrangements among firmsinitiated during clinical development, see DiMasi et al. (2014).
11 To ease the burden of reporting and increase the likelihood that firms wouldrespond, we limited the number of compounds to be reported on to a maximum of15 for any firm (with fewer compounds for smaller firms).

ealth Economics 47 (2016) 20–33 23
ctmdpds
eacaohsosdtmswe
i1smcttatwsrtatdie
5
5
doaFtwtsac
adt
Fig. 1. Estimated phase transition probability and overall clinical approval suc-
of clinical period failures for this study were 45.9% for phase I,43.5% for phase II, and 10.6% for phase III/regulatory review. The
J.A. DiMasi et al. / Journal of H
ost survey sample was purposely weighted toward compoundshat lasted longer in development to increase the amount of infor-
ation on drugs that reached late-stage clinical testing. Weights,etermined as described above, were then applied to the com-ounds in the cost dataset so that the results would reflect theevelopment status distribution for the population from which theample was drawn.
Some firms were not able to provide full phase cost data forvery new drug sampled. For example, phase I cost data were avail-ble for 97 of the 106 new drugs in the dataset (92%). Of the 82ompounds in the dataset that had entered phase II, cost data werevailable for 78 (95%). For phase III, cost data were available for 42f the 43 compounds that entered the phase (98%). However, wead cost data for at least one phase for each of the 106 drugs in theample. In aggregate, we had cost data for all phases entered for 94f the 106 compounds (89%).12 In addition, five compounds weretill active in a phase at the time that data were reported. For theserugs it is likely that there will be some additional future costs forhe drug’s most recent phase. Thus, for this reason our cost esti-
ates are likely to be somewhat conservative. However, given themall number of drugs in this category and the fact that the impactould be on only one phase for each of these drugs, our overall cost
stimates are not likely to be substantially affected.The methodology that we use to estimate development costs
s the same as the approach used in our earlier studies (Hansen,979; DiMasi et al., 1991, 2003). We refer the reader to the earliertudies and to our online supplement (Appendix A) for details. Theethodology results in a full risk-adjusted cost per approved new
ompound that also takes into account time costs. That is, we linkhe cost of compound failures to the cost of the successes (inves-igational compounds that attain regulatory marketing approval),nd we utilize a representative time profile along with an indus-ry cost of capital to monetize the cost of the delay betweenhen R&D expenditures are incurred and when returns to the
uccesses can first be realized (date of marketing approval). Weefer to the sum of out-of-pocket cost (actual cash outlays) andime cost per approved new compound as the capitalized cost perpproved new compound. The full capitalized cost estimate is builthrough a number of estimates of various components of the drugevelopment process. These individual component estimates are
nteresting as objects of analysis in their own right, and we providestimates for those components.
. Base case R&D cost estimates
.1. Out-of-pocket clinical cost per investigational drug
To determine expected costs, we need estimates of the clinicalevelopment risk profile. We examined the dataset of 1442 self-riginated compounds of top 50 pharmaceutical firms describedbove and estimated the phase transition probabilities shown inig. 1. The overall probability of clinical success (i.e., the likelihoodhat a drug that enters clinical testing will eventually be approved)as estimated to be 11.83%. This success rate is substantially lower
han the rate of 21.50% estimated for the previous study, but con-
istent with several recent studies of clinical success rates.13 Suchn increase in overall risk will contribute greatly to an increase inosts per approved new drug, other things equal.12 Phase cost correlation results presented in the online supplement, together withn examination of relative phase costs for drugs that had some missing phase costata, suggest that our phase cost averages (exclusive of missing data) are conserva-ive.13 See, for example, Paul et al. (2010), DiMasi et al. (2013), and Hay et al. (2014).
cess rates for self-originated new molecular entity (NME) and new therapeuticallysignificant biologic entity (NBE) investigational compounds first tested in humansanywhere from 1995 to 2007.
As described above, we calculated weighted means, medians,standard deviations, and standard errors for clinical phase costs.Some of the firms could not separate out long-term animal testingcosts during clinical development, and instead, included these costsin their phase cost estimates by year. To be consistent, therefore,for those compounds where animal costs were separately reported,we allocated those costs to the clinical phases according to whenthe animal testing costs were incurred. Thus, the clinical phasecosts presented in Table 2 are inclusive of long-term animal testingcosts.14
Weighted mean and median costs per investigational drugentering a phase15 increase for later clinical phases, particularlyfor phase III (which typically includes a number of large-scale tri-als). In comparison to our previous study (DiMasi et al., 2003), bothmean and median phase III cost are notably higher relative to theearlier phases. While the ratio of mean phase III cost to mean phaseI cost was 5.7 for the previous study, it was 10.1 here. Similarly, theratio of mean phase III to phase II cost was 3.7 for the earlier study,but was 4.4 for this study. Mean phase II cost was also higher rela-tive to phase I cost in the current study compared to the previousone (2.3 times as high compared to 1.5 times as high).16 Thus, whilemean cost in real dollars for phase I increased 28% relative to theprevious study,17 phase I costs were notably lower relative to bothphase II and phase III for the current study.
As we will see below, the differential in cost per approved newdrug between the two studies will be much greater than cost perinvestigational drug because of the much lower overall clinicalapproval success rate. However, our results do show that the impactis mitigated to some degree by firms failing the drugs that theydo abandon faster for the current study period. The distribution
14 When animal testing costs occurred in a year during which costs were incurredfor two clinical phases, the animal costs were allocated to the two phases accordingto their relative costs for the year.
15 Averages for unweighted costs did not differ greatly from the weighted costfigures. On an unweighted basis, mean phase I, phase II, and phase III costs were$29.7 million, $64.7 million, and $253.5 million, respectively.
16 The ratios for median costs for the current study are 11.6 for phase III relativeto phase I, 4.5 for phase III relative to phase II, and 2.6 for phase II relative to phaseI. The corresponding ratios for the previous study are 4.5, 3.6, and 1.2, respectively.
17 In real terms, median phase I cost was actually 4% lower for the current studycompared to the previous study.

24 J.A. DiMasi et al. / Journal of Health Economics 47 (2016) 20–33
Table 2Average out-of-pocket clinical period costs for investigational compounds (in millions of 2013 dollars).a
Testing phase Mean cost Median cost Standard deviation Standard error Nb Probability of entering phase (%) Expected cost
Phase I 25.3 17.3 29.6 3.0 97 100.0 25.3Phase II 58.6 44.8 50.8 6.6 78 59.5 34.9Phase III 255.4 200.0 153.3 34.1 42 21.1 54.0
Total 114.2
a All costs were deflated using the GDP implicit price deflator. Weighted values were ub N = number of compounds with cost data for the phase.
Table 3Nominal and real cost of capital (COC) for the pharmaceutical industry, 1994–2010.
1994 2000 2005 2010
Nominal COC (%) 14.2 14.9 13.3 11.4
cI
5
(atTwityp
powtcaiiotme(sraec
uc(opn
Sura
Inflation rate (%) 3.1 3.1 2.5 2.0Real COC (%) 11.1 11.8 10.8 9.4
orresponding figures for the previous study were 36.9% for phase, 50.4% for phase II, and 12.6% for phase III/regulatory review.
.2. Cost of capital estimates
To account for the time value of money in our previous paperDiMasi et al., 2003), we utilized an 11% real after-tax weightedverage cost of capital (WACC). In particular, we employed the capi-al asset pricing model (CAPM) to estimate the cost of equity capital.his was combined with the cost of debt, appropriately weightedith the cost of equity, to yield a representative, pharmaceutical
ndustry weighted after-tax cost of capital. The resultant parame-ers were estimated at regular intervals from the mid-1980s to theear 2000, given the time period spanned by our sample of R&Drojects.
In the present paper, we follow the same methodology to com-ute WACC. In the current R&D cost analysis, we have a samplef new drugs that began clinical trials in 1995 through 2007 andhich have an average introduction period in the latter part of
he 2000 decade. Hence, a relevant time period for our cost ofapital is the mid-1990s through 2010. Our analysis yielded anfter-tax weighted cost of capital of 10.5%, moderately lower thann our last paper. This reflects the fact that the cost of equity cap-tal has declined in pharmaceuticals since 2000 (as well as forther industrial sectors). Research intensive industries, includinghe pharmaceutical industry, generally finance most of their invest-
ents through equity, rather than through debt. This is the caseven when the cost of debt is significantly below the cost of equityHall, 2002; Vernon, 2004). One of the primary reasons is thatervicing debt requires a stable source of cash flows, while theeturns to R&D activities are skewed and highly variable (Scherernd Harhoff, 2000; Berndt et al., 2015). Given the low debt-to-quity ratios that exist for pharmaceutical firms, the cost of equityomponent dominates the computed WACC values in Table 3.
To obtain a real cost of capital, we first compute the nominal val-es and then subtract the expected rate of inflation. The nominalost of capital in 1994 is from a CAPM study by Myers and Howe1997). The estimates for 2000, 2005, and 2010 are based on our
wn analysis, utilizing a comparable approach, with a large sam-le of pharmaceutical firms.18 As this table shows, the estimatedominal cost of capital for pharmaceuticals was fairly stable during18 The sample is composed of all publically traded drug firms in the Value Lineurvey which also provides beta values and the other pharma-specific parameterssed in the CAPM calculations for the relevant years. The long-term horizon equityisk premium, and the yield on long-term government bonds employed in the CAPMnalysis, are from Ibbotson Valuation yearbooks for 2000, 2005, and 2010.
sed in calculating means, medians, and standard deviations.
the period 1994–2000 (14.2–14.9%). However, it decreased duringthe decade of 2000s, particularly after the global recession occurred(with a value of 11.4% observed in 2010).
As discussed in DiMasi et al. (2003), the rate of inflation wasabove historical values during the first part of the 1980s, but thenreceded back to or below historical levels throughout most of the1990s. Hence, we utilized the long run historical value for inflationfor the expected inflation level in 1994 and 2000 (3.1%), as in ourprior work. For the 2000s decade, inflation was significantly belowhistorical values. In this case, we employed a 5-year lagged movingaverage to compute the expected rate of inflation in 2005 and 2010(calculated as 2.5% and 2.0%, respectively).
As shown in Table 3, our estimates for the real cost of capitalvaried between 9.4% and 11.8% for pharmaceutical firms over the1994–2010 period. We elected to use the midpoint of this range,or approximately 10.5%, as the representative COC to capitalize ourR&D cost estimates.
The focus of our analysis is R&D investment expendituresand privately financed resources for new drugs undertaken bythe biopharmaceutical industry. Accordingly we capitalized theseexpenditures utilizing a cost of capital estimate based on financialdata from publicly listed firms. Drug development is also spon-sored and funded by government and non-profit agencies (e.g.,public–private partnerships devoted to developing medicines forneglected diseases). To the extent that our cost estimates areapplicable to these ventures, a social rate of discount would beappropriate to capitalize R&D outlays. We provide a sensitivityanalysis in Section 6 with respect to a wide spectrum of alternativecost of capital values.
5.3. Capitalized clinical cost per investigational drug
Opportunity cost calculations for clinical period expendituresrequire estimates of average phase lengths and average gaps oroverlaps between successive clinical phases to generate an aver-age clinical development and regulatory review timeline. Meanphase lengths and the mean lengths of time between successivephases are shown in Table 4, along with the associated capitalizedmean phase costs and capitalized expected phase costs by phasefor investigational compounds. The time between the start of clin-ical testing and submission of an NDA or BLA with the FDA wasestimated to be 80.8 months, which is 12% longer (8.7 months)than the same period estimated for the previous study. The averagetime from the start of clinical testing to marketing approval for ourtimeline was 96.8 months for the current study, 7% (6.5 months)longer than for the earlier study. The difference is accounted forby shorter FDA approval times. The period for the previous studyincluded, in part, a period prior to the implementation of the Pre-
scription Drug Use Fee Act of 1992 (PDUFA), and, in part, the earlyuser fee era for which approval times were somewhat higher thanfor later user fee periods (Berndt et al., 2005).19 While the approval19 The user fee legislation sunsets every 5 years. It has been renewed every 5years since its original enactment. Performance goals for FDA review of marketing
J.A. DiMasi et al. / Journal of Health Economics 47 (2016) 20–33 25
Table 4Average phase times and clinical period capitalized costs for investigational compounds (in millions of 2013 dollars).a
Testing phase Mean phase length Mean time to next phase Capitalized mean phase costb,c Capitalized expected phase costb,c
Phase I 33.1 19.8 49.6 49.6Phase II 37.9 30.3 95.3 56.7Phase III 45.1 30.7 314.0 66.4
Total 172.7
ere used in calculating means for costs and phase times. Phase times are given in months.0–2012).
ptrcttvtdopp
5
wdr1aot
pc$h
5d
rdTecttactpaa
ai
pp2
a All costs were deflated using the GDP implicit price deflator. Weighted values wb The NDA/BLA approval phase was estimated to be 16.0 months on average (200c Costs were capitalized at an 10.5% real discount rate.
hase averaged 18.2 months for the earlier paper’s study period,hat phase averaged 16.0 months for drugs covered by the cur-ent study.Other things being equal, the observed longer times fromlinical testing to approval yielded higher capitalized costs relativeo out-of-pocket costs. However, the discount rate that we used forhe current study is also lower than for the previous study (10.5%ersus 11.0%). The two effects work in offsetting ways. In addi-ion, capitalized clinical cost per investigational compound will alsoepend on the gaps and overlaps between phases. On net, the ratiof mean capitalized to out-of-pocket cost per investigational com-ound was slightly lower for the current study compared to therevious one (1.5 versus 1.7).20
.4. Clinical cost per approved new drug
Average cost estimates for investigational drugs are useful, bute are primarily interested in estimates of cost per approved newrug. As noted above, our analysis of drugs in development for theelevant period yielded a predicted overall clinical success rate of1.83%. Applying this success rate to our estimates of out-of-pocketnd capitalized costs per investigational drug results in estimatesf cost per approved new drug that link the cost of drug failures tohe successes.
Aggregating across phases, we found an out-of-pocket clinicaleriod cost per approved new drug estimate of $965 million and aapitalized clinical period cost per approved new drug estimate of1460 million. In constant dollars, these costs are 2.6 and 2.4 timesigher than those we found in our previous study, respectively.
.5. Pre-human out-of-pocket and capitalized costs per approvedrug
The pre-human period, as defined here, includes discoveryesearch as well as preclinical development. Some costs incurreduring this period cannot be associated with specific compounds.o deal with this issue, we analyzed reported aggregate annual firmxpenditures on self-originated new drugs by the pre-human andlinical periods. We gathered data on aggregate expenditures forhese periods from survey firms for 1990–2010. Both times seriesended to increase over time in real terms. Given this outcome,nd the fact that the clinical expenditures in 1 year will be asso-iated with pre-human expenditures that occurred years earlier,he ratio of total pre-human expenditures to total R&D (pre-human
lus clinical) expenditures over the entire study period would yieldn overestimate of the share of total cost per new drug that isccounted for by the pre-human period. To accurately estimatepplications under PDUFA were tightened somewhat for some applications after thenitial 5-year period.20 The differences in the ratios of capitalized to out-of-pocket cost for the individualhases were also small. For the current study they were 2.0, 1.6, and 1.2 for phase I,hase II, and phase III, respectively. For the earlier study, we found the ratios to be.0, 1.8, and 1.3 for phase I, phase II, and phase III, respectively.
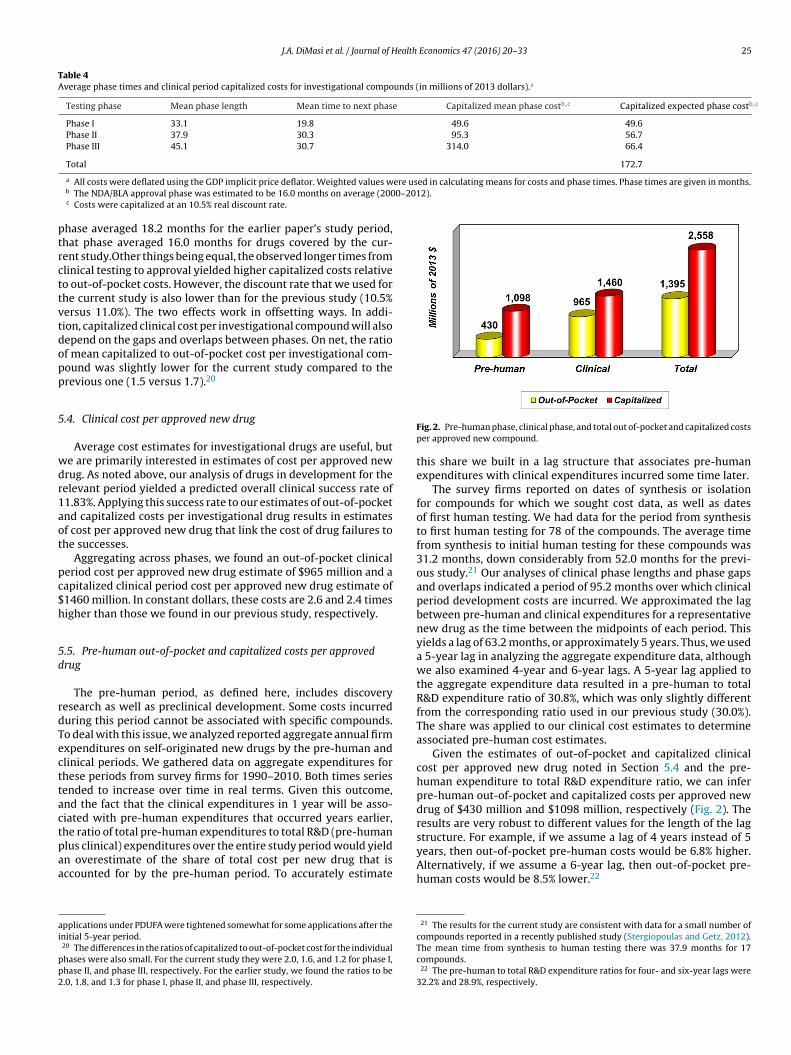
Fig. 2. Pre-human phase, clinical phase, and total out of-pocket and capitalized costsper approved new compound.
this share we built in a lag structure that associates pre-humanexpenditures with clinical expenditures incurred some time later.
The survey firms reported on dates of synthesis or isolationfor compounds for which we sought cost data, as well as datesof first human testing. We had data for the period from synthesisto first human testing for 78 of the compounds. The average timefrom synthesis to initial human testing for these compounds was31.2 months, down considerably from 52.0 months for the previ-ous study.21 Our analyses of clinical phase lengths and phase gapsand overlaps indicated a period of 95.2 months over which clinicalperiod development costs are incurred. We approximated the lagbetween pre-human and clinical expenditures for a representativenew drug as the time between the midpoints of each period. Thisyields a lag of 63.2 months, or approximately 5 years. Thus, we useda 5-year lag in analyzing the aggregate expenditure data, althoughwe also examined 4-year and 6-year lags. A 5-year lag applied tothe aggregate expenditure data resulted in a pre-human to totalR&D expenditure ratio of 30.8%, which was only slightly differentfrom the corresponding ratio used in our previous study (30.0%).The share was applied to our clinical cost estimates to determineassociated pre-human cost estimates.
Given the estimates of out-of-pocket and capitalized clinicalcost per approved new drug noted in Section 5.4 and the pre-human expenditure to total R&D expenditure ratio, we can inferpre-human out-of-pocket and capitalized costs per approved newdrug of $430 million and $1098 million, respectively (Fig. 2). Theresults are very robust to different values for the length of the lagstructure. For example, if we assume a lag of 4 years instead of 5years, then out-of-pocket pre-human costs would be 6.8% higher.
Alternatively, if we assume a 6-year lag, then out-of-pocket pre-human costs would be 8.5% lower.2221 The results for the current study are consistent with data for a small number ofcompounds reported in a recently published study (Stergiopoulas and Getz, 2012).The mean time from synthesis to human testing there was 37.9 months for 17compounds.
22 The pre-human to total R&D expenditure ratios for four- and six-year lags were32.2% and 28.9%, respectively.

26 J.A. DiMasi et al. / Journal of Health
Fd
5
patbt(p
5
paifistttwaipdtpsfi
afp1st
stdtrsf
million (Fig. 4). Since these costs occur after approval and we arecapitalizing all costs to the point of marketing approval, our dis-counted cost estimate is lower ($312 million). Thus, out-of-pocketcost per approved compound for post-approval R&D is 25.0% of
23 We refer to the discussion in DiMasi et al. (2003) and an accompanying AppendixA for more detail on the method.
24 This figure includes expenditures on biologics, vaccines, and diagnostics. Theself-originated share for therapeutic investigational drugs and biologics was 71.2%.
25 These expenditure shares are similar to those found for the previous study forthe 1980 to 1999 period. The results here are also similar to figures that the tradeassociation Pharmaceutical Research and Manufacturers of America (PhRMA) has
ig. 3. Trends in capitalized pre-human, clinical and total cost per approved newrug.
.6. Total capitalized cost per approved drug
Total cost estimates are the sum of pre-human and clinicaleriod cost estimates. Our base case total out-of-pocket cost perpproved new drug is $1395 million, while our fully capitalizedotal cost estimate is $2558 million (Fig. 2). Time costs (differencesetween capitalized cost and out-of-pocket cost) account for 45% ofotal cost. This share is down from the share in our previous study50%) and that for the study that preceded it (51%). This is due inart to a shorter pre-human period and a lower discount rate.
.7. Trends in R&D costs
Fig. 3 presents capitalized pre-human, clinical, and total coster approved new drug for the previous three studies in this seriesnd for our current study. In constant dollars, total capitalized costncreased 2.31 times for the second study in comparison to therst, 2.53 times for the third study in comparison to the secondtudy, and 2.45 times for the current study in comparison to thehird study. However, the samples for these studies include drugshat entered clinical testing over periods that are not uniformly dis-ributed. In addition, while the samples were chosen on the basis ofhen drugs entered clinical testing, changes over time in the aver-
ge length of the development process make ascribing differencesn the study periods according to the year of first human testingroblematic. An alternative is to determine an average approvalate for drugs in each study’s sample and use the differences inhese dates to define the time differences between the studies. Ourrevious study described this approach and presented the corre-ponding annual growth rates between successive studies for therst three studies.
Drugs in the current study sample obtained FDA marketingpproval from 2005 to 2013. The mean and median approval datesor drugs in the current study’s sample were both in 2008. For therevious study, we reported that the average approval date was in997. Thus, we used 11 years as the relevant time span between thetudies and calculated compound annual rates of growth betweenhe two studies accordingly.
Using the period differences described here and in our previoustudy, we determined the compound annual growth rates betweenhe studies for out-of-pocket and capitalized cost per approvedrug for pre-human, clinical, and total costs (Table 5). Compared
o the growth rate for the results in the previous study, the growthates for total out-of-pocket and capitalized costs for the currenttudy are somewhat higher (9.3% and 8.5% per year). The resultsor the current study in comparison to those for the previous studyEconomics 47 (2016) 20–33
are also noteworthy in that, after a substantial decline in the growthrate for real pre-human costs described in the previous studyand presented in Table 5, pre-human costs for the current studyresumed a much higher rate of growth. Conversely, the growthrates for clinical period expenditures declined from the very highrates for the previous study, although they are still substantial.
5.8. Cost of post-approval R&D
As we did for our most recent study, we develop indirect esti-mates of post-approval R&D costs. Post-approval R&D consists ofefforts subsequent to original marketing approval to develop theactive ingredient for new indications and patient populations, newdosage forms and strengths, and to conduct post-approval (phaseIV) research required by regulatory authorities as a condition oforiginal approval. We follow the methodology that we used inprevious study.23 We utilize our pre-approval estimates togetherwith aggregate pharmaceutical industry data regarding the drugdevelopment process to construct an estimate of the cost of post-approval R&D, which together with our pre-approval estimates,provide estimates of average total R&D cost per new drug cover-ing the entire development and product life-cycle. The data thatwe collected from the survey firms on company annual aggre-gate expenditures on biopharmaceutical R&D show that over thestudy period these firms spent 73.1% of their prescription biophar-maceutical R&D expenditures on investigational self-originatednew compounds,24 10.2% on investigational compounds that werelicensed-in or otherwise acquired, and 16.5% on improvements todrugs that have already been approved.25
We cannot, however, use the percentage of aggregate R&Dexpenditures spent on post-approval R&D on a current basis andapply it to a pre-approval cost estimate to obtain an appropriateestimate of the cost of post-approval R&D per approved compound.The reason is that pre-approval costs occur years before post-approval costs. We used our aggregate annual firm R&D data toobtain an appropriate ratio by building in a reasonable lag structurebetween pre-approval and post-approval costs.
For our base results we used, as we did for the previous study,a 10-year lag for the aggregate data (which is the approximatetime between median pre-approval development costs and medianpost-approval costs, given an 8-year post-approval expenditureperiod), we assumed that post-approval R&D cost per approvalis the same, on average, for licensed-in and self-originated com-pounds, and we determined the percentage of approvals for thecost survey firms that are self-originated to estimate the ratio ofpost-approval R&D cost per approved compound to pre-approvalcost per approved compound. The data indicated that this sharewas 33.4%. Applying this ratio, we estimated the out-of-pocketcost per approved compound for post-approval R&D to be $466
published for its member firms for the years 2003 and 2005 to 2010. Those datado not separate out expenditures on existing products, but they do distinguishbetween self-originated and licensed products. Aggregating across those years, theshares for self-originated, licensed, and uncategorized were 74.3%, 17.6%, and 8.1%,respectively.

J.A. DiMasi et al. / Journal of Health Economics 47 (2016) 20–33 27
Table 5Compound annual growth rates in out-of-pocket and capitalized inflation-adjusted costs per approved new drug.a
Approval periods Out-of-pocket Capitalized
Pre-human Clinical Total Pre-human Clinical Total
1970s to 1980s 7.8% 6.1% 7.0% 10.6% 7.3% 9.4%1980s to 1990s 2.3% 11.8% 7.6% 3.5% 12.2% 7.4%1990s to early 2010s 9.6% 9.2% 9.3% 8.8% 8.3% 8.5%
a Costs for 1970s approvals are from Hansen (1979), costs for 1980s approvals are from DiMasi et al. (1991), costs for the 1990s to the early 2000s are from DiMasi et al.(2003), and costs for the 2000s to early 2010s are from the current study.
Fd
tp
5
psbmwfomiwpapihawpC(
fatdecutcsc
Table 6Capitalized pre-human, clinical, and total costs per approved new drug (in millionsof 2013 dollars) by discount rate.
Discount rate Pre-human Clinical Total
1.0% 472 1012 14762.0% 517 1044 15613.0% 567 1086 16534.0% 621 1129 17505.0% 679 1175 18546.0% 742 1222 19647.0% 811 1271 20828.0% 885 1322 22079.0% 965 1376 2341
10.0% 1052 1431 248311.0% 1145 1489 263412.0% 1246 1549 279513.0% 1355 1612 296714.0% 1473 1677 3150
ig. 4. Out-of-pocket and capitalized total cost per approved new drug for newrugs and for improvements to existing drugs.
otal R&D cost (pre- and post-approval), while capitalized cost forost-approval R&D is 10.9% of total cost.
.9. Extensions to the base case
We can extend the base case results on drug development costsrior to original approval in a number of interesting ways. Theample dataset includes information on compound-level costs foroth chemical compounds (small molecules) and biologics (largeolecules). As reported in the online supplement (Appendix B),e examined investigational compounds by molecule size for dif-
erences in individual clinical phase costs. Since the distributionsf compounds across therapeutic classes differ for large and smallolecules, we conducted a regression analysis of phase costs for
nvestigational compounds for each of the three clinical phases,hile controlling for molecules size and therapeutic class. Sam-le sizes were somewhat limited when cut by both sample sizend therapeutic class, but we found statistically significant higherhase II costs for large molecules. However, we found that clin-
cal approval success rates for large molecules are substantiallyigher than for small molecules. As a result, clinical period cost perpproved compound was appreciably higher for small molecules,ith the ratio of costs nearly the same as we had estimated in arevious paper for an earlier period (DiMasi and Grabowski, 2007).ompete results are given and discussed in the online supplementAppendix B).
The base case results on full R&D costs link expenditures on drugailures to the costs of drugs that attain regulatory success. We canlso estimate the clinical period cost of taking a successful drug allhe way to approval by examining the data for just the approvedrugs in the sample. Focusing on that subsample also allowed us toxamine evidence on the costs for the more therapeutically signifi-ant drugs (according to what is known at the time of approval) bysing an FDA prioritization system for reviewing drugs submitted
o the agency for marketing approval. We found that clinical periodosts were substantially higher for the approved compounds in theample relative to our results for the sample as a whole, and thatosts were lower (although not at a statistically significant level)15.0% 1600 1744 3344
for compounds that the FDA had designated for a priority review(compounds thought to represent a significant gain over existingtherapy). These results are presented in full and discussed in theonline supplement (Appendix B).
6. Sensitivity analysis
We examined how sensitive the results were to extreme valuesin the data and to changes in certain critical parameters. In particu-lar, we focus in detail in this section on variation in the discount rateused to calculate capitalized costs. We also determine the extent towhich key cost drivers (cash outlays, risks, time, and the cost ofcapital) explain the increase in total cost per approved drug foundfor this study relative to our previous study.
In addition, since all of the parameters are subject to samplingerror, we conducted Monte Carlo simulations, reported on in detailin the online supplement (Appendix C), allowing all parameters tovary according to their sampling distributions (using Crystal BallTM
software). For the full capitalized pre-approval cost estimate, 80%of the simulation forecasts (set of 1000) varied between $2.3 billionand $2.8 billion. All of the forecasts varied between $1.9 billion and$3.2 billion.
Finally, we also conducted an outlier analysis to determine theimpact of the most extreme values in the dataset. The results showthat drugs with high and low costs have a fairly small impact on costestimates. For example, if all cost data for the drugs with the highestand lowest aggregate clinical costs are dropped from the analysis,then the full capitalized cost estimate falls by only 3.0% (3.5% if onlythe drug with the highest aggregate cost is dropped). The onlinesupplement (Appendix D) further describes in detail various outlieranalyses, including those that examine results when a number ofhigh and/or low values for each clinical phase are excluded even
though no one drug has uniformly high or low values across allclinical phases.
2 ealth Economics 47 (2016) 20–33
6
cvcccadwwechuct
6
tmtttci(tp
thaTDcTFtv
icaooihdeHmt
bMecrp
c
Table 7Impact on total capitalized cost per approved new drug due to changes in individualcost drivers (current study factor effect relative to prior studya cost).
Factor category Factor (change to currentstudy values)
Capitalizedcost (millionsof 2013 $)
Percentagechange in cost
Direct cash outlaysOut-of-pocket clinicalphase costs
1905 82.5%
Pre-human/clinical costratio
1061 1.6%
Overall out-of-pocket costs 1937 85.5%Risk
Clinical approval successrate with prior studydistribution of failures
1643 57.3%
Distribution of failureswith prior study clinicalapproval success rate
981 −6.0%
Overall risk profile: clinicalapproval success rate plusdistribution of failures
1538 47.3%
TimePre-human phase 993 −4.9%Clinical phase 1046 0.2%Regulatory review 1013 −3.0%Overall developmenttimeline
985 −5.6%
Cost of capitalDiscount rate 1012 −3.1%
8 J.A. DiMasi et al. / Journal of H
.1. Effects of variation in the discount rate
Table 6 shows how pre-human, clinical, and total capitalizedosts would vary by discount rate at one percentage point inter-als. The values for a zero percent discount rate are out-of-pocketosts. In the neighborhood of our base case discount rate (10.5%),linical cost changed by approximately $30 million, pre-human costhanged by approximately $45 million, and total cost changed bypproximately $75 million for every half of one percent shift in theiscount rate. In our previous study, the base case discount rateas 11.0%. At an 11.0% discount rate, total capitalized cost hereas $2634 million or 3% higher than our base case result. At more
xtreme values for the discount rate, Table 6 indicates that totalapitalized cost with a 15% discount rate was $3334 million, or 30%igher than our base case result. Similarly, a 3% discount rate (a fig-re often used as a social discount rate) yielded a total capitalizedost per approved new drug of $1561 million, or 39% lower thanhe base case result.26
.2. Impact of cost drivers
As noted in the previous section, the full cost estimate is a func-ion of numerous parameters that interact in a non-linear (often
ultiplicative) manner. That makes it difficult to isolate the extento which changes in individual parameters alone drive changes inotal costs. However, we can get a sense for which parameters hadhe greatest impacts, in either direction, on the change in total R&Dost between the previous study and the current one by calculat-ng what R&D costs would have been if only a single parameteror a set of related parameters) had changed from what it was forhe previous study to what we found it to be for the current studyeriod.
Table 7 shows our results for these thought experiments forhe major parameters categorized into four groupings (direct pre-uman and clinical average phase cash outlays, technical risks,verage development and approval times, and the cost of capital).he base result is total cost per approved new compound for theiMasi et al. (2003) study in year 2013 dollars ($1044 million). Theurrent study full cost estimate is 145% higher than the base result.hat change reflects the cumulative effect of all parameter changes.or the table, we examined parameter-by-parameter changes fromhe parameter values for the DiMasi et al. (2003) study to thosealues found for the current study.
The largest impact on the change in costs between the stud-es was driven by changes in average out-of-pocket clinical phaseosts, which resulted in an 82.5% increase in full cost.27 Consideringlso the small difference between the studies in the estimated ratiof pre-human to clinical costs, the impact of the change in directut-of-pocket phase costs was an increase in total cost of 85.5%. Thencrease in total cost was also driven to a substantial extent by muchigher development risks. The overall clinical approval success rateeclined from approximately one-in-five to approximately one-in-ight. That change alone accounts for a 57.3% increase in total cost.
owever, the impact of a lower clinical approval success rate wasitigated to a small extent by a shift in the distribution of failureso earlier in development. Taking both effects into account resulted
26 The appropriate social rate of discount for government backed expenditures haseen analyzed and debated extensively in the economics literature. See for example,oore et al., 2013 and Burgess and Zerbe, 2013. A standard reference in the cost-
ffectiveness literature (Gold et al., 1996) recommends 3% as the base case rate inomparing alternative medical therapies (“Therefore, we recommend that the baseate of 3% and an alternate rate of 5% be retained for a period of at least 10 years.”,.233).27 Given the methodology, higher out-of-pocket clinical phase costs also get asso-iated with higher out-of-pocket pre-human phase costs.
a DiMasi et al. (2003). In 2013 dollars the capitalized cost per approved new drugfor the prior study is $1044 million.
in an increase in total cost of 47.3%. Changes in the developmentand approval timeline had a relatively small depressing effect ontotal cost. This impact was driven by a shorter pre-human testingphase and a shorter average approval phase. Average clinical devel-opment time increased modestly, and this had a relatively smallimpact on total cost. Overall, the effect of changes in the devel-opment and approval timeline was a 5.6% decrease in total cost.Finally, the small change in the cost of capital had a 3.1% depress-ing effect on total cost. The aggregation of the direct impacts acrossthe four cost factor groupings accounted for a 124% increase in costsbetween the two studies. We attribute the residual increase (21%)to interaction effects.
7. Critiques, sample representativeness, and validation
Our prior study results have been questioned on a number ofmethodological and data grounds (Angell, 2005; Goozner, 2004;Light and Warburton, 2005a,b; Love, 2003; Young and Surrusco,2001). We have rebutted each of these criticisms in detail in a num-ber of venues (e.g., DiMasi et al., 2004, 2005a,b). We review thecritics’ main arguments only briefly here.
Goozner (2004) and Angell (2005) reject opportunity costcalculations because they, in essence, deny that industrial phar-maceutical R&D expenditures can be viewed as investments atrisk.28 These points are addressed more fully in DiMasi et al. (2004).Clearly, industrial pharmaceutical R&D meets the criteria for being
considered investments that have opportunity costs. In any event,an estimate with no opportunity costs is simply the out-of-pocketcost estimate.28 In the case of Goozner (2004), the claim is made that R&D expenditures areexpenses rather than investments, because accountants have traditionally treatedthem as such for tax purposes (failing to recognize practical measurement problemsunderlying why this has been the practice, such as great uncertainty regarding futureregulatory and commercial success). The basis offered for rejecting opportunity costsin Angell (2005, p.45) is simply the claim that pharmaceutical firms “have no choicebut to spend money on R&D if they wish to be in the pharmaceutical business”.

ealth
wiaaAttsebltb
7
tptgcf
tsiihsthopoim
s5ccs2c
imttus1suc
itod
top 50 firms versus 23% of all approvals).33 The survey firms werenearly indistinguishable from the population non-survey firms bythis metric (21% versus 23%).
31 Drugs for these indications, with some notable exceptions, tend to garner lowersales given limited patient populations. This contention is supported by recent dataanalysis conducted by IMS Health (Divino et al., 2014). They found that sales in theUnited States for orphan indications varied from only 4.8% to 8.9% of total pharma-ceutical sales over 2007–2013. The analysts also projected that growth in orphandrug expenditures would slow over 2014–2018.
32 The result was calculated from information provided by the FDA on its web-site and included in a Tufts CSDD database of NME and therapeutically significant
J.A. DiMasi et al. / Journal of H
A number of the critiques question how representative the dataere for prior studies, whether tax deductions and credits must be
ncluded, and whether any FDA application for product marketingpproval (as opposed to the active ingredient that is at the core ofll such applications) should be taken as the unit of observation.s noted, we have addressed all of these issues in earlier publica-
ions as they relate to our prior studies. In this section we examinehe representativeness of the survey firms and data used for thistudy, what the level of tax credits has been in relation to R&Dxpenditures in recent years, an analysis of molecules that haveeen approved for orphan drug indications recently, and we out-
ine a variety of methods using independent data that can be usedo validate our results (full details of the methods and analysis cane found in our online supplement).
.1. Representativeness of the survey firm data
Questions about data representativeness should be framed inerms of the population from which the sample was selected. Inarticular, it is relevant to compare characteristics of the investiga-ional drugs in our cost survey sample and for our cost survey firmsenerally to those of all drugs in our database of top 50 pharma-eutical firms, which is the relevant population.29 This is the mainocus of the analysis in this section.
Smaller research-oriented firms may have a comparative advan-age in the discovery and pre-human stages because they often havecientific researchers with close ties to the basic research underly-ng new classes of therapies and technology platforms. Even if thiss the case, the literature indicates that smaller firms also tend toave significantly higher costs of capital, especially when they aretart-ups financed by venture firms. The literature also indicateshat firms with larger R&D pipelines and greater R&D experienceave a higher probability of success during the costly clinical stagesf drug R&D. It is not evident, therefore, that the R&D costs for com-ounds originating in smaller firms, whether developed internallyr in alliances would be systematically lower than those originatingn mid-sized and large firms. We discuss what is known about R&D
etrics for small firms in Appendix E of the online supplement.As noted, the appropriate comparator dataset for our cost survey
ample is the population of investigational compounds of the top0 pharmaceutical firms over the relevant period. There are 1442ompounds in the top 50 firm database that met our study inclusionriteria. Of these, 510, or 35.4% belonged to nine of our 10 costurvey firms.30 Thus, the cost survey sample (n = 106) constitutes0.8% of the survey firm compounds and 7.4% of the populationompounds.
We determined the therapeutic class distribution for the drugsn the larger dataset for the four largest therapeutic classes and one
iscellaneous class (with a wide variety of drug types) for drugs inhe dataset that met our study inclusion criteria and compared ito the therapeutic class distribution for our cost sample. The pop-lation shares for antineoplastic, cardiovascular, central nervousystem (CNS), and systemic anti-infective drugs were 21.5%, 8.7%,9.0%, and 8.5%, respectively. The corresponding shares for the cost
urvey sample were 19.8%, 9.4%, 24.5%, and 8.5%, respectively. Wesed a chi-squared goodness-of-fit test to compare the therapeuticlass distributions for cost survey firm drugs and for the drugs of29 The data included in the top 50 firm dataset were curated primarily fromnformation contained in two commercial investigational drug pipeline databaseshat are available after payment of subscription fees. Additional information wasbtained from freely available web sites. See Section 4 above for a description ofata sources.30 One of the participating firms was outside of the top 50.
Economics 47 (2016) 20–33 29
the entire set of 50 firms in the database, and found no statisticallysignificant differences in the class shares (�2 = 2.4257, df = 4).
We also examined the degree to which the top 50 firms in aggre-gate and the sample of cost survey firms agreed in terms of howmolecule type (biologic versus small molecule) and the sourcingof compounds are distributed. For the set of top 50 firms, 14.6%of their self-originated investigational compounds over the studyperiod are large molecules, compared to 13.7% for the survey firms(p = 0.3933). In terms of the share of investigational compounds forthe study period that are self-originated (as broadly defined here),we found the share to be 74.1% for the cost survey firms and 71.1%for all top 50 firms (p = 0.1039).
Finally, we also examined the phase transition and overallapproval success rates for the cost survey firms and compared themto the corresponding estimates for the larger dataset. The phasetransition rates for just the cost survey firms were 58.0% for phase Ito phase II, 36.0% for phase II to phase III, 58.2% for phase III to reg-ulatory review, and 89.5% for regulatory review to approval. Thecorresponding figures for the population, as shown in Fig. 1, are59.5%, 35.5%, 62.0%, and 90.4%. The overall clinical approval successrate for just the cost survey firms implied by the phase transitionrates is 10.9%, which compares to 11.8% for the entire dataset.
7.2. Orphan drug development
Some past critiques have focused to some extent on orphan taxcredits, which can provide incentives to develop some drugs fora class of indications. We examine the extent to which these taxcredits and other tax issues are empirically significant in the contextof drug development as a whole in the next section. Here we brieflydiscuss the nature of development of molecules that are approvedfor orphan indications and the distinction between costs for orphandrug indications and the full development costs for molecules withorphan drug indication approvals.
Compounds developed for orphan indications may well havelower clinical development costs for those indications, as trial sizestend to be lower.31 The share of U.S. original new drug approvalsfrom 2000 to 2014 for drugs with an orphan indication was 27%, andhas increased in relative terms over the last 3 years of that period.32
The most recent approval experience aside, the share of approvalssponsored by the set of population firms (top 50) matches closelythe historical average for all approvals from 1987 to 2010 (22% for
biologic approvals. The share of new drug approvals with orphan indications hasincreased very recently. The Orphan Drug Act was enacted in 1983, but it took sev-eral years for an appreciable number of such approvals to appear. From 1987 to 1999the orphan drug share of all new drug approvals was 23%; the same share as for the2000–2010 period. The orphan drug share was, however, unusually high for 2014(41%), and above-average for 2011–2013 (approximately one-third of approvals).
33 An FDA analysis of Center for Drug Evaluation and Research (CDER) marketingapplications for NMEs and new biologics for 2006 to 2010 found that approximatelyone-third of the applications were sponsored by small firms, and that 75% of theapplications for first-in-disease therapies for orphan indications came from smallfirms (Lesko, 2011). Such firms may find a low R&D cost orphan disease orientedstrategy attractive, given that typical sales and operating profit levels may still besufficient to increase their market valuations.

30 J.A. DiMasi et al. / Journal of Health
Table 8Number of indications tested clinically prior to initial U.S. regulatory marketingapproval for therapeutic compounds approveda in 2014 by orphan drug status.
Mean Median Range % multipleindications
Orphan (n = 17) 8.5 7.0 1–4 88%Orphan cancer (n = 9) 10.9 9.0 1–24 89%Non-orphan (n = 22) 2.7 2.0 1–7 73%All approvals (n = 39) 5.3 3.0 1–24 79%
aS
apaawrtbo
hUilteinaop
7
aiaieitmataamom
bcb
waolcwb
a Therapeutic new molecular entities (NMEs) and new biologic entities (NBEs)pproved by the Center for Drug Evaluation and Research (CDER) of the Unitedtates Food and Drug Administration (FDA).
The cost survey sample contained two compounds that werepproved originally for orphan indications.34 The average clinicaleriod cost for these two compounds was nearly the same as theverage for all sample approved compounds (94% of the overallverage). One of the compounds, though, was relatively low cost,hile the other was relatively high cost. This may reflect the expe-
ience of molecules approved for orphan indications generally, asotal molecule cost depends not only on the approved indication,ut, critically, on the total number of indications (orphan and non-rphan) pursued.
To investigate this point further, we examined the developmentistories of all new therapeutic drugs and biologics approved in thenited States in 2014. We studied the records for these compounds
n two commercial pipeline database (IMS R&D Focus and Cortel-is), as well as the clinicaltrials.gov website. Table 8 demonstrateshat, even with a conservative notion of what constitutes differ-nt indications,35 molecules approved for orphan indications werenvestigated in a substantial number of indications prior to origi-al marketing approval. This was particularly true for compoundspproved for treating orphan cancer indications, and, in general, therphan drugs tended to be investigated in many more indicationsrior to approval than was the case for non-orphan compounds.
.3. Taxes and R&D expenditures
As in our previous studies, the cost estimates presented herere pre-tax. Our objective was to measure the level of and trendsn the private sector real resource costs of developing new drugsnd biologics. As discussed in DiMasi et al. (2003), if one is calculat-ng after-tax rates of return for R&D one would need to include theffect of taxes. Under current U.S. corporate income tax account-ng practices, firms are able to deduct R&D expenses at the timehey incur the costs. This is in contrast to many other invest-
ents, such as plants and equipment, which must be amortizednd depreciated over a longer time period. This treatment reflectshe difficulty of appropriately depreciating an intangible asset suchs R&D. Later, when the company earns profits from the sales ofpproved pharmaceuticals it cannot depreciate the R&D invest-
ent for income tax purposes. The advantage for R&D investmentver investment in plant and equipment is the timing of tax pay-ents on net income. If one were calculating the rate of return
34 Analyzing orphan drug status for investigational compounds is problematicecause the designation may be granted at any point during the development pro-ess. Thus, some compounds that might have been granted orphan drug status cane abandoned before that would occur.35 Indications may be defined quite narrowly. We chose a broad definition thatould limit the number of different indications pursued. Specifically, we considered
ll trials for the same disease and that applied to the same organ system as testingn the same indication. For example, oncology compounds may be tested as first-ine treatment, second-line treatment, for refractory patients, as a monotherapy, inombination with other compounds, or for special patient populations. These casesere considered to be the same indication if they applied to the same organ (e.g.,
reast cancer or prostate cancer).
Economics 47 (2016) 20–33
on R&D investments one would need to take into account the taximplications. Making these adjustments is complicated by the factthat major firms operate in multiple tax jurisdictions.
In DiMasi et al. (2003) we also discussed several tax creditsavailable in the United States to firms in the biopharmaceuticalindustry. In particular, we examined the Research & Experimenta-tion tax credit for increasing qualified research expenditures, whichwe concluded had little impact on large multinational pharma-ceutical firms.36 Since then, the Qualifying Therapeutic DiscoveryProject tax credit was created as part of the Patient Protection andAffordable Care Act of 2010 (http://grants.nih.gov/grants/funding/QTDP PIM/; accessed 14.08.14). However, it is quite restrictivein that it applies to discovery projects for small firms with alimit of $5 million per taxpayer. Recently, the U.S. Congress JointCommittee on Taxation (2013) estimated tax expenditures for fis-cal years 2012–2017 for the credit for increasing research activities,the Qualifying Therapeutic Discovery Project tax credit, and theadvantage from expensing, as opposed to amortizing, research andexperimental expenditures to be, in aggregate, in the range of $10billion to $12 billion per year for fiscal years 2012–2017 across allU.S. corporations engaged in research activities. It is not clear howmuch of this is accounted for by the biopharmaceutical industry.
We also examined in DiMasi et al. (2003) the impact of tax cred-its for orphan drug research, and found them to be quite small inrelation to total R&D expenditures for large pharmaceutical firms.The reporting requirements for orphan drug credits are such thatmany companies do not take the credit. The major financial incen-tive of the orphan drug program appears to be the intellectualproperty protection that is created from the granting of 7 yearsof marketing exclusivity. With respect to the magnitude of orphandrug tax credits utilized in the United States, the U.S. Congress JointCommittee on Taxation (2013) estimated that expected tax creditsfor orphan drug research are fairly small at between $700 millionand $1 billion per year from fiscal years 2012–2017.
To put these tax credits and tax advantages in perspec-tive, Battelle and R&D Magazine’s 2014 Global R&D Fund-ing Forecast (http://www.battelle.org/docs/tpp/2014 global rdfunding forecast.pdf?sfvrsn=4; accessed 14.08.14) estimates thatapproximately $79 billion will be spent in the United States onR&D by the biopharmaceutical industry.37 Some other countriesalso have a number of tax credit incentives in place for R&D. How-ever, it seems unlikely that, in aggregate, their value in relation toR&D expenditures for the biopharmaceutical industry is dispropor-tionately higher than is the case for the United States. The Battelleand R&D Magazine’s prediction of global R&D spending by the bio-pharmaceutical industry is approximately $171 billion. In sum, inaggregate the value of R&D tax credits and the tax advantage ofexpensing versus amortizing R&D expenditures for the biophar-maceutical industry appear to be no more than one-sixth of totalindustry R&D expenditures (and perhaps significantly less thanthat).
7.4. Validation
We gathered publicly available data and performed a numberof independent analyses on those data to corroborate our results.Details on methodology and data are provided in Appendix F of ouronline supplement. The validation efforts can be grouped into those
36 The impact may be greater for small firms if their R&D expenditures are growingmore rapidly.
37 The report estimates that the industrial life sciences sector will spend $92.6billion on R&D in the United States in 2014. However, the report also indicates thatapproximately 85% of all life sciences industrial expenditures are accounted for bythe biopharmaceutical industry.

ealth
taptc
SttlsycacWpPoKli
owtavomtNmettwbdoecmctwmle
fmtAvgaada
s
e
J.A. DiMasi et al. / Journal of H
hat utilize micro data on elements of the development process thatre then used to develop growth rate estimates for portions of therocess, and those that use publicly available aggregate financialime series data and compound approval statistics for biopharma-eutical firms as a check on our estimate of overall cost.
On a micro level, we examined survey data from the Nationalcience Foundation (NSF), published estimates of trends in clinicalrial complexity and clinical trial costs per subject, and publishedrade association times series data on R&D employment levels. Uti-izing external data on costs per subject, along with clinical trializes and estimated clinical approval success rates from our anal-ses over time, we found a compound annual growth rate in reallinical trial costs between the study periods for our previous studynd the current study of 9.9%, which is close to our clinical periodost growth rate of 9.2% for out-of-pocket costs shown in Table 5.
e also examined measures of clinical trial complexity (number ofrocedures per trial) in the published literature (Getz et al., 2008;AREXEL, 2005) and found a compound annual growth rate of 10.0%ver our study period. Finally, we utilized trade association and 10-
information on R&D scientific and professional staff employmentevels and NSF data on salary levels to estimate that labor costsncreased at a rate of 8–9% per year across our study periods.
We examined PhRMA time series data on the R&D expendituresf its member firms. The reported growth rate for cost survey firmsas 4.9%, compared to 4.2% for the PhRMA time series data for
he portion of the survey period that could be compared.38 Welso used the industry time series data, as we had in the pre-ious study, in two ways to get a sense for the magnitude ofverall costs per approved new molecule. In one approach, we esti-ated the portion of the reported time series expenditure levels
hat could be attributed to self-originated compound development.ext we determined the annual number of approvals of PhRMA-ember firms that were self-originated. Finally, we used our study
stimated time-expenditure profile to link aggregate R&D expendi-ures to approvals. For reasons expounded upon in the supplement,his will likely yield an upper bound estimate. Using this approache found our out-of-pocket cost per approved molecule estimate to
e 56% of the estimate derived from aggregate published industryata. The second approach focuses on the published industry self-riginated R&D expenditure level for a single year, assumes thatvery self-originated member-firm approval (inclusive of failures)osts what we found to be our average out out-of-pocket cost esti-ate, and uses our estimated time-expenditure profile to spread
osts out over time to explain reported total R&D expenditures forhe year considered. As with the previous method, the outcomeould be problematic if using our average out-of-pocket cost esti-ate explained more than the reported aggregate R&D expenditure
evel. We found that this approach explained 57% of the reportedxpenditures.
Company total biopharmaceutical R&D expenditures reportedor the cost survey are consistent with the audited financial state-
ents of the firms in that the annual values are equal to or lowerhan company R&D expenses found in the financial statements.39
s another check on our overall results, we examined what sur-ey company total biopharmaceutical R&D expenditures would beiven our estimate of out-of-pocket cost per approved moleculend assuming that entry rates to survey company pipelines are in
steady state. That figure can then be compared to R&D expen-iture levels reported for these firms for our cost survey (which,s noted, match audited financial statements). Full details of these
38 As explained in the Supplement, the growth rate for the PhRMA time series mayomewhat underestimate the true growth rate.39 Biopharmaceutical R&D expenditures may be less than total company R&Dxpenditures if the firm engages in non-biopharmaceutical R&D.
Economics 47 (2016) 20–33 31
calculations are in Appendix F of the supplement. Depending onassumptions, we found that we could account for between 51% and94% of the reported total annual biopharmaceutical R&D expendi-tures in this way. Thus, all three approaches using aggregate R&Dexpenditure data suggest that our estimate of out-of-pocket costper approved molecule is, if anything, conservative.
8. Conclusions
Studies of the cost of developing new drugs have long beenof substantial interest to drug developers, drug regulators, policymakers, and scholars interested in the structure and productivity ofthe pharmaceutical industry and its contributions to social welfare.The interest has been strong and growing over the last few decadesduring which cost containment pressures for drugs approved formarketing have expanded and concerns have been raised aboutindustry productivity in an environment in which industry struc-ture has been evolving (Munos, 2009; Pammolli et al., 2011). Thechanging industrial landscape has featured consolidation amonglarge firms, growing alliances among firms of all sizes, and thegrowth of a small firm sector.
We have conducted the fourth in a series of comprehensivecompound-based analyses of the costs of new drug development.In the last study we reported average out-of-pocket and capitalizedR&D costs of $403 million and $802 million in 2000 dollars ($524million and $1044 million in 2013 dollars), respectively. For ourupdated analysis, we estimated total out-of-pocket and capitalizedR&D cost per new drug to be $1395 million and $2558 million in2013 dollars, respectively. To examine R&D costs over the entireproduct and development lifecycle, we also estimated R&D costsincurred after initial approval. This increased out-of-pocket costper approved drug to $1861 million and capitalized cost to $2870million. We validated our results in a variety of ways through analy-ses of independently derived published data on the pharmaceuticalindustry.
Our pre-approval out-of-pocket cost estimate is a 166% increasein real dollars over what we found in our previous study, andour capitalized cost estimate is 145% higher. Roughly speaking,the current study covers R&D costs that yielded approvals, forthe most part, during the 2000s and early 2010s. Our previousstudy (DiMasi et al., 2003) generally involved R&D that resultedin 1990s approvals. The compound annual rates of growth in totalreal out-of-pocket and capitalized costs between the studies are9.3% and 8.5%, respectively. These growth rates are both somewhathigher than those we found for the two previous studies (7.6% and7.4%, respectively). Growth in out-of-pocket clinical period costshave moderated some from the 1990s, but the growth rate is stillhigh at 9.2%. While the compound annual growth rate for out-of-pocket pre-human costs declined substantially for the previousstudy (from 7.8% to 2.3%), this study showed a substantially highergrowth rate for pre-human costs in the new century (9.6%).
The success rate found for this study is nearly 10 percentagepoints lower than for the previous study. The overall change inthe risk profile for new drug development by itself still accounteddirectly for a 47% increase in costs. It is difficult to know defini-tively why failure rates have increased, but a number of hypothesesworthy of testing come to mind. One possibility is that regulatorshave become more risk averse over time, especially in the wake ofhigh profile safety failures for drugs that have reached the market-place (most notably, VioxxTM, but there have been others as well).It may also be the case that the industry has generally focused more
in areas where the science is difficult and failure risks are high asa result (Pammolli et al., 2011). Finally, the substantial growth inidentified drug targets, many of which may be poorly validated,may have encouraged firms to pursue clinical development of more
3 ealth
cw
eiittdimests9
dHopiAbcnatDoarnbaima
ormjcm
A
t0
R
A
A
A
B
B
B
2 J.A. DiMasi et al. / Journal of H
ompounds with an unclear likelihood of success than they other-ise would.
As can be seen from results cited in the supplement developedxternal to this study, as well as our own data, out-of-pocket clin-cal cost increases can be driven by a number of factors, includingncreasing clinical trial complexity (Getz et al., 2008), larger clinicalrial sizes, inflation in the cost of inputs taken from the medical sec-or that are used for development, and possibly changes in protocolesign to include efforts to gather health technology assessment
nformation and, relatedly, testing on comparator drugs to accom-odate payer demands for comparative effectiveness data. The
xpansion of the scope of the clinical trial enterprise during ourtudy period is illustrated by the finding in Getz and Kaitin (2015)hat for a typical phase III trial information had been gathered byponsors on nearly 500,000 data points in 2002, but more than00,000 data points in 2012.
Finally, it is difficult to assess whether and how regulatory bur-ens may have impacted changes in industry R&D costs over time.owever, occasionally, an exogenous shift in the types and amountf information perceived as necessary for regulatory approval forarticular classes of drugs can be instructive. For example, dur-
ng our study period the FDA issued guidance (Food and Drugdministration, 2008) for the development of drugs to treat dia-etes in late 2008 that highlighted a need to better assess andharacterize cardiovascular risks for this class of compounds, after aumber of cardiovascular concerns emerged regarding a previouslypproved drug (Avandia®). A number of development metrics posi-ively related to R&D costs can be examined pre- and post-guidance.iMasi (2015), for example, found that average U.S. clinical devel-pment times increased from 4.7 to 6.7 years for diabetes drugspproved in the United States from 2000–2008 to 2009–2014,espectively. In addition, Viereck and Boudes (2011) found that theumber of randomized patients and patient-years in NDAs for dia-etes drugs approved from 2005 to 2010 increased more than 2.5nd 4.0 times, respectively, before and after the guidelines weressued. Our sample data show that diabetes drugs were among the
ost costly (particularly for phase III [92% higher than the overallverage]).
Our analysis of cost drivers indicates that the rate of increasebserved in the current study was driven mainly by increases in theeal out-of-pocket costs of development for individual drugs and byuch higher failure rates for drugs that are tested in human sub-
ects, but not particularly by changes in development times or theost-of-capital. Continued analysis of the productivity of biophar-aceutical R&D should remain an important research objective.
ppendix. Supplementary data
Supplementary data associated with this article can be found, inhe online version, at http://dx.doi.org/10.1016/j.jhealeco.2016.01.12.
eferences
dams, C.P., Brantner, V.V., 2006. Estimating the cost of new drug development: isit really $802 million? Health Affairs 25 (March/April (2)), 420–428.
dams, C.P., Brantner, V.V., 2010. Spending on new drug development. Health Eco-nomics 19 (2), 130–141.
ngell, M., 2005. The Truth About the Drug Companies: How They Deceive Us andWhat to Do About It. Random House, New York, NY.
erndt, E.R., Gottschalk, A.H.B., Philipson, T.J., Strobeck, M.W., 2005. Industry fundingof the FDA: effects of PDUFA on approval times and withdrawal rates. NatureReviews Drug Discovery 4 (7), 545–554.
erndt, E.R., Nass, D., Kleinrock, M., Aitken, M., 2015. Decline in economic returnsfrom new drugs raises questions about sustaining innovations. Health Affairs 34(2), 245–252.
urgess, D.F., Zerbe, R.O., 2013. The most appropriate discount rate. Journal ofBenefit-Cost Analysis 4 (3), 391–400.
Economics 47 (2016) 20–33
DiMasi, J.A., Hansen, R.W., Grabowski, H.G., Lasagna, L., 1991. Cost of innova-tion in the pharmaceutical industry. Journal of Health Economics 10 (2),107–142.
DiMasi, J.A., Hansen, R.W., Grabowski, H.G., Lasagna, L., 1995a. Research and devel-opment costs for new drugs by therapeutic category: a study of the U.S.pharmaceutical industry. PharmacoEconomics 7, 152–169.
DiMasi, J.A., Grabowski, H.G., Vernon, J., 1995b. R&D costs, innovative output andfirm size in the pharmaceutical industry. International Journal of the Economicsof Business 2, 201–219.
DiMasi, J.A., 2001. New drug development in the United States from 1963 to 1999.Clinical Pharmacology & Therapeutics 69 (5), 286–296.
DiMasi, J.A., Hansen, R.W., Grabowski, H.G., 2003. The price of innovation: new esti-mates of drug development costs. Journal of Health Economics 22 (2), 151–185.
DiMasi, J.A., Hansen, R.W., Grabowski, H.G., 2004, November. Assessing ClaimsAbout the Cost of New Drug Development: A Critique of the Public Citizenand TB Alliance Reports, http://csdd.tufts.edu/files/uploads/assessing claims.pdf (accessed 16.07.14).
DiMasi, J.A., Hansen, R.W., Grabowski, H.G., 2005a. Reply: extraordinaryclaims require extraordinary evidence. Journal of Health Economics 24 (5),1034–1044.
DiMasi, J.A., Hansen, R.W., Grabowski, H.G., 2005b. Setting the record straight on set-ting the record straight: response to the Light and Warburton rejoinder. Journalof Health Economics 24 (5), 1049–1053.
DiMasi, J.A., Grabowski, H.G., 2007. The cost of biopharmaceutical R&D: is biotechdifferent? Managerial & Decision Economics 28 (4–5), 285–291.
DiMasi, J.A., Feldman, L., Seckler, A., Wilson, A., 2010. Trends in risks associatedwith new drug development: success rates for investigational drugs. ClinicalPharmacology & Therapeutics 87 (3), 272–277.
DiMasi, J.A., Reichert, J.M., Feldman, L., Malins, A., 2013. Clinical approval successrates for investigational cancer drugs. Clinical Pharmacology & Therapeutics 94(3), 329–335.
DiMasi, J.A., Kim, J., Getz, K.A., 2014. The impact of collaborative and risk-sharinginnovation approaches on clinical and regulatory cycle times. Therapeutic Inno-vation and Regulatory Science 48 (3), 482–487.
DiMasi, J.A., 2015. Regulation and economics of drug development. In: Presentationat the American Diabetes Association 75th Scientific Sessions, June 5, Boston,MA, http://professional.diabetes.org/presentations details.aspx?session=4619(accessed 27.11.15).
Divino, V., Dekoven, M., Weiying, W., Kleinrock, M., Harvey, R.D., Wade, R.L., Kaura,S., 2014. The budget impact of orphan drugs in the US: a 2007–2013 MIDASsales data analysis. In: Presentation at the 56th ASH Annual Meeting and Expo-sition, December 8, Orlando, FL, http://www.imshealth.com/deployedfiles/imshealth/Global/Content/Home%20Page%20Content/Real-World%20insights/IMS-Celgene Orphan Drugs ASH Presentation Slides.pdf (accessed 25.05.15).
Food and Drug Administration, 2008, December. Guidance for Industry: DiabetesMellitus – Evaluating Cardiovascular Risk in New Antidiabetic Therapies to TreatType 2 Diabetes. U.S. Department of Health and Human Services, Food andDrug Administration, Center for Drug Evaluation and Research (CDER), Rockville,MD.
Getz, K.A., Wenger, J., Campo, R.A., Seguine, E.S., Kaitin, K.I., 2008. Assessing theimpact of protocol design changes on clinical trial performance. American Jour-nal of Therapeutics 15, 450–457.
Getz, K.A., Kaitin, K.I., 2015. Why is the pharmaceutical industry struggling? In:Schuber, P., Buckley, B.M. (Eds.), Re-Engineering Clinical Trials. Academic Press,London, UK, pp. 3–15.
Gilbert, J., Henske, P., Singh, A., 2003. Rebuilding big pharma’s business model. InVivo 21 (10), 1–10.
Gold, M.R., Siegel, J.E., Russell, L.B., Weinstein, M.C., 1996. Cost-Effectiveness inHealth and Medicine. Oxford University Press, New York, NY.
Goozner, M., 2004. The 800 Million Dollar Pill: The Truth Behind the Cost of NewDrugs. University of California Press, Berkeley, CA.
Hall, B.H., 2002. The financing of research and development. Oxford Review of Eco-nomic Policy 18 (1), 35–51.
Hansen, R.W., 1979. The pharmaceutical development process: estimates of currentdevelopment costs and times and the effects of regulatory changes. In: Chien,R.I. (Ed.), Issues in Pharmaceutical Economics. Lexington Books, Lexington, MA,pp. 151–187.
Hay, M., Thomas, D.W., Craighead, J.L., Economides, C., Rosenthal, J., 2014. Clinicaldevelopment success rates for investigational drugs. Nature Biotechnology 32,40–51.
Ibbotson Associates, 2000, 2005, 2010. Stocks, Bonds, Bills & Inflation: 2000, 2005,2010 Yearbook. Ibbotson Associates, Chicago, IL.
Lesko, L.J., 2011, March. Introduction: Rare Diseases, Orphan Drugs. Advisory Com-mittee for Pharmaceutical Sciences and Clinical Pharmacology, http://www.fda.gov/downloads/AdvisoryCommittees/CommitteesMeetingMaterials/Drugs/AdvisoryCommitteeforPharmaceuticalScienceandClinicalPharmacology/UCM247635.pdf (accessed 29.05.15).
Light, D., Warburton, R., 2005a. Extraordinary claims require extraordinary evidence.Journal of Health Economics 24 (5), 1030–1033.
Light, D., Warburton, R., 2005b. Setting the record straight in the reply by DiMasi,Hansen and Grabowski. Journal of Health Economics 24 (5), 1045–1048.
Love, J., 2003. Evidence Regarding Research and Development Investments inInnovative and Non-Innovative Medicines. Consumer Project on Technology,Washington, DC.
Mestre-Ferrandiz, J., Sussex, J., Towse, A., 2012. The R&D Cost of a New Medicine.Office of Health Economics, London, UK.

ealth
M
M
M
O
P
P
P
S
Vernon, J.A., 2004. Pharmaceutical R&D investments and cash flows. Journal of Phar-
J.A. DiMasi et al. / Journal of H
oore, M.A., Boardman, A.E., Vining, A.R., 2013. More appropriate discounting: therate of social time preference and the value of the social discount rate. Journalof Benefit-Cost Analysis 4 (1), 1–16.
unos, B., 2009. Lessons from 60 years of pharmaceutical innovation. NatureReviews Drug Discovery 8 (12), 959–968.
yers, S.C., Howe, C.D., 1997. A Life-Cycle Financial Model of Pharmaceutical R&D,Working Paper, Program on the Pharmaceutical Industry. Massachusetts Insti-tute of Technology, Cambridge, MA.
’Hagan, P., Farkas, C., 2009. Bringing Pharma R&D Back to Health. Bain & Company,Boston, MA.
ammolli, F., Magazzini, L., Ricaboni, M., 2011. The productivity crisis in pharma-ceutical R&D. Nature Reviews Drug Discovery 10 (6), 428–438.
AREXEL, 2005. In: Mathieu, M.P. (Ed.), PAREXEL Pharamceutical R&D StatisticalSourcebook, Waltham, MA.
aul, S.M., Mytelka, D.S., Dunwiddie, C.T., Persinger, C.C., Munos, B.H., Lindborg,S.R., Schacht, A.L., 2010. How to improve R&D productivity: the pharmaceuticalindustry’s grand challenge. Nature Reviews Drug Discovery 9 (3), 203–214.
cherer, F.M., Harhoff, D., 2000. Technology policy for a world of skewed-distributedoutcomes. Research Policy 29 (4–5), 559–566.
Economics 47 (2016) 20–33 33
Stergiopoulas, S., Getz, K.A., 2012. Mapping and characterizing the developmentpathway from non-clinical through early clinical development. PharmaceuticalMedicine 26 (5), 297–307.
Young, B., Surrusco, M., 2001, July. Rx R&D Myths: The Case Against the Drug Indus-try’s R&D Scare Card. Public Citizen, Congress Watch, Washington, DC.
US Congressional Budget Office, 1998, July. How Increased Competition from GenericDrugs has Affected Prices and Returns in the Pharmaceutical Industry. US Gov-ernment Printing Office, Washington, DC.
US Congressional Budget Office, 2006, October. Research and Development in thePharmaceutical Industry. US Government Printing Office, Washington, DC.
U.S. Congress, Joint Committee on Taxation, 2013. Estimates of Federal Tax Expend-itures for Fiscal Years 2012–2017. U.S. Government Printing Office, Washington,DC, pp. 30–44, Table 1.
maceutical Finance, Economics & Policy 13 (4), 35–51.Viereck, C., Boudes, P., 2011. An analysis of the impact of FDA’s guidelines for
addressing cardiovascular risk of drugs for type 2 diabetes on clinical devel-opment. Contemporary Clinical Trials 32 (3), 324–332.