Embed Size (px)
Citation preview
Journal of Educational Psychology
Closing the Social Class Achievement Gap forFirst-Generation Students in Undergraduate BiologyJudith M. Harackiewicz, Elizabeth A. Canning, Yoi Tibbetts, Cynthia J. Giffen, Seth S. Blair,Douglas I. Rouse, and Janet S. HydeOnline First Publication, November 4, 2013. doi: 10.1037/a0034679
CITATIONHarackiewicz, J. M., Canning, E. A., Tibbetts, Y., Giffen, C. J., Blair, S. S., Rouse, D. I., & Hyde,J. S. (2013, November 4). Closing the Social Class Achievement Gap for First-GenerationStudents in Undergraduate Biology. Journal of Educational Psychology. Advance onlinepublication. doi: 10.1037/a0034679

Closing the Social Class Achievement Gap for First-Generation Studentsin Undergraduate Biology
Judith M. Harackiewicz, Elizabeth A. Canning, Yoi Tibbetts, Cynthia J. Giffen, Seth S. Blair,Douglas I. Rouse, and Janet S. Hyde
University of Wisconsin–Madison
Many students start college intending to pursue a career in the biosciences, but too many abandonthis goal because they struggle in introductory biology. Interventions have been developed to closeachievement gaps for underrepresented minority students and women, but no prior research hasattempted to close the gap for 1st-generation students, a population that accounts for nearly a 5th ofcollege students. We report a values affirmation intervention conducted with 798 U.S. students (154first-generation) in an introductory biology course for majors. For 1st-generation students, valuesaffirmation significantly improved final course grades and retention in the 2nd course in the biologysequence, as well as overall grade point average for the semester. This brief intervention narrowedthe achievement gap between 1st-generation and continuing-generation students for course grades by50% and increased retention in a critical gateway course by 20%. Our results suggest that educatorscan expand the pipeline for 1st-generation students to continue studying in the biosciences withpsychological interventions.
Keywords: values affirmation, first-generation college students, biology education, motivation, motiva-tional interventions
Many students start college intending to pursue a career inthe biomedical sciences, but too many abandon this goal be-cause they struggle in introductory biology courses. Underrep-resented minority (URM) students are particularly likely tostruggle in mathematics and science courses, and there havebeen many attempts to address these achievement gaps (Aron-son & Dee, 2012; Haak, HilleRisLambers, Pitre, & Freeman,2011). Gender gaps also occur in mathematics and some sci-
ences, especially physics, and interventions have addressedthese gaps as well (Miyake et al., 2010). Missing from theseachievement-gap research efforts, however, is attention to an-other at-risk group: first-generation college students. First-generation (FG) college students are those for whom neitherparent received a 4-year college degree, and they constituteroughly 15–20% of students in American universities (Bowen,Kurzweil, & Tobin, 2005; Saenz, Hurtado, Barrera, Wolf, &Yeung, 2007). These students tend to perform more poorly andhave higher dropout rates than continuing-generation (CG) stu-dents (those with at least one parent with a 4-year degree; Sirin,2005). This performance discrepancy has been referred to as thesocial-class achievement gap, because parental education isconsidered to be a proxy for social class or socioeconomicstatus (SES; Jackman & Jackman, 1983; Pascarella & Teren-zini, 1991; Snibbe & Markus, 2005). In other words, FG stu-dents are more likely to come from working class backgroundsas compared to the middle- and upper-class backgrounds of CGstudents, and they may face significant economic and socialbarriers in college.
A number of economic and social factors contribute to thesocial class achievement gap in college performance, includingpoverty (Reardon, 2011), quality of high school (Terenzini,Springer, Yaeger, Pascarella, & Nora, 1996), rigor of highschool preparation (Warburton, Bugarin, & Nunez, 2001), andparenting practices (Guryan, Hurst, & Kearney, 2008; Horvat,Weininger, & Lareau, 2003; Lareau, 2003; Ramey & Ramey,2010). However, the achievement gap may also reflect psycho-logical factors, to the extent that FG students experience thecollege environment as threatening, due to stereotypes abouttheir group or a mismatch of cultural values (Croizet & Claire,1998; Johnson, Richeson, & Finkel, 2011; Smeding, Darnon,
Judith M. Harackiewicz, Elizabeth A. Canning, and Yoi Tibbetts, De-partment of Psychology, University of Wisconsin–Madison; Cynthia J.Giffen and Seth S. Blair, Department of Zoology, University of Wiscon-sin–Madison; Douglas I. Rouse, Department of Plant Pathology, Univer-sity of Wisconsin–Madison; Janet S. Hyde, Department of Psychology,University of Wisconsin–Madison.
This research was supported by National Institutes of Health GrantR01GM102703. This research was also supported by the Graduate School,the Office of the Provost, and the Assessment Council of the University ofWisconsin, as well as the Institute of Education Sciences, U.S. Departmentof Education, through Award R305B090009 to the University ofWisconsin–Madison. We thank Kerstin Krautbauer; course coordinatorsJean Heitz, Kerry Martin, Brian Parks, and Carlos Peralta; and all theresearch assistants who helped to implement this study. We also thankGeoffrey Cohen, Tiffany Ito, Steve Kosciuk, Christopher Rozek, andLillian Tong for their help with the project. The opinions expressed arethose of the authors and do not represent views of the U.S. Department ofEducation or the National Institutes of Health.
Correspondence concerning this article should be addressed to Judith M.Harackiewicz, Department of Psychology, University of Wisconsin–Madison, 1202 West Johnson Street, Madison, WI 53706. E-mail:[email protected]
Thi
sdo
cum
ent
isco
pyri
ghte
dby
the
Am
eric
anPs
ycho
logi
cal
Ass
ocia
tion
oron
eof
itsal
lied
publ
ishe
rs.
Thi
sar
ticle
isin
tend
edso
lely
for
the
pers
onal
use
ofth
ein
divi
dual
user
and
isno
tto
bedi
ssem
inat
edbr
oadl
y.
Journal of Educational Psychology © 2013 American Psychological Association2013, Vol. 105, No. 4, 000 0022-0663/13/$12.00 DOI: 10.1037/a0034679
1
Souchal, Toczek-Capelle, & Butera, 2013; Stephens, Fryberg,Markus, Johnson, & Covarrubias, 2012). Here we report on asocial-psychological intervention designed to address thesocial-class achievement gap and promote retention in an in-troductory biology sequence for FG students.
Theoretical Framework
The theoretical framework for this research involves a novelintegration of the stereotype threat model with cultural mismatchtheory. The values affirmation intervention pioneered by Cohen,Garcia, Apfel, and Master (2006) was designed to close achieve-ment gaps by buffering students against the possibility of confirm-ing stereotypes about their group, known as “stereotype threat”(Steele, 1997). Steele argued that individuals experience apprehen-sion when confronted with personally relevant stereotypes thatthreaten their social identity or self-esteem, and that this appre-hension impairs performance on challenging academic tasks. Nu-merous laboratory experiments have shown that minority groupmembers (or women in math and science contexts) perform morepoorly when told that a test is diagnostic of ability, or whenstereotypes about their group are made salient, relative to non-evaluative, nondiagnostic, controls (Aronson & Inzlicht, 2004;Aronson et al., 1999; Steele & Aronson, 1995; Steele, Spencer, &Aronson, 2002). These results have been replicated in more than300 laboratory and field studies, ranging from studies of minoritystudents in middle school to White athletes in college, women inundergraduate physics classes, and elderly participants performingcognitive tasks (see Walton & Spencer, 2009, for meta-analyticreview). A few studies have examined stereotype threat and socialclass, and the results suggest that low SES college students dem-onstrate stereotype threat effects, performing more poorly whentested in evaluative contexts that make SES salient (Croizet &Claire, 1998; Croizet & Dutrévis, 2004; Harrison, Stevens, Monty,& Coakley, 2006; Spencer & Castano, 2007). These results suggestthat FG students may be vulnerable to the debilitating effects ofstereotype threat.
To combat threats to the self, Steele & Liu (1983) developed atechnique to promote self-integrity and self-worth via a writingintervention called self-affirmation or values affirmation (VA).Steele and Aronson (1995) were the first to apply this technique tothe problem of stereotype threat. The VA intervention involvesstudents writing about their most important values, which can helpthem cope with identity threat (Fein & Spencer, 1997; Sherman,Nelson, & Steele, 2000). When individuals affirm their core per-sonal values in a threatening environment, they can reestablish aperception of personal integrity and worth, which bolsters themagainst challenges and reduces stress (see McQueen & Klein,2006; Sherman & Cohen, 2006, for review). For example, Cre-swell et al. (2005) found that a VA intervention reduced physio-logical measures of stress for participants giving a presentation toa judgmental audience, and Sherman, Bunyan, Creswell, and Jar-emka (2009) found that a VA intervention reduced stress forstudents preparing for important exams.
In one of the earliest laboratory studies of gap closing with theVA intervention, Martens, Johns, Greenberg, and Schimel (2006)first documented that women showed stereotype threat effects ona challenging math test, performing more poorly than males whenthe test was presented as highly diagnostic of math ability. Under
these same diagnostic conditions, however, women who had com-pleted a VA intervention prior to the math test performed signif-icantly better, relative to both men and women in the controlcondition. In sum, values affirmation alleviates social identitythreat by making alternative sources of self-integrity salient,thereby relieving evaluative pressure and stress and allowing stu-dents to perform better on challenging tasks.
On the basis of these laboratory studies, researchers have de-veloped VA interventions that have been tested in randomizedfield studies in middle-school and college classes. The results havebeen striking. Cohen et al. (2006) showed that a VA interventionimplemented in middle-school classes significantly increasedcourse grades for African American students but did not affectgrades for European American students. The achievement gap forAfrican American students, relative to European American stu-dents, was reduced by 40%. Moreover, follow-up research showedthat the VA intervention had a long-lasting effect on students’overall GPA across all academic classes, persisting over a 2-yearperiod with supplemental VA exercises (Cohen, Garcia, Purdie-Vaughns, Apfel, & Brzustoski, 2009). More recently, Sherman etal. (2013) tested the VA intervention in a middle school where45% of students were Latino American and 47% were White. Theyfound that the intervention significantly improved grades for La-tino students but did not affect grades for White students, therebypartially closing the achievement gap for Latino students. Theseeffects persisted over 3 years (the length of the study): In controlconditions, grades for Latino students decreased sharply over time,whereas grades for Latino students in VA conditions remainedstable, suggesting that the VA intervention changed the trajectoryof academic performance for Latino students.
Finally, one study addressed the gender achievement gap inphysics and tested the VA intervention in a double-blind random-ized study in a college physics class (Miyake et al., 2010). Resultsindicated that men outperformed women in control conditions butthat the VA intervention improved exam scores as well as scoreson a standardized test of conceptual mastery of physics conceptsfor women. The gender gap in physics performance was reducedby 61%, suggesting that this brief intervention was effective inhelping women perform better. Considered together, the results ofthese three randomized field studies suggest that the VA interven-tion can be a powerful tool for educators.
Although the VA technique was first used to address concernsabout stereotype threat for minority students and women (Steele &Aronson, 1995), we hypothesized that the VA intervention mightalso prove effective for FG students, either by addressing thestereotype threat that FG students experience in academic contexts(Croizet & Millet, 2012) or by addressing cultural identity threatissues. In particular, Stephens and colleagues recently proposedcultural mismatch theory (Stephens, Fryberg, et al., 2012; Ste-phens, Markus, & Fryberg, 2012), in which they argued that FGstudents face an unseen disadvantage due to a cultural mismatchbetween the independent norms of the American university systemand their own interdependent motives for attending college. Theyprovided empirical support for three claims: (a) American univer-sity culture reflects pervasive middle-class norms of indepen-dence; (b) students are disadvantaged when there is a mismatchbetween their personal norms and university culture, such thatstudents who endorsed interdependent motives for attending col-lege obtained lower grades in their freshman year; and (c) the
Thi
sdo
cum
ent
isco
pyri
ghte
dby
the
Am
eric
anPs
ycho
logi
cal
Ass
ocia
tion
oron
eof
itsal
lied
publ
ishe
rs.
Thi
sar
ticle
isin
tend
edso
lely
for
the
pers
onal
use
ofth
ein
divi
dual
user
and
isno
tto
bedi
ssem
inat
edbr
oadl
y.
2 HARACKIEWICZ ET AL.

cultural mismatch experienced by FG students causes them toexperience college settings as relatively unfamiliar, uncomfort-able, and difficult, leading to a reduced sense of “fit” or belonging(Smart Richman & Leary, 2009; Walton & Cohen, 2007) andpoorer performance (Goldrick-Rab, Carter, & Wagner, 2007; Os-trove & Long, 2007; Trent, Orr, Ranis, & Holdaway, 2007). Morerecently, Stephens, Townsend, Markus, and Phillips (2012) haveshown that FG students experienced more stress (indexed bycortisol levels) and negative emotions when a task was framedwith independent versus interdependent cultural norms. Theseresults highlight the discomfort that FG students can experiencewhen their personal motives are inconsistent with universitynorms, offering further support for cultural mismatch theory (Ste-phens, Fryberg, et al., 2012).
Although the VA technique has proven to be effective in pro-moting performance for stereotyped groups in middle school andcollege physics classes, it has not been tested with FG students.Both the stereotype threat model and cultural mismatch theory leadto the prediction that the VA intervention should be effective forFG students. When FG students write about their most importantvalues, they may bolster themselves against perceived identitythreats (Cohen, Purdie-Vaughns, & Garcia, 2012), whether thosethreats are due to stereotypes about their group (Croizet & Claire,1998) or a mismatch between personal and institutional norms(Stephens, Fryberg, et al., 2012). Indeed, recent research suggeststhat VA interventions promote a sense of social belonging oracademic fit (Cook, Purdie-Vaughns, Garcia, & Cohen, 2012;Good, Rattan, & Dweck, 2012; Shnabel, Purdie-Vaughns, Cook,Garcia, & Cohen, 2013), and this may be particularly effective forFG students who endorse more interdependent motives for attend-ing college and who may experience a lower sense of academicbelonging (Stephens, Fryberg, et al., 2012). In other words, boththeoretical models suggest that FG students experience stress anduncertainty in college courses. Focusing on important values mayhelp FG students cope with this uncertainty and stress and promotemore effective performance in classes.
Scaling Up: Can the VA Intervention Work inUndergraduate Introductory Biology?
Calls for reform in science education have been extensive (By-bee & Fuchs, 2006; Mervis, 2013; Schulz, 2009), including reformin undergraduate biology education (Brewer & Smith, 2011; Mom-sen, Long, Wyse, & Ebert-May, 2010). At the undergraduate level,reforms typically must be implemented in the challenging contextof large-enrollment introductory courses. However, the VA inter-vention has not been tested on the scale of a large introductorycourse with multiple instructors and numerous discussion andlaboratory sections. In such classes, each student deals with manyinstructional personnel on a daily basis. Previous implementationsof the VA intervention were tested in several middle-schoolclasses, but each class was taught by a single teacher (Cohen et al.,2006; Sherman et al., 2013). In the only college study, the inter-vention was implemented in two sections of an introductory phys-ics course taught by the same lecturer (Miyake et al., 2010).
It may be significantly more challenging to implement the VAintervention in a larger course where there are multiple sections oflarge lectures, many instructional staff, and several discussion andlaboratory sections, all of which contribute to an impersonal con-
text in which it may be difficult to administer a personal writingexercise. Yet, these are precisely the conditions under whichthousands of students take these courses every year, and it isimportant to test the VA intervention in this context. Cohen et al.(2012) have argued that the success of this intervention depends onstudents perceiving the writing exercise as a course assignmentcoming from the instructor. The exercise has to be presented inclass, so that students see it as an integral part of the course (asopposed to something that researchers bring to students, for ex-ample). In complex, large science classes, however, there may bemany instructors, and it is not clear whether the intervention canwork across multiple lecturers in the same course. In addition,Cohen et al. posited that implementation efficacy in collegecourses depends on the confidentiality of the students’ writing, sothat they can write about their core values without worrying abouttheir instructors seeing or judging their writing. Thus, the writingexercise must be part of the course but not graded or evaluated.This creates a tricky balance in an undergraduate science class,where every assignment factors into a complex grading structure.These important requirements may be easier to satisfy in thecontext of a small class taught by a single instructor and moredifficult on a larger scale (Yeager & Walton, 2011).
The Current Study
In the study reported here, we tested the VA intervention in adouble-blind randomized experiment in an introductory biologysequence at a large public midwestern university. We addressedCohen et al.’s (2012) recommendations about course connected-ness and confidentiality to implement the VA intervention on alarge scale by working closely with course administrators. Wehypothesized that this VA intervention would prove effective inclosing the social class achievement gap and in promoting FGstudents’ decisions to continue in biology.
Method
Overview of Course
The study was conducted in the two-semester sequence ofintroductory biology for biology majors and premedical students,a course typically taken in the sophomore year. Without thiscourse, students cannot go on to any of 34 undergraduate biomed-ical majors (e.g., bacteriology, biochemistry, neuroscience, nurs-ing, zoology); it is the critical gateway course for premedicalpreparation and further study in the biological sciences. We con-ducted the experiment in the first course of this sequence. This15-week course covered three units: cellular biology, genetics, andevolutionary biology; students attended three 50-min lectures perweek, in one of three lecture sections, each taught by two or threedifferent lecturers. The content covered was comparable across thethree lecture sections. Exams were specific to each lecture section,but grading standards were consistent across sections and studentswere graded on the same scale.
Course structure. In addition to lectures, students also attendeda weekly 3-hr laboratory section, led by a graduate teaching assistant.There were 40 laboratory sections with about 20 students in eachsection, taught by a total of 14 teaching assistants (TAs). Students alsoattended a weekly 50-min discussion section. There were 40 recitation
Thi
sdo
cum
ent
isco
pyri
ghte
dby
the
Am
eric
anPs
ycho
logi
cal
Ass
ocia
tion
oron
eof
itsal
lied
publ
ishe
rs.
Thi
sar
ticle
isin
tend
edso
lely
for
the
pers
onal
use
ofth
ein
divi
dual
user
and
isno
tto
bedi
ssem
inat
edbr
oadl
y.
3CLOSING THE SOCIAL CLASS ACHIEVEMENT GAP

sections, and they were led by a different set of eight graduateteaching assistants. This complex course structure exposed students tomany instructional staff (multiple lecturers and two different TAs) aswell as a course coordinator (an academic staff member) for eachlecture section. All communications about course requirements andgrading came from the course coordinator.
Participants
Of the 804 undergraduate students who received a final grade at theend of the semester, 798 had agreed to participate in this research andgave consent for access to their academic records.1 The final samplecomprised 320 men and 478 women, with 644 continuing-generationand 154 first-generation students. In this sample, 7.6% of studentswere underrepresented minorities (URM: African American, His-panic, or Native American), and 92.4% of students were White ornontargeted ethnic minorities (80% White, 12.4% Asian or AsianAmerican), hereafter referred to as majority students. Of the 154 FGstudents, 3.2% were African American, 7.1% were Hispanic, and1.3% were Native American. Of the 644 continuing-generation stu-dents, 2.6% were African American, 3.1% were Hispanic, and 1%were Native American, suggesting that URM students were some-what overrepresented in the first-generation group, as expected, �2(1,N � 798) � 4.421, p � .04. However, URM students were not asheavily represented among FG students as on other campuses (forexample, Stephens, Fryberg, et al., 2012, found that 50% of theirsample of FG students was African American or Hispanic). Indeed,91% of the FG students in this study were majority. This ethnicdistribution is advantageous because it permits a test of FG effectsdisentangled from URM status.
The Intervention
Students were blocked on generational and URM status, gender,and lecture section and were randomly assigned to conditionwithin lab sections, in a double-blind design. Students completedeither a VA writing exercise or a control writing exercise in theirlaboratory sections. These writing assignments were deliveredearly in the semester (Week 3), with a second administrationshortly before the second exam (Week 8). Each student completedeither two values-affirmation writing exercises or two controlwriting exercises of similar format and length. There were 325 CGand 77 FG students in the affirmation condition and 319 CG and77 FG students in the control condition.
The Friday before each writing exercise was to be administeredin laboratory sections, the course coordinators included the fol-lowing text in the weekly newsletter e-mailed to all students:
This week there will be a special writing exercise in the first 10 or 15minutes of lab. This is designed to give you additional practice in bothcritical thinking and writing, which are essential parts of any career inbiology (or anything else for that matter). There is no need to study forthis. This in-class writing will be about something you know well. Wewant you to feel comfortable with this type of practice, so we’ve askedan independent group to administer the writing exercise so that it canbe confidential. They will let us know if you have completed theexercise so that you can receive credit for it, but your TAs, professors,and coordinators will not see your work. This is one of two suchexercises which are required in lab.
These instructions ensured that students knew that the assignmentcame from their professors and was required for class, but that theywould be writing in confidence and that the content of their workwould not be evaluated.
Laboratory sections were led by graduate student TAs who werenaive to the purpose of the study. Study personnel arrived at thebeginning of the laboratory period and distributed personally ad-dressed manila envelopes that contained the writing assignment(which had been assigned in advance, based on the randomizedblocked design). Although there were two versions of the writingassignment (values affirmation and control), the envelopes andformatting of the two exercises were similar. Students in eachexperimental condition received a three-page packet. The firstpage listed 12 values: being good at art; creativity; relationshipswith family and friends; government or politics; independence;learning and gaining knowledge; athletic ability; belonging to asocial group (such as your community, racial group, or schoolclub); music; career; spiritual or religious values; and sense ofhumor. The values and procedures were similar to those developedand validated in past research (Cohen et al., 2006; McQueen &Klein, 2006; Miyake et al., 2010; Sherman & Cohen, 2006). Cohenet al. (2006) noted that it is important that the list include a broadset of values but not include values directly related to academicperformance (grades, evaluation, etc.). Students in the affirmationcondition were instructed to circle the two or three values mostimportant to them, whereas students in the control condition wereinstructed to circle the two or three least important values. Thesecond page instructed students to describe in a few sentenceseither why the selected values were important to them (VA con-dition) or why they might be important to someone else (controlcondition). Students were told to focus on their thoughts andfeelings and not to worry about spelling and grammar or how wellwritten their essay was. The final page reinforced the manipulationby asking students to look again at the values they had selectedearlier. They were then asked to list either the top two reasons whythese values were important to them (VA condition) or the top tworeasons why someone else might pick these values as important(control condition). To encourage further reflection about thevalues, the third page ended by asking students to indicate theiragreement with several items using numerical scales (e.g., Ingeneral, I try to live up to these values in the affirmation conditionvs. In general, some people try to live up to these values in thecontrol condition). Students put the writing exercise back in themanila envelope when they were done, ensuring that TAs andstudy personnel remained blind to condition.
A second administration of the writing exercise was delivered inthe same manner shortly before the second midterm exam (Week8). The writing exercise was similar to the first writing exercise,except in the second exercise four values (curiosity, school spirit,nature and environment, and online social networking and/orgaming) were added to the list to make the assignment seemslightly different.
1 Twenty-four students dropped the course over the semester. Of thesestudents, 12 were FG, 2 were Black (1 FG), and 3 were Hispanic (2 FG).The fact that 50% of the dropouts were FG students, whereas only 15% ofthe sample was FG, and that 20% of the dropouts were URM whereas only7.6% of the sample was URM, highlights the importance of addressingmotivation and retention issues for these students.
Thi
sdo
cum
ent
isco
pyri
ghte
dby
the
Am
eric
anPs
ycho
logi
cal
Ass
ocia
tion
oron
eof
itsal
lied
publ
ishe
rs.
Thi
sar
ticle
isin
tend
edso
lely
for
the
pers
onal
use
ofth
ein
divi
dual
user
and
isno
tto
bedi
ssem
inat
edbr
oadl
y.
4 HARACKIEWICZ ET AL.

If students were not present during their laboratory section, theywere given the opportunity to complete the writing assignmentonline via an e-mailed link. The first writing exercise was com-pleted by 797 students (795 in laboratory sections), and the secondwriting exercise was completed by 793 students (790 in laboratorysections). Several steps were taken to ensure that all instructionalpersonnel associated with the course were unaware of students’condition assignment. All but senior research personnel were blindto the study’s purpose and hypotheses. Both writing exercisesoccurred without the course instructors or coordinators present.Laboratory TAs were informed by course coordinators that theirstudents would be completing a confidential writing assignment,and they remained blind to experimental condition.
Baseline Measures
Baseline measures were obtained in the second week of the course.Students were asked to complete a survey about their attitudes towardbiology in their laboratory section (students absent during this weekwere sent a link via e-mail to fill out the survey online). All items wereanswered on a 7-point scale ranging from not at all true to very true.Confidence about performance was measured with three items, � �.89 (“I am confident that I will do well in Introductory Biology,” “Iexpect to get a good grade in this course,” “I am confident that I canobtain a final grade of B or better in this course”). Concern aboutbackground was measured with one item (“I am not sure I have theright background for this course”).2
Students were asked to report their age, gender, race/ethnicity,and year in school. Students were also asked to indicate the highestlevel of education that their mother (or guardian) and father (orguardian) completed: grade school, high school, technical school,some college, bachelor’s degree, or graduate degree. We identifiedstudents as FG college students if neither of their parents orguardians had earned a bachelor’s degree.
We obtained other baseline data from students’ academic records;specifically, their ACT and/or SAT scores, their cumulative credits atthe university, and their GPA for the prior spring semester.
Outcome Measures
Questionnaire measures were obtained in the 14th week of the15-week course. Students were asked to complete a brief survey intheir assigned laboratory section (students absent during this weekwere sent a link via e-mail to fill out the survey online). Confi-dence about performance and concern about background weremeasured with items comparable to those used at baseline, ad-justed to reflect timing of measurement.
Grades. Course coordinators provided final course grades atthe end of the semester, and students’ grades for that semesteracross all courses were obtained from university records. Weconstructed a GPA for the other courses taken by students thatsemester, excluding the five credits of biology, so that biologygrade and semester GPA could be analyzed separately. Grades atthis university are calculated on a 4.0 scale (A � 4.0, AB � 3.5,B � 3.0, BC � 2.5, C � 2.0, D � 1.0, F � 0).
Continuation in the second semester. We tracked studentsfor 2 months after completing the first course, to see whether theyenrolled in the second course in the biology sequence in thefollowing spring semester (when 75–80% of students typicallycontinue).
Results
Preliminary Analyses
Randomization check. We used a 2 (Control vs. VA) � 2(FG vs. CG) analysis of variance model to test whether there weredifferences on baseline measures of age, cumulative credits, con-fidence about performance in the class, or concern about back-ground. These analyses allowed us to test whether randomizationwas effective, whether FG students differed from CG students atbaseline, and whether there was a significant interaction betweenexperimental condition and generational status on any baselinemeasure. We also analyzed two measures of prior performance,although we did not have complete data from all students: priorspring GPA (not available for the 104 first-year students and 4upperclass students) and ACT scores (not available for 87 stu-dents). There were no significant differences between conditionsor significant interactions of condition with generational status forany baseline variable, indicating that randomization was success-ful. We did find two significant main effects for generationalstatus: on age, t(796) � 5.17, p � .001, indicating that FG students(M � 19.70, SD � 2.08) were slightly older than CG students(M � 19.16, SD � 0.82), and on ACT, t(707) � 6.86, p � .001,indicating that CG students (M � 28.85, SD � 2.63) had higherscores than FG students (M � 27.11, SD � 3.02). No otherdifferences were significant.
Distribution by school year. We also tested whether thedistribution of students’ year in school varied as a function ofcondition and found that it did not. Table 1 presents means,standard deviations, and/or frequencies for all baseline measures asa function of treatment condition; no differences were significant,suggesting that randomization was successful.
Primary Analyses
The three primary outcome measures were the final grade in thebiology class, semester GPA (for all courses taken that semester,excluding biology), and continuation in the second course in theintroductory biology sequence. Because students were randomlyassigned to condition within lecture and lab sections (and blockedon gender, FG, and URM status), the data were analyzed withmultiple regression models, testing treatment effects at the studentlevel, controlling for lecture section. We used ordinary leastsquares regression for the two continuous outcome measures (bi-ology course grade and semester GPA) and logistic regression forthe dichotomous outcome measure (continuation in the secondbiology course). The same regression model was tested for eachoutcome measure, controlling for lecture section. We tested allinteractions between treatment condition (control � �1, VAintervention � 1), generational status (CG � �1, FG � 1), gender(male � 1, female � �1), and lecture section (two orthogonalcodes to control for differences between the three sections) andthen trimmed all interaction terms that were not significant in any
2 Two students did not answer the concern about background question.Although the item was significantly correlated with confidence, r(794) ��.39, p � .05, factor analyses indicated that this item did not load on theconfidence factor (including it in the Confidence scale reduced alpha from.89 to .21). It was therefore treated as a separate variable.
Thi
sdo
cum
ent
isco
pyri
ghte
dby
the
Am
eric
anPs
ycho
logi
cal
Ass
ocia
tion
oron
eof
itsal
lied
publ
ishe
rs.
Thi
sar
ticle
isin
tend
edso
lely
for
the
pers
onal
use
ofth
ein
divi
dual
user
and
isno
tto
bedi
ssem
inat
edbr
oadl
y.
5CLOSING THE SOCIAL CLASS ACHIEVEMENT GAP
model. The final model reported for all three outcome measuresincludes eight terms: the main effects of treatment condition,generational status, gender, and lecture section (two terms), as wellas 3 two-way interactions (one between condition and generationalstatus, and two between generational status and lecture condi-tion).3 Table 2 presents the means, standard deviations, and inter-correlations for all measures.
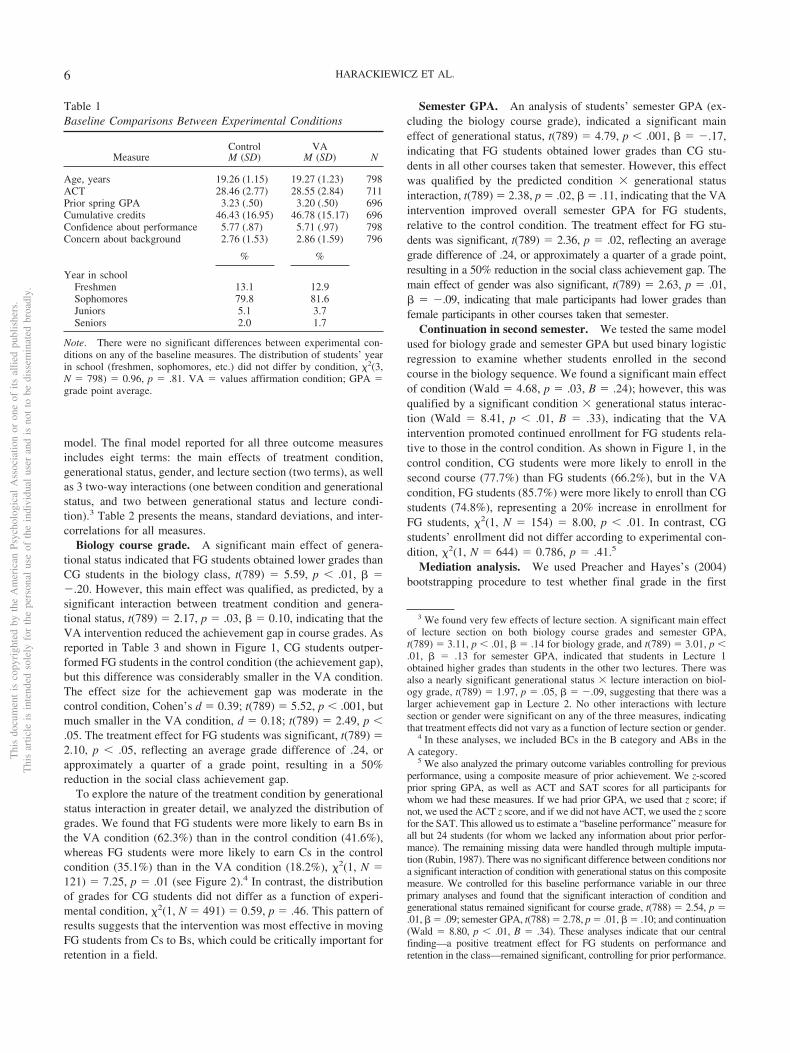
Biology course grade. A significant main effect of genera-tional status indicated that FG students obtained lower grades thanCG students in the biology class, t(789) � 5.59, p � .01, � ��.20. However, this main effect was qualified, as predicted, by asignificant interaction between treatment condition and genera-tional status, t(789) � 2.17, p � .03, � � 0.10, indicating that theVA intervention reduced the achievement gap in course grades. Asreported in Table 3 and shown in Figure 1, CG students outper-formed FG students in the control condition (the achievement gap),but this difference was considerably smaller in the VA condition.The effect size for the achievement gap was moderate in thecontrol condition, Cohen’s d � 0.39; t(789) � 5.52, p � .001, butmuch smaller in the VA condition, d � 0.18; t(789) � 2.49, p �.05. The treatment effect for FG students was significant, t(789) �2.10, p � .05, reflecting an average grade difference of .24, orapproximately a quarter of a grade point, resulting in a 50%reduction in the social class achievement gap.
To explore the nature of the treatment condition by generationalstatus interaction in greater detail, we analyzed the distribution ofgrades. We found that FG students were more likely to earn Bs inthe VA condition (62.3%) than in the control condition (41.6%),whereas FG students were more likely to earn Cs in the controlcondition (35.1%) than in the VA condition (18.2%), �2(1, N �121) � 7.25, p � .01 (see Figure 2).4 In contrast, the distributionof grades for CG students did not differ as a function of experi-mental condition, �2(1, N � 491) � 0.59, p � .46. This pattern ofresults suggests that the intervention was most effective in movingFG students from Cs to Bs, which could be critically important forretention in a field.
Semester GPA. An analysis of students’ semester GPA (ex-cluding the biology course grade), indicated a significant maineffect of generational status, t(789) � 4.79, p � .001, � � �.17,indicating that FG students obtained lower grades than CG stu-dents in all other courses taken that semester. However, this effectwas qualified by the predicted condition � generational statusinteraction, t(789) � 2.38, p � .02, � � .11, indicating that the VAintervention improved overall semester GPA for FG students,relative to the control condition. The treatment effect for FG stu-dents was significant, t(789) � 2.36, p � .02, reflecting an averagegrade difference of .24, or approximately a quarter of a grade point,resulting in a 50% reduction in the social class achievement gap. Themain effect of gender was also significant, t(789) � 2.63, p � .01,� � �.09, indicating that male participants had lower grades thanfemale participants in other courses taken that semester.
Continuation in second semester. We tested the same modelused for biology grade and semester GPA but used binary logisticregression to examine whether students enrolled in the secondcourse in the biology sequence. We found a significant main effectof condition (Wald � 4.68, p � .03, B � .24); however, this wasqualified by a significant condition � generational status interac-tion (Wald � 8.41, p � .01, B � .33), indicating that the VAintervention promoted continued enrollment for FG students rela-tive to those in the control condition. As shown in Figure 1, in thecontrol condition, CG students were more likely to enroll in thesecond course (77.7%) than FG students (66.2%), but in the VAcondition, FG students (85.7%) were more likely to enroll than CGstudents (74.8%), representing a 20% increase in enrollment forFG students, �2(1, N � 154) � 8.00, p � .01. In contrast, CGstudents’ enrollment did not differ according to experimental con-dition, �2(1, N � 644) � 0.786, p � .41.5
Mediation analysis. We used Preacher and Hayes’s (2004)bootstrapping procedure to test whether final grade in the first
3 We found very few effects of lecture section. A significant main effectof lecture section on both biology course grades and semester GPA,t(789) � 3.11, p � .01, � � .14 for biology grade, and t(789) � 3.01, p �.01, � � .13 for semester GPA, indicated that students in Lecture 1obtained higher grades than students in the other two lectures. There wasalso a nearly significant generational status � lecture interaction on biol-ogy grade, t(789) � 1.97, p � .05, � � �.09, suggesting that there was alarger achievement gap in Lecture 2. No other interactions with lecturesection or gender were significant on any of the three measures, indicatingthat treatment effects did not vary as a function of lecture section or gender.
4 In these analyses, we included BCs in the B category and ABs in theA category.
5 We also analyzed the primary outcome variables controlling for previousperformance, using a composite measure of prior achievement. We z-scoredprior spring GPA, as well as ACT and SAT scores for all participants forwhom we had these measures. If we had prior GPA, we used that z score; ifnot, we used the ACT z score, and if we did not have ACT, we used the z scorefor the SAT. This allowed us to estimate a “baseline performance” measure forall but 24 students (for whom we lacked any information about prior perfor-mance). The remaining missing data were handled through multiple imputa-tion (Rubin, 1987). There was no significant difference between conditions nora significant interaction of condition with generational status on this compositemeasure. We controlled for this baseline performance variable in our threeprimary analyses and found that the significant interaction of condition andgenerational status remained significant for course grade, t(788) � 2.54, p �.01, � � .09; semester GPA, t(788) � 2.78, p � .01, � � .10; and continuation(Wald � 8.80, p � .01, B � .34). These analyses indicate that our centralfinding—a positive treatment effect for FG students on performance andretention in the class—remained significant, controlling for prior performance.
Table 1Baseline Comparisons Between Experimental Conditions
MeasureControlM (SD)
VAM (SD) N
Age, years 19.26 (1.15) 19.27 (1.23) 798ACT 28.46 (2.77) 28.55 (2.84) 711Prior spring GPA 3.23 (.50) 3.20 (.50) 696Cumulative credits 46.43 (16.95) 46.78 (15.17) 696Confidence about performance 5.77 (.87) 5.71 (.97) 798Concern about background 2.76 (1.53) 2.86 (1.59) 796
% %
Year in schoolFreshmen 13.1 12.9Sophomores 79.8 81.6Juniors 5.1 3.7Seniors 2.0 1.7
Note. There were no significant differences between experimental con-ditions on any of the baseline measures. The distribution of students’ yearin school (freshmen, sophomores, etc.) did not differ by condition, �2(3,N � 798) � 0.96, p � .81. VA � values affirmation condition; GPA �grade point average.
Thi
sdo
cum
ent
isco
pyri
ghte
dby
the
Am
eric
anPs
ycho
logi
cal
Ass
ocia
tion
oron
eof
itsal
lied
publ
ishe
rs.
Thi
sar
ticle
isin
tend
edso
lely
for
the
pers
onal
use
ofth
ein
divi
dual
user
and
isno
tto
bedi
ssem
inat
edbr
oadl
y.
6 HARACKIEWICZ ET AL.

course mediated the treatment effect on enrollment in the secondcourse, and found evidence for partial mediation such that the VAintervention improved continued enrollment for FG students byincreasing their grades in the first course (see Table 4). Resultsbased on 5,000 bootstrapped samples indicate that the total effect(TE) of the condition � generational status interaction was signif-icant (TE � .32, SE � .11, p � .01), as was the direct effect (DE �.29, SE � .12, p � .01), suggesting partial mediation. Final grademediated the relationship between the interaction and enrollment,95% CI [.0024, .1353]. The fact that zero falls outside this intervalindicates significant mediation (p � .04).
Supplementary URM Analysis
Our primary analyses focused on generational status, but ofcourse many first-generation students are also from URM groups.In any study, it is important to consider whether treatment effectsare due to students’ FG or URM status. Given the small number ofURM students in our sample, we can be confident that our inter-vention was differentially effective because of the generationalstatus of students and not their URM status, but we examined thispossibility in more detail in supplementary analyses.
In particular, we examined treatment effects as a function ofboth generational and URM status, although the small number ofURM students in the sample limited statistical power to detecttreatment effects for URM students. In these supplementary anal-yses, we categorized students into one of three groups: majorityCG (n � 601), majority FG (n � 136), or URM (n � 61). In otherwords, students who were both FG and URM were categorized as
URM for these analyses, and students who were both CG and URMwere also categorized as URM. This classification system allowed usto evaluate treatment effects for URM students as well as for majorityFG students, in comparison to majority CG students, using dummycodes to test for majority FG and URM effects, with regressionanalysis, with course grade as the outcome measure.
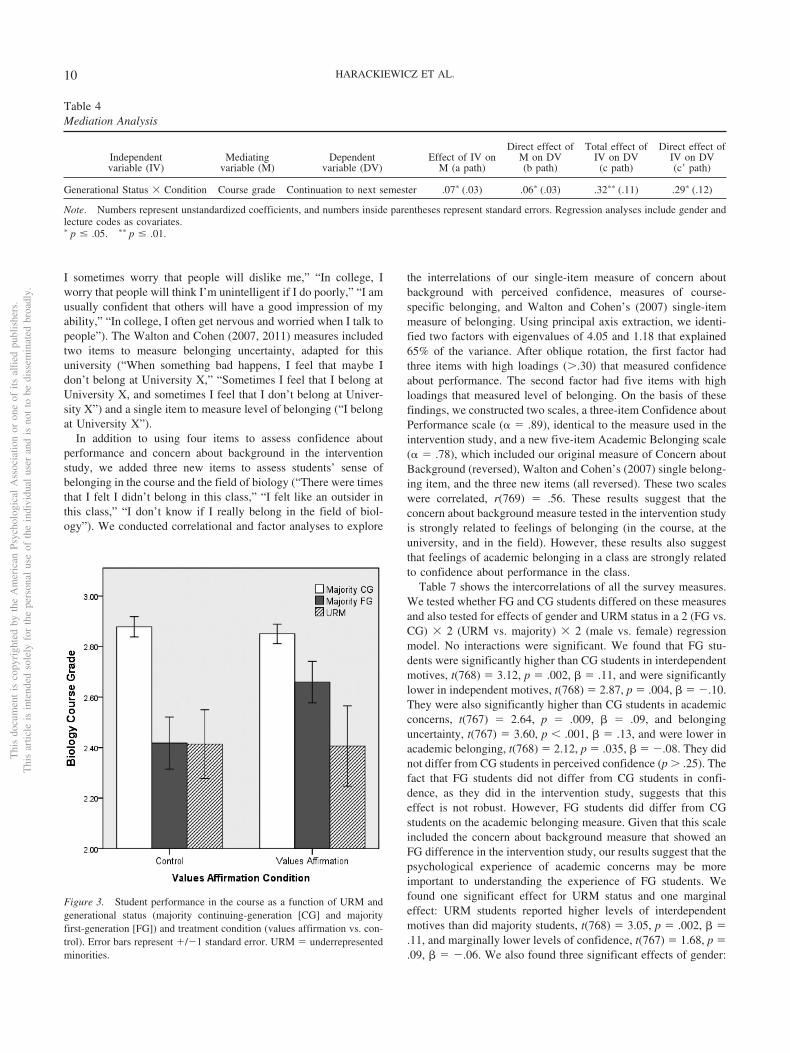
We found significant main effects for both majority FG andURM status, indicating that both groups of students performedmore poorly in the biology class than majority CG students,t(791) � 4.78, p � .001, � � �.24 for majority FG students, andt(791) � 3.37, p � .01, � � �.17 for URM students. Theintervention effect for majority FG students was significant,t(791) � 2.00, p � .05, � � .10, whereas the intervention effectwas not significant for URM students, t(791) � 0.11, p � .91, � �.01, indicating that the intervention improved performance for FGstudents but did not affect performance for URM students (see Figure3). We found a similar pattern of effects on semester GPA andcontinuation: The intervention effect was significant for majority FGstudents on each measure, t(791) � 2.10, p � .04, � � .11 forsemester GPA, and Wald � 8.01, p � .01, B � 1.37 for continuation,and the intervention effect for URM students was not significant.6
These results help to disentangle FG effects from URM effects. Theysuggest that the VA intervention was effective for FG students be-cause of their generational status and not their URM status.
Process Analyses
We examined the values that students chose in the valuesaffirmation condition, to test whether FG and CG chose differentvalues to write about. Table 5 shows the percentage of studentswho chose each value; FG and CG students did not differ signif-icantly in their choice of values to write about.
We examined whether confidence about performance or con-cern about their background changed as a function of treatment
6 We also examined course grades in a 2 � 2 � 2 model in which wetested experimental condition by generational status by URM status. Wefound that the condition by generational status interaction was significant,t(785) � 2.03, p � .04, � � .09, and that the condition by URM interactionwas not significant (p � .51). Moreover, the three-way interaction amongcondition, FG status, and URM status was not significant (p � .70). Theseresults indicate that the treatment effect reported earlier remained signifi-cant with URM status controlled and that treatment effects did not differ asa function of URM status.
Table 2Means, Standard Deviations, and Intercorrelations for All Variables
Measure M (SD) or % 1 2 3 4 5 6 7 8
1. Baseline performance —2. Course grade 2.77 (0.73) .61� —3. Semester grade 3.14 (0.65) .60� .66� —4. Continuation 76.2% .19� .28� .20� —5. Confidence (base) 5.74 (0.92) .18� .22� .17� .12� —6. Confidence (final) 5.05 (1.29) .28� .54� .29� .19� .43� —7. Concern about background (base) 2.81 (1.56) �.06 �.13� �.04 �.07 �.39� �.30� —8. Concern about background (final) 2.71 (1.62) �.08 �.29� �.09 �.12� �.26� �.46� .45� —
Note. Baseline performance is a z-scored composite measure (see Footnote 5). Continuation is a measure reflecting the percentage of students whocontinued into the second semester of the course.� p � .01.
Table 3Means and Standard Deviations for Outcome Variables as aFunction of Generational Status and Treatment Condition
Variable
Continuing-generation First-generation
Control VA Control VA
Course grade 2.86 (0.69) 2.82 (0.69) 2.38 (0.85) 2.62 (0.78)Semester GPA 3.20 (0.63) 3.17 (0.62) 2.81 (0.81) 3.05 (0.64)Continuation 77.7% 74.8% 66.2% 85.7%N 319 325 77 77
Note. The continuation measure reflects the percentage of students whoenrolled in the second semester of the biology class the next semester.VA � values affirmation condition; GPA � grade point average.
Thi
sdo
cum
ent
isco
pyri
ghte
dby
the
Am
eric
anPs
ycho
logi
cal
Ass
ocia
tion
oron
eof
itsal
lied
publ
ishe
rs.
Thi
sar
ticle
isin
tend
edso
lely
for
the
pers
onal
use
ofth
ein
divi
dual
user
and
isno
tto
bedi
ssem
inat
edbr
oadl
y.
7CLOSING THE SOCIAL CLASS ACHIEVEMENT GAP
condition or generational status. Although FG and CG students didnot differ on either measure at the outset of the class, they did bythe end of the semester. FG students were less confident abouttheir performance in the class, t(788) � 2.90, p � .01, � � �.09,and were more likely to believe that they did not have the rightbackground for the class, t(786) � 1.98, p � .05, � � .07,compared to CG students, across experimental conditions.
The VA intervention did not influence confidence about perfor-mance at the end of the semester for FG students, t(788) � 1.13,p � .26, � � .05, but we did find a significant condition by
generational status interaction showing that the VA interventionreduced concerns about background for FG students by the end ofthe semester, t(786) � 2.00, p � .05, � � �.08. Because baselinelevels of concern about background were controlled in this anal-ysis, this effect represents the change in concern over time. Figure4 shows concern about background scores at the beginning and endof the semester. FG students in the control condition reportedgreater concern about their background (M � 3.08, SD � 1.92)than CG students (M � 2.57, SD � 1.53) at the end of thesemester. This gap was completely closed in the interventioncondition (M � 2.74, SD � 1.74 for FG students; M � 2.74, SD �1.59 for CG students).7 For FG students, this increase in concernmay occur as they gain a more realistic understanding of thedifficulty level of university-level biology and receive feedbackabout their performance, but the VA intervention seemed to offsetthese mounting concerns.
We also found a significant effect of gender showing thatwomen reported lower levels of confidence than men, both at theoutset and the end of the semester, F(1, 796) � 44.52 and 38.31,respectively, p � .01 (although there were no gender differences incourse grades), but we did not find an effect of gender on concernabout background at either time point.8 For confidence, for menM � 6.00 (SD � 0.81) at baseline and M � 5.32 (SD � 1.19) atoutcome; for women, M � 5.57 (SD � 0.95) at baseline and M �4.87 (SD � 1.33) at outcome. For the gender difference, d � 0.49and 0.36 at baseline and end of semester, respectively, reflecting amoderate effect size for the gender difference. This gender differ-ence for confidence contrasts with the absence of a gender differ-ence in course grade and a significant gender difference favoringwomen for overall semester grades. For measures such as confi-dence about performance, debate centers on interpretation of thegender difference. Do female students lack confidence, or are malestudents unrealistically overconfident? Either direction could carrycosts. A lack of confidence might lead to a student not taking onchallenging academic tasks. What is less recognized is that unre-alistic overconfidence may lead to negative behaviors, such as notstudying adequately for an exam. Research indicates that femalestudents tend to underestimate themselves by about as much asmale students overestimate themselves (Cole, Martin, Peeke, Se-roczynski, & Fier, 1999).
Survey Study: Characterizing the Experience ofFirst-Generation Students in Biology
In addition to experiencing concern about their background forthe course, FG students may worry about “fitting in” more gener-ally, and they may also experience discrepancies between theirmotives for attending college and university norms (Stephens,
7 We tested whether concern about background mediated the treatmenteffect on final grades and enrollment in the second course. Although it wasa significant predictor of final grade, t(788) � 7.98, p � .001, � � �.27,and enrollment (Wald � 9.81, p � .01, B � �.16), it was not a significantmediator of either treatment effect, 95% CI [�.0027, .0366].
8 We also examined whether URM students differed from majoritystudents in terms of confidence about performance or concern aboutbackground, at baseline or by the end of the class, but found no significantdifferences (p � .20 for all four tests). As noted earlier, the small numberof URM students in this sample limited the power to detect effects.
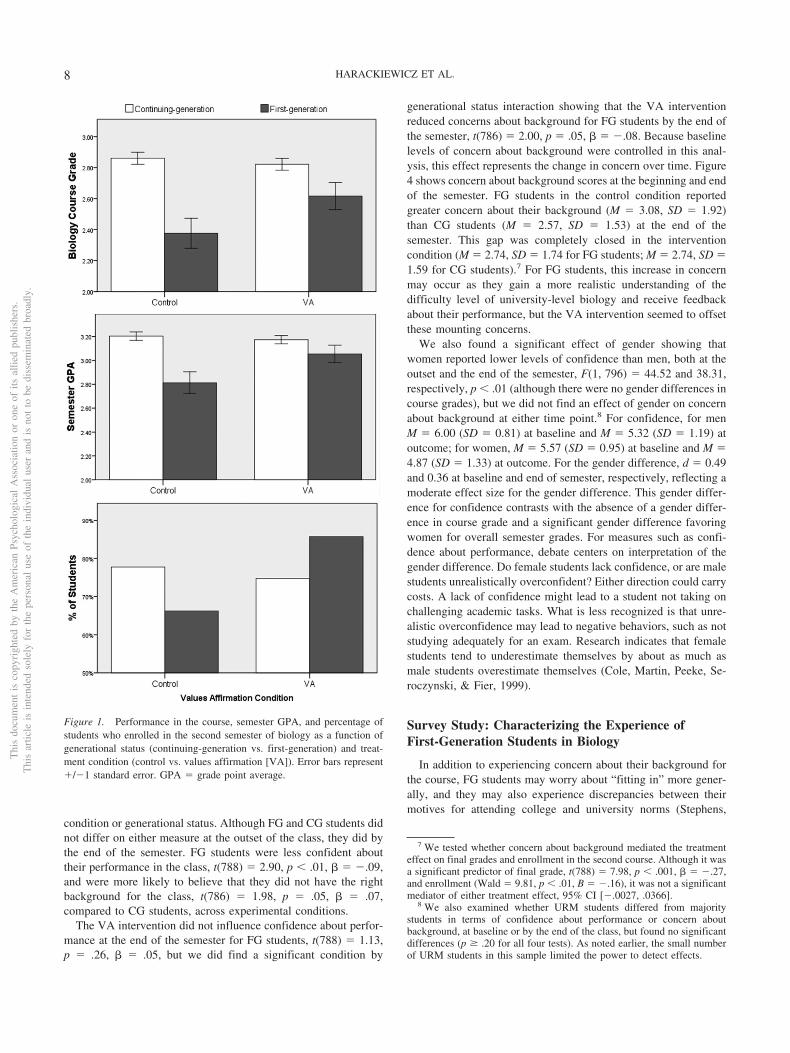
Figure 1. Performance in the course, semester GPA, and percentage ofstudents who enrolled in the second semester of biology as a function ofgenerational status (continuing-generation vs. first-generation) and treat-ment condition (control vs. values affirmation [VA]). Error bars represent�/�1 standard error. GPA � grade point average.
Thi
sdo
cum
ent
isco
pyri
ghte
dby
the
Am
eric
anPs
ycho
logi
cal
Ass
ocia
tion
oron
eof
itsal
lied
publ
ishe
rs.
Thi
sar
ticle
isin
tend
edso
lely
for
the
pers
onal
use
ofth
ein
divi
dual
user
and
isno
tto
bedi
ssem
inat
edbr
oadl
y.
8 HARACKIEWICZ ET AL.

Fryberg, et al., 2012). In a separate survey study, conducted in asection of the same biology course in a different semester, weadministered a series of questionnaires to 772 students at the endof the semester (318 male, 454 female; 613 CG, 159 FG; 53 URM,719 majority). We administered Stephens, Fryberg, et al.’s (2012)measure of motives for attending college, Sherman et al.’s (2009)measure of academic and social concerns, Walton and Cohen’s(2007) measures of belonging uncertainty and level of belonging,as well as the same measures of confidence about performance andconcern about background reported earlier, to explore differencesbetween FG and CG students in greater detail.
We administered a shorter version of Stephens, Fryberg, et al.’s(2012) scale assessing students’ motives for attending college, in
which students were asked to indicate which of 10 items charac-terized their reasons for completing their college degree (checkingas many as were relevant). Half the items referred to independentmotives that reflect typical American university values (e.g., be-coming an independent thinker, exploring new interests), whereasthe other half referred to interdependent motives commonly asso-ciated with working-class values (e.g., giving back to my commu-nity, helping the family). We constructed measures of independentand interdependent motives, r(770) � .31, p � .001 (see Table 6for percentage of interdependent and independent items endorsedby FG and CG students).
The Sherman et al. (2009) measure consisted of four itemsreferring to academic and social concerns at college (“In college,
Figure 2. Percentage of students receiving each letter grade (A, B, C, D, and F) as a function of generationalstatus (continuing-generation vs. first-generation) and treatment condition (values affirmation vs. control).
Thi
sdo
cum
ent
isco
pyri
ghte
dby
the
Am
eric
anPs
ycho
logi
cal
Ass
ocia
tion
oron
eof
itsal
lied
publ
ishe
rs.
Thi
sar
ticle
isin
tend
edso
lely
for
the
pers
onal
use
ofth
ein
divi
dual
user
and
isno
tto
bedi
ssem
inat
edbr
oadl
y.
9CLOSING THE SOCIAL CLASS ACHIEVEMENT GAP
I sometimes worry that people will dislike me,” “In college, Iworry that people will think I’m unintelligent if I do poorly,” “I amusually confident that others will have a good impression of myability,” “In college, I often get nervous and worried when I talk topeople”). The Walton and Cohen (2007, 2011) measures includedtwo items to measure belonging uncertainty, adapted for thisuniversity (“When something bad happens, I feel that maybe Idon’t belong at University X,” “Sometimes I feel that I belong atUniversity X, and sometimes I feel that I don’t belong at Univer-sity X”) and a single item to measure level of belonging (“I belongat University X”).
In addition to using four items to assess confidence aboutperformance and concern about background in the interventionstudy, we added three new items to assess students’ sense ofbelonging in the course and the field of biology (“There were timesthat I felt I didn’t belong in this class,” “I felt like an outsider inthis class,” “I don’t know if I really belong in the field of biol-ogy”). We conducted correlational and factor analyses to explore
the interrelations of our single-item measure of concern aboutbackground with perceived confidence, measures of course-specific belonging, and Walton and Cohen’s (2007) single-itemmeasure of belonging. Using principal axis extraction, we identi-fied two factors with eigenvalues of 4.05 and 1.18 that explained65% of the variance. After oblique rotation, the first factor hadthree items with high loadings (.30) that measured confidenceabout performance. The second factor had five items with highloadings that measured level of belonging. On the basis of thesefindings, we constructed two scales, a three-item Confidence aboutPerformance scale (� � .89), identical to the measure used in theintervention study, and a new five-item Academic Belonging scale(� � .78), which included our original measure of Concern aboutBackground (reversed), Walton and Cohen’s (2007) single belong-ing item, and the three new items (all reversed). These two scaleswere correlated, r(769) � .56. These results suggest that theconcern about background measure tested in the intervention studyis strongly related to feelings of belonging (in the course, at theuniversity, and in the field). However, these results also suggestthat feelings of academic belonging in a class are strongly relatedto confidence about performance in the class.
Table 7 shows the intercorrelations of all the survey measures.We tested whether FG and CG students differed on these measuresand also tested for effects of gender and URM status in a 2 (FG vs.CG) � 2 (URM vs. majority) � 2 (male vs. female) regressionmodel. No interactions were significant. We found that FG stu-dents were significantly higher than CG students in interdependentmotives, t(768) � 3.12, p � .002, � � .11, and were significantlylower in independent motives, t(768) � 2.87, p � .004, � � �.10.They were also significantly higher than CG students in academicconcerns, t(767) � 2.64, p � .009, � � .09, and belonginguncertainty, t(767) � 3.60, p � .001, � � .13, and were lower inacademic belonging, t(768) � 2.12, p � .035, � � �.08. They didnot differ from CG students in perceived confidence (p .25). Thefact that FG students did not differ from CG students in confi-dence, as they did in the intervention study, suggests that thiseffect is not robust. However, FG students did differ from CGstudents on the academic belonging measure. Given that this scaleincluded the concern about background measure that showed anFG difference in the intervention study, our results suggest that thepsychological experience of academic concerns may be moreimportant to understanding the experience of FG students. Wefound one significant effect for URM status and one marginaleffect: URM students reported higher levels of interdependentmotives than did majority students, t(768) � 3.05, p � .002, � �.11, and marginally lower levels of confidence, t(767) � 1.68, p �.09, � � �.06. We also found three significant effects of gender:
Table 4Mediation Analysis
Independentvariable (IV)
Mediatingvariable (M)
Dependentvariable (DV)
Effect of IV onM (a path)
Direct effect ofM on DV(b path)
Total effect ofIV on DV(c path)
Direct effect ofIV on DV(c= path)
Generational Status � Condition Course grade Continuation to next semester .07� (.03) .06� (.03) .32�� (.11) .29� (.12)
Note. Numbers represent unstandardized coefficients, and numbers inside parentheses represent standard errors. Regression analyses include gender andlecture codes as covariates.� p � .05. �� p � .01.
Figure 3. Student performance in the course as a function of URM andgenerational status (majority continuing-generation [CG] and majorityfirst-generation [FG]) and treatment condition (values affirmation vs. con-trol). Error bars represent �/�1 standard error. URM � underrepresentedminorities.
Thi
sdo
cum
ent
isco
pyri
ghte
dby
the
Am
eric
anPs
ycho
logi
cal
Ass
ocia
tion
oron
eof
itsal
lied
publ
ishe
rs.
Thi
sar
ticle
isin
tend
edso
lely
for
the
pers
onal
use
ofth
ein
divi
dual
user
and
isno
tto
bedi
ssem
inat
edbr
oadl
y.
10 HARACKIEWICZ ET AL.

Women reported lower levels of confidence than did men,t(767) � 2.04, p � .04, � � .07, and they reported higher levelsof belonging uncertainty, t(767) � 2.50, p � .013, � � �.09, andacademic concerns, t(767) � 3.50, p � .001, � � �.12. Table 7shows the means for CG and FG students. Considered together,these findings suggest that FG students experienced a mismatchbetween their motives and university norms, lower levels of per-ceived belonging in the course, higher levels of academic andsocial concerns, as well as higher levels of uncertainty aboutbelonging in the course. All of these factors may contribute to thesocial class achievement gap observed here and may also helpaccount for the effectiveness of the VA intervention for FG stu-dents in this biology class.
Discussion
If we wish to expand the pipeline of students entering thebiomedical sciences, it will be critically important to promoteperformance and retention for FG students in introductory coursesthat act as a gateway to successive courses and careers in biology.
Introductory biology, as taught at large public universities, can bean overwhelming and impersonal experience for students, and theVA intervention played a critical role in helping FG students meetthe challenges of this environment. This study is the first, to ourknowledge, to address the achievement gap for any group ofunderrepresented students planning on entering the biomedicalsciences. Nationwide, FG students represent a large pool of po-tential scientists. To provide the most equitable opportunities forthese individuals, and to maximize discovery of talent for thenation, it is crucial that FG students have a positive experience intheir first biology course. For example, a student who receives a Cgets a very different message from one who receives a B; the Cmay indicate that you can’t make it in the field, whereas the Bsignals that you can. This study demonstrates that a values affir-mation intervention can narrow the social class achievement gap,improve the success rate for FG students in biology class (as wellas college classes more generally), and keep them on track forprogress in biology courses, even in the context of a large, imper-sonal course.
The fact that we observed intervention effects on grades in otherclasses taken in the same semester and on continuation into thesecond semester of the course highlights the power of the VAintervention to influence performance and course enrollment de-cisions in an ongoing manner (Cohen et al., 2012). The biologyclass studied here was a five-credit class for majors and premedicalstudents, and it was probably the most important course of thesemester for most students. A positive experience in this criticalcourse could influence FG students’ academic performance moregenerally and color their experience at the university, with far-reaching effects. Cohen et al. (2012) have argued that early per-formance outcomes can be carried forward through recursive cy-cles and start a positive chain reaction. For example, Cohen et al.(2006) found VA effects on grades in the course in which theaffirmation was completed, but follow-up analyses (Cohen et al.,2009) showed long-lasting and more general effects; specifically,on students’ grade-point-averages (across classes) and perceivedbelonging over two years, among initially low-performing AfricanAmerican students (Cook et al., 2012; Sherman et al., 2013). Ourresults contribute to the growing body of work documenting thefar-reaching effects of VA interventions.
Table 5Values Selected by Students in the Values Affirmation Condition
Values selected First-generation (%) Continuing-generation (%)
Relationships with friends or family 88.20 84.00Learning and gaining knowledge 63.20 57.20Sense of humor 32.90 31.10Career 31.60 29.20Independence 25.00 22.60Spiritual or religious values 17.10 17.60Creativity 17.10 11.90Athleticism 3.90 8.20Music 3.90 11.00Belonging to a social group 3.90 6.60Government or politics 1.30 0.60Being good at art 0.00 0.60
Note. Numbers indicate the percentage of students who selected each value to write about. Students couldselect two or three values.
2.3
2.4
2.5
2.6
2.7
2.8
2.9
3
3.1
3.2
3.3
CG FG CG FG
Control VA
Con
cern
Abo
ut B
ackg
roun
d Baseline Final
Figure 4. Changes in concern about background over the semester.Baseline scores were collected in the second week of the semester, andfinal scores were collected in the 14th week. High scores represent higherlevels of concern about background. CG � continuing-generation; FG �first-generation; VA � values affirmation.
Thi
sdo
cum
ent
isco
pyri
ghte
dby
the
Am
eric
anPs
ycho
logi
cal
Ass
ocia
tion
oron
eof
itsal
lied
publ
ishe
rs.
Thi
sar
ticle
isin
tend
edso
lely
for
the
pers
onal
use
ofth
ein
divi
dual
user
and
isno
tto
bedi
ssem
inat
edbr
oadl
y.
11CLOSING THE SOCIAL CLASS ACHIEVEMENT GAP

There are many disadvantaged, stereotyped, and underrepre-sented students who struggle in college, and it is important torecognize that they struggle for different reasons. FG students facea unique set of financial and cultural challenges that place them atrisk in college, particularly in introductory science courses, wherethey may not have the same background and preparation as CGstudents (Bowen et al., 2005; Terenzini et al., 1996). These stu-dents have different motives for attending college (Stephens, Fry-berg, et al., 2012), and they expressed concerns about their prep-aration for introductory biology in our study.
We found that, relative to CG students, FG students endorsedmore interdependent reasons for attending college and fewer in-dependent reasons, replicating Stephens, Fryberg, et al. (2012). FGstudents also expressed lower levels of academic belonging andhigher levels of uncertainty about belonging (Walton & Cohen,2007), as well as higher levels of academic concerns (Sherman etal., 2009), relative to CG students. Considered together, thesefindings suggest that FG students were at a considerable disadvan-tage in this course. Whether their discomfort reflects the same typeof stress experienced by other stereotyped students or, as suggestedby our survey results, a unique type of discomfort attributable tocultural mismatch (or a combination of stressors), our resultsdemonstrate that a VA intervention can help FG students in thesame way that it has been shown to help African American andHispanic students in middle school and women in physics (Cohen
et al., 2006; Miyake et al., 2010; Sherman et al., 2013). Thisresearch represents a novel application of the VA method anddemonstrates that it is applicable to groups that have not previ-ously been considered.
The relatively low representation of URM students among FGstudents in this sample was actually advantageous insofar as itallowed us to disentangle whether it was FG or URM status thataccounted for the effectiveness of the intervention. Indeed, just aswe attempted to disentangle generational status from ethnic mi-nority status in this study, researchers working on closing URMachievement gaps may wish to disentangle these effects fromgenerational status. For example, Sherman et al. (2013) noted thatalmost all of their Latino participants were also low SES studentsand that the race gap in their study was largely redundant with asocial class gap, suggesting that their results may have been due tosocial class as much as to Latino status. Given the increasingoverlap of racial and SES groupings in American society (Rear-don, 2011), it seems that our understanding of racial achievementgaps may be informed by consideration of social class and culturalmismatch and that continued efforts to integrate stereotype threatand cultural mismatch theory are warranted. At the same time, itwill be important to identify the specific mechanisms underlyingthe underperformance of different groups (whether identity threat,broadly construed, social rejection threat, stereotype threat, orcultural mismatch) so that future interventions can be tailored to
Table 6Percentage of Interdependent and Independent Items Endorsed by First-Generation andContinuing-Generation Students
Survey items First-generation Continuing-generation
Interdependent itemsHelp my family out after I’m done with collegea 61.0% 46.3%Be a role model for people in my community 57.2% 53.5%Show that people with my background can do wella 44.0% 26.4%Give back to my community 64.8% 66.2%Provide a better life for my own children 80.5% 73.2%Scale meanb 3.08 2.66
Independent itemsExpand my knowledge of the world 72.3% 79.4%Become an independent thinker 66.0% 69.5%Explore new interestsa 62.9% 74.9%Learn more about my interestsa 60.4% 69.5%Expand my understanding of the world 66.0% 73.4%Scale meanb 3.28 3.67
a p � .05, based on chi-square tests, �2(1, N � 772), comparing first-generation and continuing-generationstudents. b Scale means differ significantly (p � .01).
Table 7Means and Intercorrelations of Measures in Survey Study
MeasureContinuing-generation
M (SD)First-generation
M (SD) 1 2 3 4 5 6
1. Independent motives 3.67 (1.49) 3.28 (1.66) —2. Interdependent motives 2.66 (1.54) 3.08 (1.46) .31� —3. Academic belonging 5.78 (0.97) 5.60 (1.07) .13� .03 —4. Belonging uncertainty 3.12 (1.69) 3.69 (1.83) �.08 .04 �.45� —5. Academic and social concerns 3.35 (1.15) 3.65 (1.27) �.09 �.05 �.36� .58� —6. Confidence about performance 5.37 (1.20) 5.28 (1.24) .14� .07 .56� �.33� �.28� —
� p � .01.
Thi
sdo
cum
ent
isco
pyri
ghte
dby
the
Am
eric
anPs
ycho
logi
cal
Ass
ocia
tion
oron
eof
itsal
lied
publ
ishe
rs.
Thi
sar
ticle
isin
tend
edso
lely
for
the
pers
onal
use
ofth
ein
divi
dual
user
and
isno
tto
bedi
ssem
inat
edbr
oadl
y.
12 HARACKIEWICZ ET AL.

the specific type of identity threats students face in particularcontexts (Shnabel, Purdie-Vaughns, Cook, Garcia, & Cohen,2013).
Indeed, a limitation of our study is that we were unable todistinguish between stereotype threat and cultural mismatch mech-anisms or, more critically, measure variables that might havemediated the effects of the VA intervention for FG students. Thetwo theoretical models characterize the source of identity threatdifferently (concerns about stereotypes about one’s group vs. amismatch of personal and institutional norms), but they character-ize the experience of identity threat similarly (uncertainty aboutbelonging, stress, and discomfort). As discussed, our survey studyprovides some support for a cultural mismatch interpretation of FGstudents’ experience in this class, but the concerns about belongingare also consistent with the stereotype threat model (Good et al.,2012). It will be important to measure perceived threats andstereotypes about FG students in future research to further eluci-date the nature of the FG experience.
With respect to mechanism, one interesting point of possibletheoretical conflict is whether reflecting on important values hasthe potential to induce even more cultural mismatch (Stephens,Markus, & Fryberg, 2012). In other words, if students affirmimportant interdependent values, might they become even moreaware of the mismatch between their own motives for attendingcollege and institutional norms? Or, does the opportunity to reflecton these core values help them cope with academic difficulties andtheir uncertainty about belonging? Our results suggest that allstudents were most likely to choose an interdependent value towrite about (“relationships with friends or family”) but that FGstudents were no more likely to select this value (or any other) thanwere CG students. However, the process of reflecting on thosevalues proved to be especially powerful for FG students in thisstudy, and it will be important to examine this process in futureresearch. It is not clear what the best strategy would be foraddressing cultural mismatch: changing the academic context orperception of situational norms, as suggested by Stephens, Fry-berg, et al. (2012); changing personal motives to match the con-text, which may be difficult to accomplish; or reaffirming corevalues to help students cope with challenging situations. Whatproduces identity threat for FG students and why VA interventionsameliorate those threats are two separate questions that each de-mand further research.
This study is also the first to test the VA intervention on a largescale in college courses, across three sections of an introductorybiology course, multiple instructors, and numerous laboratory sec-tions. We worked closely with course faculty and instructionalstaff to ensure that the writing exercises were administered in away that made the assignment part of the class, while keeping theexercise nonevaluative and the content of the essays confidential.We tried to implement the intervention in the most effective waypossible, but to meet the course-connectedness and confidentialityconditions established by Cohen et al. (2012), we had independentresearchers collect the essays so that instructors did not see theessay itself. This strategy for implementation is cumbersome andcostly. Some streamlining will be needed if it is to be usedroutinely in large science courses, and future research might ex-plore which of these conditions are essential and which might berelaxed without losing treatment efficacy. Although these condi-tions were challenging to establish, our results suggest that this
intervention can be effectively administered on this scale withoutreducing the potency of the intervention. These findings contributeto a growing base of research documenting the power of briefsocial-psychological interventions (Blackwell, Trzesniewski, &Dweck, 2007; Harackiewicz, Rozek, Hulleman, & Hyde, 2012;Hulleman & Harackiewicz, 2009; Walton & Cohen, 2011), andthey begin to address the challenge of scaling up interventions forimplementation on a wider scale. These interventions are relativelysimple, making them feasible to implement by nonpsychologyfaculty with some training and attention to implementation details.Although these interventions may seem like “magic bullets” be-cause they are so simple (Yeager & Walton, 2011), they arepowerful because they focus on changing the mind-set of thestudents (Wilson, 2011). As such, they can complement othereducational interventions that focus on changing the learning en-vironment (Brewer & Smith, 2011; Ruiz-Primo, Briggs, Iverson,Talbot, & Shepard, 2011). Progress in education will be maxi-mized by considering both types of curriculum reform.
References
Aronson, J., & Dee, T. (2012). Stereotype threat in the real world. In M.Inzlicht, & T. Schmader (Eds.), Stereotype threat: Theory, process, andapplication (pp. 264–279). New York, NY: Oxford University Press.doi:10.1093/acprof:oso/9780199732449.003.0017
Aronson, J., & Inzlicht, M. (2004). The ups and downs of attributionalambiguity: Stereotype vulnerability and the academic self-knowledge ofAfrican American college students. Psychological Science, 15, 829–836. doi:10.1111/j.0956-7976.2004.00763.x
Aronson, J., Lustina, M. J., Good, C., Keough, K., Steele, C. M., & Brown,J. (1999). When white men can’t do math: Necessary and sufficientfactors in stereotype threat. Journal of Experimental Social Psychology,35, 29–46. doi:10.1006/jesp.1998.1371
Blackwell, L. S., Trzesniewski, K. H., & Dweck, C. S. (2007). Implicittheories of intelligence predict achievement across an adolescent tran-sition: A longitudinal study and an intervention. Child Development, 78,246–263. doi:10.1111/j.1467-8624.2007.00995.x
Bowen, W. G., Kurzweil, M. A., & Tobin, E. M. (2005). Equity andexcellence in American higher education. Charlottesville: University ofVirginia Press.
Brewer, C. A., & Smith, D. (2011). Vision and change in undergraduatebiology education: A call to action. Retrieved from http://visionandchange.org/files/2011/03/Revised-Vision-and-Change-Final-Report.pdf
Bybee, R. W., & Fuchs, B. (2006). Preparing the 21st century workforce:A new reform in science and technology education. Journal of Researchin Science Teaching, 43, 349–352. doi:10.1002/tea.20147
Cohen, G. L., Garcia, J., Apfel, N., & Master, A. (2006, September 1).Reducing the racial achievement gap: A social-psychological interven-tion. Science, 313, 1307–1310. doi:10.1126/science.1128317
Cohen, G. L., Garcia, J., Purdie-Vaughns, V., Apfel, N., & Brzustoski, P.(2009, April 17). Recursive processes in self-affirmation: Intervening toclose the minority achievement gap. Science, 324, 400 – 403. doi:10.1126/science.1170769
Cohen, G. L., Purdie-Vaughns, V., & Garcia, J. (2012). An identity threatperspective on intervention. In M. Inzlicht, & T. Schmader (Eds.),Stereotype threat: Theory, process, and application (pp. 280–296). NewYork, NY: Oxford University Press. doi:10.1093/acprof:oso/9780199732449.003.0018
Cole, D. A., Martin, J., Peeke, L., Seroczynski, A., & Fier, J. (1999).Children’s over- and underestimation of academic competence: A lon-gitudinal study of gender differences, depression, and anxiety. ChildDevelopment, 70, 459–473. doi:10.1111/1467-8624.00033
Thi
sdo
cum
ent
isco
pyri
ghte
dby
the
Am
eric
anPs
ycho
logi
cal
Ass
ocia
tion
oron
eof
itsal
lied
publ
ishe
rs.
Thi
sar
ticle
isin
tend
edso
lely
for
the
pers
onal
use
ofth
ein
divi
dual
user
and
isno
tto
bedi
ssem
inat
edbr
oadl
y.
13CLOSING THE SOCIAL CLASS ACHIEVEMENT GAP

Cook, J. E., Purdie-Vaughns, V., Garcia, J., & Cohen, G. L. (2012).Chronic threat and contingent belonging: Protective benefits of valuesaffirmation on identity development. Journal of Personality and SocialPsychology, 102, 479–496. doi:10.1037/a0026312
Creswell, J. D., Welch, W. T., Taylor, S. E., Sherman, D. K., Gruenewald,T. L., & Mann, T. (2005). Affirmation of personal values buffersneuroendocrine and psychological stress responses. Psychological Sci-ence, 16, 846–851. doi:10.1111/j.1467-9280.2005.01624.x
Croizet, J.-C., & Claire, T. (1998). Extending the concept of stereotype andthreat to social class: The intellectual underperformance of students fromlow socioeconomic backgrounds. Personality and Social PsychologyBulletin, 24, 588–594. doi:10.1177/0146167298246003
Croizet, J.-C., & Dutrévis, M. (2004). Socioeconomic status and intelli-gence: Why test scores do not equal merit. Journal of Poverty, 8,91–107. doi:10.1300/J134v08n03_05
Croizet, J.-C., & Millet, M. (2012). Social class and test performance:From stereotype threat to symbolic violence and vice versa. In M.Inzlicht, & T. Schmader (Eds.), Stereotype threat: Theory, process, andapplication (pp. 188–201). New York, NY: Oxford University Press.doi:10.1093/acprof:oso/9780199732449.003.0012
Fein, S., & Spencer, S. J. (1997). Prejudice as self-image maintenance:Affirming the self through derogating others. Journal of Personality andSocial Psychology, 73, 31–44. doi:10.1037/0022-3514.73.1.31
Goldrick-Rab, S., Carter, D. F., & Wagner, R. W. (2007). What highereducation has to say about the transition to college. Teachers CollegeRecord, 109, 2444–2481.
Good, C., Rattan, A., & Dweck, C. S. (2012). Why do women opt out?Sense of belonging and women’s representation in mathematics. Journalof Personality and Social Psychology, 102, 700–717. doi:10.1037/a0026659
Guryan, J., Hurst, E., & Kearney, M. (2008). Parental education andparental time with children. Journal of Economic Perspectives, 22,23–46. doi:10.1257/jep.22.3.23
Haak, D. C., HilleRisLambers, J., Pitre, E., & Freeman, S. (2011, June 3).Increased structure and active learning reduce the achievement gap inintroductory biology. Science, 332, 1213–1216. doi:10.1126/science.1204820
Harackiewicz, J. M., Rozek, C. R., Hulleman, C. S., & Hyde, J. S. (2012).Helping parents to motivate adolescents in mathematics and science: Anexperimental test of a utility-value intervention. Psychological Science,43, 899–906. doi:10.1177/0956797611435530
Harrison, L. A., Stevens, C. M., Monty, A. N., & Coakley, C. A. (2006).The consequences of stereotype threat on the academic performance ofWhite and non-White lower income college students. Social Psychologyof Education, 9, 341–357. doi:10.1007/s11218-005-5456-6
Horvat, E., Weininger, E. B., & Lareau, A. (2003). From social ties tosocial capital: Class differences in the relations between schools andparent networks. American Educational Research Journal, 40, 319–351.doi:10.3102/00028312040002319
Hulleman, C. S., & Harackiewicz, J. M. (2009, December 4). Promotinginterest and performance in high school science classes. Science, 326,1410–1412. doi:10.1126/science.1177067
Jackman, M. R., & Jackman, R. W. (1983). Class awareness in the UnitedStates. Berkeley: University of California Press.
Johnson, S. E., Richeson, J. A., & Finkel, E. J. (2011). Middle class andmarginal? Socioeconomic status, stigma, and self-regulation at an eliteuniversity. Journal of Personality and Social Psychology, 100, 838–852. doi:10.1037/a0021956
Lareau, A. (2003). Unequal childhoods: Class, race and family life. Berke-ley: University of California Press.
Martens, A., Johns, M., Greenberg, J., & Schimel, J. (2006). Combatingstereotype threat: The effect of self-affirmation on women’s intellectualperformance. Journal of Experimental Social Psychology, 42, 236–243.doi:10.1016/j.jesp.2005.04.010
McQueen, A., & Klein, W. P. (2006). Experimental manipulations ofself-affirmation: A systematic review. Self and Identity, 5, 289–354.doi:10.1080/15298860600805325
Mervis, J. (2013, April 19). Transformation is possible if a university reallycares. Science, 340, 292–296. doi:10.1126/science.340.6130.292
Miyake, A., Kost-Smith, L. E., Finkelstein, N. D., Pollock, S. J., Cohen,G. L., & Ito, T. A. (2010, November 26). Reducing the gender achieve-ment gap in college science: A classroom study of values affirmation.Science, 330, 1234–1237. doi:10.1126/science.1195996
Momsen, J. L., Long, T. M., Wyse, S. A., & Ebert-May, D. (2010). Just thefacts? Introductory undergraduate biology courses focus on low-levelcognitive skills. CBE—Life Sciences Education, 9, 435– 440. doi:10.1187/cbe.10-01-0001
Ostrove, J. M., & Long, S. M. (2007). Social class and belonging: Impli-cations for college adjustment. Review of Higher Education, 30, 363–389. doi:10.1353/rhe.2007.0028
Pascarella, E. T., & Terenzini, P. T. (1991). How college affects students:Findings and insights from twenty years of research. San Francisco, CA:Jossey-Bass.
Preacher, K. J., & Hayes, A. F. (2004). SPSS and SAS procedures forestimating indirect effects in simple mediation models. Behavior Re-search Methods, Instruments, & Computers, 36, 717–731. doi:10.3758/BF03206553
Ramey, G., & Ramey, A. (2010). The Rug Rat race. Brookings Papers onEconomic Activity (Spring), 129–176. doi:10.1353/eca.2010.0003
Reardon, S. F. (2011). The widening academic achievement gap betweenthe rich and the poor: New evidence and possible explanations. In R.Murnane, & G. Duncan (Eds.), Whither opportunity? Rising inequalityand the uncertain life chances of low-income children (pp. 91–116).New York, NY: Russell Sage Foundation Press.
Rubin, D. B. (1987). Multiple imputation for nonresponse in surveys. NewYork, NY: Wiley. doi:10.1002/9780470316696
Ruiz-Primo, M. A., Briggs, D., Iverson, H., Talbot, R., & Shepard, L. A.(2011, March 11). Impact of undergraduate science course innovationson learning. Science, 331, 1269–1270. doi:10.1126/science.1198976
Saenz, V. B., Hurtado, S., Barrera, D., Wolf, D., & Yeung, F. (2007). Firstin my family: A profile of first-generation college students at four-yearinstitutions since 1971. Retrieved from http://www.heri.ucla.edu/PDFs/pubs/TFS/Special/Monographs/FirstInMyFamily.pdf
Schulz, R. M. (2009). Reforming science education: Part I. The search fora philosophy of science education. Science & Education, 18, 225–249.doi:10.1007/s11191-008-9167-1
Sherman, D. K., Bunyan, D. P., Creswell, J. D., & Jaremka, L. M. (2009).Psychological vulnerability and stress: The effects of self-affirmation onsympathetic nervous system responses to naturalistic stressors. HealthPsychology, 28, 554–562. doi:10.1037/a0014663
Sherman, D. K., & Cohen, G. L. (2006). The psychology of self-defense:Self-affirmation theory. Advances in Experimental Social Psychology,38, 183–242.
Sherman, D. K., Hartson, K. A., Binning, K., Purdie-Vaughns, V., Garcia,J., Taborsky-Barba, S., . . . Cohen, G. (2013). Deflecting the trajectoryand changing the narrative: How self-affirmation affects academic per-formance and motivation under identity threat. Journal of Personalityand Social Psychology, 104, 591–618. doi:10.1037/a0031495
Sherman, D. K., Nelson, L. D., & Steele, C. M. (2000). Do messages abouthealth risks threaten the self? Increasing the acceptance of threateninghealth messages via self-affirmation. Personality and Social PsychologyBulletin, 26, 1046–1058. doi:10.1177/01461672002611003
Shnabel, N., Purdie-Vaughns, V., Cook, J. E., Garcia, J., & Cohen, G. L.(2013). Demystifying values-affirmation interventions: Writing aboutsocial belonging is a key to buffering against identity threat. Personalityand Social Psychology Bulletin, 39, 663– 676. doi:10.1177/0146167213480816
Thi
sdo
cum
ent
isco
pyri
ghte
dby
the
Am
eric
anPs
ycho
logi
cal
Ass
ocia
tion
oron
eof
itsal
lied
publ
ishe
rs.
Thi
sar
ticle
isin
tend
edso
lely
for
the
pers
onal
use
ofth
ein
divi
dual
user
and
isno
tto
bedi
ssem
inat
edbr
oadl
y.
14 HARACKIEWICZ ET AL.

Sirin, S. R. (2005). Socioeconomic status and academic achievement: Ameta-analytic review of research. Review of Educational Research, 75,417–453. doi:10.3102/00346543075003417
Smart Richman, L., & Leary, M. R. (2009). Reactions to discrimination,stigmatization, ostracism, and other forms of interpersonal rejection: Amultimotive model. Psychological Review, 116, 365–383. doi:10.1037/a0015250
Smeding, A., Darnon, C., Souchal, C., Toczek-Capelle, M.-C., & Butera, F.(2013). Reducing the socio-economic status achievement gap at univer-sity by promoting mastery-oriented assessment. PLoS ONE, 8(8):e71678. doi:10.1371/journal.pone.0071678
Snibbe, A. C., & Markus, H. R. (2005). You can’t always get what youwant: Educational attainment, agency, and choice. Journal of Personal-ity and Social Psychology, 88, 703–720. doi:10.1037/0022-3514.88.4.703
Spencer, B., & Castano, E. (2007). Social class is dead. Long live socialclass! Stereotype threat among low socioeconomic status individuals.Social Justice Research, 20, 418–432. doi:10.1007/s11211-007-0047-7
Steele, C. M. (1997). A threat in the air: How stereotypes shape intellectualidentity and performance. American Psychologist, 52, 613–629. doi:10.1037/0003-066X.52.6.613
Steele, C. M., & Aronson, J. (1995). Stereotype threat and the intellectualtest performance of African Americans. Journal of Personality andSocial Psychology, 69, 797–811. doi:10.1037/0022-3514.69.5.797
Steele, C. M., & Liu, T. J. (1983). Dissonance processes as self-affirmation. Journal of Personality and Social Psychology, 45, 5–19.doi:10.1037/0022-3514.45.1.5
Steele, C. M., Spencer, S. J., & Aronson, J. (2002). Contending with groupimage: The psychology of stereotype and social identity threat. Advancesin Experimental Social Psychology, 34, 379–440. doi:10.1016/S0065-2601(02)80009-0
Stephens, N. M., Fryberg, S. A., Markus, H. R., Johnson, C. S., &Covarrubias, R. (2012). Unseen disadvantage: How American universi-ties’ focus on independence undermines the academic performance offirst-generation college students. Journal of Personality and SocialPsychology, 102, 1178–1197. doi:10.1037/a0027143
Stephens, N. M., Markus, H., & Fryberg, S. A. (2012). Social classdisparities in health and education: Reducing inequality by applying a
sociocultural self model of behavior. Psychological Review, 119, 723–744. doi:10.1037/a0029028
Stephens, N. M., Townsend, S. M., Markus, H., & Phillips, L. (2012). Acultural mismatch: Independent cultural norms produce greater increasesin cortisol and more negative emotions among first-generation collegestudents. Journal of Experimental Social Psychology, 48, 1389–1393.doi:10.1016/j.jesp.2012.07.008
Terenzini, P. T., Springer, L., Yaeger, P. M., Pascarella, E. T., & Nora, A.(1996). First-generation college students: Characteristics, experiences,and cognitive development. Research in Higher Education, 37, 1–22.doi:10.1007/BF01680039
Trent, W., Orr, M. T., Ranis, S., & Holdaway, J. (2007). Transitions tocollege: Lessons from the disciplines. Teachers College Record, 109,2207–2221.
Walton, G. M., & Cohen, G. L. (2007). A question of belonging: Race,social fit, and achievement. Journal of Personality and Social Psychol-ogy, 92, 82–96. doi:10.1037/0022-3514.92.1.82
Walton, G. M., & Cohen, G. L. (2011, March 18). A brief social-belongingintervention improves academic and health outcomes of minority stu-dents. Science, 331, 1447–1451. doi:10.1126/science.1198364
Walton, G. M., & Spencer, S. J. (2009). Latent ability: Grades and testscores systematically underestimate the intellectual ability of negativelystereotyped students. Psychological Science, 20, 1132–1139. doi:10.1111/j.1467-9280.2009.02417.x
Warburton, E., Bugarin, R., & Nunez, A. (2001). Bridging the gap:Academic preparation and postsecondary success of first-generationstudents (NCES 2001–153). Retrieved from http://nces.ed.gov/pubs2001/2001153.pdf
Wilson, T. D. (2011). Redirect: The surprising new science of psycholog-ical change. New York, NY: Little, Brown. doi:10.1037/e506142012-001
Yeager, D. S., & Walton, G. M. (2011). Social-psychological interventionsin education: They’re not magic. Review of Educational Research, 81,267–301. doi:10.3102/0034654311405999
Received May 7, 2013Revision received August 23, 2013
Accepted August 29, 2013 �
Thi
sdo
cum
ent
isco
pyri
ghte
dby
the
Am
eric
anPs
ycho
logi
cal
Ass
ocia
tion
oron
eof
itsal
lied
publ
ishe
rs.
Thi
sar
ticle
isin
tend
edso
lely
for
the
pers
onal
use
ofth
ein
divi
dual
user
and
isno
tto
bedi
ssem
inat
edbr
oadl
y.
15CLOSING THE SOCIAL CLASS ACHIEVEMENT GAP