Embed Size (px)
Citation preview
Journal of Economics and Business
Medyawati, Henny, and Yunanto, Muhamad. (2020), Determinant of Stock Price Manufacturing Company: Evidence From Indonesia. In: Journal of Economics and Business, Vol.3, No.2, 524-535. ISSN 2615-3726 DOI: 10.31014/aior.1992.03.02.217 The online version of this article can be found at: https://www.asianinstituteofresearch.org/ Published by: The Asian Institute of Research The Journal of Economics and Business is an Open Access publication. It may be read, copied, and distributed free of charge according to the conditions of the Creative Commons Attribution 4.0 International license. The Asian Institute of Research Journal of Economics and Business is a peer-reviewed International Journal. The journal covers scholarly articles in the fields of Economics and Business, which includes, but not limited to, Business Economics (Micro and Macro), Finance, Management, Marketing, Business Law, Entrepreneurship, Behavioral and Health Economics, Government Taxation and Regulations, Financial Markets, International Economics, Investment, and Economic Development. As the journal is Open Access, it ensures high visibility and the increase of citations for all research articles published. The Journal of Economics and Business aims to facilitate scholarly work on recent theoretical and practical aspects of Economics and Business.
524
The Asian Institute of Research
Journal of Economics and Business Vol.3, No.2, 2020: 524-535
ISSN 2615-3726 Copyright © The Author(s). All Rights Reserved
DOI: 10.31014/aior.1992.03.02.217
Determinant of Stock Price Manufacturing Company:
Evidence From Indonesia Henny Medyawati1, Muhamad Yunanto2
1 Universitas Gunadarma. Emai: [email protected] 2 Universitas Gunadarma. Emai: [email protected] Abstract One of the objectives of financial management is to maximize the value of the company. For companies that have been listed on the stock exchange, this goal can be achieved by maximizing the value of the relevant market price. The purpose of this study is to find the right model to analyze the effect of Debt to Equity Ratio (DER), Earning per share (EPS), Price to Book Value (PBV), and Return on Equity (ROE) on the stock prices of manufacturing companies included in the sector the food and beverage sub-sector of the consumer goods industry that is listed on the Indonesia Stock Exchange. Research data include the financial data for the period 2012-2018. The estimation method used is the panel data regression. The analysis shows that the most appropriate model in this research is the Random Effect Model. Variables that affect stock prices based on the model are earnings per share and price to book value. Keywords: Stock Price, EPS, PBV, ROE, Panel Regression 1. Introduction The large number of investments in the capital market has resulted in an increasing number of investors switching from the banking sector to the capital market sector. In supporting the economy, the capital market has an important role, because the capital market can connect those who need funds with those who have excess funds. In addition, the capital market can encourage the creation of efficient fund allocations, because with the capital market, those who have excess funds (investors) can choose alternative investments that provide the most optimal return (Tandelilin, 2007). One of the basic concepts in financial management is that the goal to be achieved by financial management is to maximize the value of the company. For companies that have gone public, this goal can be achieved by maximizing the value of the relevant market price. According to Brigham and Houston (2010) stock prices determine shareholder wealth. Maximizing shareholder wealth translates to maximizing the company's share price. The stock price at a certain time will depend on the cash flow that is expected to be received in the future by the "average" investor if the investor buys the stock. By investing in shares, investors expect to obtain profits on both dividends and capital gains, because of the
Asian Institute of Research Journal of Economics and Business Vol.3, No.2, 2020
525
appreciation of the shares. Appreciation in stock prices occurs because market valuations are carried out using either micro or macro fundamental factors and also other technical factors (Faried, 2008). Fundamental factors can be seen from several ratios including Debt to Equity Ratio (DER), Earning per share (EPS), Price to Book Value (PBV), Return on Equity (ROE). Financial ratios can describe financial performance and can explain some of the strengths and weaknesses of a company's finances. Financial ratios include profitability ratios namely EPS and ROE, solvency or leverage ratios namely DER and market ratios or company values, namely PBV. Although theoretically, the company's financial performance has an effect on stock prices, empirically some previous empirical studies have shown inconsistent results. This motivated us to conduct further study. Research that discusses stock prices by using macroeconomic variables includes Narayan, Narayan and Singh (2014), which examine the determinants of stock prices for major Indian banks using panel data modeling techniques. Their work is novel because, for the first time in the literature on Indian banking, they used a panel Granger causality test that reveals the direction and sign of causality. They found evidence of panel co-integration among stock prices, economic activity, interest rates, and exchange rates for thirteen banks. Our results suggest that while economic activity and currency depreciation contribute to a rise in share prices, an increase in the interest rate reduces bank share prices. Moreover, only economic activity Granger-causes stock prices in the long run. Other studies use financial ratios, in general, to measure company performance to analyze stock prices. Puspitaningtyas (2017) analyzed the effect of the financial performance of the stock price. At the 0.05 significant level, the results showed that only market valuation variables that significantly influence stock prices. Meanwhile, the variable liquidity, profitability, and growth have no effect on stock prices. These results indicate that the share price reflects the market valuation of the company's shares. Handayani, Muharam, Mawardi and Robiyanto (2018), which analyze the influence of return on equity, debt to equity ratio, sales growth, firm size, cash ratio, and dividend payout ratio to stock price volatility companies listed on the Indonesia Stock Exchange in the period 2011-2015. The data analysis technique used is the regression model panel it is then adjusted again by using GARCH (Generalized Autoregressive Conditional Heteroscedasticity). The results of panel data regression analysis showed that the company’s stock price volatility in the research samples can be explained up to 4.84% by ROE, CR, DER, DPR, company size and sales growth while the remaining 95.16% is explained by other variables outside the research. Only sales growth has significant positive effect on stock price volatility. The purpose of this study is to find the right model to analyze the effect of Debt to Equity Ratio (DER), Earning per share (EPS), Price to Book Value (PBV), and Return on Equity (ROE) on the stock prices of manufacturing companies included in the sector the food and beverage sub-sector of the consumer goods industry that is listed on the Indonesia Stock Exchange. This study chose the food and beverage industry sector for several reasons. Based on a press release from the Ministry of Industry of Indonesia (2019), it is explained that the food and beverage industry is one of the manufacturing sectors that is a mainstay in making a major contribution to national economic growth. The performance achievements so far have been consistently positive, starting from its role in increasing productivity, investment, exports and employment. The Ministry of Industry noted, throughout 2018, the food and beverage industry could grow by 7.91 percent or exceed the national economic growth at 5.17 percent. In fact, the growth of large and medium manufacturing industry production in quarter IV-2018 increased by 3.90 percent (y-on-y) compared to quarter IV-2017, one of the reasons is the increase in beverage industry production, which reached 23.44 percent. 2. Literature Review and Similar Research Studies Earning per Share (EPS) is the first important component that must be considered in an analysis of a company's financial performance. Company EPS information shows the size of the company's net profit that is ready to be distributed to the company's shareholders. This ratio shows how much profit (return) is obtained by investors per share for the owner. Other profitability ratios are ROE, which is a measure of a company's ability to generate corporate returns or the effectiveness of the company in generating profits by utilizing shareholders' equity owned by the company. The higher the value of ROE shows the more efficient does the company uses its own capital to generate profits (Brigham, 2010)

Asian Institute of Research Journal of Economics and Business Vol.3, No.2, 2020
526
The following is a description of similar research studies on the factors that influence stock prices. Research conducted by Yanti, Nurazi and Zulkarnain (2012) in 5 companies recommended by PT. E-trading Securities shows that EPS, PBV and ROE affect stock prices. Only the DER variable has no effect on stock prices. Amanda and Wahyu (2013) conducted a fundamental analysis and systematic risk on the share prices of 6 banks listed in LQ45. The results showed that ROA and ROE had no effect on stock prices. DER and BETA have a negative effect on stock prices, while EPS and PER affect stock prices. Dewi, and Suaryana (2013) analyzed companies in the food and beverage sub-sector listed on the Indonesia Stock Exchange in 2009-2011. This study found that EPS and PBV influenced the stock price. Syamsurijal, and Agus (2014) analyzed the factors that influenced the company's stock prices in the transportation services industry sector listed on the Indonesia Stock Exchange in the 2009-2012 period. The results showed that DER, TATO, and ROE had an effect on stock prices, while CR and EPS had no effect on stock prices. Pratama and Erawati (2014) analyzed the stock prices of manufacturing companies in the 2008-2011 period. The results found that CR, DER and EPS affect stock prices. Al Masum (2014) analyzes dividend policy, retention ratio, ROE, stock dividends, cash dividends on stock prices. The results showed that ROE and EPS affect stock prices, while dividends and earnings after tax, negatively affect stock prices. In this research, retention ratio has no effect on stock prices. Noor and Scrimgeour (2014) analyzing and comparing 5 ratios from each of the sub-groups namely accounting based financial measure and market based financial measure, we find that price to earnings (P2E), Tobin Q (TQ), market to book (M2B) and cash flow return on investment (CFROI) from market based financial measures can better explain variance in stock prices. Research conducted by Tumandung, Murni and Baramuli (2017) shows that partially Current Ratio and Total Asset Turnover variables have no effect on stock prices, while ROE and DER variables affect stock prices in companies in the food and beverage industry subsector. Egam, Ilat and Pangerapan (2017) analyzed the effect of ROA, ROE, NPM and EPS on the stock prices of companies incorporated in the LQ45 on the Indonesia Stock Exchange in the 2013-2015 period. The results showed that the variable ROA and ROE has no effect on stock prices. NPM has a negative effect on stock prices, EPS has a positive effect on stock prices. Azhari, Rahayu and Zahroh (2016) analyzed the effect of ROE, DER, TATO and PER on stock prices on property and real estate companies on the IDX. The results showed that ROE and PER has an influence on stock prices, DER and TATO had no effect on stock prices. Suselo, Djazuli and Indrawati (2015) found that ROA, PBV, EPS, PER and the sensitivity of interest rate have a significant positive effect on stock prices. The research aims to investigate the influence of fundamental and macroeconomic variables on stock prices in the LQ45 during the period 2010 to 2013. The population in this research is 30 companies in the LQ45. The analysis method of the research uses linear multiple regression. ROE, the sensitivity of the exchange rate and the sensitivity of inflation have significant negative effect on stock prices. DER has no significant effect on stock prices. Puspitaningtyas (2017) analyzed the effect of the financial performance of the stock price. Financial performance is measured using the variables of liquidity, profitability, growth, and market valuation. The population of this study is a non-banking company registered in the Indonesia Stock Exchange and incorporated in LQ45 in the period 2011- 2016. Sampling was done by using the purposive technique. Furthermore, the data were analyzed using multiple linear regression methods. At the 0.05 significance level, the results showed that only market valuation variables that significantly influence stock prices. Meanwhile, the variable liquidity, profitability, and growth have no effect on stock prices. These results indicate that the stock price reflects the market valuation of the company's shares. Handayani, Muharam, Mawardi and Robiyanto (2018) analyze the influence of return on equity, debt to equity ratio, sales growth, firm size, cash ratio, and dividend payout ratio to stock price volatility companies listed on the Indonesia Stock Exchange in the period 2011-2015. The companies in this study are all from the manufacturing industries listed in Indonesia Stock Exchange (IDX) in the period 2011 to 2015. It obtained eight company samples with technique purposive sampling method. The data analysis technique used at that time is the regression model panel. It was adjusted again by using GARCH (Generalized Autoregressive Conditional Heteroscedasticity). The results showed that the volatility of the stock price doesn’t have an affect on ARCH-GARCH therein. The results showed that the company’s stock price volatility in the research samples can be explained by 4.84% by ROE, CR, DER, DPR, company size and sales growth while the remaining 95.16% explained by other variables outside the research study. Only sales growth has significant positive effect on stock
Asian Institute of Research Journal of Economics and Business Vol.3, No.2, 2020
527
price volatility. Hung, Ha and Binh (2018) analyzed the impact of accounting information on financial statements to the stock price of energy enterprises listed on Vietnam’s stock market. By using the OLS regression model and quantile regression model, the author studies the influence of factors such as return on assets (ROA), capital structure (LV), enterprise size, current ratio, and accounts receivable turnover to stock prices. Data from this study were collected from 44 energy enterprises during 2006-2016. The results show that ROA, enterprise size, current ratio, and accounts receivable turnover are positively correlated with the stock price, with an explanation level of 48.47%. Capital structure (LV) does not affect stock prices. Based on the research results, the authors propose some recommendations for investors and enterprises and suggest other research directions as well as adding new factors to the stock price. Dang, Tran, and Nguyen (2018) investigated the impact of financial information on stock prices of listed firms on Vietnam Stock Exchange. Data were collected from 273 large listed firms over the period 2006 to 2016. By using the multiple regressions, the relationship between determinants including earnings per share, book value, cash flow from operating activities, firm size and stock prices is investigated. The results show that four determinants have positive relationships with stock prices with an explanation level of 48.1%. The impact of financial information on stock prices has been getting stronger and stronger in the years of 2015 and 2016 with the explanation levels above 60%. Mondal, and Imran (2019) analyze the factors influence in determining the share price of some companies listed in Dhaka Stock Exchange. The study also analyzed, the influence of liquidity, leverage, profitability, growth, size of the firm and dividend rate on market price per common share. The study reveals some qualitative factors namely, company goodwill; market sentiments; company announcements; AGM; unexpected circumstances; analysts’ report; technical influence; print and electronic media; hype; change in government policy; international situation; political turmoil as well as some quantitative factors like, dividend; market capital; price/earnings ratio; EPS; net income; return on investment; retained earnings; merger; stock split; margin loan; demand & supply of stock; inflation; interest rates and exchange rates that affect the stock price. This study also finds that price earnings ratio; stock price rumor; demand for the share; changes in government policies; economic conditions are the most influential internal; external; economic; political; and environmental factors respectively regarding stock price. 3. Research Method This study uses secondary data, namely variable stock prices, DER, EPS, PBV and ROE in 2012-2018. The data source used in this study was obtained from the annual financial statements of companies manufacturing food and beverage industry sectors listed on the Indonesia Stock Exchange (IDX) during the 2012-2018 period. The population included 14 manufacturing companies listed in the food and beverage industry sector that are listed on the Indonesia Stock Exchange during the period 2012-2018. The research sample was taken adopting a purposive sampling method with the aim of getting a sample that was consistent with the research objectives. The criteria for the companies that are included in this study are (1) food and beverage companies listed on the Indonesia Stock Exchange during the 2012-2018 period; (2) food and beverage companies that have published complete annual reports for the 2012-2018 period; (3) food and beverage companies that have the necessary data so that they can be used in research; (4) companies issuing financial statements as of December 31, 2012-2018. Based on these criteria, a sample of 11 companies was listed on the Indonesia Stock Exchange in 2012-2018. The list of companies that have become the study sample is as shown in Table 1 below. Table 1. Company List
No Kode Saham Nama Emiten 1 AISA PT. Tiga Pilar Sejahtera Food, TBK 2 CEKA PT. Wilmar Cahaya Indonesia, Tbk 3 DLTA PT. Delta Djakarta, Tbk 4 ICBP PT. Indofood CBP Sukses Makmur, Tbk 5 INDF PT. Indofood Sukses Makmur, Tbk 6 MLBI PT. Multi Bintang Indonesia, Tbk 7 MYOR PT. Mayora Indah, Tbk 8 PSDN PT. Prashida Aneka Niaga, Tbk 9 ROTI PT Nippon Indosari Corporindo, Tbk
Asian Institute of Research Journal of Economics and Business Vol.3, No.2, 2020
528
10 SKLT PT. Sekar Laut, Tbk 11 ULTJ PT. Ultrajaya Milk Industry and Trading Company,
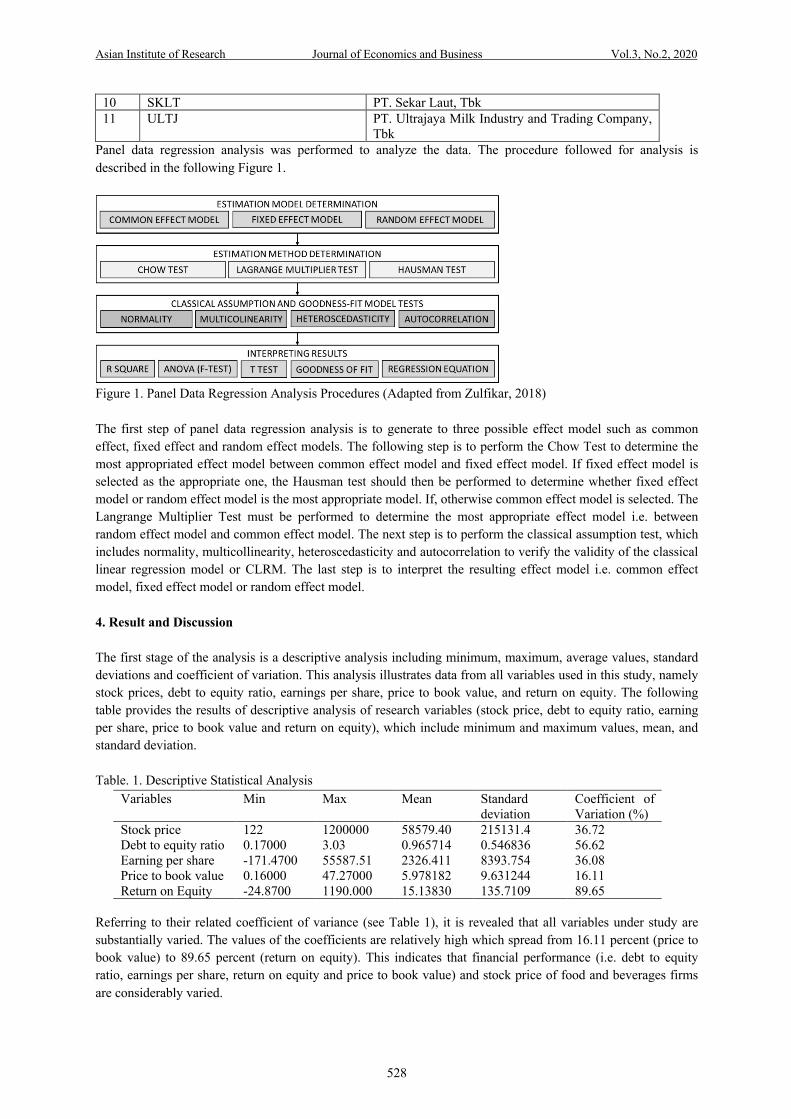
Tbk Panel data regression analysis was performed to analyze the data. The procedure followed for analysis is described in the following Figure 1.
Figure 1. Panel Data Regression Analysis Procedures (Adapted from Zulfikar, 2018) The first step of panel data regression analysis is to generate to three possible effect model such as common effect, fixed effect and random effect models. The following step is to perform the Chow Test to determine the most appropriated effect model between common effect model and fixed effect model. If fixed effect model is selected as the appropriate one, the Hausman test should then be performed to determine whether fixed effect model or random effect model is the most appropriate model. If, otherwise common effect model is selected. The Langrange Multiplier Test must be performed to determine the most appropriate effect model i.e. between random effect model and common effect model. The next step is to perform the classical assumption test, which includes normality, multicollinearity, heteroscedasticity and autocorrelation to verify the validity of the classical linear regression model or CLRM. The last step is to interpret the resulting effect model i.e. common effect model, fixed effect model or random effect model. 4. Result and Discussion The first stage of the analysis is a descriptive analysis including minimum, maximum, average values, standard deviations and coefficient of variation. This analysis illustrates data from all variables used in this study, namely stock prices, debt to equity ratio, earnings per share, price to book value, and return on equity. The following table provides the results of descriptive analysis of research variables (stock price, debt to equity ratio, earning per share, price to book value and return on equity), which include minimum and maximum values, mean, and standard deviation. Table. 1. Descriptive Statistical Analysis
Variables Min Max Mean Standard deviation
Coefficient of Variation (%)
Stock price 122 1200000 58579.40 215131.4 36.72 Debt to equity ratio 0.17000 3.03 0.965714 0.546836 56.62 Earning per share -171.4700 55587.51 2326.411 8393.754 36.08 Price to book value 0.16000 47.27000 5.978182 9.631244 16.11 Return on Equity -24.8700 1190.000 15.13830 135.7109 89.65
Referring to their related coefficient of variance (see Table 1), it is revealed that all variables under study are substantially varied. The values of the coefficients are relatively high which spread from 16.11 percent (price to book value) to 89.65 percent (return on equity). This indicates that financial performance (i.e. debt to equity ratio, earnings per share, return on equity and price to book value) and stock price of food and beverages firms are considerably varied.
Asian Institute of Research Journal of Economics and Business Vol.3, No.2, 2020
529
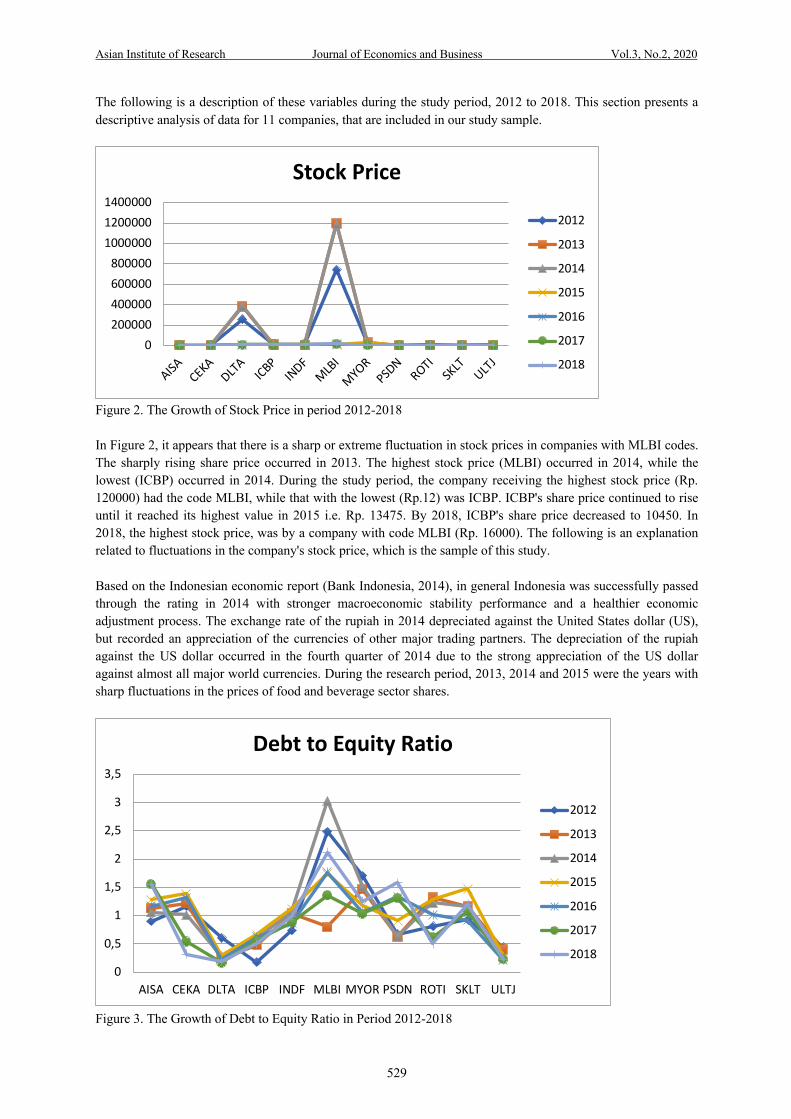
The following is a description of these variables during the study period, 2012 to 2018. This section presents a descriptive analysis of data for 11 companies, that are included in our study sample.
Figure 2. The Growth of Stock Price in period 2012-2018
In Figure 2, it appears that there is a sharp or extreme fluctuation in stock prices in companies with MLBI codes. The sharply rising share price occurred in 2013. The highest stock price (MLBI) occurred in 2014, while the lowest (ICBP) occurred in 2014. During the study period, the company receiving the highest stock price (Rp. 120000) had the code MLBI, while that with the lowest (Rp.12) was ICBP. ICBP's share price continued to rise until it reached its highest value in 2015 i.e. Rp. 13475. By 2018, ICBP's share price decreased to 10450. In 2018, the highest stock price, was by a company with code MLBI (Rp. 16000). The following is an explanation related to fluctuations in the company's stock price, which is the sample of this study. Based on the Indonesian economic report (Bank Indonesia, 2014), in general Indonesia was successfully passed through the rating in 2014 with stronger macroeconomic stability performance and a healthier economic adjustment process. The exchange rate of the rupiah in 2014 depreciated against the United States dollar (US), but recorded an appreciation of the currencies of other major trading partners. The depreciation of the rupiah against the US dollar occurred in the fourth quarter of 2014 due to the strong appreciation of the US dollar against almost all major world currencies. During the research period, 2013, 2014 and 2015 were the years with sharp fluctuations in the prices of food and beverage sector shares.
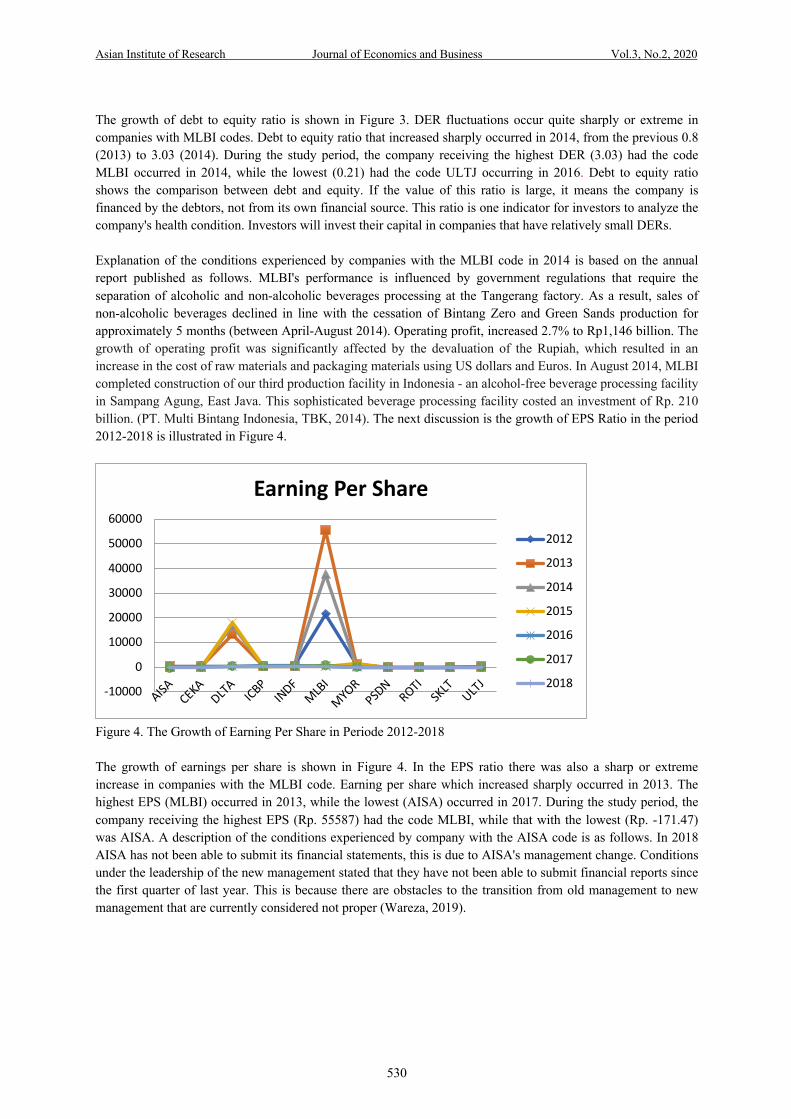
Figure 3. The Growth of Debt to Equity Ratio in Period 2012-2018
0200000400000600000800000
100000012000001400000
AISA CEKADLTA ICBP
INDFMLB
I
MYOR
PSDN
ROTISK
LTULT
J
Stock Price
2012
2013
2014
2015
2016
2017
2018
0
0,5
1
1,5
2
2,5
3
3,5
AISA CEKA DLTA ICBP INDF MLBI MYOR PSDN ROTI SKLT ULTJ
Debt to Equity Ratio
2012
2013
2014
2015
2016
2017
2018
Asian Institute of Research Journal of Economics and Business Vol.3, No.2, 2020
530
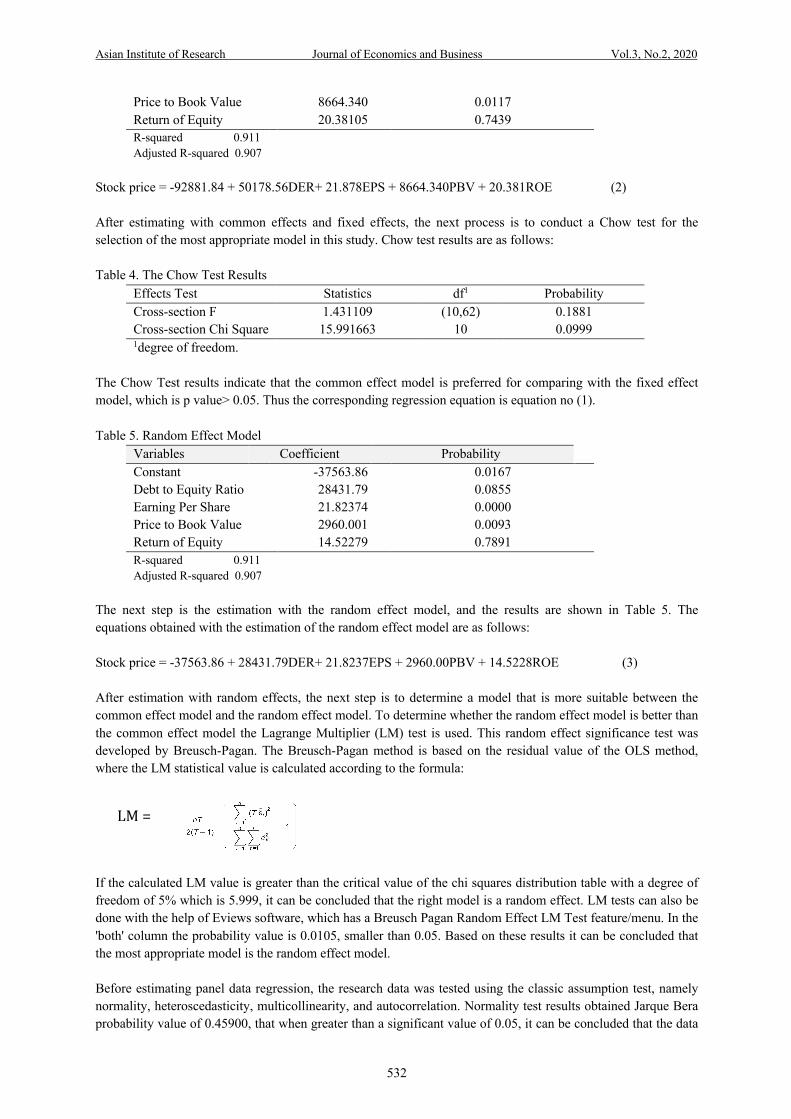
The growth of debt to equity ratio is shown in Figure 3. DER fluctuations occur quite sharply or extreme in companies with MLBI codes. Debt to equity ratio that increased sharply occurred in 2014, from the previous 0.8 (2013) to 3.03 (2014). During the study period, the company receiving the highest DER (3.03) had the code MLBI occurred in 2014, while the lowest (0.21) had the code ULTJ occurring in 2016. Debt to equity ratio shows the comparison between debt and equity. If the value of this ratio is large, it means the company is financed by the debtors, not from its own financial source. This ratio is one indicator for investors to analyze the company's health condition. Investors will invest their capital in companies that have relatively small DERs. Explanation of the conditions experienced by companies with the MLBI code in 2014 is based on the annual report published as follows. MLBI's performance is influenced by government regulations that require the separation of alcoholic and non-alcoholic beverages processing at the Tangerang factory. As a result, sales of non-alcoholic beverages declined in line with the cessation of Bintang Zero and Green Sands production for approximately 5 months (between April-August 2014). Operating profit, increased 2.7% to Rp1,146 billion. The growth of operating profit was significantly affected by the devaluation of the Rupiah, which resulted in an increase in the cost of raw materials and packaging materials using US dollars and Euros. In August 2014, MLBI completed construction of our third production facility in Indonesia - an alcohol-free beverage processing facility in Sampang Agung, East Java. This sophisticated beverage processing facility costed an investment of Rp. 210 billion. (PT. Multi Bintang Indonesia, TBK, 2014). The next discussion is the growth of EPS Ratio in the period 2012-2018 is illustrated in Figure 4.
Figure 4. The Growth of Earning Per Share in Periode 2012-2018 The growth of earnings per share is shown in Figure 4. In the EPS ratio there was also a sharp or extreme increase in companies with the MLBI code. Earning per share which increased sharply occurred in 2013. The highest EPS (MLBI) occurred in 2013, while the lowest (AISA) occurred in 2017. During the study period, the company receiving the highest EPS (Rp. 55587) had the code MLBI, while that with the lowest (Rp. -171.47) was AISA. A description of the conditions experienced by company with the AISA code is as follows. In 2018 AISA has not been able to submit its financial statements, this is due to AISA's management change. Conditions under the leadership of the new management stated that they have not been able to submit financial reports since the first quarter of last year. This is because there are obstacles to the transition from old management to new management that are currently considered not proper (Wareza, 2019).
-10000
0
10000
20000
30000
40000
50000
60000
AISA CEKADLTA ICBP
INDFMLB
I
MYOR
PSDN
ROTISK
LTULT
J
Earning Per Share
2012
2013
2014
2015
2016
2017
2018

Asian Institute of Research Journal of Economics and Business Vol.3, No.2, 2020
531
Figure 5. The growth of PBV in the period 2012-2018
The price to book value growth can be seen in Figure 5. During the study period, companies with the MLBI code, again had the highest PBV value of 47.27 in 2012. The lowest PBV, obtained by company with the PSDN code with a value of 0.52 in 2013. Price to Book Value is a measure that functions to see whether shares in a company can be expensive or cheap. Stocks that have large PBV ratios can be said to have high valuations (overvalued) while stocks that have PBV below 1 have low valuations (undervalued). Based on the 2013 Annual Report, companies with PSDN codes are companies engaged in agribusiness. The situation and condition of Indonesia's national economy throughout 2013 experienced a slowdown, namely Indonesia's economic growth was below 6%. This condition affects the company's performance, which is a decrease in sales volume, causing as a domino effect from the situation and condition of the global economy, which is plagued by uncertain climate. Under these conditions, the company is still able to make a net profit. The global economy at that time experienced a slowdown. A number of countries in the world that have been the main suppliers of agricultural and processed export commodities are also experiencing difficulties which are the company's concern. Prices of some commodities fell in 2013, for example, rubber and coffee. The International Coffee Organization (ICO) concluded that in 2013 coffee prices fell to their lowest point. Panel Data Regression Analysis Details of the resulting estimation models which include common effect, and fixed effect model are displayed in the following tables below, followed by their related regression equations: Table 2. Common Effect Model
Variables Coefficient Probability Debt to Equity Ratio -4541.775 0.6437 Earning Per Share 21.56383 0.0000 Price to Book Value 3557.406 0.0027 Return of Equity -3.089984 0.9569 R-squared 0.905 Adjusted R-squared 0.901
Stock price = -4541.775DER + 21.564 EPS +3557.406 PBV -3.089ROE (1)
Table 3. Fixed Effect Model
Variables Coefficient Probability Constant -92881.84 0.0000 Debt to Equity Ratio 50178.56 0.1193 Earning Per Share 21.87814 0.0000
0
10
20
30
40
50
AISA CEKA DLTA ICBP INDF MLBI MYOR PSDN ROTI SKLT ULTJ
Price to Book Value
2012
2013
2014
2015
2016
2017
2018
Asian Institute of Research Journal of Economics and Business Vol.3, No.2, 2020
532
Price to Book Value 8664.340 0.0117 Return of Equity 20.38105 0.7439 R-squared 0.911 Adjusted R-squared 0.907
Stock price = -92881.84 + 50178.56DER+ 21.878EPS + 8664.340PBV + 20.381ROE (2) After estimating with common effects and fixed effects, the next process is to conduct a Chow test for the selection of the most appropriate model in this study. Chow test results are as follows: Table 4. The Chow Test Results
Effects Test Statistics df1 Probability Cross-section F 1.431109 (10,62) 0.1881 Cross-section Chi Square 15.991663 10 0.0999 1degree of freedom.
The Chow Test results indicate that the common effect model is preferred for comparing with the fixed effect model, which is p value> 0.05. Thus the corresponding regression equation is equation no (1). Table 5. Random Effect Model
Variables Coefficient Probability Constant -37563.86 0.0167 Debt to Equity Ratio 28431.79 0.0855 Earning Per Share 21.82374 0.0000 Price to Book Value 2960.001 0.0093 Return of Equity 14.52279 0.7891 R-squared 0.911 Adjusted R-squared 0.907
The next step is the estimation with the random effect model, and the results are shown in Table 5. The equations obtained with the estimation of the random effect model are as follows: Stock price = -37563.86 + 28431.79DER+ 21.8237EPS + 2960.00PBV + 14.5228ROE (3) After estimation with random effects, the next step is to determine a model that is more suitable between the common effect model and the random effect model. To determine whether the random effect model is better than the common effect model the Lagrange Multiplier (LM) test is used. This random effect significance test was developed by Breusch-Pagan. The Breusch-Pagan method is based on the residual value of the OLS method, where the LM statistical value is calculated according to the formula:
If the calculated LM value is greater than the critical value of the chi squares distribution table with a degree of freedom of 5% which is 5.999, it can be concluded that the right model is a random effect. LM tests can also be done with the help of Eviews software, which has a Breusch Pagan Random Effect LM Test feature/menu. In the 'both' column the probability value is 0.0105, smaller than 0.05. Based on these results it can be concluded that the most appropriate model is the random effect model. Before estimating panel data regression, the research data was tested using the classic assumption test, namely normality, heteroscedasticity, multicollinearity, and autocorrelation. Normality test results obtained Jarque Bera probability value of 0.45900, that when greater than a significant value of 0.05, it can be concluded that the data
LM=
Asian Institute of Research Journal of Economics and Business Vol.3, No.2, 2020
533
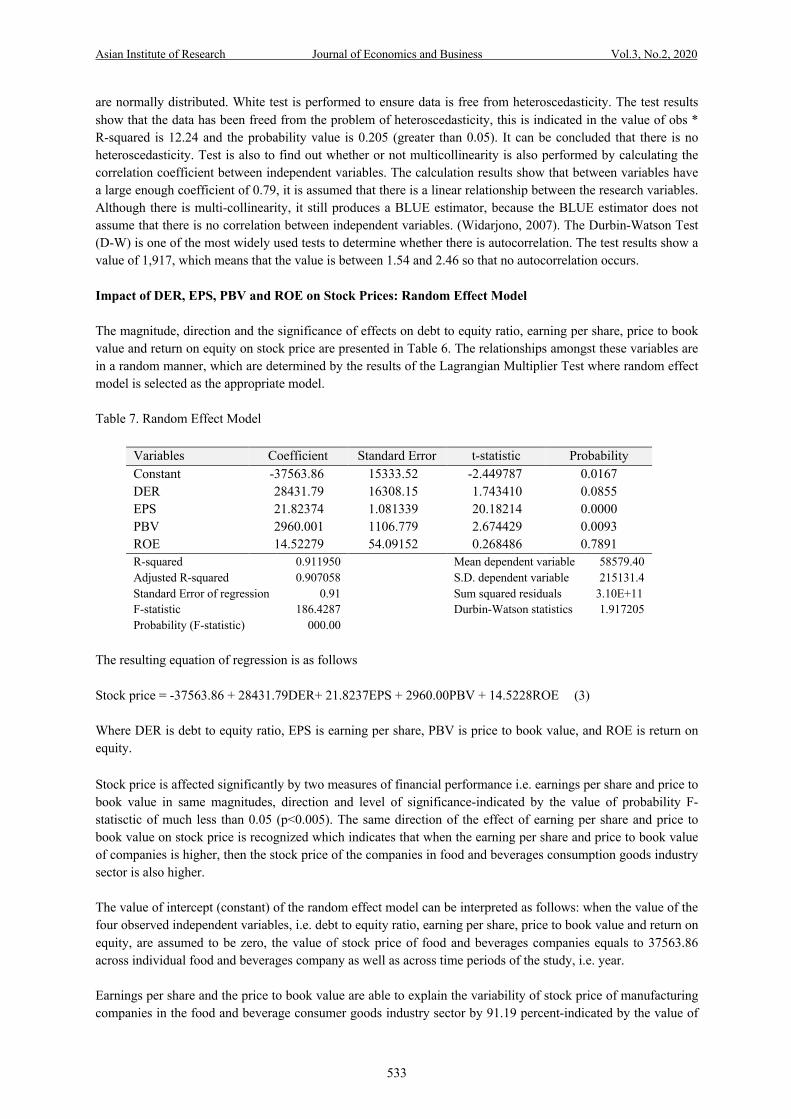
are normally distributed. White test is performed to ensure data is free from heteroscedasticity. The test results show that the data has been freed from the problem of heteroscedasticity, this is indicated in the value of obs * R-squared is 12.24 and the probability value is 0.205 (greater than 0.05). It can be concluded that there is no heteroscedasticity. Test is also to find out whether or not multicollinearity is also performed by calculating the correlation coefficient between independent variables. The calculation results show that between variables have a large enough coefficient of 0.79, it is assumed that there is a linear relationship between the research variables. Although there is multi-collinearity, it still produces a BLUE estimator, because the BLUE estimator does not assume that there is no correlation between independent variables. (Widarjono, 2007). The Durbin-Watson Test (D-W) is one of the most widely used tests to determine whether there is autocorrelation. The test results show a value of 1,917, which means that the value is between 1.54 and 2.46 so that no autocorrelation occurs. Impact of DER, EPS, PBV and ROE on Stock Prices: Random Effect Model The magnitude, direction and the significance of effects on debt to equity ratio, earning per share, price to book value and return on equity on stock price are presented in Table 6. The relationships amongst these variables are in a random manner, which are determined by the results of the Lagrangian Multiplier Test where random effect model is selected as the appropriate model. Table 7. Random Effect Model
Variables Coefficient Standard Error t-statistic Probability Constant -37563.86 15333.52 -2.449787 0.0167 DER 28431.79 16308.15 1.743410 0.0855 EPS 21.82374 1.081339 20.18214 0.0000 PBV 2960.001 1106.779 2.674429 0.0093 ROE 14.52279 54.09152 0.268486 0.7891 R-squared 0.911950 Mean dependent variable 58579.40 Adjusted R-squared 0.907058 S.D. dependent variable 215131.4 Standard Error of regression 0.91 Sum squared residuals 3.10E+11 F-statistic 186.4287 Durbin-Watson statistics 1.917205 Probability (F-statistic) 000.00
The resulting equation of regression is as follows Stock price = -37563.86 + 28431.79DER+ 21.8237EPS + 2960.00PBV + 14.5228ROE (3) Where DER is debt to equity ratio, EPS is earning per share, PBV is price to book value, and ROE is return on equity.
Stock price is affected significantly by two measures of financial performance i.e. earnings per share and price to book value in same magnitudes, direction and level of significance-indicated by the value of probability F-statisctic of much less than 0.05 (p<0.005). The same direction of the effect of earning per share and price to book value on stock price is recognized which indicates that when the earning per share and price to book value of companies is higher, then the stock price of the companies in food and beverages consumption goods industry sector is also higher. The value of intercept (constant) of the random effect model can be interpreted as follows: when the value of the four observed independent variables, i.e. debt to equity ratio, earning per share, price to book value and return on equity, are assumed to be zero, the value of stock price of food and beverages companies equals to 37563.86 across individual food and beverages company as well as across time periods of the study, i.e. year. Earnings per share and the price to book value are able to explain the variability of stock price of manufacturing companies in the food and beverage consumer goods industry sector by 91.19 percent-indicated by the value of
Asian Institute of Research Journal of Economics and Business Vol.3, No.2, 2020
534
R-squared or coefficient of determination. In other words, stock price is affected by these variables representing the company's fundamentals. Fundamental analysis is carried out in order to read the prospects of the issuer. Some ratios that are generally used for stock fundamental analysis to choose the right stock are earnings per share, price to book value, return on equity, and price earnings ratio. Dang et.al.(2018) investigated the impact of financial information on stock prices of listed firms on Vietnam Stock Exchange. The results show that earning per share have positive relationships with stock prices. The finding of the present study is in line with Dang et.al.(2018), Mondal and Imran (2019) and also Suselo et.al.(2015). In general, the stability of the earnings per share ratio can illustrate the stability of profitability. Earnings per share that increase from year to year will be a consideration for investors to choose these shares (Utari, 2016). The result of this study is showed that the price to book value affects stock price. This result in line with Dang, Tran and Nguyen (2018) who collected data from 273 listed firms and the results also support Suselo et.al.(2015) who investigated companies listed in LQ45. Stocks with low PBV compared to the average of other companies in similar industries are usually in demand by investors because the low PBV can be an indicator to look for cheap or undervalued stocks. Conversely, high PBV is likely to be triggered by market prices that are too high and this require further analysis (Utari, 2016).
5. Conclusion The results of the study recognize that the stock price of food and beverage consumption goods industry sector companies in Indonesia is significantly affected by earning per share and price to book value. The random effect model is determined as the most appropriate model in analyzing the effect of the stock price of manufacturing companies in the food and beverage consumer goods industry sector. The implications resulting from the study findings are: investors should better consider fundamental analysis (fundamental valuation) while making stock choices, namely through the company's financial performance, specifically the ratio that describes the company's earnings growth (earnings per share) and the value of the company's equity (price to book value). References Al Masum, A. (2014). Dividend policy and its impact on stock price-a study on commercial banks listed in
Dhaka Stock Exchange. Global Disclosure of Economics and Business, 3(1), 9-17. Amanda, WBBA & Pratomo, W.A. (2013). Analisis fundamental dan risiko sistematik terhadap harga saham
perbankan yang terdaftar pada indeks LQ 45. Jurnal Ekonomi dan Keuangan, 1(3), 205-219. Azhari, D.F., Rahayu, S.M., & Zahroh, Z. A. (2016). Pengaruh Kinerja Keuangan (ROE, DER, TATO dan PER)
terhadap Harga Saham pada Perusahaan Property dan Real Estate yang Go Publik di Bursa Efek Indonesia. Jurnal Adminitrasi Bisnis, 32(2), 1-5.
Brigham, Eugene R. & Houston. (2010). Dasar-dasar manajemen keuangan, edisi kesebelas. Jakarta: Salemba Empat.
Dang, N. H., Tran, M. D., & Nguyen, T. L. A. (2018). Investigation of the impact of financial information on stock prices: The case of Vietnam. Academy of Accounting and Financial Studies Journal, 22(2), 1-12.
Dedi, Rosadi. 2012. Ekonometrika & analisis runtun waktu terapan dengan Eviews. Yogyakarta: Andi Offset. Dewi, P.D.A & Suaryana, I.G.N.A. 2013. Pengaruh EPS, DER, dan PBV terhadap harga saham. E-Jurnal
Akuntansi Universitas Udayana, 4(1), 215-229. Egam, G.E.Y, Ilat V., & Pangerapan. S. (2017). Pengaruh return on asset (ROA), return on equity (ROE), net
profit margin (NPM) dan earning per share (EPS) terhadap harga saham perusahaan yang tergabung dalam indeks LQ45 di Bursa Efek Indonesia periode tahun 2013-2015. Jurnal EMBA, 5(1), 105-114.
Faried, A.R. (2008). Analisis pengaruh faktor fundamental dan nilai kapitalisasi pasar terhadap return saham perusahaan manufaktur di BEI periode 2002 s.d. 2006 (Master’s Thesis). Program Studi Magister Manajemen, Program Pasca Sarjana Universitas Diponegoro.
Handayani, H., Muharam, H., Mawardi, W., & Robiyanto. (2018). The determinants of the stock price volatility in Indonesian manufacturing sector. International Research Journal of Business Studies, 11(3), 179-193.

Asian Institute of Research Journal of Economics and Business Vol.3, No.2, 2020
535
Hung, D. N, Ha., T. V. H, & Binh, D.T. (2018). Impact of accounting information on financial statements to the stock price of the energy enterprises listed on Vietnam’s stock market. International Journal of Energy Economics and Policy, 8(2), 1-6.
Kementerian Perindustrian Republik Indonesia. (2019). Industri makanan dan minuman jadi sektor kampiun. Retrieved from https://kemenperin.go.id/artikel/20298/Industri-Makanan-dan-Minuman-Jadi-Sektor-Kampiun- accessed on 9 September 2019.
Mondal, Md. S. A., & Imran, M. S. (2019). Determinant of stock price: A case study on Dhaka Stock Exchange. Retrieved from http://citeseerx.ist.psu.edu/viewdoc/download?doi=10.1.1.459.5858&rep=rep1&type=pdf.
Narayan, P. K., Narayan, S., & Singh, H. (2014). The determinant of stock price: New evidence from the Indian banking sector. Emerging Markets Finance and Trade, 50 (2), 5-15.
Noor, M., & Scrimgeour. F. (2014). Stock returns and fundamentals in the Australian market. Asian Journal of Finance & Accounting, 6(1), 271-290.
Pratama, A. & Erawati, T. (2014). Pengaruh current ratio, debt to equity ratio, return on equity, net profit margin dan earning per share terhadap harga saham (Study kasus pada perusahaan manufaktur yang terdaftar di Bursa Efek Indonesia periode 2008-2011. Jurnal Akuntansi, 2(1), 1-10.
Puspitaningtyas, Z. (2017). Is financial performance reflected in stock prices?. Advances in Economics, Business and Management Research, 40, 1-12.
Suselo, D., Djazuli, A., Indrawati., N.K. (2015). Pengaruh variabel fundamental dan makro ekonomi terhadap harga saham (Studi pada perusahaan yang masuk dalam indeks LQ45. Jurnal Aplikasi Manajemen, 13(1), 104-116.
Syamrujial, T., & Agus, S. (2014). Analisis faktor-faktor yang mempengaruhi harga saham pada industri transportation services di Bursa Efek Indonesia tahun 2009-2012. Jurnal Dinamika Manajemen, 2(2).
Tandelilin, E. (2007). Analisis investasi dan manajemen portofolio. Yogyakarta: BFE UGM Tumandung, C.O., Murni, S., & Baramuli, D.N. (2017). Analisis pengaruh kinerja keuangan terhadap harga
saham pada perusahaan makanan dan minuman yang terdaftar di BEI periode 2011-2015. Jurnal EMBA, 5(2), 1728-1737.
Utari. (2016). Perhatikan rasio-rasio ini agar tidak salah memilih saham. Retrieved from https://www.seputarforex.com/artikel/perhatikan-rasiorasio-ini-agar-tidak-salah-memilih-saham-266649-34, accessed on March 2020.
Wareza, M. (2013). Belum sampaikan laporan keuangan, ini penjelasan AISA. Retrieved from https://www.cnbcindonesia.com/market/20190110132036-17-50009/belum-sampaikan-laporan-keuangan-ini-penjelasan-aisa, accessed on January 2020.
Widarjono, A.(2009). Ekonometrika pengantar dan aplikasinya, edisi ketiga, Yogyakarta: Ekonesia. Yanti, L., Nurazi, R., & Zulkarnain, I. (2012). Analisis pengaruh price to book value (PBV), earning per share
(EPS), debt to equity ratio (DER), dan return on equity (ROE) terhadap harga saham lima saham rekomendasi e-trading paling potensial di Bursa Efek Indonesia. The Manager Review Jurnal Ilmiah Manajemen, 13(2), 150-160.
Zulfikar, R. (2018). Estimation Model and Selection Method of Panel Data Regression: An Overview of Common Effect, Fixed Effect and Random Effect Models. Retrieved from https://www.researchgate.net/publication/326142125_Estimation_Model_And_Selection_Method_Of_Panel_Data_Regression_An_Overview_Of_Common_Effect_Fixed_Effect_And_Random_Effect_Model (Accessed on January 2020).