Embed Size (px)
Citation preview
Journal of Development Economics 103 (2013) 77–89
Contents lists available at SciVerse ScienceDirect
Journal of Development Economics
j ourna l homepage: www.e lsev ie r .com/ locate /devec
Economic shocks and civil conflict: Evidence from foreign interestrate movements☆
Peter Hull a,⁎, Masami Imai b,1
a Department of Economics, Massachusetts Institute of Technology, Cambridge, MA 02142, United Statesb Department of Economics, Wesleyan University, Middletown, CT 06459-0007, United States
☆ We thank Rosa Hayes for the excellent research assislocate some of the data, and the participants in a workshof Atlanta, seminars at Hitotsubashi University, Keio UnInstitute of Development Economics-Japan External Tradymous referees for their useful comments. We gratefusupport of the Economics Department (Imai) and Quanof Wesleyan University.⁎ Corresponding author. Tel.: +1 2076918800.
E-mail addresses: [email protected] (P. Hull), mimai@we1 Tel.: +1 860 685 2155; fax: +1 860 685 2301.
0304-3878/$ – see front matter © 2013 Elsevier B.V. Allhttp://dx.doi.org/10.1016/j.jdeveco.2013.02.001
a b s t r a c t
a r t i c l e i n f oArticle history:Received 13 October 2010Received in revised 5 August 2012Accepted 2 February 2013
JEL classification:D74F41F43
Keywords:Civil conflictOpen economyEthnolinguistic fragmentation
We exploit annual variation in influential foreign interest rates to identify externally-driven components ofshort-run income shocks in small open economies from 1971 to 2004 and explore the statistical nature ofthe income–civil conflict nexus. Our results show that movements in foreign interest rates have importanteffects on civil conflict risk through domestic economic channels. More importantly, the income–conflict re-lationship is found to be nonlinear – the conflict risk of ethnolinguistically fragmented countries is found tobe much more sensitive to shifts in economic conditions than that of homogeneous countries. These resultssuggest an important mechanism by which short-term economic shocks affect the trajectory of the politicaland economic performance of ethnically divided states.
© 2013 Elsevier B.V. All rights reserved.
1. Introduction
The degree to which internal conflict has burdened economic de-velopment in recent history is difficult to overstate. Since 1960, onethird of all countries have experienced at least one year ofintranational war, defined as conflict that claims over 1000 lives with-in its borders, and twenty percent of the world has seen at least ten(Blattman and Miguel, 2010). Internal war has steadily surpassedthe destructive legacy of international war, claiming over 16.2 millioncasualties between 1945 and 1999 – five times as many as thenumber of lives lost in comparable conflict between states (Fearonand Laitin, 2003). Ultimately, these figures may greatly understatethe human cost; off the battlefield, the long-term effects of disease,disability, and social fragmentation that result indirectly from civilwar extend well past the arrival of peace (Ghobarah et al., 2003).Beyond the social burden, the economic costs of civil conflict are
tance, Jim McGuire for helpingop at the Federal Reserve Bankiversity, Colby College, and thee Organization, and the anon-lly acknowledge the financialtitative Analysis Center (Hull)
sleyan.edu (M. Imai).
rights reserved.
similarly high. Immediate consequences – the demolition or weaken-ing of infrastructure, loss of technology, reduction of physical andhuman capital, and the diversion and destruction of the productivelabor force – can slow or even reverse the process of development(Abadie and Gardeazabal, 2003; Collier, 2007; Sandler, 2000).
Although the economic and social toll of civil war is widely-recognized, its underlying causes remain elusive. In theory, localshort-run economic conditions may affect the likelihood of civil warthrough changes to the potential warrior's opportunity costs of fight-ing (which include foregone non-conflict income) as shown byGrossman (1991), Dal Bó and Dal Bó (2011), and Chassang andPadró-i-Miquel (2009)2, yet the body of empirical literaturesupporting such predictions with credible and robust evidence isstill young. Earlier cross-country works of Collier and Hoeffler(2004) and Fearon and Laitin (2003), though finding strong negativecorrelations between economic conditions and the incidence of civilconflict, likely suffer from omitted variable and endogeneity biases.More recent empirical studies make use of plausibly exogenousshocks to economic growth (e.g., rainfall, and terms of trade) in anattempt to find cleaner estimates of the income–conflict relationshipand also to explore the extent to which it is affected by institutional
2 The implication of this theory is particularly relevant to economic development – ifthe state of the economy affects the likelihood of sudden civil war by altering the in-centives of potential combatants, then countries may be more likely to become miredwithin a “conflict trap” (Collier, 2007).

78 P. Hull, M. Imai / Journal of Development Economics 103 (2013) 77–89
quality and other socio-political factors (Besley and Persson, 2009;Brückner and Ciccone, 2010; Miguel et al., 2004)3.
This paper revisits these issues by introducing a new identificationstrategy to test the causal links between economic growth, civilconflict, and the socio-political setting. Specifically, we borrow froma large literature of open economy macroeconomics the finding thatwhen capital is internationally mobile, small open economies arehighly sensitive to interest rate fluctuations in large influential econ-omies as they explicitly or implicitly peg their currencies to the basecurrency of their choice, thereby giving up their monetary indepen-dence (e.g., Aizenman et al., 2008; Borensztein et al., 2001; Calvoand Reinhart, 2002; di Giovanni and Shambaugh, 2008; Hausmannet al., 2001). In the most extreme case, the literature on theopen-economy “trilemma” suggests that a country facing a complete-ly open capital account and a fixed exchange rate must align itsmonetary policy to exactly match that of its base country (Frankelet al., 2004).We thus identify economic fluctuations in small openeconomies by interest rate movement in their base countries and itsinteraction with measures of the domestic exchange rate regimeand capital account openness. The main identifying assumption forour purpose is that interest rates in influential countries (that is,countries to which currencies are typically pegged, such as the UnitedStates, France, and Germany) are determined exogenously to thedomestic economic and political conditions of small developing coun-tries at risk of internal conflict4.
Our identification strategy is similar in spirit to that of two closelyrelated papers: Miguel et al. (2004) and Brückner and Ciccone(2010), which use rainfall and terms of trade shocks, respectively, assources of exogenous variation in identifying the economic perfor-mance of sub-Saharan African countries. Our approach complementsthese papers and offers some additional benefits. One of the (non-)findings in Miguel et al. (2004) is that political, social, or geographicalconditions do not seem to affect the propensity of a country to fallinto civil war in response to negative economic shocks. These resultsnotwithstanding, it is important to remember that in order to obtainstrong identification with rainfall variation, Miguel et al. (2004) restricttheir focus to sub-Saharan African countries where weather patternshave significant effects on economic performance. However, the exclu-sion of countries outside of sub-Saharan Africa reduces both samplesize and the cross-country variation in these socio-political factorsnecessary to find meaningful nonlinearities in the income–conflictrelationship. Since the movements in base country interest rates havebeen shown to exert powerful and broad effects on small open econo-mies around the globe, we can expand our sample beyond sub-SaharanAfrica. Our data set, thus, contains much richer variation in the institu-tional characteristics across countries, which, in turn, enables us tocarry out more powerful tests onwhether country-specific institutionalcharacteristics amplify (or moderate) the effects of economic shocks onconflict risk5. In addition, examining the effects of economic conditionson civil conflicts through a different set of instruments is in itself a
3 Recent empirical work also includes studies that utilize more disaggregated micro-economic data. Benmelech et al. (2010) make use of detailed data on Palestiniansuicide bombers collected by the Israeli Security Agency to examine whether economicconditions affects the quality or productivity of suicide bombers. Krueger andMalečková (2003) study a connection between poverty and participation in terrorism,and Beber and Blattman (2010) use a hand-collected dataset on the characteristics ofyoung soldiers in Uganda to measure the role of coercion and economic reward inmilitary recruitment.
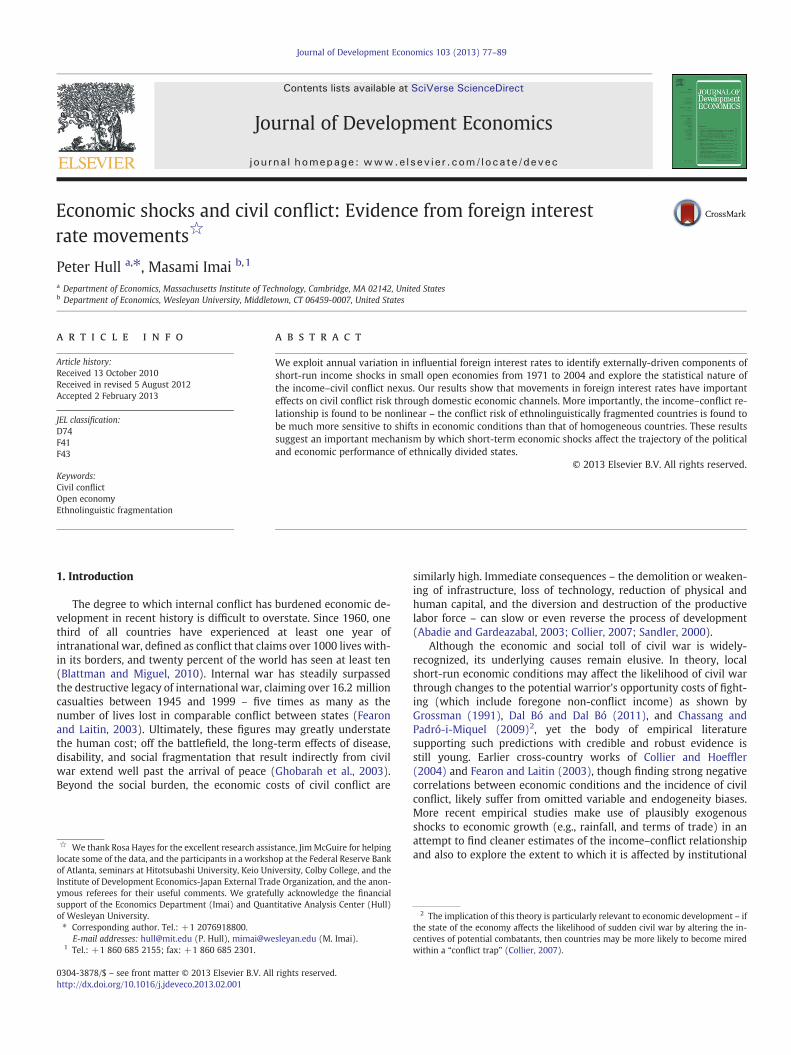
4 We briefly describe the case of Niger, a country with a strict currency peg to theFrench Franc, which fell into a series of violent civil conflicts shortly after Banque deFrance sharply raised its policy rate in the late 1980s in an attempt to match that ofthe Bundesbank. See Section 7.
5 A paper that is closely related to ours in this respect is Nunn and Qian (2010) whoexamine the impact of the US food aid on civil conflicts with global sample of develop-ing countries. They show that ethnic fractionalization is an important mediatingvariable; i.e., food aid causes fewer conflicts in ethnically homogeneous countries.
valuable exercise, given that the robustness of previous results hasbeen questioned6.
We find three notable results. First, our first-stage results reproducethe estimations of the relationship between base country interest ratesand output growth that characterizes the literature of open economymacroeconomics; i.e., we show that a significant part of economicfluctuations in small open economies can be explained by base countryinterest rates and the interaction of base rates with domestic exchangerate regimes and capital account openness. Second, as with Miguel etal. (2004) and Brückner and Ciccone (2010), our second-stage resultsshow that the estimated effect of domestic income shocks on theprobability of civil violence is statistically significant and of a sizeablemagnitude. Our most conservative estimates suggest that a negativeshock in GDP growth by four percentage points in a given year (notuncommon in developing countries) increases the probability of civilconflict by approximately six percentage points. As the sample statis-tics suggest that in each year a country has on average an unconditional16.7% chance of experiencing civil conflict (Table 1), this represents anincrease in conflict risk by thirty percent. While this estimate is smallerin magnitude than those obtained from their sample of sub-SaharanAfrican countries, it supports the qualitative conclusions of Miguel etal. (2004) and Brückner and Ciccone (2010) that negative short-runeconomic shocks elevate local conflict risk.
Lastly, we find one result that differs from previous papers. Miguelet al. (2004) do not find any nonlinearities in the conflict–incomenexus; that is, political, social, or geographical conditions do not seemto amplify or moderate the effects of economic shocks on the propen-sity of a country to fall into civil conflict. Although we find no statisti-cally significant evidence supporting the relevancy of religiousdiversity, reliance on oil or other natural resource exports, politicalinstitutional quality, or country terrain, we show that higher levels ofethnolinguistic diversity make a country more conflict-prone whenits economy suffers a recession. This estimated nonlinearity is econom-ically important. For a country at the 25th percentile of globalethnolinguistic fragmentation (such as Venezuela or Greece), a suddendecrease in GDP growth by one percentage point increases the proba-bility of civil conflict by only a tenth of a percentage point. However,for a country at the 75th percentile (such as Kazakhstan or Ethiopia)the same economic shock increases the probability of internal violenceby an average of 3.88 percentage points (23.2% from the typical annuallikelihood of conflict). These results support the claim that slowed eco-nomic development may widen pre-existing ethnic rifts in countrieswith particularly fractionalized social institutions (Fearon, 2007).
The remainder of this paper is organized as follows. Section 2discusses and summarizes the data used in this paper, and Section 3describes in detail the empirical strategy. Section 4 provides a discus-sion of the main results and summarizes the findings from extensionsthat consider various socio-political and geographic factors. Section 5describes the results of various robustness checks and their implica-tions for both the main results and their extensions. Section 6 providesconcluding remarks, with a brief case study presented in Section 7.
2. Data
An annual panel dataset consisting of 97 countries from 1971 to2004 is constructed from a variety of sources. Variables of primaryinterest in the baselinemodel include the presence of internal violence,annual real output growth rates, measures of exchange rate regime andcapital account openness, and base country interest rates. In addition,we consider various macroeconomic, social, and political variables
6 See discussion of relevant econometric issues in Blattman and Miguel (2010),Ciccone (2011), Bazzi and Blattman (2011), and Miguel and Satyanath (2011). Notably,Miguel and Satyanath (2011) find sub-Sarahan African growth to be less sensitive torainfall shocks after 1999 and emphasize the need for alternative identificationstrategies.

9 This proportion is slightly smaller than that found in previous research that usesthe same PRIO/Uppsala database. This discrepancy is due to both the inclusion in thispaper of countries where conflict is rarer (such as relatively more developed countriesand countries outside of sub-Saharan Africa) and the consideration of years where con-flict was less common (prior to 1980 and after 1999). Econometrically, our identifica-tion strategy, dependent on large variation in base interest rate movements,necessitates the inclusion of these generally low interest rate periods (see Fig. 1).10 See Quinn and Toyoda (2008), Shambaugh (2004), and Eichengreen and Razo-Garcia
Table 1Descriptive statistics.
Mean St. dev. Min. Max. Obs.
Conflict 0.167 0.373 0 1 2698Between countries 0.257 99Within countries 0.262
War 0.0497 0.217 0 1 2698Between countries 0.118 99Within countries 0.181
Onset 0.0315 0.175 0 1 2321Between countries 0.0709 97Within countries 0.167
Duration 0.838 0.369 0 1 433Between countries 0.423 49Within countries 0.277
Conflict count 6.64 5.52 0 17 2792Between countries 4.89 101Within countries 2.48
Peg 0.464 0.499 0 1 2721Between countries 0.297 100Within countries 0.395
KAOPEN −0.0162 1.44 −1.81 2.54 2675Between countries 1.87 100Within countries 0.884
Base interest rate 0.0656 0.0348 0.0101 0.213 2668Between countries 0.0164 99Within countries 0.0318
GDP growth 0.0383 0.0444 −0.190 0.199 2721Between countries 0.0181 100Within countries 0.0411
Inflation 0.100 0.0944 −0.217 0.497 2721Between countries 0.0552 100Within countries 0.0791
ETHFRAC 0.408 0.291 0.00412 0.892 2598Between countries 0.282 95
RELFRAC 0.347 0.218 0 0.775 2598Between countries 0.222 95
POLITY 2.20 7.32 −10.0 10.0 2596Between countries 6.21 94Within countries 3.82
Log(mountainous) 2.17 1.47 0 4.32 2598Between countries 1.48 95
Oil-exporting country 0.168 0.374 0 1 2598Between countries 0.346 95Within countries 0.141
Primary exports/GNP 0.135 0.123 0 1 2483Between countries 0.128 82Within countries 0.0246
Notes: Data are from the global sample, 1971–2004. Some social and geographicvariables are time-invariant and thus do not vary within countries.
79P. Hull, M. Imai / Journal of Development Economics 103 (2013) 77–89
suggested by Fearon and Laitin (2003). In selecting all of thesevariables, we follow closely the work of di Giovanni and Shambaugh(2008), Miguel et al. (2004), and others who provide a detaileddescription of the various benefits and shortcomings of alternatives.
For the incidence of intranational violence, we follow Miguel et al.(2004) and Brückner and Ciccone (2010) in using the Armed Conflict Da-tabase of the International Peace Research Institute of Oslo, Norway andthe University of Uppsala, Sweden (PRIO/Uppsala)7. PRIO/Uppsala de-fines civil conflict as “an [internal] contested incompatibility which con-cerns government and/or territory where the use of armed forcebetween two parties, of which at least one is the government of a state,results in at least 25 battle-related deaths.” The civil conflict indicator var-iable, coded as one if a civil conflict against the statewith at least 25 battledeaths per year is ongoing in country i in year t, is denoted Conflictit
8.
7 We use the latest version of PRIO database (version 4, 2010). We confirm the re-sults are largely consistent across versions, although we omit these results to conservespace.
8 Our focus is the incidence of internal conflicts. Nonetheless, to be certain that ourresults are not driven by larger-scale international conflict, we also control for inci-dence of extraterritorial war, whose data is also available in PRIO/Uppsala. We confirmthat our results are not affected; these results are not reported to conserve space.
By this classification, 16.7% of country-year observations in our samplesaw civil conflict from 1971 to 20049.
To classify exchange rate regimes, we closely follow the methodol-ogy of Shambaugh (2004) and di Giovanni and Shambaugh (2008) inusing a de facto classification as the official de jure exchange rate policycan be quite misleading10. Following common definitions in the litera-ture (e.g. Obstfeld and Rogoff, 1995), a country is designated pegged ifits official nominal exchange rate remains within ±2% bands over agiven year against its base country11. Base countries are identifiedand matched to the domestic economy through an examination ofthe officially declared base (if available), the history of a country'sexchange rate, a comparison of exchange rate movement across allmajor currencies, and consideration of dominant regional currencies(see di Giovanni and Shambaugh, 2008). The resulting measure, Pegit,is a binary variable set equal to one if country i in time t is characterizedas pursuing a de facto fixed exchange rate and zero otherwise. Approx-imately 46% of country-time observations in this paper's global samplefollow a pegged exchange rate. In measuring the degree of financialliberalization for each country in the sample, we use the KAOPENit var-iable constructed by Chinn and Ito (2008) based on standard principlecomponent analysis of reversed values of the four IMF AEREAR dummyvariables12.
Annual money market interest rate data are collected from theIMF's International Financial Statistics database. With the base countryidentified for each country-year observation, we construct the variableRb
it which takes on the value of the interest rate of the country towhich the domestic country's currency is pegged if the country is iden-tified as pursuing a fixed exchange rate, or the value of the interest rateof the country determined by Shambaugh (2004) as the most relevantbase country. Fig. 1 plots the movement of a selection of the rates ofvarious base countries over time.
Annual growth rates of GDP at market prices deflated by a constantlocal currency (yit) are given by the World Bank's World DevelopmentIndicators (WDI) database. We also gather inflation rate data from theWDI to control for the general direction of domestic macroeconomicpolicy. Data for ethnolinguistic and religious fractionalization, democ-racy, reliance on oil exports, and roughness of terrain come from andare discussed in detail in Fearon and Laitin (2003) and Miguel et al.(2004). We take an ethnolinguistic fractionalization variable (ethfracit)from the Soviet ethnographic index Atlas Narodov Mira that measuresthe probability that two randomly selected individuals in a countrywill belong to different ethnolinguistic groups13, a measure of religiousfractionalization (relfracit) from the CIA Factbook, a variable capturingthe presence of democratic institutions (polityit) from the standardPolity IV data set, the logged proportion of a country categorized asmountainous by geographer A.J. Gerard (taken from Fearon andLaitin, 2003), a binary variable set equal to one if the World BankWDI database reports that oil constitutes more than one-third of ex-port revenues for country i in year t, and from Sachs and Warner
(2011) for in-depth discussions of exchange rate classifications.11 Single year “pegs” identified in this manner are dropped as they likely represent arandom lack of variation in the exchange rate rather than a temporary change in policy.12 The literature on financial liberalization emphasizes the difficulty of consistentlyidentifying and quantifying a given level of capital account openness. See Edison etal. (2002) and Eichengreen (2002) for detailed discussion of measurement issue.13 Our main results are based on the Atlas Narodov Mira to be comparable with Miguelet al. (2004). For an additional robustness check, we also use the more recent measuredeveloped by Alesina et al. (2003). The results are qualitatively similar and notreported to conserve space.
A: Base Country Interest Rates over Time
B: Base Country Interest Rates over Time (Cont.)
0
5
10
15
20
1972
1974
1976
1978
1980
1982
1984
1986
1988
1990
1992
1994
1996
1998
2000
2002
2004
Mon
ey M
arke
t Rat
e (%
)
United States France Germany United Kingdom South Africa
0
5
10
15
20
1972
1974
1976
1978
1980
1982
1984
1986
1988
1990
1992
1994
1996
1998
2000
2002
2004
Mon
ey M
arke
t Rat
e (%
)
Australia Malaysia India Portugal
Fig. 1. Variation Across and Within Base Country Monetary Policies. Panel A: Base Country Interest Rates over Time. Panel B: Base Country Interest Rates over Time (Cont.).
80 P. Hull, M. Imai / Journal of Development Economics 103 (2013) 77–89
(1995) the ratio of primary exports to GNP to capture reliance onnatural resource exports more generally.
Summary statistics for these variables are reported in Table 1. Con-sistent with the observations of Easterly and Levine (1997), the proba-bility of two representative individuals from a given country belongingto different ethnic groups is lower (0.408) in the global sample than inMiguel et al. (2004) (who find an average of 0.65). Additionally, whencompared to the limited African sample, this paper's global sample ex-hibits a higher heterogeneity in terms of ethnolinguistic and religiousfractionalization, democracy, terrain, and oil exporting. The standarddeviation of ethnolinguistic fractionalization increases from 0.24 to0.29 in the global sample, while that of religious fractionalization in-creases from 0.19 to 0.22 and the Polity IV score for democracy growsin standard deviation from 5.6 to 7.3214.
14 In some specifications, which we do not report to conserve space, we focus only onnon-OECDcountries and also ex-colonies to obtainmore homogeneous group of countriesand improve our statistical inference. The results turn out to be qualitatively the samewith one important exception that the coefficient on the interaction of economic growthwith ethnic diversity loses statistical significance. We interpret this as due to the fact thatstatistical variation in ethnic diversity declines when we use these sub-samples.
After collecting the data, the sample is cleaned in various ways cor-responding with the methodology given by di Giovanni andShambaugh (2008) tominimize the effects of outliers, misspecification,and measurement error. First, we drop countries from the sample thateither always peg or always float their currency for all of their includedyears. By using countries that are likely to experience both floating andfixed exchange rate regimes, we avoid the possibility of includingpegged countries that are inherently more dependent on base countryinterest rates for reasons independent of their exchange rate regimechoice. Next, we eliminate periods of hyperinflation, defined as an in-flation rate of 50% or higher in a given year, as they are generallyviewed by the literature as outliers for domestic interest ratemovement. In a similar fashion, we eliminate observations where thereal output growth rate is reported as either above 20% or below-20%, seeing these cases either as coding errors or outliers. Droppingthese country-year observations also addresses a possible source ofendogeneity since a country that is experiencing large-scale economiccollapse and hyperinflation due to internal violence might have stron-ger incentives to give up a pegged currency or tighten the control of fi-nancial outflows. Finally, countries with a population less than 250,000

81P. Hull, M. Imai / Journal of Development Economics 103 (2013) 77–89
are viewed as too small to be representative of the global sample andare dropped15.
3. Empirical strategy
We follow the open economy macroeconomics literature toestimate a first-stage regression that identifies exogenous compo-nents of within-country variation in annual GDP growth. For the sec-ond stage, civil conflict is regressed on the instrumented annualgrowth rate. That is, for all countries in the 1971–2004 sample forwhich both second- and first-stage data are available, we estimatethe following system of linear equations by Two-Stage Least Squares:
yit ¼ θi þ θitrendt þ β1R
bi t−1ð Þ þ β2 Rb
i t−1ð Þ � Pegi t−1ð Þ� �
þβ3 Rbi t−1ð Þ � KAOPENi t−1ð Þ
� �
þβ4 Rbi t−1ð Þ � Pegi t−1ð Þ � KAOPENi t−1ð Þ
� �þ Xitϕþ vit
ð1Þ
Conflictit ¼ γi þ γitrendt þ δyit þ Xitψþ εit ð2Þ
where yit represents the annual growth rate in real GDP for country i intime t, Rb
it denotes the short term nominal interest rate of the base ofcountry i, Pegit is the binary de facto exchange rate regime variable,KAOPENit is the Chinn and Ito (2008) measure of capital account open-ness, Conflictit is the PRIO/Uppsala civil conflict indicator variable, Xit isa matrix of country-level controls (which includes the direct effects ofPeg and KAOPEN), and vit and εit represent error terms16.
Country-specific intercepts (θi and γi) are included to control forunobserved time-invariant country-level characteristics (e.g., institu-tional quality) that are potentially correlated with the propensity toexperience civil war. The inclusion of these effects ensures that the re-sults are driven only by the parts of within-country variation in annualeconomic growth that are correlated to within-country variation inbase country interest rates. As with Miguel et al. (2004), country-specific time trends (θitrend and γi
trend) are included to capture addition-al variation. Finally, estimated standard errors are clustered at thecountry level to adjust for possible within-country correlation in theerror term17.
The first-stage regression captures two sources of exogenousmove-ment in GDP growth. First, each country's GDP growth correlates withits base country interest rate, thereby generating within-country varia-tion. To the extent that each base rate is imperfectly correlated withother rates (see Fig. 1), this gives cross-country variation in GDP
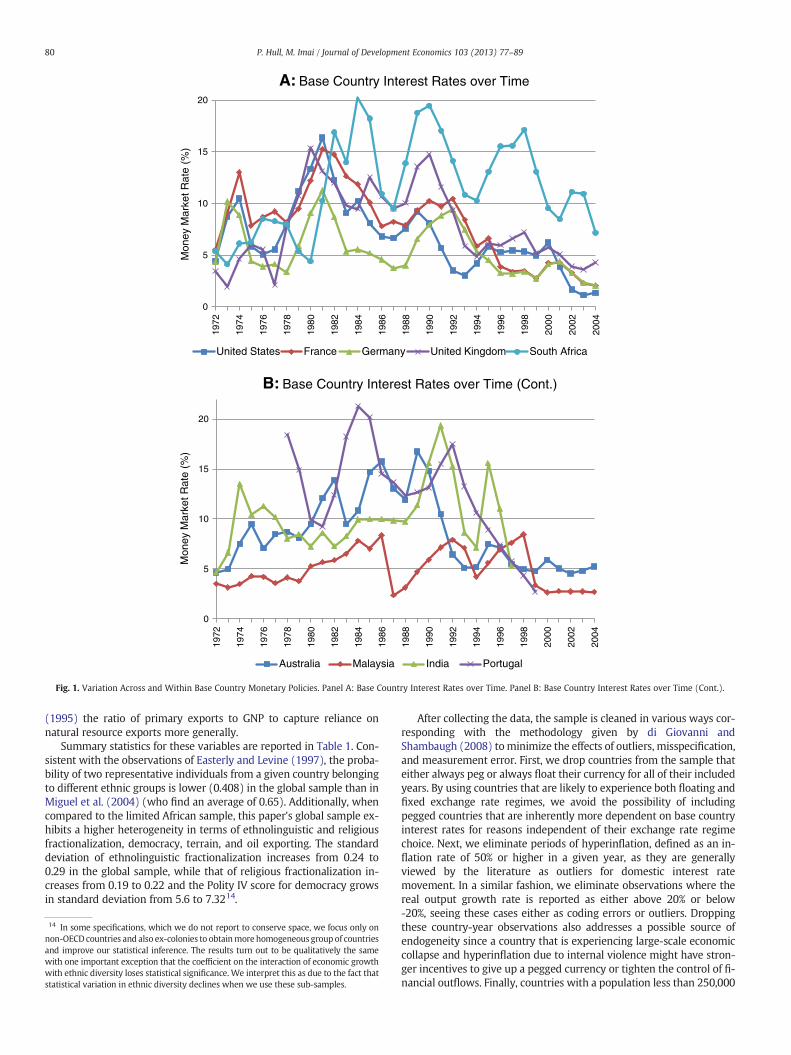
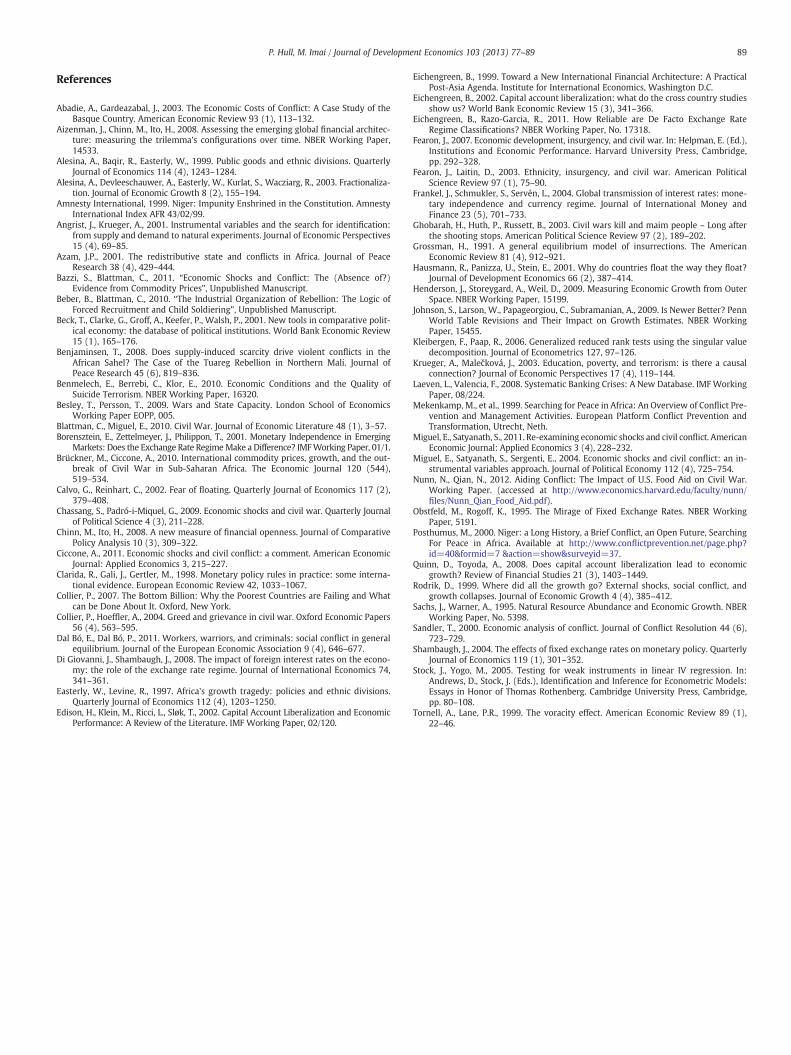
15 di Giovanni and Shambaugh (2008) find that their results do not vary significantlywith modifications to these cutoffs, and in some cases are strengthened. Correspond-ingly, we test the robustness of first- and second-stage specifications to a variety ofmarginal deviations in these sub-sampling parameters to find virtually no change inresults.16 We also explore the reduced form relationship between civil conflicts and basecountry interest rates. Figure A1 displays a panel of figures, showing the mean conflictin the countries pegged to US, France, and Germany, together with the interest rate inthese base country. Table A1 shows the results of the reduced form equation in whichcivil conflict incidence is directly regressed on our first-stage set of instruments. Theresults confirm that civil conflicts are positively correlated with base country interestrates.17 To be specific, we use the command xtivreg2 in Stata with the option of clusteredstandard errors by country. We also estimate all specifications with standard errorsclustered by base country or by country and year to examine whether the level of sta-tistical significance is sensitive either to correlation within countries sharing the samebase country or to contemporaneous correlation across country. The results are essen-tially the same if not stronger and thus are not reported to be comparable to priorworks and to conserve space.
growth at any particular point in time. Second, within a group of coun-tries that use the same base country for monetary policy guidance,some adhere to a pegged regime and have a more open capital accountthan others. Since the sensitivity of a small open economy to basecountry interest rates should depend crucially on exchange rate regimeand capital account openness through the open-economy trilemma,heterogeneity in these two variables generates further cross-countryvariation18.
To obtain consistent estimates of the effects of economic growthon civil war (i.e., δ), two standard conditions for instrumental vari-able analysis must be met. First, the instruments must strongly pre-dict movement in output growth to avoid weak instrumentationthat would bias estimates towards the Ordinary Least Squares re-sults (Stock and Yogo, 2005). For each specification, we calculatethe Kleibergen and Paap (2006) rk LM and F statistics to test forthe strength of the instrumentation. The second, more subtle, andfundamentally untestable requirement for valid identification isthat the instrumental variables must be uncorrelated with theerror term of the second-stage equation; that is, the instrumentsin the first stage must be unrelated to all domestic conditions corre-lated with the incidence of internal violence that are not otherwisecontrolled for. If this exclusion requirement is not met, the resultingbias in instrumental variable estimation may be significantly worsethan that due to from measurement error, endogeneity, and omittedvariable bias in the Ordinary Least Squares estimation (Angrist andKrueger, 2001). For each specification we include the Hansen J sta-tistic for a standard overidentification test. We address potential lin-gering endogeneity issues through our choice of second-stagecontrols in Section 4 and various sub-sample robustness checks inSection 5.
4. Results
4.1. The income–civil conflict nexus
Table 2 reports themain results of estimating Eqs. (1) and (2) aswellas the un-instrumented second-stage relationship for comparison19.Column 1 reports the simple linear probability model relating contem-poraneous economic growth to the incidence of civil conflict with coun-try fixed effects and country-specific trends20. The coefficient estimate,although significant at the 95% level, suggests a very small link betweeneconomic contraction and internal conflict: a one percentage point drop
18 As a robustness check, we include base country interest rates in the second stage sothat the equation is identified only by the interaction of base interest rates and thetrilemma configuration. We find that the interactions of the exchange rate peg indica-tor and capital account openness measure with base country interest rates remain sig-nificant at 5 percent error level in these specifications. However, without the directeffects of base country interest rates, our instruments become substantially weaker.We interpret this as reflecting the “fear of floating” – the fact that the central banksof countries whose currency is not strictly pegged to a base currency still tend to matchthe base country rates in order to maintain open-economy stability (Calvo andReinhart, 2002; Hausmann et al., 2001). Thus, our estimates are based on both varia-tion from the direct effects of base rates as well as the differential effects that dependon each country's trilemma configuration.19 We also check that the theoretical implications of the trilemma hold for thispaper's dataset by correlating domestic interest rates to base country interest rates,given its implications in delivering proper identification for the subsequent analysesof civil conflict. We are able to replicate the results of Frankel et al. (2004) andShambaugh (2004), that the central banks of small open economies tend to followthe base country interest rates and this tendency is particularly strong in pegged re-gime with open capital account. The results are not reported to conserve space.20 This relationship is also estimated with a logit specification. The results are similarto those in the linear probability model and results of this estimation are omitted forclarity and space.

21 In a separate regression, we also estimate the same specifications with the interac-tion of private credit to GDP, a measure of financial development, with base country in-terest rates. We find that the transmission of base country monetary shocks is strongerin more financially developed economies. Since the second-stage results remain virtu-ally unchanged, the results are not reported to conserve space.
Table 2Main estimation results.
(1) (2) (3) (4) (5) (6) (7) (8) (9) (10) (11) (12)
First-stageBase R −0.302*** −0.228*** −0.233*** −0.236*** −0.228*** −0.195*** −0.137*** −0.202*** −0.250*** −0.277*** −0.228***
(t-1) (0.0403) (0.0482) (0.0471) (0.0468) (0.0468) (0.0470) (0.0517) (0.0540) (0.0485) (0.0534) (0.0482)BaseR×Peg
−0.152**(0.0650)
−0.155**(0.0648)
−0.148**(0.0649)
−0.131*(0.0673)
−0.137**(0.0651)
−0.156**(0.0662)
−0.142**(0.0643)
−0.147**(0.0647)
−0.170**(0.0697)
−0.152**(0.0642)
(t-1)Peg (t-1) 0.00873* 0.00888* 0.00860* 0.00643 0.00828* 0.00879* 0.00865* 0.00903* 0.00752 0.00889*
(0.00454) (0.00467) (0.00474) (0.00482) (0.00471) (0.00474) (0.00470) (0.00478) (0.00533) (0.00465)Base R ×KAOPEN
−0.0634**(0.0246)
−0.0697***(0.0239)
−0.0745***(0.0242)
−0.0700***(0.0238)
−0.0701***(0.0232)
−0.0732***(0.0233)
−0.0670***(0.0243)
−0.0567**(0.0277)
−0.0663***(0.0240)
(t-1)KAOPEN 0.00695*** 0.00683*** 0.00565** 0.00679*** 0.00604** 0.00711*** 0.00733*** 0.00525* 0.00615**
(t-1) (0.00252) (0.00252) (0.00265) (0.00253) (0.00254) (0.00250) (0.00245) (0.00300) (0.00257)BaseR×Peg ×KAOPEN
0.0164(0.0252)
0.0217(0.0259)
0.0194(0.0251)
0.0187(0.0266)
0.0198(0.0249)
0.0128(0.0256)
0.0356(0.0294)
0.0160(0.0250)
(t-1)Inflation −0.0743***
(0.0200)WorldGDP
0.00165*(0.000886)
growthBase GDP 0.000996growth (0.000762)
Conflict 0.000846count (0.000552)
Conflict −0.0119***(t-1) (0.00455)
Right 0.00441**(0.00214)
R2 0.0415 0.0449 0.0485 0.0488 0.0638 0.0507 0.0138 0.0505 0.0505 0.0553 0.0528
Second-stageGDP −0.400** −2.40** −2.07** −1.98** −2.00** −1.99** −2.34** −1.21 −2.03* −1.44* −1.18* −1.42**
growth (0.158) (1.08) (0.956) (0.847) (0.846) (0.900) (1.17) (1.52) (1.08) (0.782) (0.710) (0.577)Peg (t-1) 0.00567 0.00699 0.00701 0.00765 0.00731 0.0116 0.00708 0.0162 0.00930 0.00866
(0.0199) (0.0205) (0.0205) (0.0214) (0.0207) (0.0219) (0.0204) (0.0189) (0.0214) (0.0154)KAOPEN −0.0337*** −0.0336** −0.0329** −0.0327** −0.0333*** −0.0335** −0.0262** −0.0402*** −0.0189**
(t-1) (0.0132) (0.0131) (0.0136) (0.0133) (0.0128) (0.0134) (0.0124) (0.0150) (0.00797)Inflation 0.0400
(0.133)WorldGDP
0.00454(0.00613)
growthBase GDP 0.000640growth (0.00403)
Conflict 0.0133***count (0.00384)
Conflict 0.411***(t-1) (0.0594)
Right 0.0133(0.0157)
Obs. 2664 2494 2494 2449 2449 2449 2449 2449 2449 2449 2211 2449No. ofcountries
98 97 97 97 97 97 97 97 97 97 96 97
Year FE N N N N N N N Y N N N NRoot MSE 0.230 0.226 0.225 0.225 0.225 0.229 0.216 0.225 0.218 0.216 0.201K-P rk LM 35.8*** 35.4*** 33.9*** 34.6*** 31.7*** 27.0*** 20.8*** 25.8*** 35.0*** 38.4*** 34.9***statistic [b0.0001] [b0.0001] [b0.0001] [b0.0001] [b0.0001] [b0.0001] [0.0003] [b0.0001] [b0.0001] [b0.0001] [b0.0001]
K-P rk Fstat.
56.3 27.5 26.1 20.7 18.6 13.5 9.73 11.6 20.3 18.9 19.4
Hansen J 2.39 2.05 3.11 3.24 3.12 5.11 3.10 3.19 2.79 2.23stat. [0.122] [0.359] [0.375] [0.356] [0.373] [0.164] [0.377] [0.363] [0.425] [0.526]
Notes: Robust standard errors clustered at the country level are included in parentheses. Asterisks denote statistical significance at the 90% (*), 95% (**), and 99% (***) levels.Estimations of country-specific time trends are included but not reported to conserve space. P-values for the null hypotheses of underidentification and instrument exogeneityare given in brackets underneath the Kleibergen-Paap rk LM and Hansen J statistics, respectively.
82 P. Hull, M. Imai / Journal of Development Economics 103 (2013) 77–89
in output growth correlateswith an increased probability of internal vi-olence on average by only 0.40 percentage points.
The first-stage results of columns 2–5 replicate the well-known re-sults of the literature on the open-economy trilemma (e.g. di Giovanniand Shambaugh) and the “fear of floating” (Calvo and Reinhart, 2002;Hausmann et al., 2001) that higher base country interest rates correlateto contractions in domestic output growth rates and that these effects
are stronger for countries with a pegged currency and an open capitalaccount21. The second-stage results show that the coefficient on

83P. Hull, M. Imai / Journal of Development Economics 103 (2013) 77–89
instrumented GDP growth is negative and statistically significant, indi-cating that a one percentage point decline in domestic GDP growthleads to a 2 percentage point increase in the probability of civil conflict.Interestingly, the estimated effect in the instrumental variable results(columns 2–5) is found to be larger than that in a simple OLS estimate(column 1), possibly because the OLS estimates suffer from a large at-tenuation bias due to measurement error in income growth rates22.
One possible concern with this paper's instrumentation strategyis that the trilemma configuration consists of policy choice variables(i.e., Peg and KAOPEN) that could be endogenous to the risk of civil war.As a simple example, the costs of containing and defeating a potential in-surrection may tighten the budget constraints of the ruling domesticgovernment and increase the incentives of that government tomonetizedebts, inflate the currency, turn to afloating exchange rate, or tighten thecontrol of financial flows. It is worth emphasizing, however, that whilethe goodness of fit improves with additional instruments in the firststage, the second-stage results are highly robust to the choice of instru-ments. In particular, we obtain similar estimates of the effects of GDPgrowth on civil war risk in column 2 where the model relies only onbase rates, over which domestic governments in principle have no con-trol. Furthermore, the income–conflict relationship seems robust tosecond-stage controls for the direct effects of Peg and KAOPEN, ensuringthat the relationship is identified only by their interaction with theplausibly exogenous base country rates. Moreover, if a shift in domesticmacroeconomic policy that accompanies civil conflict incidence isdriving our results, then our results should be extremely sensitive tothe inclusion of a proxy for macroeconomic policy such as inflationrates or budget deficits, but controlling for inflation generates essential-ly the same results (column 6). These results give some assurance that,although the choice of capital account openness and exchange rateregime is highly relevant for the transmission of foreign interest rateshocks, it is unlikely to drive the main results in the second stage.
We further examine the robustness of these results by adding covar-iates that may control for unobservable factors that affect the likelihoodof civil war (columns 7–12). One concern might be that our results aredriven by commonglobal shocks to theworld business cycle. To addressthis issue, we control for the growth rate of world GDP. World GDPgrowth is positively correlated with domestic economic growth asexpected, but it is insignificant in the second stage, leaving our centralresults unaffected (column 7). That is, there is enough heterogeneityin civil conflict incidence among different countries that cannot beexplained by global economic cycle alone. To further explore the possi-bility that our results are due to unobservable global shocks, we includeyear fixed effects (column 8). However, the explanatory power of ourinstrumental variables declines precipitously (as shown by a muchsmaller first stage R-squared) and the coefficient on GDP growth losesstatistical significance in the second stage. This occurs in part becauseinterest rates in the base countries are somewhat synchronized asfinancial markets are integrated amongst developed economies; thatis, we are not able to entirely rule out the possibility that our resultsare driven by the unobservable correlates of global business cyclesdue to the weakness of the instrumentation in this setting.
Another issue is that we may expect unobservable shocks that arecommon to countries that share the same base currency; e.g., countriesthat use the US dollar as base might have become more entrenched in
22 This attenuation bias from measurement error in GDP is likely both pervasive andlarge. Johnson et al. (2009) show that for at least one particular measure of GDP, thePenn World Table (PWT), estimates in average growth rates may vary across revisionsof the dataset by 1.1% on average. As a particularly dramatic example, Equatorial Guin-ea, which was ranked as the second-fastest growing African country in version 6.2 ofthe PWT, was listed as the slowest growing country in version 6.1, released just fouryears earlier. This observation has motivated many researchers, such as Henderson etal. (2009) to seek creative proxies and instruments to GDP growth rates in developingcountries that limit the effect of measurement error. Incidentally, Miguel et al. (2004)also find that their OLS estimates are smaller than their IV estimates.
cold war politics during the 1980s when the US interest rateshappened to have spiked due to tight monetary policy and expansion-ary fiscal policy. To address this concern, we include two time-varyingvariables that are specific to each base country. First, we simply controlfor the growth rates of base country's GDP, which proxy for economicshocks common to all countries that share the same base currency.Second, for each group of countries which share the same base cur-rency, we calculate the number of countries with ongoing civil con-flict and include it as a control for unobservable common shocks toeach group. Base country GDP turns out to be insignificant in boththe first- and second-stage results, and does not alter the centralfindings (column 9)23. The number of ongoing conflicts withineach group turns out to be highly significant in the second stage (column10) and it reduces the size of the coefficient on GDP growth. Nonetheless,the results remain significant at 10percent error level.We further accountfor domestic politics in the base country (e.g. left vs right party in power)by including an annual indicator variable for right wing government con-trol in each of the 9 base countries (column 11)24. The second-stage coef-ficient on GDP growth remains qualitatively the same, while thecoefficient on the right wing government indicator variable is insignifi-cant in the second stage25.
Finally, we include as a control the lagged incidence of conflict asrecent empirical papers have demonstrated that civil conflicts are highlypersistent and that controlling for thismay lead to starkly different results(Ciccone, 2011; Miguel and Satyanath, 2011; Nunn and Qian, 2012).Confirming the results of these papers,wefind that (1) lagged incidenceis positively correlated with conflict incidence in the second stage and(2) lagged incidence is negatively correlated with GDP growth in thefirst stage, suggesting that conflicts impose persistent economic costs(column 12). The average effects of GDP growth in the second stage de-clines from −2 to −1.4 with lagged incidence (approximately). How-ever, our central results remain statistically significant because theinclusion of lagged incidence improves the goodness of fit in the secondstage and significantly reduces standard errors.
It should be noted that the strength of the causal relationship be-tween GDP growth and civil conflict we find is a smaller, though stillstatistically significant, estimate than that found by Miguel et al.(2004), who report a nearly 2.5 percentage point increase in conflictrisk with the same economic shock in sub-Saharan Africa. That is,the average effect of economic shocks on the probability of conflictmay be smaller over a global sample of countries than over a samplerestricted to Africa. This suggests that while the income–conflict rela-tionship documented in Miguel et al. (2004) might be applicable tonon-African countries, African countries may have peculiar conditionsthat make them more vulnerable to civil conflict during economicdownturns.
4.2. Socio-political interaction effects
The identification strategy we develop in this paper may be betterequipped to test the degree towhich socio-political and other factors af-fect the main relationship between domestic GDP growth rates and theoutbreak of civil conflict. Fearon and Laitin (2003) posit a variety ofways that such factors – namely, ethnolinguistic fractionalization, thelack of democratic political institutions, the presence of rough terrainand a mountainous geography, and the reliance on oil exportation –
23 We also control for the total number of ongoing conflicts in the world. Given thatthese results turned out to be nearly identical to the results with the total number ofconflicts within each base country group they are not reported here for space.24 We use the Beck et al. (2001) Database of Political Institutions to gather informa-tion about the left vs. right wing ideology of ruling governments.25 Moreover, we estimate the same regression with only those countries that use USdollar as a base currency. We find no evidence to suggest that the conflict risk of thesecountries is more sensitive to economic fluctuations, making it unlikely that cold warpolitics contaminate our results in any significant way.

84 P. Hull, M. Imai / Journal of Development Economics 103 (2013) 77–89
may make civil conflict more likely. We follow Miguel et al. (2004) inestimating coefficients on instrumented interactions between thesefactors and GDP growth to investigate a more nuanced story for hownon-economic conditions affect the income–conflict nexus.
In general, as in Miguel et al. (2004), we find that religiousfragmentation, lack of democratic political institutions, the presenceof rough terrain and a mountainous geography, and the reliance onoil or other natural resource exports are not significant amplifying fac-tors in the income–civil war relationship (Table A2). However, we findthat ethnolinguistic fractionalization strengthens the impact of eco-nomic growth on civil war risk and that the results are highly robustto the choice of instruments and the inclusion of covariates (Table 3)26.
These results are quantitatively important. For a country such asVenezuela or Greece at the 25th percentile of ethnolinguistic fragmen-tation (0.107), a one percentage point decline in domestic GDP growthdoes not lead to any significant increase in the probability of conflict inall specifications. However, even based on conservative estimates(column 11), for a country such as Kazakhstan, Ethiopia, and Boliviaat the 75th percentile (0.694) the resulting increase in conflict riskby the same shock in internal GDP growth is 2.57 percentage points.For countries at the maximum of the scale of ethnolinguistic fraction-alization such as Cameroon, Nigeria, India, Kenya, and Sierra Leone,simple linear extrapolation of this interaction effect is more direstill – with a measure of ethnolinguistic fragmentation of 0.892, acountry like Cameroon is expected to see a 5.23 percentage pointspike in conflict risk with only a single percentage point fall in GDPgrowth from the specification of column 5, Table 3, and still a 3.47 per-centage point increase in themost conservative estimate (column 11).These represent increases in the typical unconditional probability ofconflict by 31.3% and 20.8%, respectively. Thus, consistent with politi-cal science literature, a more socially fragmented country appearsmuchmore likely to experience internal violence in the face of suddeneconomic contraction27.
The results of this section should be interpreted with particular careas the relatively small values of the Kleibergen-Paap rk F statistic bringinto question the strength of these instruments. As a weak instrumenttends to bias coefficients towards their corresponding Ordinary LeastSquares estimates found in column 1 of Table 3 (Angrist and Krueger,2001), however, it may be the case that the estimates found here(and also in earlier empirical literature) understate the true relation-ship between domestic economic and socio-political conditions andthe probability of civil conflict.
28 Although rare, there are historical cases where the central banks of major basecountry economies have responded to financial shocks originating in small foreign
5. Robustness checks
5.1. Sub-sample analysis
We consider a series of sub-sample analysis robustness checks toaddress the concern that base country interest rates may not satisfyan exclusion restriction. In particular, we test two possible stories bywhich civil conflicts in a country might have important effects onbase country interest rates. First, if financial crises coinciding withdomestic civil conflicts (as with Indonesia in 1998) occur in relativelylarge and financially-integrated economies, they can endogenouslyaffect base country interest rates via two channels: first by a “flight toquality” in which international investors seek safer haven in invest-ments in the base country, thereby pushing down base country rates,and second through liquidity injections used by base country central
26 Notably, although our main results are not statistically significant with year fixedeffects, the ethnolinguistic fractionalization interaction results are qualitatively robustto their inclusion (Table 3, column 8).27 It is important to note that these results are unlikely to be driven by the correlationbetween exchange rate regime and ethnic diversity as the simple correlation coeffi-cient between these two variables is found to be less than 0.09.
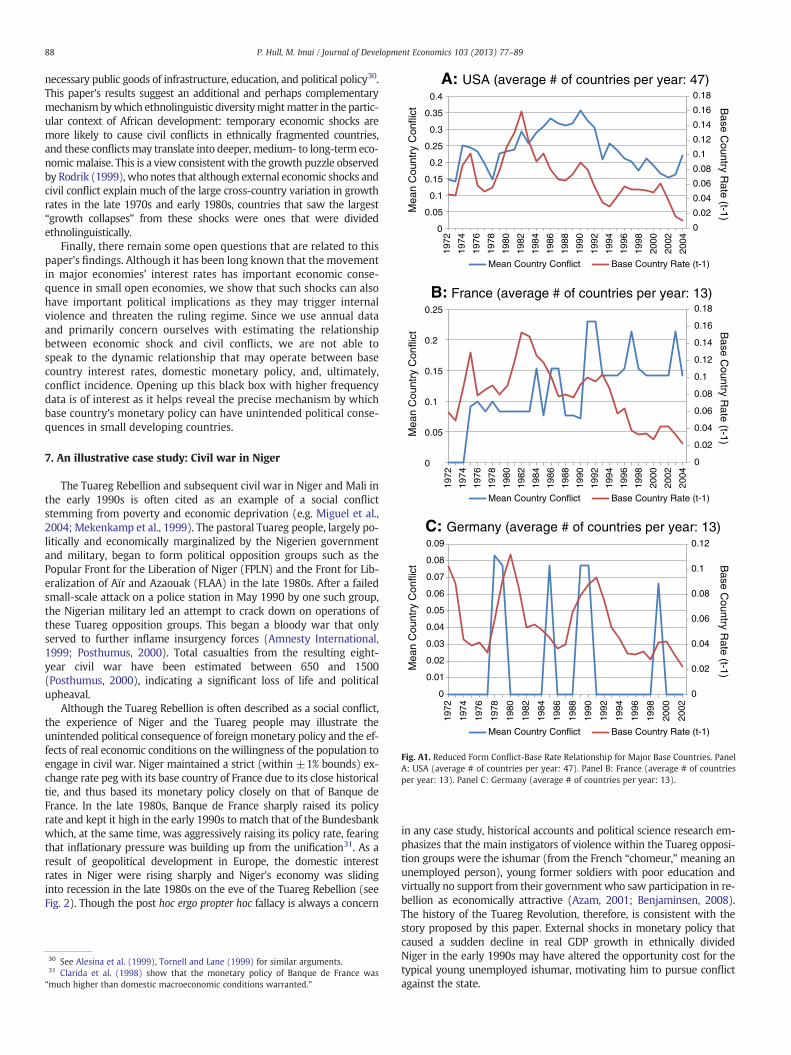
banks to avert their own financial crisis28. Additionally, we may expectdomestic political conditions to affect base country monetary policy ifthe local economy is large enough, even without a financial crisis. Weaddress these concerns by dropping country-year observations fromthe sample that might introduce these kinds of endogeneity. We iden-tify episodes of financial crises from 1971 to 2004 using data compiledby Laeven and Valencia (2008) and re-estimate our findings over datathat excludes identified country-year observations. We also follow diGiovanni and Shambaugh (2008) in identifying “large economies” –
that is, countries whose economic size (measured by real GDP) isreported as greater than 10% the size of their respective base. Weexamine whether our results are sensitive to the exclusion of theselarge economies with and without episodes of financial crisis.
The results of these sub-sample analyses are reported in Table 4.Dropping country-year observations that correspond to financialcrises (columns 1 and 2) produces nearly the same estimates29.Thus, although historically it may be the case that base country inter-est rates react to some of the large scale economic turmoil and crisisin small domestic countries, excluding these cases does not alterthis paper's main conclusions. Coefficient estimates based on a sam-ple of countries with economies no bigger than 10% of that of theirbase country are given in columns 3 and 4. Dropping large countriessimilarly leads to little change in the average effects of economicgrowth on conflict risk (column 3). However, dropping the set oflarge countries reduces the magnitude of interaction effects (column4), perhaps because the exclusion of these large countries leads to amore homogeneous sample in terms of ethnolinguistic diversity. Fi-nally, in the most restrictive sample that drops both country-year ob-servations corresponding to financial crises and large domesticeconomics, we find qualitatively the same estimates as in our mainresults (columns 5 and 6).
5.2. Alternative measure of civil conflicts
We also check the robustness of our results to the alternative mea-sures of internal conflicts. First, we examine the impact of economicshocks on civil conflict onset and duration separately, since the im-pact might not be symmetric; e.g., deteriorating economic conditionmight cause the population to arm themselves and spark civil con-flicts as predicted in various theoretical model (e.g., Grossman,1991), while, once mired in civil conflict, a improvement in economiccondition might not alter the political equilibrium (Collier, 2007). Forconflict onset, we construct a dependent variable, Onset, that equals 0for years of no conflict, 1 in the first year of conflict, and missing insubsequent years as long as conflict continues. Onset becomes zeroagain when civil conflict ends. Hence, the coefficient on GDP growthin the specification for civil conflict onset captures the effects of eco-nomic condition on the likelihood of countries to begin civil conflictbut does not incorporate the average effect of continuing conflict.For duration, we construct a dependent variable, Duration, that equals1 if conflict is ongoing, zero when it ends, and missing thereafter. Thecoefficient on GDP growth for civil conflict duration, hence, repre-sents the impact of economic growth on the likelihood that civil con-flict will continue given that it has started.
countries. A particularly dramatic example is given by the East Asian financial crisisof the late 1990s. From 1997 to 1998, as the crises spread from the proximate devalu-ation of the Thai baht to affect the financial systems of neighboring Asian countries(one of which, Indonesia, subsequently suffered from internal violence), the U.S. Fed-eral Reserve Board moved to cut its lending rate three times at regularly scheduledand emergency meetings (Eichengreen, 1999).29 Although not reported to conserve space, the first-stage coefficients on base coun-try rates and their interaction with the two trilemma variables are similarly found to bepractically the same as the full sample results.
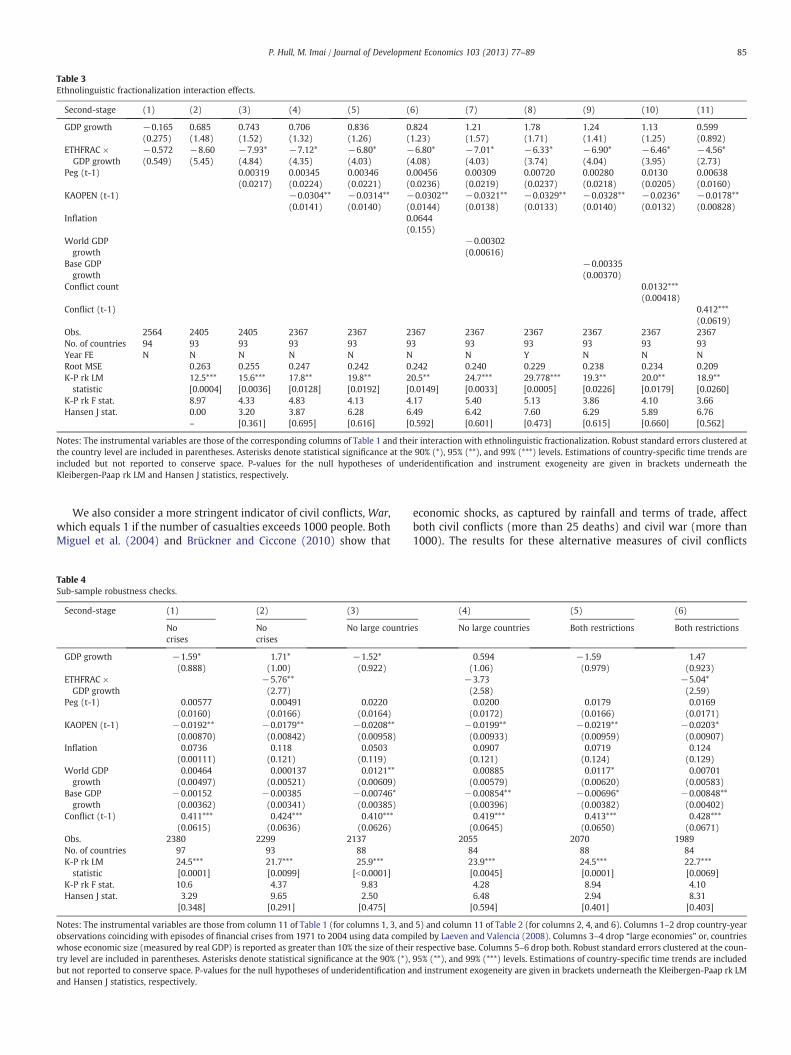
Table 3Ethnolinguistic fractionalization interaction effects.
Second-stage (1) (2) (3) (4) (5) (6) (7) (8) (9) (10) (11)
GDP growth −0.165 0.685 0.743 0.706 0.836 0.824 1.21 1.78 1.24 1.13 0.599(0.275) (1.48) (1.52) (1.32) (1.26) (1.23) (1.57) (1.71) (1.41) (1.25) (0.892)
ETHFRAC × −0.572 −8.60 −7.93* −7.12* −6.80* −6.80* −7.01* −6.33* −6.90* −6.46* −4.56*GDP growth (0.549) (5.45) (4.84) (4.35) (4.03) (4.08) (4.03) (3.74) (4.04) (3.95) (2.73)
Peg (t-1) 0.00319 0.00345 0.00346 0.00456 0.00309 0.00720 0.00280 0.0130 0.00638(0.0217) (0.0224) (0.0221) (0.0236) (0.0219) (0.0237) (0.0218) (0.0205) (0.0160)
KAOPEN (t-1) −0.0304** −0.0314** −0.0302** −0.0321** −0.0329** −0.0328** −0.0236* −0.0178**(0.0141) (0.0140) (0.0144) (0.0138) (0.0133) (0.0140) (0.0132) (0.00828)
Inflation 0.0644(0.155)
World GDPgrowth
−0.00302(0.00616)
Base GDP −0.00335growth (0.00370)
Conflict count 0.0132***(0.00418)
Conflict (t-1) 0.412***(0.0619)
Obs. 2564 2405 2405 2367 2367 2367 2367 2367 2367 2367 2367No. of countries 94 93 93 93 93 93 93 93 93 93 93Year FE N N N N N N N Y N N NRoot MSE 0.263 0.255 0.247 0.242 0.242 0.240 0.229 0.238 0.234 0.209K-P rk LM 12.5*** 15.6*** 17.8** 19.8** 20.5** 24.7*** 29.778*** 19.3** 20.0** 18.9**statistic [0.0004] [0.0036] [0.0128] [0.0192] [0.0149] [0.0033] [0.0005] [0.0226] [0.0179] [0.0260]
K-P rk F stat. 8.97 4.33 4.83 4.13 4.17 5.40 5.13 3.86 4.10 3.66Hansen J stat. 0.00 3.20 3.87 6.28 6.49 6.42 7.60 6.29 5.89 6.76
– [0.361] [0.695] [0.616] [0.592] [0.601] [0.473] [0.615] [0.660] [0.562]
Notes: The instrumental variables are those of the corresponding columns of Table 1 and their interaction with ethnolinguistic fractionalization. Robust standard errors clustered atthe country level are included in parentheses. Asterisks denote statistical significance at the 90% (*), 95% (**), and 99% (***) levels. Estimations of country-specific time trends areincluded but not reported to conserve space. P-values for the null hypotheses of underidentification and instrument exogeneity are given in brackets underneath theKleibergen-Paap rk LM and Hansen J statistics, respectively.
85P. Hull, M. Imai / Journal of Development Economics 103 (2013) 77–89
We also consider a more stringent indicator of civil conflicts, War,which equals 1 if the number of casualties exceeds 1000 people. BothMiguel et al. (2004) and Brückner and Ciccone (2010) show that
Table 4Sub-sample robustness checks.
Second-stage (1) (2) (3)
Nocrises
Nocrises
No large countri
GDP growth −1.59* 1.71* −1.52*(0.888) (1.00) (0.922)
ETHFRAC × −5.76**GDP growth (2.77)
Peg (t-1) 0.00577 0.00491 0.0220(0.0160) (0.0166) (0.0164)
KAOPEN (t-1) −0.0192** −0.0179** −0.0208**(0.00870) (0.00842) (0.00958)
Inflation 0.0736 0.118 0.0503(0.00111) (0.121) (0.119)
World GDP 0.00464 0.000137 0.0121**growth (0.00497) (0.00521) (0.00609)
Base GDP −0.00152 −0.00385 −0.00746*growth (0.00362) (0.00341) (0.00385)
Conflict (t-1) 0.411*** 0.424*** 0.410***(0.0615) (0.0636) (0.0626)
Obs. 2380 2299 2137No. of countries 97 93 88K-P rk LM 24.5*** 21.7*** 25.9***statistic [0.0001] [0.0099] [b0.0001]
K-P rk F stat. 10.6 4.37 9.83Hansen J stat. 3.29 9.65 2.50
[0.348] [0.291] [0.475]
Notes: The instrumental variables are those from column 11 of Table 1 (for columns 1, 3, andobservations coinciding with episodes of financial crises from 1971 to 2004 using data compwhose economic size (measured by real GDP) is reported as greater than 10% the size of theitry level are included in parentheses. Asterisks denote statistical significance at the 90% (*),but not reported to conserve space. P-values for the null hypotheses of underidentification aand Hansen J statistics, respectively.
economic shocks, as captured by rainfall and terms of trade, affectboth civil conflicts (more than 25 deaths) and civil war (more than1000). The results for these alternative measures of civil conflicts
(4) (5) (6)
es No large countries Both restrictions Both restrictions
0.594 −1.59 1.47(1.06) (0.979) (0.923)
−3.73 −5.04*(2.58) (2.59)0.0200 0.0179 0.0169(0.0172) (0.0166) (0.0171)
−0.0199** −0.0219** −0.0203*(0.00933) (0.00959) (0.00907)0.0907 0.0719 0.124(0.121) (0.124) (0.129)0.00885 0.0117* 0.00701(0.00579) (0.00620) (0.00583)
−0.00854** −0.00696* −0.00848**(0.00396) (0.00382) (0.00402)0.419*** 0.413*** 0.428***(0.0645) (0.0650) (0.0671)
2055 2070 198984 88 8423.9*** 24.5*** 22.7***[0.0045] [0.0001] [0.0069]4.28 8.94 4.106.48 2.94 8.31[0.594] [0.401] [0.403]
5) and column 11 of Table 2 (for columns 2, 4, and 6). Columns 1–2 drop country-yeariled by Laeven and Valencia (2008). Columns 3–4 drop “large economies” or, countriesr respective base. Columns 5–6 drop both. Robust standard errors clustered at the coun-95% (**), and 99% (***) levels. Estimations of country-specific time trends are includednd instrument exogeneity are given in brackets underneath the Kleibergen-Paap rk LM

Table 5Alternative measures of conflict.
Second-stage (1) (2) (3) (4) (5) (6)
Onset Onset Duration Duration War War
GDP growth −1.00 0.765 −2.26 −2.28 −0.532 0.129(0.716) (1.01) (2.19) (3.35) (0.534) (0.673)
ETHFRAC × −3.71 0.841 −1.13GDP growth (2.67) (5.64) (1.40)
Peg (t-1) 0.0262** 0.0265** −0.0691 −0.0629 0.0173*** 0.0173***(0.0124) (0.0121) (0.0628) (0.0700) (0.00606) (0.00623)
KAOPEN (t-1) −0.00987 −0.00860 −0.0535** −0.0535** −0.00758 −0.00765(0.00729) (0.00691) (0.0257) (0.0247) (0.00516) (0.00520)
Inflation 0.0282 0.0691 −0.0854 −0.0146 0.0504 0.0679(0.0838) (0.0907) (0.382) (0.323) (0.0581) (0.0548)
World GDP growth 0.00438 0.00132 −0.0188 −0.0194 −0.000179 −0.00129(0.00447) (0.00452) (0.0220) (0.0212) (0.00273) (0.00272)
Base GDP growth −0.00264 −0.00331 0.00167 0.00214 0.000490 0.000126(0.00323) (0.00341) (0.0119) (0.0113) (0.00228) (0.00237)
Conflict/war −0.190*** −0.186*** 0.400*** 0.397***(t-1) (0.0459) (0.0490) (0.0858) (0.0892)
Obs. 2103 2021 397 397 2449 2367No. of countries 94 90 34 34 97 93K-P rk LM 20.2*** 15.6* 7.20 11.3 26.7*** 22.8***statistic [0.0005] [0.0756] [0.126] [0.255] [b0.0001] [0.0066]K-P rk F stat. 9.12 2.72 2.70 2.04 11.9 4.51Hansen J stat. 2.29 4.29 7.19* 11.4 3.22 9.75
[0.515] [0.830] [0.0661] [0.182] [0.359] [0.283]
Notes: The instrumental variables are those from column 11 of Table 1 (for columns 1, 3, and 5) and column 11 of Table 2 (for columns 2, 4, and 6). Onset equals 0 if no conflict, 1 inthe first year of conflict, and missing thereafter. Duration equals 1 if there is conflict in both the current and previous year, zero for the first year conflict ends, and missing otherwise.War equals 1 if the number of casualties in conflict exceeds 1000 people. Robust standard errors clustered at the country level are included in parentheses. Asterisks denotestatistical significance at the 90% (*), 95% (**), and 99% (***) levels. Estimations of country-specific time trends are included but not reported to conserve space. P-values for thenull hypotheses of underidentification and instrument exogeneity are given in brackets underneath the Kleibergen-Paap rk LM and Hansen J statistics, respectively.
86 P. Hull, M. Imai / Journal of Development Economics 103 (2013) 77–89
are shown in Table 5. For both Onset and Duration, the sign of coeffi-cients are as expected (i.e., civil conflicts are more likely to erupt in aweak economy and they are less likely to end in a weak economy),but they are both insignificant and also not robust to alternative
Table A1Reduced form specifications.
1Reducedform
(1) (2) (3) (4) (5) (6)
Base R (t-1) 0.765** 0.959*** 0.879*** 0.906*** 0.885*** 0(0.331) (0.374) (0.341) (0.337) (0.342) (0
Base R×Peg −0.370 −0.313 −0.369 −0.412 −0(t-1) (0.445) (0.424) (0.401) (0.400) (0
Peg (t-1) 0.0340 0.0331 0.0351 0.0407 0(0.0384) (0.0379) (0.0374) (0.0379) (0
Base R ×KAOPEN
0.0631(0.235)
0.110(0.246)
0.122(0.249)
0(0
(t-1)KAOPEN −0.0425** −0.0416** −0.0386** −0
(t-1) (0.0172) (0.0170) (0.0171) (0BaseR×Peg ×KAOPEN
−0.122(0.187)
−0.135(0.188)
−0(0
(t-1)Inflation 0.191**
(0.0944)World GDP 0growth (0
Base GDPgrowth
Conflictcount
Conflict(t-1)
R2 0.0088 0.0095 0.0216 0.0220 0.0254 0Obs. 2449 2449 2449 2449 2449 2449No. ofcountries
97 97 97 97 97 97
Notes: Robust standard errors clustered at the country level are included in parentheses.Estimations of country-specific time trends are included but not reported to conserve spac
specifications, unlike the simple specification with conflict incidence.More specifically, for Onset, the coefficient on GDP growth is negativebut smaller than that of incidence and statistically insignificant with afull set of control variables. For Duration, the impact of GDP growth is
(7) (8) (9) (10) (11)
.964** 0.894** 0.714** 0.618*** 0.659** 0.499*
.410) (0.405) (0.331) (0.232) (0.288) (0.277)
.354 −0.371 −0.366 −0.211 −0.225 −0.228
.404) (0.398) (0.410) (0.298) (0.305) (0.313)
.0347 0.0351 0.0414 0.0246 0.0283 0.0328
.0375) (0.0374) (0.0376) (0.0292) (0.0296) (0.0301)
.109.246)
0.111(0.249)
0.148(0.246)
−0.0125(0.164)
0.00476(0.167)
0.0301(0.167)
.0417** −0.0417** −0.0345** −0.0173 −0.0155 −0.0106
.0170) (0.0170) (0.0168) (0.0113) (0.0114) (0.0113)
.118
.187)−0.123(0.188)
−0.174(0.189)
−0.108(0.138)
−0.118(0.137)
−0.156(0.139)
0.162** −0.140*(0.0740) (0.0731)
.00230 0.00503 0.00298
.00560) (0.00458) (0.00454)−0.000360 −0.00203 −0.00120(0.00359) (0.00311) (0.00311)
0.0121*** 0.00892***(0.00371) (0.00273)
0.427*** 0.426*** 0.422***(0.0586) (0.0585) (0.0589)
.0222 0.0221 0.0334 0.198 0.200 0.2062449 2449 2449 2449 2449
97 97 97 97 97
Asterisks denote statistical significance at the 90% (*), 95% (**), and 99% (***) levels.e.

Table A2Alternative socio-political interaction effects.
(1) (2) (3) (4) (5) (6)
GDP growth 0.952 −2.04 −1.60* −0.400 −1.89* −2.42*(1.09) (1.28) (0.865) (0.738) (1.03) (1.28)
ETHFRAC −4.68*× GDP growth (2.75)
RELFRAC 2.15× GDP growth (1.96)
POLITY, t-1 −0.134× GDP growth (0.0940)
Log(mountainous) −0.320× GDP growth (0.261)
Oil-exporting country 0.884× GDP growth (1.49)Primary exports/GNP 4.40× GDP growth (2.69)Peg (t-1) 0.00723 0.0107 0.0100 0.00734 0.0100 0.00794
(0.0167) (0.0161) (0.0160) (0.0168) (0.0160) (0.0166)KAOPEN (t-1) −0.0173** −0.0195** −0.0201** −0.0205** −0.0174** −0.0163*
(0.00864) (0.00896) (0.00962) (0.00904) (0.00836) (0.00881)Inflation 0.0872 0.0628 0.0341 0.0438 0.0233 0.0113
(0.114) (0.0988) (0.111) (0.111) (0.113) (0.124)World GDP growth 0.00151 0.00459 0.00839 0.00373 0.00453 0.00414
(0.00528) (0.00492) (0.00518) (0.00467) (0.00510) (0.00563)Base GDP growth −0.00367 −0.00238 −0.00298 −0.00296 −0.00110 −0.00171
(0.00355) (0.00366) (0.00413) (0.00350) (0.00433) (0.00437)Conflict (t-1) 0.416*** 0.415*** 0.416*** 0.415*** 0.409*** 0.420***
(0.0615) (0.0600) (0.0610) (0.0596) (0.0580) (0.0624)Obs. 2367 2367 2367 2367 2367 2241No. of countries 93 93 93 93 93 79K-P rk LM statistic 22.4*** 26.8*** 28.7*** 25.9*** 32.4*** 25.2***
[0.0077] [0.0015] [0.0007] [0.0021] [0.0002] [0.0028]K-P rk F stat. 4.32 4.65 7.10 5.19 7.25 3.50Hansen J stat. 6.91 4.67 4.66 8.41 6.96 3.18
[0.546] [0.792] [0.794] [0.395] [0.541] [0.923]
Notes: The instrumental variables are those of column 11, Table 1, and their interaction with the appropriate socio-political variable. Robust standard errors clustered at the countrylevel are included in parentheses. Asterisks denote statistical significance at the 90% (*), 95% (**), and 99% (***) levels. Estimations of country-specific time trends are included butnot reported to conserve space. P-values for the null hypotheses of underidentification and instrument exogeneity are given in brackets underneath the Kleibergen-Paap rk LM andHansen J statistics, respectively.
87P. Hull, M. Imai / Journal of Development Economics 103 (2013) 77–89
larger than with incidence, but its standard error is so large that wecould not reject the null of no effect. It should be noted that sincewe are looking only at the set of countries with ongoing civil conflict,the sample size is much smaller (397, from 2449), greatly reducingthe power of statistical test. Similarly, the results for civil war withover 1000 casualties show the expected sign (i.e., civil war tend tooccur in a week economy). However, the level of statistical signifi-cance is considerably lower, compared to the one achieved whenwe use civil conflicts with 25 or more casualties.
3
4
5
6
7
8
9
10
11
12
1985 1986 1987 1988 1989 1990 1991 1992
Mon
ey M
arke
t Rat
e (%
)
Monetary Policy and the Tuareg Rebellion
France Niger GermanyStart of Conflict
Fig. 2. Transmission of Monetary Policy to Niger, 1985–1992.
6. Conclusions
This paper develops a new identification methodology based ontime-series movement in the interest rates of influential economiesto reevaluate the potential economic causes of civil conflict while ad-dressing the core empirical problems of previous cross-country investi-gations. We find that base country interest rates and their interactionwith domestic measures of capital account openness and exchangerate regime significantly identify domestic output growth rates andthat the instrumented components of growth in turn significantlypredict civil conflict risk. This approach reveals that earlier findings re-garding the causal impact of output growth shocks on the likelihood ofcivil conflict in sub-Saharan Africa might extend across the world: weestimate that a negative exogenous growth shock of four percentagepoints increases the unconditional probability of internal conflict bythirty percent for the typical country in the global sample. Moreover,while it does not appear that most social and political institutionalcharacteristics affect this causal relationship, we find some evidenceto suggest that more culturally and ethnically diverse countries fallmore easily into conflict in the face of sudden economic hardship, atheory promoted by modernist political science literature.
Although our results apply globally, these interaction results areparticularly relevant for sub-Saharan African countries, most of whichare characterized by the highest levels of ethnic diversity. As Easterlyand Levine (1997) and others describe, the high degree of cultural frac-tionalization in Africa has grave consequences for the development ofpolitical and economic institutions and the public policy choices thatdetermine long-run economic growth. They propose that more polar-ized countries are made more susceptible to competitive rent-seekingacross different ethnic groups and are thus unlikely to develop the
A: USA (average # of countries per year: 47)
B: France (average # of countries per year: 13)
0
0.02
0.04
0.06
0.08
0.1
0.12
0.14
0.16
0.18
0
0.05
0.1
0.15
0.2
0.25
0.3
0.35
0.4
1972
1974
1976
1978
1980
1982
1984
1986
1988
1990
1992
1994
1996
1998
2000
2002
2004
Base C
ountry Rate (t-1)M
ean
Cou
ntry
Con
flict
Mean Country Conflict Base Country Rate (t-1)
Mean Country Conflict Base Country Rate (t-1)
Mean Country Conflict Base Country Rate (t-1)
0
0.02
0.04
0.06
0.08
0.1
0.12
0.14
0.16
0.18
0
0.05
0.1
0.15
0.2
0.25
1972
1974
1976
1978
1980
1982
1984
1986
1988
1990
1992
1994
1996
1998
2000
2002
2004
Base C
ountry Rate (t-1)M
ean
Cou
ntry
Con
flict
C: Germany (average # of countries per year: 13)
0
0.02
0.04
0.06
0.08
0.1
0.12
0
0.01
0.02
0.03
0.04
0.05
0.06
0.07
0.08
0.09
1972
1974
1976
1978
1980
1982
1984
1986
1988
1990
1992
1994
1996
1998
2000
2002
Base C
ountry Rate (t-1)M
ean
Cou
ntry
Con
flict
Fig. A1. Reduced Form Conflict-Base Rate Relationship for Major Base Countries. PanelA: USA (average # of countries per year: 47). Panel B: France (average # of countriesper year: 13). Panel C: Germany (average # of countries per year: 13).
88 P. Hull, M. Imai / Journal of Development Economics 103 (2013) 77–89
necessary public goods of infrastructure, education, and political policy30.This paper's results suggest an additional and perhaps complementarymechanismbywhich ethnolinguistic diversitymightmatter in the partic-ular context of African development: temporary economic shocks aremore likely to cause civil conflicts in ethnically fragmented countries,and these conflictsmay translate into deeper, medium- to long-term eco-nomicmalaise. This is a view consistent with the growth puzzle observedby Rodrik (1999), who notes that although external economic shocks andcivil conflict explain much of the large cross-country variation in growthrates in the late 1970s and early 1980s, countries that saw the largest“growth collapses” from these shocks were ones that were dividedethnolinguistically.
Finally, there remain some open questions that are related to thispaper's findings. Although it has been long known that the movementin major economies' interest rates has important economic conse-quence in small open economies, we show that such shocks can alsohave important political implications as they may trigger internalviolence and threaten the ruling regime. Since we use annual dataand primarily concern ourselves with estimating the relationshipbetween economic shock and civil conflicts, we are not able tospeak to the dynamic relationship that may operate between basecountry interest rates, domestic monetary policy, and, ultimately,conflict incidence. Opening up this black box with higher frequencydata is of interest as it helps reveal the precise mechanism by whichbase country's monetary policy can have unintended political conse-quences in small developing countries.
7. An illustrative case study: Civil war in Niger
The Tuareg Rebellion and subsequent civil war in Niger and Mali inthe early 1990s is often cited as an example of a social conflictstemming from poverty and economic deprivation (e.g. Miguel et al.,2004; Mekenkamp et al., 1999). The pastoral Tuareg people, largely po-litically and economically marginalized by the Nigerien governmentand military, began to form political opposition groups such as thePopular Front for the Liberation of Niger (FPLN) and the Front for Lib-eralization of Aïr and Azaouak (FLAA) in the late 1980s. After a failedsmall-scale attack on a police station in May 1990 by one such group,the Nigerian military led an attempt to crack down on operations ofthese Tuareg opposition groups. This began a bloody war that onlyserved to further inflame insurgency forces (Amnesty International,1999; Posthumus, 2000). Total casualties from the resulting eight-year civil war have been estimated between 650 and 1500(Posthumus, 2000), indicating a significant loss of life and politicalupheaval.
Although the Tuareg Rebellion is often described as a social conflict,the experience of Niger and the Tuareg people may illustrate theunintended political consequence of foreign monetary policy and the ef-fects of real economic conditions on the willingness of the population toengage in civil war. Niger maintained a strict (within ±1% bounds) ex-change rate peg with its base country of France due to its close historicaltie, and thus based its monetary policy closely on that of Banque deFrance. In the late 1980s, Banque de France sharply raised its policyrate and kept it high in the early 1990s to match that of the Bundesbankwhich, at the same time, was aggressively raising its policy rate, fearingthat inflationary pressure was building up from the unification31. As aresult of geopolitical development in Europe, the domestic interestrates in Niger were rising sharply and Niger's economy was slidinginto recession in the late 1980s on the eve of the Tuareg Rebellion (seeFig. 2). Though the post hoc ergo propter hoc fallacy is always a concern
30 See Alesina et al. (1999), Tornell and Lane (1999) for similar arguments.31 Clarida et al. (1998) show that the monetary policy of Banque de France was“much higher than domestic macroeconomic conditions warranted.”
in any case study, historical accounts and political science research em-phasizes that the main instigators of violence within the Tuareg opposi-tion groups were the ishumar (from the French “chomeur,”meaning anunemployed person), young former soldiers with poor education andvirtually no support from their government who saw participation in re-bellion as economically attractive (Azam, 2001; Benjaminsen, 2008).The history of the Tuareg Revolution, therefore, is consistent with thestory proposed by this paper. External shocks in monetary policy thatcaused a sudden decline in real GDP growth in ethnically dividedNiger in the early 1990s may have altered the opportunity cost for thetypical young unemployed ishumar, motivating him to pursue conflictagainst the state.
89P. Hull, M. Imai / Journal of Development Economics 103 (2013) 77–89
References
Abadie, A., Gardeazabal, J., 2003. The Economic Costs of Conflict: A Case Study of theBasque Country. American Economic Review 93 (1), 113–132.
Aizenman, J., Chinn, M., Ito, H., 2008. Assessing the emerging global financial architec-ture: measuring the trilemma's configurations over time. NBER Working Paper,14533.
Alesina, A., Baqir, R., Easterly, W., 1999. Public goods and ethnic divisions. QuarterlyJournal of Economics 114 (4), 1243–1284.
Alesina, A., Devleeschauwer, A., Easterly, W., Kurlat, S., Wacziarg, R., 2003. Fractionaliza-tion. Journal of Economic Growth 8 (2), 155–194.
Amnesty International, 1999. Niger: Impunity Enshrined in the Constitution. AmnestyInternational Index AFR 43/02/99.
Angrist, J., Krueger, A., 2001. Instrumental variables and the search for identification:from supply and demand to natural experiments. Journal of Economic Perspectives15 (4), 69–85.
Azam, J.P., 2001. The redistributive state and conflicts in Africa. Journal of PeaceResearch 38 (4), 429–444.
Bazzi, S., Blattman, C., 2011. “Economic Shocks and Conflict: The (Absence of?)Evidence from Commodity Prices”, Unpublished Manuscript.
Beber, B., Blattman, C., 2010. “The Industrial Organization of Rebellion: The Logic ofForced Recruitment and Child Soldiering”, Unpublished Manuscript.
Beck, T., Clarke, G., Groff, A., Keefer, P., Walsh, P., 2001. New tools in comparative polit-ical economy: the database of political institutions. World Bank Economic Review15 (1), 165–176.
Benjaminsen, T., 2008. Does supply-induced scarcity drive violent conflicts in theAfrican Sahel? The Case of the Tuareg Rebellion in Northern Mali. Journal ofPeace Research 45 (6), 819–836.
Benmelech, E., Berrebi, C., Klor, E., 2010. Economic Conditions and the Quality ofSuicide Terrorism. NBER Working Paper, 16320.
Besley, T., Persson, T., 2009. Wars and State Capacity. London School of EconomicsWorking Paper EOPP, 005.
Blattman, C., Miguel, E., 2010. Civil War. Journal of Economic Literature 48 (1), 3–57.Borensztein, E., Zettelmeyer, J., Philippon, T., 2001. Monetary Independence in Emerging
Markets: Does the Exchange Rate RegimeMake a Difference? IMFWorking Paper, 01/1.Brückner, M., Ciccone, A., 2010. International commodity prices, growth, and the out-
break of Civil War in Sub-Saharan Africa. The Economic Journal 120 (544),519–534.
Calvo, G., Reinhart, C., 2002. Fear of floating. Quarterly Journal of Economics 117 (2),379–408.
Chassang, S., Padró-i-Miquel, G., 2009. Economic shocks and civil war. Quarterly Journalof Political Science 4 (3), 211–228.
Chinn, M., Ito, H., 2008. A new measure of financial openness. Journal of ComparativePolicy Analysis 10 (3), 309–322.
Ciccone, A., 2011. Economic shocks and civil conflict: a comment. American EconomicJournal: Applied Economics 3, 215–227.
Clarida, R., Gali, J., Gertler, M., 1998. Monetary policy rules in practice: some interna-tional evidence. European Economic Review 42, 1033–1067.
Collier, P., 2007. The Bottom Billion: Why the Poorest Countries are Failing and Whatcan be Done About It. Oxford, New York.
Collier, P., Hoeffler, A., 2004. Greed and grievance in civil war. Oxford Economic Papers56 (4), 563–595.
Dal Bó, E., Dal Bó, P., 2011. Workers, warriors, and criminals: social conflict in generalequilibrium. Journal of the European Economic Association 9 (4), 646–677.
Di Giovanni, J., Shambaugh, J., 2008. The impact of foreign interest rates on the econo-my: the role of the exchange rate regime. Journal of International Economics 74,341–361.
Easterly, W., Levine, R., 1997. Africa's growth tragedy: policies and ethnic divisions.Quarterly Journal of Economics 112 (4), 1203–1250.
Edison, H., Klein, M., Ricci, L., Sløk, T., 2002. Capital Account Liberalization and EconomicPerformance: A Review of the Literature. IMF Working Paper, 02/120.
Eichengreen, B., 1999. Toward a New International Financial Architecture: A PracticalPost-Asia Agenda. Institute for International Economics, Washington D.C.
Eichengreen, B., 2002. Capital account liberalization: what do the cross country studiesshow us? World Bank Economic Review 15 (3), 341–366.
Eichengreen, B., Razo-Garcia, R., 2011. How Reliable are De Facto Exchange RateRegime Classifications? NBER Working Paper, No. 17318.
Fearon, J., 2007. Economic development, insurgency, and civil war. In: Helpman, E. (Ed.),Institutions and Economic Performance. Harvard University Press, Cambridge,pp. 292–328.
Fearon, J., Laitin, D., 2003. Ethnicity, insurgency, and civil war. American PoliticalScience Review 97 (1), 75–90.
Frankel, J., Schmukler, S., Servén, L., 2004. Global transmission of interest rates: mone-tary independence and currency regime. Journal of International Money andFinance 23 (5), 701–733.
Ghobarah, H., Huth, P., Russett, B., 2003. Civil wars kill and maim people – Long afterthe shooting stops. American Political Science Review 97 (2), 189–202.
Grossman, H., 1991. A general equilibrium model of insurrections. The AmericanEconomic Review 81 (4), 912–921.
Hausmann, R., Panizza, U., Stein, E., 2001. Why do countries float the way they float?Journal of Development Economics 66 (2), 387–414.
Henderson, J., Storeygard, A., Weil, D., 2009. Measuring Economic Growth from OuterSpace. NBER Working Paper, 15199.
Johnson, S., Larson, W., Papageorgiou, C., Subramanian, A., 2009. Is Newer Better? PennWorld Table Revisions and Their Impact on Growth Estimates. NBER WorkingPaper, 15455.
Kleibergen, F., Paap, R., 2006. Generalized reduced rank tests using the singular valuedecomposition. Journal of Econometrics 127, 97–126.
Krueger, A., Malečková, J., 2003. Education, poverty, and terrorism: is there a causalconnection? Journal of Economic Perspectives 17 (4), 119–144.
Laeven, L., Valencia, F., 2008. Systematic Banking Crises: A New Database. IMF WorkingPaper, 08/224.
Mekenkamp, M., et al., 1999. Searching for Peace in Africa: An Overview of Conflict Pre-vention and Management Activities. European Platform Conflict Prevention andTransformation, Utrecht, Neth.
Miguel, E., Satyanath, S., 2011. Re-examining economic shocks and civil conflict. AmericanEconomic Journal: Applied Economics 3 (4), 228–232.
Miguel, E., Satyanath, S., Sergenti, E., 2004. Economic shocks and civil conflict: an in-strumental variables approach. Journal of Political Economy 112 (4), 725–754.
Nunn, N., Qian, N., 2012. Aiding Conflict: The Impact of U.S. Food Aid on Civil War.Working Paper. (accessed at http://www.economics.harvard.edu/faculty/nunn/files/Nunn_Qian_Food_Aid.pdf).
Obstfeld, M., Rogoff, K., 1995. The Mirage of Fixed Exchange Rates. NBER WorkingPaper, 5191.
Posthumus, M., 2000. Niger: a Long History, a Brief Conflict, an Open Future, SearchingFor Peace in Africa. Available at http://www.conflictprevention.net/page.php?id=40&formid=7 &action=show&surveyid=37.
Quinn, D., Toyoda, A., 2008. Does capital account liberalization lead to economicgrowth? Review of Financial Studies 21 (3), 1403–1449.
Rodrik, D., 1999. Where did all the growth go? External shocks, social conflict, andgrowth collapses. Journal of Economic Growth 4 (4), 385–412.
Sachs, J., Warner, A., 1995. Natural Resource Abundance and Economic Growth. NBERWorking Paper, No. 5398.
Sandler, T., 2000. Economic analysis of conflict. Journal of Conflict Resolution 44 (6),723–729.
Shambaugh, J., 2004. The effects of fixed exchange rates on monetary policy. QuarterlyJournal of Economics 119 (1), 301–352.
Stock, J., Yogo, M., 2005. Testing for weak instruments in linear IV regression. In:Andrews, D., Stock, J. (Eds.), Identification and Inference for Econometric Models:Essays in Honor of Thomas Rothenberg. Cambridge University Press, Cambridge,pp. 80–108.
Tornell, A., Lane, P.R., 1999. The voracity effect. American Economic Review 89 (1),22–46.


![Marry Poppins Conflict Calendar - Brightstone Productions · 2020-01-31 · Marry Poppins Conflict Calendar Read ALL notes below before filling out conflict calendar. [ ] Check](https://img.dokumen.tips/doc/110x75/5ee39e3cad6a402d666d5cb2/marry-poppins-coniict-calendar-brightstone-productions-2020-01-31-marry-poppins.jpg)