Embed Size (px)
Citation preview

———————————————————————————————————————————————————
WWW.SIFTDESK.ORG 294 Vol-3 Issue-2
SIFT DESK
Received Date: 08th Aug 2019
Accepted Date: 05th Oct 2019
Published Date:20th Oct 2019
A. Prakasamb
aDepartment of Physics, Periyar University, Salem - 636 011, India.
bDepartment of Physics, Thiruvalluvar Government arts college, Rasipuram, Namakkal – 637
401, India
CITATION A. Prakasam, Investigation on Spectral properties of 3-Chloro-3'-Methoxystilbene for Anti-cancer Drugs Application: Using Density Functional Theory(2019) Journal of Computational Chemistry & Molecular Modeling 3(2) p: 294-312 ABSTRACT The ground state optimized structure and spectroscopic analysis of 3-chloro-3'-methoxystilbene
(3C3'MS) were studied experimentally by FT-IR techniques and computationally by the first
principle density functional theory (DFT) and Hartree-Fock (HF) method with 6-311++G (d, p)
level of theory. The computational vibrational frequencies have been assigned and they agreed
satisfactorily with experimental FT-IR and FT-Raman spectra. The computed maximum wave-
length of absorption of 3C3'MS are calculated in different solvents (Acetonitrile, Methanol and
Ethanol) by TD-DFT method. The experimental available 1H and 13C nuclear magnetic reso-
nance chemical shifts calculations have been calculated by using the Gauge independent atomic
orbital (GIAO) method and compared with the computational studies. The NBO atomic charges
analysis in conjunction with spectral data recognized the occurrence of intra-molecular interac-
tions such as hyperconjugative, mesomeric and steric effects in 3C3'MS. Electronic distribution
and Frontier molecular orbital energy values of 3C3'MS are discussed in terms of intra-
molecular interactions. Computed values of Mulliken charges, Quantum Chemical descriptors
and thermodynamic properties of 3C3'MS along with molecular electrostatic potential (MEP)
are reported. Moreover, the estimation of the molecule confirms the biological behavior.
Keywords: FT-IR, FT-Raman, NMR spectra, NBO, NLO and NPA analysis, Thermodynamic
properties, MEP analysis.
Copy rights: © This is an Open access article distributed under the terms of International License.
Investigation on Spectral properties of 3-Chloro-3'-Methoxystilbene for Anticancer Drugs Application: Using
Density Functional Theory
Journal of Computational Chemistry & Molecular Modeling (ISSN: 2473-6260)
DOI: 10.25177/JCCMM.3.2.RA.558 Research

——————————————————————————————————————————————————–
WWW.SIFTDESK.ORG 295 Vol-3 Issue-2
SIFT DESK
1. INTRODUCTION
Stilbene and its derivatives are one of the most thor-
oughly studied compounds from the standpoint of
mechanistic and preparative photochemistry [1-5].
The importance of the ring closure reaction channel
in cis and trans-stilbene was recognized early [6] and
most in recent time’s stilbene has become a prototype
for ultrafast studies of photoisomerization [7-10]. The
importance of stilbene photochemical analogous stud-
ies has been performed for only a limited range of
stilbene and its derivatives. Our final goal is to obtain
a clearer picture of the effect of different solvents and
substituents on photochemical processes for cis and
trans-stilbene derivatives. In these derivatives are im-
portant oligomeric compounds with a broad range of
biological action, including hormonal, hypocholster-
olemic, Sympathomimetic, antifungal, antiallergic,
Human hemoglobin, antibacterial, antimalarial, Hu-
man serum albumin and anticancer activity. 3-chloro-
3'-methoxystilbene are very important bioactive mol-
ecule [11-14]. The most famous stilbene derivatives,
which was used medically for prostate and breast can-
cer, and to prevent threatened abortions [15-18]. Sei-
go sanoh et al. reported the trans-stilbene is metaboli-
cally activated to estrogenic compounds by liver mi-
crosomal enzyme molecular system. The physical
requirement for estrogenic activity of different stil-
bene derivatives (Cis and Trans) including proestro-
gens [19]. Kyosuke Tsumura et al. reported DFT and
TD-DFT, together with the analytical calculation of
numerical and gradients calculation of the Hessian
matrix has been applied to calculate the FT-IR, FT-
Raman and fluorescence excitation spectrum of trans-
stilbene (tSB) in the lowest excited singlet (S1) state
[20]. The Excited-state reduction of cis-stilbene and
trans-stilbene is outlined with femtosecond computed
FT-Raman spectroscopy, using Sn→S1 resonance
conditions. For isomers, decay in FT-Raman shift,
intensity of spectral positions and mind broadening of
the bands specify IVR. In n-hexane this process ef-
fectively takes 0.5-0.7 ps [21]. Rajat K. Chaudhuri et
al. reported Molecular geometries are calculated for
the ground state and excited states of 4a,4b-
dihydrophenanthrene (DHP), cis-stilbene, and trans-
stilbene from calculations accomplished with the de-
veloped fundamental orbital, complete active space
configuration intermolecular interaction (IVO-
CASCI) method. The calculations indicate that a non-
planar conformer of tSB is the most stable between
the photoisomers [22].The photoisomerization dy-
namics of tSB have been well studied in the lowest
excited state, but much less is known about the per-
formance following excitation to higher excited
states. This contribution reports a combined study of
the spectroscopy and dynamics of two-photon availa-
ble states above S1. Two-photon absorption (2PA)
measurements using a broadband pump−probe tech-
nique reveal distinct bands near 5.1 and 6.4 eV are
reported by Amanda L. Houk et al [23].
Nowadays, Modern vibrational spectroscopy has be-
come a very popular analytical technique for solving
many chemical problems. This is especially true of
studies using Raman spectroscopy is a powerful tech-
nique, which gives information about the vibrations
modes of the atoms and molecular structure, specific
information on various chemical composition and
Fourier transform infrared spectroscopy (FT-IR) is as
an analytical method to identification of the function-
al groups, the degree of conjugation and interaction
with drugs. The problem of signal vibrations howev-
er, as well as understanding the relationship between
the observed vibration spectra and molecule structure,
and chemical reactivity can be difficult. Even identifi-
cation of important vibrational modes often generates
controversy [24]. Recently, computational technique
and DFT is an advance quantum chemical approach
that plays an important role in the understanding of
molecular system, vibrational spectrum and of the
various properties of biological activity [25-28]. In
particular for polyatomic molecules the quantum
chemical method lead to the calculation of the more
perfect molecular system and vibrational Spectrum
(Infrared and Raman spectroscopies) than the conven-
tional ab initio RHF and MP2 method [24] and the
three-parameter B3LYP density functional, which
includes Becke’s gradient exchange correction [29]
and the Lee-Yang-Parr correlation functional [30].
In previous work, we wish to report the experimental
and theoretical investigation of vibrational spectral
analysis and ground state geometric structure of this

———————————————————————————————————————————————————
WWW.SIFTDESK.ORG 296 Vol-3 Issue-2
SIFT DESK
bioactive 3-Chloro-3'-Methoxystilbene molecule and
their results have been discussed. Moreover, the cal-
culated vibrational wavenumber of potential energy
distribution (PED) was assigned and Molecular Elec-
trostatic Potential (MEP) map of title compound has
been reported. The HOMO-LUMO energy gap to
supports to pharmacological active property and Nat-
ural bond orbital (NBO) charge analysis has been per-
formed to investigate charge transfer interactions and
the hydrogen bonding within the molecule. The elec-
tronegativity, chemical hardness and softness values
were also considered by utilizing frontier molecular
orbital energy gaps of title compound.
2. MATERIALS & METHODS
2.1. Experimental Details
This chemical with a purity of 99% is purchased form
Alfa Aesar chemical suppliers (India) and were used
as received. FT-IR measurements were performed
using Mattson 1000 FT-IR spectrometer in the 4000
and 400 cm-1 region. The FT-Raman spectrum of
3C3'MS was recorded between the region 4000 and
50 cm-1 using a Bruker FRA 106/S FT-Raman instru-
ment using 1064 nm excitation from an Nd: YAG
laser. The detector used was a liquid nitrogen cooled
Ge detector. 1H NMR and 13C NMR spectrum was
recorded at 400 MHZ on BRUKER AV-III 400 MHZ
instruments.
2.2. Computational details
The theoretical calculations were performed using the
Gaussian 09 program package [31]. The optimized
geometries were obtained employing DFT and HF
[32, 33] functional in conjunction with 6-311++G (d,
p) basis set. Subsequently, the vibrational IR and Ra-
man spectra were calculated at harmonic approxima-
tion. All the calculated computed harmonic frequen-
cies were real, which confirm that the optimized
structures correspond to minimum energies. The in-
ternal coordinates of the molecule were converted to
the local symmetry coordinates. The distributions of
assignment of the computed wavenumbers have been
aided by means of MOLVIB-7.0 program [34, 35].
The Cartesian representation of the force constants
were transferred to a non-redundant set of symmetry
coordinates, internal coordinate system recommended
by Pulay et al. [36] is used for the assignment of vi-
brational modes. All the molecular structures are pic-
tured using software Gauss-view [37]. 1H and 13C
NMR isotropic shielding were calculated by GIAO
method using optimized parameters obtained from
DFT/6-311++G (d, p) method. The electronic proper-
ties such as oscillator strengths of electronic singlet-
singlet transitions, absorption wavelengths and calcu-
late energies were determined by TD-DFT method
and Hence, the HOMO and LUMO energies and
chemical hardness, softness, electrophilicity index
and electronegativity were assumed from electron
affinity and ionization potential have also been evalu-
ated in the present study.
3. Results and discussion
3.1 Molecular Geometry
The most optimized geometrical parameters such as,
bond lengths, bond angles and dihedral angles of title
compound calculated at initio DFT and HF methods
with 6-311++G(d,p) level of theory and optimized
structure of the host molecule along with numbering
scheme in Fig. 1. The calculated bond lengths be-
tween C12-C2, C5-Cl17 in DFT and HF methods are
found to be 1.3514, 1.3315 Å and 1.8309, 1.8117 Å
respectively. The bond angle between C5-C4-20 in
HF and DFT are 120.0677 and 119.6667o respectively
in Fig. 2b.The dihedral angle between C8-C3-C4-H20
in HF and DFT are 180.001o and 179.9987o respec-
tively. The Computed geometrical parameters can be
used to determine the other parameters of 3C3'MS.
The bond lengths, bond angles and dihedral angles
were referred from [38]. Fig.2. Graphical representa-
tion of correlation coefficient and linear relationships
of between the DFT and HF bond lengths, bond
lengths and dihedral angles were determined for 6-
311++G(d,p) basis set.
The optimized bond lengths of C-H in methyl ring in
calculated range from 1.0893, 1.0965, 1.0965 Å and
1.0762, 1.0823, 1.0823 Å for 3C3'MS. The C-H bond
angles are found 109.7164, 109.6621, 109.7152 and
109.6616, 109.5451, 109.7381 Å for 3C3'MS respec-
tively, from DFT and HF/6-311++G (d, p) methods,
which are in good agreement with calculated values
for C-H bond lengths and bond angles of methyl ring.

——————————————————————————————————————————————————–
WWW.SIFTDESK.ORG 297 Vol-3 Issue-2
SIFT DESK
Fig. 1 Optimized geometrical structure
Fig. 2 Bond lengths, bond angles and dihedral angles
differences between DFT and HF approaches
4.2 HOMO-LUMO energy gap
Frontier molecular orbitals (FMOs) play a major role
in the kinetic stability or molecular chemical reactivi-
ty and the interactions between atoms. They are
measured to be effective in determining the charac-
teristics of the molecule such as pharmaceutical and
biological activities. The organic molecule containing
conjugated π electrons characterized by a small HO-
MO-LUMO separation energy, which is the result of
a significant degree of Intramolecular change transfer
(ICT) from the end-capping electron donor groups to
the efficient electron acceptor groups through conju-
gated path [39]. The calculated HOMO-LUMO ener-
gy gap of the title molecule is -4.17 eV at the B3LYP
level, respectively. The Large energy gap is basically
a significance of the large stabilization of the LUMO
due to the strong electron−accepting ability of the
electron−acceptor group. The graphical diagram of
HOMO and LUMO orbitals and their respective posi-
tive and negative regions are shown in Fig. 3. Such a
plot suggests that in the HOMO → LUMO excitation
the benzene ring π electrons are transferred to chlo-
ride group. The chemical reactivity of organic mole-
cules such as chemical hardness and softness can be
calculated from HOMO and LUMO energy gap val-
ues. The atomic π-orbital’s point towards each other
and an increase in π-character points the fact that σ-
bonds are stronger as showed by natural bond analy-
sis. A highly delocalized LUMO indicates that the
electrons can more readily move around the mole-
cule from HOMO-LUMO and hence an improved
ICT [40] shown in Table 1. The HOMO electrons
are mostly localized on the methyl group attached to
the benzene ring while LUMO is mainly delocalized
on the benzene ring indicating the presence of favor-
able atomic center within 3C3'MS for possible nu-
cleophile attacks(hydrogen bond acceptor) revealing
its bioactivity. Both the HOMO and LUMO are
mainly localized around the two benzene rings
which show that they are π type orbitals. There are
lots of applications available for the use of HOMO
and LUMO energy gap as a computational calcula-
tion.
Fig. 3 Schematic view of the important Molecular Orbitals of TD-DFT/6-311++G (d, p) method.

———————————————————————————————————————————————————
WWW.SIFTDESK.ORG 298 Vol-3 Issue-2
SIFT DESK
Table 1. Molecular Properties end energy gap (eV)
between molecular orbitals involved in electronic
transitions of 3C3'MS.
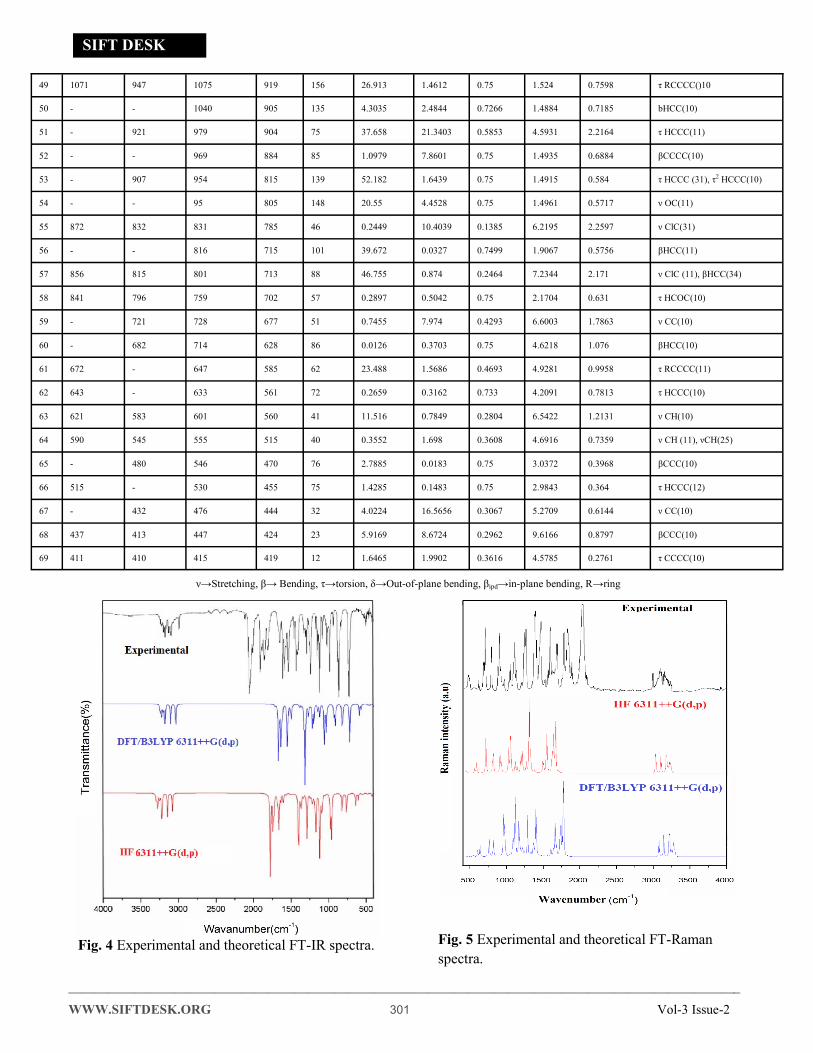
4.3 Vibrational analysis
The vibrational spectral analysis is to end vibrational
frequencies connected with specific molecular struc-
tures of calculated title molecule. The normal vibra-
tions are distributed as 56A'+31A'' considering Cs
symmetry. All the 87 normal modes of vibrations are
active in both IR and Raman. Vibrational wave-
number was calculated using the DFT and HF meth-
ods with the single split valence basis set 6-311++G
(d, p). Table 3 the vibrational assignments in the pre-
sent study are based on the scaled wavenumbers DFT
and HF/6-311++G (d, p) vibrational frequencies, Re-
duced Mass, Raman activity, IR intensities, Depolari-
zation Ratio, Force Constants and fundamental
modes descriptions (characterized by PED) of the
title compound. The comparison between the ob-
served frequencies and the computational FT-IR and
Raman spectra support each other. Including of elec-
tron correlation in computational theory to a certain
extend makes the frequency values smaller in com-
parison with the HF frequency data. All frequency
modes are active both in IR and Raman Spectra. For
this purpose, the full set of 87 normal internal coordi-
nates and description of vibrational assignments of
fundamental modes can be given by means of normal
coordinates have been reported in Table 2. The calcu-
lated and experimental of FT-IR [41], FT-Raman
spectra are shown in Figs. 4 and 5.
Table 2 Definition of internal coordinates of 3C3'MS.
Global Activity DFT Acetonitrile Ethanol
HOMO (eV) 5.77 5.93 5.97
LUMO (eV) 1.6 1.74 1.51
Energy gap(eV) 4.17 4.19 4.46
Hardness (ƞ) 2.08 2.09 2.23
softness (S) 0.240 0.239 0.224
Ionization po-tential (µ)
-3.68 -3.83 -3.74
Electronegativi-ty (χ)
3.68 3.83 3.74
Electrophilicity index (ω)
3.233 3.509 3.136
No (i)
Symbol
Type
Definition
Stretching
1-15
irC-C C1-C2, C2-C3, C3-C4, C4-C5, C5-C6,
C6-C7, C7-C8, C8-C3, C1-C9, C9-C10, C10-C11, C11-C12, C13-C14, C14-C9
16-25
iRC-H (Ring)
C1-H18, C2-H19, C4-H20, C6-H21, C7-H22, C8-H23, C10-H24, C12-H25, C13-H26, C14-H27
26-28
iRC-H(me-thyl)
C16-H28, C16-H29, C16-H30
29
iP
C-CI C5-CI17
30-31
iQC-O C11-O15,C16-O15
Bending
32-43
ia
C-C(Ring)
C3-C4-C5, C4-C5-C6, C6-C7-C8, C7-C8-C3, C8-C3-C4, C9-C10-C11, C10-C11-C12, C11-C12-C13, C12-C13-C14, C13-C14-C9, C14-C9-C10
44-46
ibC-C-C C9-C1-C2, C1-C2-C3, C2-C3-C4
47-48
ibC-C-C CI17-C5-C4, CI17-C5-C6
49-51
ibH-C-H H28-C16-H29, H29-C16-H30, H30-
C16-H29
52-54
ibO-C-H methyl
O15-C16-H28, O15-C16-H29, O15-C16-H30
55-65
ijC-C-H C3-C4-H20, C5-C6-H21, C6-C7-H22,
C7-C8-H23, C2-C3-H19, C2-C1-H18, C9-C14-H27, C13-C14-H26, C13-C12-H25, C11-C10-H24, C9-C1-H18
66
ibC-O-C C11-O15-C16
67-68
ibC-C-O C12-C11-O15, C10-C11-O15
Out-of-plane bending
69-76 ωi
C-H(Ring)
H20-C4-C5-C6, H21-C5-C6-C7, H22-C6-C7-C8, H23-C7-C8-C3, H24-C9-C10-C11, H25-C11-C12-C13, H26-C12-C13-C14, H27-C9-C14-C13
77 ωi C-O C12-C11-O15-C16
Torsion
78-81 τi τ C-C Ring
C3-C4-C5-C6, C4-C5-C6-C7, C5-C6-C7-C8, C6-C7-C8-C3
82-84 τi τ C-CH3
(C12)C11-C15-C16-H28, (C12)C11-C115-C16-H, (C12)C11-C15-C16-H30
85 τi τ CI-C CI-C4-C5-C6
86-87 τi τ C-H H20-C4-C5-CI17, H21-C6-C5-CI17

——————————————————————————————————————————————————–
WWW.SIFTDESK.ORG 299 Vol-3 Issue-2
SIFT DESK
Table 3. Experimental Theoretical harmonic frequencies (cm-1) of the 3C3'MS molecule along with the assignments of vibra-tional modes basing on PED results.
S.no
Experimental Wavenumber (cm-1)
Scaled
Wavenumber (cm-1) IR In-tensty (Ai)
Ra-man active (Ii)
Depo-larisation Ratio
Re-duced Mass (µ)
Force Con-stants (K)
Assignments with PED (%)
FT-IR FT-Raman DFT HF dIR-Ra
- - 3295 3247 48 3.8458 172.844 0.7472 1.092 6.8043 νCH(99)
1 3182 3179 3290 3241 49 14.805 158.127 0.75 1.0924 6.7681 βipd CH3(98)
2 3153 3278 3228 50 1.395 106.788 0.75 1.0906 6.7088 βipd CCC(391)
3 3089 3160 3276 3226 50 16.675 12.2342 0.2055 1.092 6.6998 δCH3(91)
4 3060 3053 3275 3225 51 9.6079 71.0921 0.1788 1.0924 6.6952 τRCCCC(90)
5 - 3011 3270 3221 49 7.7395 24.6103 0.3838 1.0906 6.6696 νCH(32), ν1CH(89)
6 3015 - 3252 3205 47 8.9023 73.4806 0.3243 1.0872 6.5837 τCOCC(87)
7 3001 2996 3245 3199 46 9.094 71.0542 0.4637 1.0873 6.5567 βipd CH3(86)
8 - 2989 3222 3181 41 22.978 150.064 0.4767 1.0987 6.5505 νCH(86)
9 - 3215 3176 39 38.311 2.7141 0.4785 1.0855 6.4538 νCH(86)
10 - - 3214 3166 48 1.6292 39.3106 0.4782 1.0904 6.4432 ν OC(81)
11 2995 2816 3142 3103 39 44.149 70.5652 0.5042 1.1045 6.2681 νCH(70)
12 2985 2791 3078 3032 46 56.836 163.546 0.2039 1.0334 5.6011 νCH(71)
13 2883 2650 2824 2710 114 5.0391 3601.83 0.3949 5.0901 8.7782 νCH(69)
14 2690 2612 2773 2754 19 124.41 560.612 0.75 6.0364 9.8682 νCH(45), νCH(59)
15 - - 1763 1665 98 21.466 2728.8 0.0358 5.7656 9.2794 ν CH(59)
16 - 1937 1737 1652 85 100.03 607.442 0.327 4.8112 7.5584 ν CH(68), νCH(59)
17 - - 1722 1632 90 36.787 21.835 0.3694 5.2171 8.0186 τRCCCC(45)
18 - 1823 1678 1615 63 47.271 76.3514 0.3699 2.1221 3.0029 τCCCC(11),τ2CCCC(45)
19 - - 1669 1549 120 60.334 13.9519 0.3559 1.0992 1.5445 τac CC(43)
20 1735 - 1660 1544 116 14.089 242.346 0.3882 2.174 3.032 βipd CCC(43)
21 1712 1692 1652 1538 114 8.9211 39.0981 0.3059 1.0541 1.4578 τHCCC(10), τ2 HCCC(43)
22 1683 - 1634 1532 102 8.9246 27.6593 0.7207 1.7797 2.3705 ν CH(40)

———————————————————————————————————————————————————
WWW.SIFTDESK.ORG 300 Vol-3 Issue-2
SIFT DESK
23 1640 1623 1600 1503 97 32.644 43.8815 0.3352 1.5431 2.0263 τ HCCC(40), τ2 HCCC(13)
24 1610 1584 1564 1492 72 2.2286 213.605 0.75 2.7353 3.4868 βipd CCC(37), βipd CCC(14)
25 1578 1572 1508 1470 38 0.2645 241.023 0.4639 2.0129 2.3229 ν CC(33)
26 - - 1499 1399 100 1.22 403.196 0.4473 1.7307 1.993 δHCC(33)
27 - 1480 1398 82 8.1576 41.2814 0.3305 1.9628 2.2066 ν CC(32)
28 - - 1471 1381 90 0.3392 7.748 0.3303 1.6129 1.7843 ν CH(31), ν2CH(19)
29 1381 1362 1398 1370 28 4.2141 28.9577 0.2924 2.1216 2.299 τ HCCC(29), τ 2 HCCC(15)
30 1342 1321 1366 1356 10 39.397 20.6353 0.5409 3.7464 3.86 δCOC(29)
31 - - 1358 1322 36 163.97 202.851 0.6478 2.099 2.1097 δCICC(22) ,δCICC(28)
32 1318 1300 1334 1306 28 27.417 607.619 0.376 2.4642 2.3205 ν CC(23) , ν2 CC(34)
33 1294 1285 1327 1264 63 2.1191 73.976 0.304 1.2226 1.105 ν CC(23)
34 1281 1266 1287 1238 49 1.2604 160.336 0.2754 1.1321 1.0117 ν CC(22)
34 1249 1252 1283 1231 52 48.352 323.027 0.3022 1.4881 1.2868 βHCC(18)
35 - 1235 1242 1211 31 46.428 229.473 0.4451 1.5723 1.3158 τ R2CCCC(18)
36 - - 1231 1191 40 0.2944 9.3401 0.3076 1.2546 1.0026 τ RCCCC(39) , τ2R CCCC(19)
37 - 1201 1213 1164 49 9.8272 1.7765 0.3179 1.6512 1.2671 δOCCC(13)
38 1215 1213 1203 1141 62 6.8866 1.659 0.3497 1.7233 1.3141 ν CH(11) , ν2CH(13)
39 1207 1194 1198 1137 57 26.837 7.6438 0.75 2.2871 1.6696 δHCC(23) , δHCC(13)
40 - 1187 1183 1113 70 104.3 12.22 0.6135 4.369 2.8532 βHCH(23)
41 - - 1173 1052 121 12.328 0.0492 0.353 5.9102 3.679 βipd CCC(13)
42 1172 - 1162 1027 135 1.9548 357.685 0.2176 5.7932 3.6002 τ RCCCC(22)
43 1132 1132 1123 1027 96 46.244 0.0466 0.2813 1.1466 0.709 τ HCCC(13)
44 1125 1113 1114 1008 106 4.0565 1.8511 0.75 1.3153 0.7888 βCCC(12)
45 1119 1105 1112 996 116 1.4003 0.6293 0.7498 1.3103 0.767 τ HCCC(12)
46 1089 998 1091 954 137 0.642 35.3366 0.75 1.9774 1.0614 τ RCCCC(12)
47 1081 963 1087 932 155 1.3584 0.5733 0.7497 1.3851 0.7093 βCCC(12)
48 1074 - 1083 931 152 4.8048 23.4977 0.5021 4.3495 2.2216 τ HCCC(10)
——————————————————————————————————————————————————–
WWW.SIFTDESK.ORG 301 Vol-3 Issue-2
SIFT DESK
49 1071 947 1075 919 156 26.913 1.4612 0.75 1.524 0.7598 τ RCCCC()10
50 - - 1040 905 135 4.3035 2.4844 0.7266 1.4884 0.7185 bHCC(10)
51 - 921 979 904 75 37.658 21.3403 0.5853 4.5931 2.2164 τ HCCC(11)
52 - - 969 884 85 1.0979 7.8601 0.75 1.4935 0.6884 βCCCC(10)
53 - 907 954 815 139 52.182 1.6439 0.75 1.4915 0.584 τ HCCC (31), τ2 HCCC(10)
54 - - 95 805 148 20.55 4.4528 0.75 1.4961 0.5717 ν OC(11)
55 872 832 831 785 46 0.2449 10.4039 0.1385 6.2195 2.2597 ν ClC(31)
56 - - 816 715 101 39.672 0.0327 0.7499 1.9067 0.5756 βHCC(11)
57 856 815 801 713 88 46.755 0.874 0.2464 7.2344 2.171 ν ClC (11), βHCC(34)
58 841 796 759 702 57 0.2897 0.5042 0.75 2.1704 0.631 τ HCOC(10)
59 - 721 728 677 51 0.7455 7.974 0.4293 6.6003 1.7863 ν CC(10)
60 - 682 714 628 86 0.0126 0.3703 0.75 4.6218 1.076 βHCC(10)
61 672 - 647 585 62 23.488 1.5686 0.4693 4.9281 0.9958 τ RCCCC(11)
62 643 - 633 561 72 0.2659 0.3162 0.733 4.2091 0.7813 τ HCCC(10)
63 621 583 601 560 41 11.516 0.7849 0.2804 6.5422 1.2131 ν CH(10)
64 590 545 555 515 40 0.3552 1.698 0.3608 4.6916 0.7359 ν CH (11), νCH(25)
65 - 480 546 470 76 2.7885 0.0183 0.75 3.0372 0.3968 βCCC(10)
66 515 - 530 455 75 1.4285 0.1483 0.75 2.9843 0.364 τ HCCC(12)
67 - 432 476 444 32 4.0224 16.5656 0.3067 5.2709 0.6144 ν CC(10)
68 437 413 447 424 23 5.9169 8.6724 0.2962 9.6166 0.8797 βCCC(10)
69 411 410 415 419 12 1.6465 1.9902 0.3616 4.5785 0.2761 τ CCCC(10)
ν→Stretching, β→ Bending, τ→torsion, δ→Out-of-plane bending, βipd→in-plane bending, R→ring
Fig. 4 Experimental and theoretical FT-IR spectra. Fig. 5 Experimental and theoretical FT-Raman
spectra.

———————————————————————————————————————————————————
WWW.SIFTDESK.ORG 302 Vol-3 Issue-2
SIFT DESK
4.3.1 Carbon-Hydrogen Vibrations
The C-H stretching is considered as characteristic
Wavenumbers. Such differences are usually observed
for C-H vibrations. The aromatic ring shows the oc-
currence of C-H stretching vibration modes in the
range 3100-3000 cm-1 region [42, 43], which is the
normal region for ready identification of C-H stretch-
ing vibrations. The title compounds observed C-H
stretching vibration modes are assigned
3082,3053,3011,2984 cm-1 in FT-IR and 3079, 3060,
2983 cm-1in FT-Raman spectra. The Calculated
scaled DFT/6311++G (d, p) and HF Values are
3103,3032,2710,2773 cm-1 and 3142,3078,2824,2754
cm-1 have been assigned to C-H stretching vibrations
respectively.
4.3.2 Methyl group Vibrations
The Methyl group vibration modes for the assign-
ments of CH3 group frequencies, fundamentally nine
normal vibration modes can be associated to each
Methyl group [44] namely, CH3 ss– symmetric
stretch, CH3 ips– in-plane stretch , CH3 ops – out-of-
plane stretch, CH3 ipb – in-plane bending , CH3 opb-
out-of-plane bending , CH3 ops – out-of-plane
stretch,CH3 ipr – in-plane rocking , CH3 opr-out-of-
plane rocking; CH3 ipb – in-plane bending, CH3 out-
of-plane bending modes, CH3 sb–symmetric bending,
tCH3-twisting modes of CH3 group vibrations would
be predictable to be depolarized for A'' symmetry
species. The methyl C-H vibrations appear lower fre-
quencies then aromatic C-H stretching vibrations.
The calculated Scaled DFT and HF of in-of-plane
bending and out-of-plane bending modes of CH3 val-
ues are 3290,3276,3245 cm-1 and 3241,3226,3199 cm-1. The observed CH3 opb and ipb assigned
3182,3089,3001 cm-1 in FT-IR and 3179,3160,2996
cm-1 FT-Raman spectra. The CH3 group vibrations
computed DFT and HF/6311++G (d, p) methods also
show good agreement with recorded spectral data.
4.3.3 Chlorine -Carbon Vibrations
The characteristic Cl-C stretching mode has been
assigned in the region 800-600 cm-1 [45]. The vibra-
tions belonging to the bond between the benzene ring
and halogen atoms were worth the discussion here,
since mixing of several vibrations are possible due to
the lowering of the molecular symmetry, and the oc-
currence of heavy atoms on the periphery of mole-
cule [46]. The present calculations place the Cl-C
group stretching modes at 872,856 cm-1 in FT-Raman
and at 832,815 cm-1 in experimental FT-Raman spec-
trum of the molecule. The computational frequencies
were identified in DFT at 831,801 cm-1 and 785, 713
cm-1 (HF) are assigned to Cl-C stretching vibration
show good agreement with the earlier literature [47].
4.4 Nonlinear optical properties
Nonlinear optics properties 3C3'MS were calculated
using the density functional theoretical method. Non-
linear optical properties deal with the interaction of
applied electric fields with different materials. The
effect is established as generation of new electric
fields that differ in phase, altered in frequency, am-
plitude or other physical properties [48]. The theoret-
ical calculations have been shown to be useful in the
description of the structure–property relationship be-
tween the polarizability and hyperpolarizabilities
characterize the response of a molecular system in an
applied electric field [49]. The theoretical methodolo-
gy allows the determination of NLO properties as an
inexpensive way to design molecules by studying
their potential before synthesis and to determine the
electronic structure and vibrational contributions to
the high order hyperpolarizability of the molecular
structure. Theoretical study plays an important role in
understanding the molecular property relationship
which is able to assistance in designing novel NLO
materials. Theoretically, calculated values of polar-
izability (α) and hyperpolarizability (β) are shown in
Table (4a) and (4b). The highest values of first hy-
perpolarizability (βtot) (2.705X10⁻²⁴) is obtained in the
method of HF/6-311++G (d, p) level using GAUSSI-
AN 09W package. It is interesting to note that the
first hyperpolarizability of the title compound is
twenty times that of the standard NLO material urea
(0.13 ×10⁻³⁰ esu) [50].
——————————————————————————————————————————————————–
WWW.SIFTDESK.ORG 303 Vol-3 Issue-2
SIFT DESK
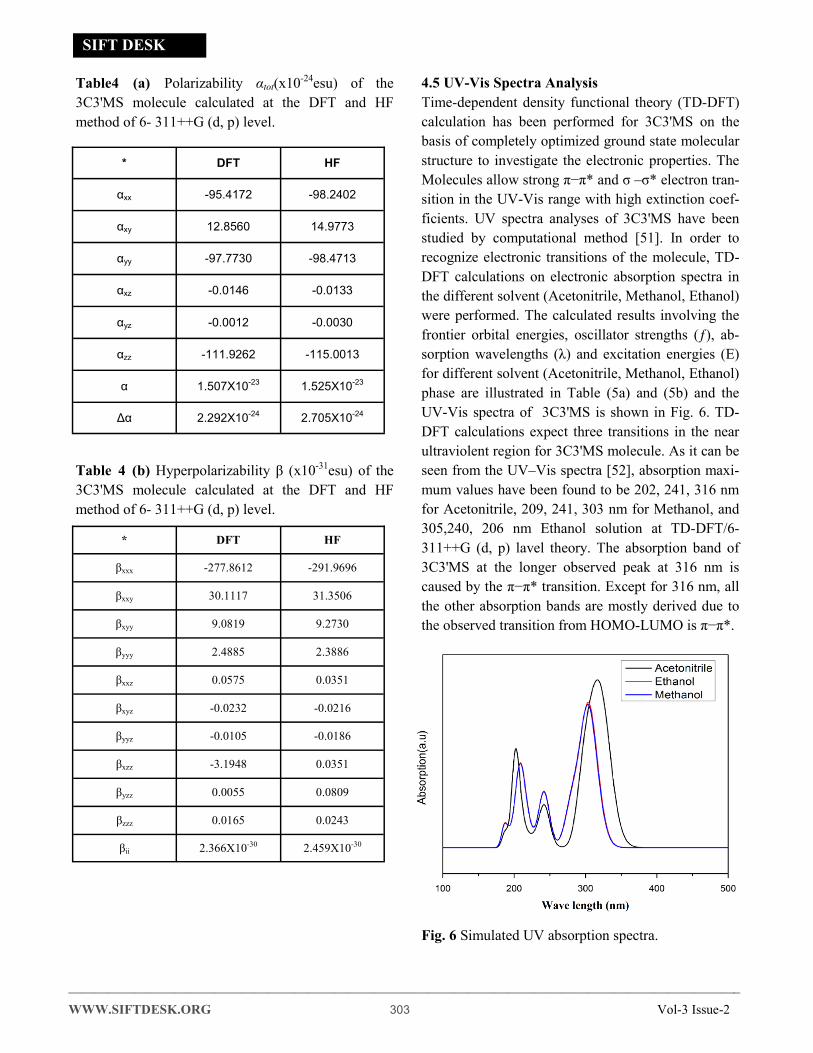
Table4 (a) Polarizability αtot(x10-24esu) of the
3C3'MS molecule calculated at the DFT and HF
method of 6- 311++G (d, p) level.
Table 4 (b) Hyperpolarizability β (x10-31esu) of the
3C3'MS molecule calculated at the DFT and HF
method of 6- 311++G (d, p) level.
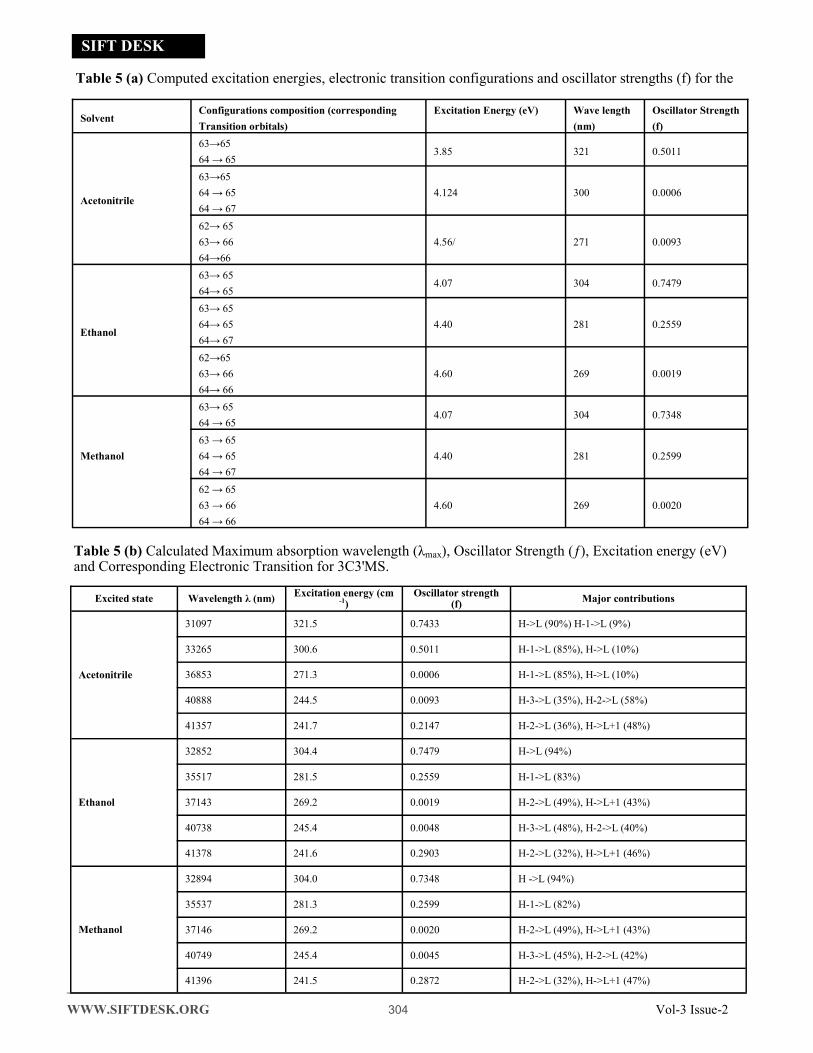
4.5 UV-Vis Spectra Analysis
Time-dependent density functional theory (TD-DFT)
calculation has been performed for 3C3'MS on the
basis of completely optimized ground state molecular
structure to investigate the electronic properties. The
Molecules allow strong π−π* and σ –σ* electron tran-
sition in the UV-Vis range with high extinction coef-
ficients. UV spectra analyses of 3C3'MS have been
studied by computational method [51]. In order to
recognize electronic transitions of the molecule, TD-
DFT calculations on electronic absorption spectra in
the different solvent (Acetonitrile, Methanol, Ethanol)
were performed. The calculated results involving the
frontier orbital energies, oscillator strengths (ƒ), ab-
sorption wavelengths (λ) and excitation energies (E)
for different solvent (Acetonitrile, Methanol, Ethanol)
phase are illustrated in Table (5a) and (5b) and the
UV-Vis spectra of 3C3'MS is shown in Fig. 6. TD-
DFT calculations expect three transitions in the near
ultraviolent region for 3C3'MS molecule. As it can be
seen from the UV–Vis spectra [52], absorption maxi-
mum values have been found to be 202, 241, 316 nm
for Acetonitrile, 209, 241, 303 nm for Methanol, and
305,240, 206 nm Ethanol solution at TD-DFT/6-
311++G (d, p) lavel theory. The absorption band of
3C3'MS at the longer observed peak at 316 nm is
caused by the π−π* transition. Except for 316 nm, all
the other absorption bands are mostly derived due to
the observed transition from HOMO-LUMO is π−π*.
Fig. 6 Simulated UV absorption spectra.
* DFT HF
αxx -95.4172 -98.2402
αxy 12.8560 14.9773
αyy -97.7730 -98.4713
αxz -0.0146 -0.0133
αyz -0.0012 -0.0030
αzz -111.9262 -115.0013
α 1.507X10⁻²³ 1.525X10⁻²³
Δα 2.292X10⁻²⁴ 2.705X10⁻²⁴
* DFT HF
βxxx -277.8612 -291.9696
βxxy 30.1117 31.3506
βxyy 9.0819 9.2730
βyyy 2.4885 2.3886
βxxz 0.0575 0.0351
βxyz -0.0232 -0.0216
βyyz -0.0105 -0.0186
βxzz -3.1948 0.0351
βyzz 0.0055 0.0809
βzzz 0.0165 0.0243
βii 2.366X10⁻³⁰ 2.459X10⁻³⁰
———————————————————————————————————————————————————
WWW.SIFTDESK.ORG 304 Vol-3 Issue-2
SIFT DESK
Table 5 (a) Computed excitation energies, electronic transition configurations and oscillator strengths (f) for the
Solvent Configurations composition (corresponding
Transition orbitals)
Excitation Energy (eV)
Wave length
(nm)
Oscillator Strength
(f)
Acetonitrile
63→65
64 → 65 3.85 321 0.5011
63→65
64 → 65
64 → 67
4.124 300 0.0006
62→ 65
63→ 66
64→66
4.56/ 271 0.0093
Ethanol
63→ 65
64→ 65 4.07 304 0.7479
63→ 65
64→ 65
64→ 67
4.40 281 0.2559
62→65
63→ 66
64→ 66
4.60 269 0.0019
Methanol
63→ 65
64 → 65 4.07 304 0.7348
63 → 65
64 → 65
64 → 67
4.40 281 0.2599
62 → 65
63 → 66
64 → 66
4.60 269 0.0020
Table 5 (b) Calculated Maximum absorption wavelength (λmax), Oscillator Strength (ƒ), Excitation energy (eV) and Corresponding Electronic Transition for 3C3'MS.
Excited state Wavelength λ (nm) Excitation energy (cm
-1) Oscillator strength
(f) Major contributions
Acetonitrile
31097 321.5 0.7433 H->L (90%) H-1->L (9%)
33265 300.6 0.5011 H-1->L (85%), H->L (10%)
36853 271.3 0.0006 H-1->L (85%), H->L (10%)
40888 244.5 0.0093 H-3->L (35%), H-2->L (58%)
41357 241.7 0.2147 H-2->L (36%), H->L+1 (48%)
Ethanol
32852 304.4 0.7479 H->L (94%)
35517 281.5 0.2559 H-1->L (83%)
37143 269.2 0.0019 H-2->L (49%), H->L+1 (43%)
40738 245.4 0.0048 H-3->L (48%), H-2->L (40%)
41378 241.6 0.2903 H-2->L (32%), H->L+1 (46%)
Methanol
32894 304.0 0.7348 H ->L (94%)
35537 281.3 0.2599 H-1->L (82%)
37146 269.2 0.0020 H-2->L (49%), H->L+1 (43%)
40749 245.4 0.0045 H-3->L (45%), H-2->L (42%)
41396 241.5 0.2872 H-2->L (32%), H->L+1 (47%)

——————————————————————————————————————————————————–
WWW.SIFTDESK.ORG 305 Vol-3 Issue-2
SIFT DESK
4.6 Molecular Electrostatic Potential
The MEP are useful 3D plots that can be used to vis-
ualize atomic charge distributions and charge related
properties of studied compound, MEP surface map
was computed at DFT/6-311++G (d, p) optimized
geometries. These maps are used as a reactivity dis-
playing most possible sites for nucleophilic and elec-
trophilic attacks. There are useful in biological appli-
cation and non-covalent interactions particularly hy-
drogen bonds interactions [53, 54]. The surface is
related to the molecular stability and is a very useful
descriptor for determining the sites for electrophilic
and nucleophilic reactions, the study of biological
recognition processes and hydrogen bonding interac-
tions. In addition, they provide information on the
atomic charge related properties and atomic charge
distribution of molecules. The MESP is an important
parameter, and their study leads to a better under-
standing of complex biological processes involving
the dipole–dipole, charge–dipole, and quadruple–
dipole interactions. The electron total density onto
which the molecular electrostatic surface map has
been displayed in Figs. 7a and 7b, the electron densi-
ty isosurface being 0.002 a.u. Figure reveals that neg-
ative regions (blue) are mostly localized over the O
atoms for the electrophilic attack and the positive
regions (green) are mainly localized in the Cl-atoms
for a nucleophilic attack.
Fig. 7a Electrostatic potential contour map.
Fig. 7b Electrostatic potential contour map.
4.7 Natural Bonding Orbital’s
NBO analysis is a useful tool to investigate the high-
est possible percentage of the electron density be-
tween occupied Lewis-type (donor (i)) NBOs are
thereby complemented by the unoccupied non-Lewis
type (acceptor (j)) NBOs within the molecular system
[55]. The delocalization effects can be recognized
from the off-diagonal NBO Fock matrix elements of
the second order Perturbation theory analysis. The
interaction between occupancies of the bonding and
weak occupancies of the valence anti-bonding molec-
ular orbital energies can be qualitatively described in
terms of NBO method that is expressed by means of
second-order perturbation interaction energy E2 [55,
56]. In addition, Lewis-type (i) and non-Lewis type
(j), the stabilization energy E2 associated with i / j
delocalization can be estimated as follows [56]:
(1)
Where qi is the Lewis-type occupancy, εi
and εj are diagonal elements and F(i,j)2 is the off di-
agonal NBO Fock matrix elements. The interaction
between the F(i,j)2 donor- acceptor and NBO Fock
matrix elements [56, 57].

———————————————————————————————————————————————————
WWW.SIFTDESK.ORG 306 Vol-3 Issue-2
SIFT DESK
4.7.1 Second order Perturbation theory analysis:
Donor-accepter interactions
The i - j interactions are considered by analyzing via-
ble interactions between filled Lewis and empty non-
Lewis NBOs, after approximating their molecular
orbital energies through NBOs analysis. These ener-
getic interactions are termed to as ‘delocalization’
corrections to the accurate possible natural Lewis
structure. The potency of these delocalization interac-
tions are relational to the NBO interacting intensities
and molecular orbital energies which give important
facts on the interactions among various parts of the
molecules [58-60]. Some significant orbital intra-
molecular hyper-conjugative interactions and corre-
sponding NBO energies derived from the second or-
der perturbation computation are listed in Table 6,
which shows the most significant interactions be-
tween Lewis and non-Lewis orbital with C and O
lone pairs.
The intra-molecular interaction is formed by the or-
bital overlap of bonding between σ (C-C) and anti-
bonding σ*(C-C) orbital, which results that intramo-
lecular charge (ICT) is causing stabilization of the
system.NBO analysis has been performed on the
3C3'MS molecule at the DFT/6-311++G (d, p) level
in order to elucidate, the intra-molecular rehybridiza-
tion and delocalization of electron density within the
molecule. The most important conjugative interac-
tions in the title molecule involving lone pair LP(1)
of O15 with σ*(C11-C12), σ*(C11-C12), and of σ*
(C5-C6) with the same result in the stabilization
9.53,6.56 and 29.01 kcal/mol, respectively, and also
the lone pair LP(2) of the O15 with σ*(C11-C12)
with the stabilization energy of 6.56 kcal/mol. As
evident from Table 6, the hyperconjugative interac-
tion due to the orbital overlap between σ bonding
orbitals of σ(2)C3-C4, σ (2)C7-C8 ,σ(2)C9-C10 and
σ* anti-bonding σ*(2)C5-C6,σ*(2)C3-C4 σ*(2) C11-
C12 orbitals also results in the intra-molecular charge
transfer contributing to stabilization of the molecular
system [61].
Table 6. Second order perturbation theory analysis of
Fock matrix of 3C3'MS by NBO method by DFT/6-
311++G (d, p) method.
LR→ lone pair. a Stabilisation (delocalisation) energy. b Energy difference between i (donor) and j
(acceptor) NBO orbitals. c Fock matrix element i and j NBO orbitals.
4.8 Mulliken Atomic Charges
The natural population charge calculation plays an
important role in the application of theoretical calcu-
lation to molecular structures [62], because the atom-
ic charges affect the electronic structure, polarizabil-
ity, and much more properties of the molecular sys-
tems. The Mulliken charge distributions of the title
molecule have been calculated by methods DFT/6-
311++G (d,p) and HF/6-311++G(d,p) methods with
6-311++G (d, p) levels of theory are collected in Ta-
ble 7 and the better represent in graphical chart form
as given Fig. 8. From the results, It is worthy to men-
tion that C5, C11 and Cl17 atoms of 3C3'MS exhibit
more positive charges than other H atoms in an aro-
matic ring and carbon atoms substituted by chloride
group have highest atomic charges, while the O15
Donor (i) Acceptor (j) E(2)a
kcal/mol
E(j)-E(i)b a.u.
F(i,j)c
a.u.
σ(2)C1-C2 π(3)C9 0.58 0.96 0.022
σ(2)C1-C2 σ*(2)C3-C4 13.71 0.29 0.060
σ(2)C3-C4 σ*(2)C5-C6 23.28 0.26 0.069
σ(2)C3-C4 σ*(2)C7-C8 18.48 0.27 0.065
σ(2)C5-C 6 σ*(2)C3-C4 19.17 0.29 0.068
σ (2)C7-C8 σ*(2)C3-C4 20.19 0.28 0.068
σ(2)C9-C10 σ*(2)C11-C12 23.21 0.26 0.071
CR (1)C14 π*(2)C9 1.69 11.22 0.123
nLP (2)O15 σ*(1)C5-C6 9.53 0.32 0.054
nLP (1)O15 σ*(1)C11-C12 6.56 1.10 0.076
nLP (2)O15 σ*(2)C11-C 12 29.01 0.32 0.092
σ*(2)C3-C4 σ*(2)C1-C2 64.23 0.02 0.064
σ*(2)C5-C6 σ*(2)C3-C4 228.3 0.01 0.080
σ*(2)C11- C12
σ*(2)C 9 - C 10
262.1 0.01 0.081

——————————————————————————————————————————————————–
WWW.SIFTDESK.ORG 307 Vol-3 Issue-2
SIFT DESK
atom in the molecule have negative charges which
form the C3, C6 and C9 atoms. The greater electro-
negative (ionic) character of negative charge on O
atom and positive charge on Cl atom may suggest the
formation of intermolecular bonding interaction in
solid forms.
Fig. 8 Mulliken population analysis chart.
Table 7 Mulliken atomic charge analysis of 3C3'MS.
4.9 Molecular properties
The HOMO and LUMO energy values are useful
descriptors in studying global reactivity of molecules
and chemical hardness (h), chemical potential (µ),
electronegativity (χ), electrophilicity index (ω) and
softness (S). The chemical Hardness (h) is defined
within the computational method as the total energy
(E) with respect to the number of electrons (N) as
external potential V(r) property of the system that
measures both the global descriptors and molecular
stability of the molecules [63].
(2)
Using Koopman’s theorem for closed-shell mole-
cules [64], ionization potential (IP), electron affinity
(EA), chemical potential, chemical hardness and soft-
ness, electrophilicity index as well as electronegativi-
ty defined [65]. The HOMO and LUMO orbital ener-
gies as IP and EA are related to the energy values of
the EHOMO and ELUMO can be expressed as:
(3)
(4)
(5)
(6)
Where IP and EA, Chemical Hardness (ƞ) and soft-
ness (S) [66] are known as global reactivity de-
scriptors [67, 68] and have been theoretically justified
within the background of DFT and TD-DFT [64].
These chemical descriptors-based parameters are
commonly used to measure chemical reactivity and
molecular properties [69]. Chemical hardness basi-
cally deals with the physical polarization of the elec-
tron cloud of the ions or molecules and atoms under
small perturbation during a molecular properties and
chemical reactivity [70]. Generally, soft molecules
have a smaller value and the hard molecules have a
larger EHOMO and ELUMO energy gap value [71, 72].
The computed values of the hardness, softness,
chemical potential, electronegativity, and electro-
philicity index, IP of donor and EA of acceptor have
been calculated and the results are presented in Table
1.
Atoms Atomic charge (ZA)
DFT HF
C1 0.14848 -0.16586
C2 -0.15002 -0.16995
C3 0.09345 -0.02588
C4 -0.14415 -0.17174
C5 0.24273 0.30057
C6 -0.09192 -0.15322
C7 -0.13293 -0.20061
C8 -0.12662 -0.17687
C9 0.09242 -0.01098
C10 -0.18336 -0.24651
C11 0.27876 0.39479
C12 -0.12752 -0.22523
C13 -0.14593 -0.19343
C14 -0.12971 -0.19495
O15 -0.56349 -0.77017
C16 -0.16982 -0.13623
CI17 0.05863 0.07367
H18 0.12574 0.19628
H19 0.12629 0.19665
———————————————————————————————————————————————————
WWW.SIFTDESK.ORG 308 Vol-3 Issue-2
SIFT DESK
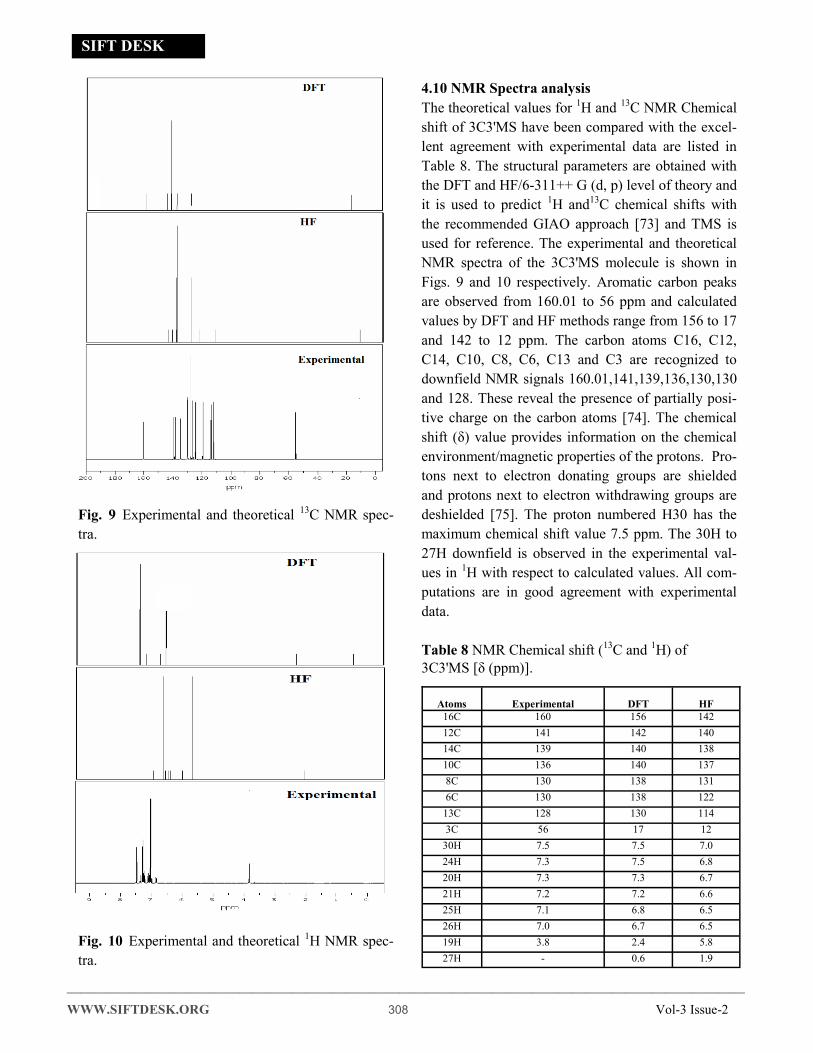
Fig. 9 Experimental and theoretical 13C NMR spec-
tra.
Fig. 10 Experimental and theoretical 1H NMR spec-
tra.
4.10 NMR Spectra analysis
The theoretical values for 1H and 13C NMR Chemical
shift of 3C3'MS have been compared with the excel-
lent agreement with experimental data are listed in
Table 8. The structural parameters are obtained with
the DFT and HF/6-311++ G (d, p) level of theory and
it is used to predict 1H and13C chemical shifts with
the recommended GIAO approach [73] and TMS is
used for reference. The experimental and theoretical
NMR spectra of the 3C3'MS molecule is shown in
Figs. 9 and 10 respectively. Aromatic carbon peaks
are observed from 160.01 to 56 ppm and calculated
values by DFT and HF methods range from 156 to 17
and 142 to 12 ppm. The carbon atoms C16, C12,
C14, C10, C8, C6, C13 and C3 are recognized to
downfield NMR signals 160.01,141,139,136,130,130
and 128. These reveal the presence of partially posi-
tive charge on the carbon atoms [74]. The chemical
shift (δ) value provides information on the chemical
environment/magnetic properties of the protons. Pro-
tons next to electron donating groups are shielded
and protons next to electron withdrawing groups are
deshielded [75]. The proton numbered H30 has the
maximum chemical shift value 7.5 ppm. The 30H to
27H downfield is observed in the experimental val-
ues in 1H with respect to calculated values. All com-
putations are in good agreement with experimental
data.
Table 8 NMR Chemical shift (13C and 1H) of
3C3'MS [δ (ppm)].
Atoms
Experimental
DFT
HF
16C 160 156 142
12C 141 142 140
14C 139 140 138
10C 136 140 137
8C 130 138 131
6C 130 138 122
13C 128 130 114
3C 56 17 12
30H 7.5 7.5 7.0
24H 7.3 7.5 6.8
20H 7.3 7.3 6.7
21H 7.2 7.2 6.6
25H 7.1 6.8 6.5
26H 7.0 6.7 6.5
19H 3.8 2.4 5.8
27H - 0.6 1.9

——————————————————————————————————————————————————–
WWW.SIFTDESK.ORG 309 Vol-3 Issue-2
SIFT DESK
4.11 Natural Charge Analysis
Natural charges and electron population charge anal-
ysis [76] have been important role in the application
of density functional calculation of molecular system.
The difference of charge magnitude is in proportion
with the natural charges, but they differ appreciably
because this analysis includes number of core, val-
ance and Rydberg electrons located in diffuse orbital.
The development of atomic charges on the separate
atom and the accumulation of electrons in the val-
ance, core and Rydberg sub-shells are shown in Ta-
ble 9. In the most electronegative charge of 0.52278
is accumulated on the oxygen atom O6 and -
0.23811is accumulated on the carbon atom C4. Usu-
ally the electron cloud between bonded atoms is sym-
metrical, when the two atoms are similar but if one of
atoms has a greater tendency to attract the electron
cloud then it shifts slightly towards that atom. Ac-
cording to an electrostatic point of new of the mole-
cule, these electronegative atoms have a tendency to
donate an electron. Whereas, the most electropositive
atoms such as; H10 have a tendency to accept an
electron [77]. Further, the natural population analysis
showed that 128 electrons in the 3C3'MS molecule is
distributed on the sub shells as follows:
Core: 41.98304 (99.9596% of 42)
Valance: 85.81491 (99.7848% of 86)
Rydberg: 0.20205 (0.1579% of 128)
Table 9. Natural Population analysis of 3C3'MS
Atoms
Charge (e)
Natural population (e)
Total (e) Core Valence Rydberg
C1 -0.19571 1.99898 4.18647 0.01026 6.19571
C2 -0.21423 1.99897 4.20489 0.01036 6.21423
C3 -0.05348 1.99893 4.04248 0.01208 6.05348
C4 -0.23811 1.99878 4.2282 0.01113 6.23811
C5 -0.01624 1.99843 4.00026 0.01754 6.01624
O6 -0.52278 1.99972 6.51755 0.00551 8.52278
C7 -0.3559 1.99927 4.34998 0.00666 6.3559
Cl8 -0.04686 9.99981 7.04005 0.00701 17.04686
H9 0.22932 0.0073 0.76918 0.0015 0.77068
H10 0.23071 0.0002 0.76783 0.00146 0.76929
4. 12 Thermodynamic analysis
Thermodynamic analysis is important for understanding the chemical processes. The theoretical calculation is a
well-established and efficient tool to calculate various statistical thermodynamic properties of molecular sys-
tem. Nowadays, due to theoretical predictions of thermodynamic properties, and their experimental measure-
ments are possible with high accuracy. The thermodynamic functions such as enthalpy change, heat capacity
and molar entropy can be predicted easily from the molecular partition function. These calculations are used to
convert molecular energy levels into macroscopic properties. Molecular energy arises from electronic excita-
tion, Molecular translation, rotation, and vibration. This information establishes the spectroscopy of the mole-
cule of interest [78, 79]. In the present studies, the parameters such as SCF energies, specific heat capacities,
rotational constants, zero-point vibrational energies, dipole moments, rotational temperatures, 3C3'MS have
been calculated at DFT and HF method with 6-311++G(d,p) basis set are listed in Table 10.

———————————————————————————————————————————————————
WWW.SIFTDESK.ORG 310 Vol-3 Issue-2
SIFT DESK
5. CONCLUSIONS
In this study, comparing the theoretical FT-IR, FT-
Raman and Experimental FT-IR, FT-Raman spectra
of the title compound 3C3'MS have been recorded.
The investigations on fundamental modes along with
structural, thermodynamic, electronic analysis, Natu-
ral population analysis and Mulliken population anal-
ysis of the compound have been made using ab initio
DFT and HF methods with 6-311++G(d,p) basis sets.
Close agreement is observed in the molecular geome-
tries like bond lengths and bond angles calculated by
DFT and HF methods. The UV-Vis spectra analysis
of the molecule was also carried out. Theoretical 13C
and 1H chemical shift values are reported and com-
pared with experimental data, showing a very good
agreement both for 13C and 1H. The HOMO–LUMO
energy gap helped in analyzing the chemical reactivi-
ty of the molecule. Global hardness, softness and
electrophilicity were calculated. The FMOs have
been pictured and the HOMO–LUMO energy gap
has been calculated. First hyperpolarizability analysis
reveals that the title compound possesses considera-
ble NLO properties. The NBO analysis have been
made with which the chemical stability and intra mo-
lecular interactions have been interpreted and the
transactions give stabilization to the structure have
been identified by second order perturbation energy
calculations. The ESP map shows that the negative
potential sites are on oxygen as well as the positive
potential sites are the hydrogen and chlorine atom in
a molecule.
Table 10. Theoretically computed zero-point vibrational energy (Kcal mol−1), rotational constants (GHz), rota-
tional temperatures (Kelvin), thermal energy (Kcal mol−1), molarcapacity at constant volume (cal mol−1 Kel-
vin−1), dipole moment (Debye) and vibrational temperatures (Kelvin) for 3C3'MS.
Parameter DFT/B3LY HF
Zero-point vibrational energy Rotational constant (GHZ) Rotational temperature (Kelvin) Energy total (KCal/Mol) Translational(KCal/Mol) Rotational(KCal/Mol) Vibrational(KCal/Mol) Dipole moment Vibrational temperature (Kelvin)
150.66513 1.41876 0.12322 0.11345 0.06809 0.00591 0.00544 160.108
0.889 0.889
158.331 3.7721 11.21 70.14 78.14 99.35
142.91 225.55 267.41 285.17 290.92 336.66 362.21 380.06 434.12 460.29 566.91 639.98 654.65 677.52
160.36038 1.41876 0.12322 0.11345 0.06809 0.00591 0.00544 168.481
0.889 0.889
166.704 3.7290 90.53
129.94 164.14 219.61 251.23 258.08 315.80 338.57 416.53 433.71 439.60 493.59 511.64 597.74 629.37 686.24 763.73 785.62
——————————————————————————————————————————————————–
WWW.SIFTDESK.ORG 311 Vol-3 Issue-2
SIFT DESK
ABBREVIATIONS
3C3'MS 3-Chloro-3'-Methoxystilbene
RHF Restricted Hartree-Fock
MP2 Moller-Plesset second order perturbation
theory
NMR Nuclear Magnetic Resonance
ICT Intramolecular change transfer
HOMO Highest occupied molecular orbital
LUMO Lowest unoccupied molecular orbital
DFT Density Functional Theory
IVR Intramolecular Vibrational Redistribution
ACKNOWLEDGEMENTS
The authors are thankful to the learned referees for
their useful and critical comments, which improved
the quality of the manuscript. One of the authors, M.
Prakasam, acknowledges Periyar University for fi-
nancial support in the form of a University Research
Fellowship (URF).
REFERENCE
[1] J. Saltiel, J. D.Agostino, E. D. Megarity, L. Metts, K. R. Neuberger, M. Wrighton, O. C. Zafiriou, O.L. Chapman, The cis-trans Photoisomerization of Olefins Marcel Dekker, New York, 1973.
[2] D. H. Waldeck, Chem. Rev. 1991, 91, 436. View Arti-cle
[3] H. Meier, Angew. Chem. Int. Ed. Engl. 1992, 31, 1540. View Article
[4] J. S. Baskin, L. Banares, S. Pedersen, A. H. Zewail, J. Phys. Chem. 1996, 100, 11933. View Article
[5] P. Senthilkumar, C. Nithya and P. M. Anbarasan. J. Mol. Mod. 2013, 19, 4573. PMid:23959394 View Article PubMed/NCBI
[6] K.A. Muszkat, Top. Curr. Chem. 1980, 88, 143 [7] T. Nakabayashi, H. Okamoto, M. Tasumi, J. Phys.
Chem. 1998, 102, 9695 View Article [8] S. L. Schultz, J. Qian, J.M. Jean, J. Phys. Chem. 1997,
101, 1006. View Article [9] R. J. Sension, A. Z. Szarka, R.M. Hochstrasser, J.
Chem. Phys. 1992, 97, 5242. View Article [10] J. K. Rice, A. P. Baronavski, J. Phys. Chem. 1992, 96,
3366. View Article [11] H. Sanei, A. Asoodeh, S. Hamedakbari-Tusi, J.
Chamani, J Solu. Chem. 2011, 40, 1905. View Arti-cle
[12] P. Mokaberi, V. Reyhani, Z. Amiri-Tehranizadeh, M. R. Saberi, S. Beigoli, F. Samandar and J. Chamani, New J Chem. 2019, 43, 8132. View Article
[13] Z. Sharif-Barfeh, S. Beigoli, S. Marouzi, A. Sharifi Rad, A. Asoodeh, J. Chamani, J. Sol. Chem. 2017, 46, 488. View Article
[14] M. Zolfagharzadeh, M. Pirouzi, A. Asoodeh, M.R. Saberi and J. Chamani, J. Biomol. Struc. Dynam. 2014, 32, 1936. PMid:24125112 View Arti-
cle PubMed/NCBI [15] J. Grundy, Chem. Rev. 1957, 57, 356. View Arti-
cle [16] K. Hagiwara, N. Kosaka, Y. Yoshioka, R.
Takahashi ,F. Takeshita & T. Ochiya, Sci. Rep. 2012, 2, 314. PMid:22423322 View Article PubMed/NCBI
[17] H. A. Ali, K. Kondo, Y. Tsuda, Chem. Pharm. Bull. 1992, 40, 1136.
[18] H. Matsuda, N. Tomohiro, K. Hiraba, S. Harima, S. Ko, K. Matsuo, M. Yoshikawa, M. Kubo, Bio. Pharm. Bull. 2001, 24, 267. PMid:11256482 View Arti-cle PubMed/NCBI
[19] S. Sanoh, S. Kitamura, K. Sugihara, N. Fujimoto, S. Ohta, J. Heal. Sci. 2003, 49, 367. View Article
[20] K. Tsumura, K. Furuya, A. Sakamoto, Mo. Tasumi, J. Raman Spectrosc. 2008, 39, 1591. View Article
[21] A. Weigel, N. P. Ernsting, J. Phys. Chem. B 2010, 114, 7893. PMid:20481560 View Article PubMed/NCBI
[22] R. K. Chaudhuri, J. Phys. Chem. A 2013, 117, 9434. PMid:23530611 View Article PubMed/NCBI
[23] A. L. Houk, I. L. Zheldakov, T. A. Tommey, and C. G. Elles, J. Phys. Chem. B 2015, 119, 9344. PMid:25369524 View Article PubMed/NCBI
[24] M. Arivazhagan, V. Krishnakumar, J. Xavier, G. Ilan-go, V. Balachandran, Spectrochimi. Acta Part A 2009, 72, 946. PMid:19196545 View Article PubMed/NCBI
[25] R. G.W .Yang, Density Functional Theory of Atoms and Molecular, Oxford, New York, 1989.
[26] R. O .Jones, O. Gunnarson, Rev.Mol.Phys. 1989, 61, 689 View Article
[27] T. Ziegier, Chem. Rev. 1991, 91, 651. View Arti-cle
[28] W. Kohn, L. J .Sham, Phys. Rev. A 1965, 140, 1133. View Article
[29] A. D. Becke, Phys. Rev. Part A 1988, 38, 3098 PMid:9900728 View Article PubMed/NCBI
[30] C .T. Lee, W.T. Yang, R.G. Parr, Phys. Rev. Part B. 1988, 37, 785. PMid:9944570 View Arti-cle PubMed/NCBI
[31] J. Frisch, G.W. Trucks, H.B .Schlegel, G.E .Scuseria, M.A. Robb, J.R .Cheeseman, H. Nakatsuji, M. Carica-to, X. Li, H.P. Hratchian, K. Toyota, R. Fukuda, J. Hasegawa, M. Ishida, R. Nakajima, Y. Honda, O. Ki-lao, H. Nakai, T. Verven, J. A. Montgomery Jr., J. E .Peralta, F. Ogliaro, M .Bearpark, J.J .Heyd, E. Brothers, K. N. Kudin, V. N. Staroveror, R. Koba-yashi, J. Normand, K. Ragavachari, A .Rendell, J. C. Burant, S .J. Tomasi, M .Cossi, N. Rega, J.M .Millam, M. Klene, J .E Knox, J .B. Cross, V. Bakken, C. Ada-mo, J. Jaramillo, R. Gomperts, R .E. Strattmann, O .Yazyev, A.J. Austin, R. Cammi, J.W. Ochetrski, R.L. Martin, K. Morokuma, V. G. Zakrazawski, G .A. Votn, P. Salvador, J.J. Dannenberg, S. Dapprich, A.D. Daniels, O. Farkas, J. B. Foresman, Gaussian O. G., Revision A.O2 Gaussian Inc., Wallingford, CT, 2009.
[32] A. D .Becke, J. Chem. Phys. 1993, 98, 5652. View Article
[33] C. Lee, W. Yang, R. C .Parr, J. Phys. Rev. B 1998, 37, 789.
[34] T. Sundius, J. Mol. Struct. 1990, 218, 326. 80287-T

———————————————————————————————————————————————————
WWW.SIFTDESK.ORG 312 Vol-3 Issue-2
SIFT DESK
View Article [35] Computer program Gauss View 3.09, Ver. 2 Gaussian
Inc, PA, Pittsburgh, 2008. [36] P. Pulay, G. Fogarasi, F. Pang, J. E. Boggs, J. Am.
Chem. Soc. 1979, 10, 2550. View Article [37] G. Keresztury, J.M. Chalmers, P.R. Griffth, Raman
Spectroscopy: Theory in Handbook of Vibrational Spectroscopy, John Wiley & Sons Ltd., New York, 2002.
[38] M.S. Alam, D .U. Lee, J. Mol. Struc. 2017, 1128, 185. [39] M. Bakiler, I.V. Maslov, S. Akyuz, J. Mol. Struct.
1999, 475, 83. 00491-8 View Article [40] J. S. Murray, K .Sen, Elsevier, Amsterdam, the Neth-
erlands, 1996. [41] J. Chamani, M. Heshmati, J Coll. Interf. Sci. 2008,
322, 119. PMid:18405913 View Article PubMed/NCBI
[42] V. Krishnakumar, N .Prabavathi, Spectrochim. Acta Part A 2009, 72, 747. PMid:19121975 View Arti-cle PubMed/NCBI
[43] G.Varsanyi, Academic Kiaclo, Budapest, 1973. [44] P.S. Kalsi, Sectroscopy of Organic Compounds New
Age International P Limited Publishers, New Delhi, 2005.
[45] V. Balachandran, G. Santhi, V. Karpagam, A. Laksh-mi, Spectrochim. Acta Part A 2013, 110, 140. PMid:23562743 View Article PubMed/NCBI
[46] R. A. Yadav, I .S .Sing, Indian J. Pure Appl. Phys. 1985, 23, 627.
[47] K. Parimala, V. Balachandran, Spectrochim. Acta Part A 2011, 81, 723. PMid:21795105 View Arti-cle PubMed/NCBI
[48] Y. R. Shen, the Principles of Nonlinear Optics Wiley, New York, 1984.
[49] P. Vennila, M . Govindaraju, G .Venkatesh, C . Kamal, J. Mol. Struct. 2016, 1111, 156. View Arti-cle
[50] M. Adant, L. Dupuis, L .Bredas, Int. J. Quantum Chem. 2004, 56, 507.
[51] B. M. Wong, M. Piacenza, F. Della Sala, Phys. Chem. Chem. Phys. 2009, 11, 4508. PMid:19475168 View Article PubMed/NCBI
[52]A.A. Moosavi-Movahedi, J. Chamania, M. Gharanfoli, G.H. Hakimelahi, Thermochimica Acta, 2004, 409, 137.
SIFT DESK JOURNALS Email: [email protected]


![Molecular Characterization of Arabidopsis …...Molecular Characterization of Arabidopsis GAL4/UAS Enhancer Trap Lines Identifies Novel Cell-Type-Specific Promoters1[OPEN] Tatyana](https://img.dokumen.tips/doc/110x75/5fcd2a0b62c59118be1ef30c/molecular-characterization-of-arabidopsis-molecular-characterization-of-arabidopsis.jpg)