Embed Size (px)
Citation preview

Journal of Cardiology xxx (2016) xxx–xxx
G Model
JJCC-1263; No. of Pages 9
Original article
Deformability of the pulsating left ventricular wall: A new aspectelucidated by high resolution ultrasonic methods
Motonao Tanaka (MD, PhD, FJCC)a,*, Tsuguya Sakamoto (MD, PhD, FJCC)b,Shigeo Sugawara (MD, PhD, FJCC)a, Yoshiaki Katahira (MD, PhD, FJCC)a,Kaoru Hasegawa (MD)a, Hiroyuki Nakajima (RMS)a, Takafumi Kurokawa (RMS)a,Hiroshi Kanai (PhD)c, Hideyuki Hasegawa (PhD)c
a Cardiovascular Center, Tohoku Pharmaceutical University Hospital, Sendai, Japanb Hanzomon Hospital, Tokyo, Japanc Department of Electrical Engineering, Tohoku University, Sendai, Japan
A R T I C L E I N F O
Article history:
Received 2 November 2015
Received in revised form 6 January 2016
Accepted 1 February 2016
Available online xxx
Keywords:
Deformability
Contraction-relaxation/extension property
Bellows action
Peristalsis
Pouch-like deformation
A B S T R A C T
Background: Although the deformability of the left ventricular (LV) wall appears to be important in
maintaining effective cardiac performance, this has not been debated by anyone, probably owing to the
difficulties of the investigation.
Objectives: This study applies a new technology to demonstrate how the LV wall deforms so as to adjust
for optimum cardiac performance.
Subjects and methods: Ten healthy volunteers were the subjects. Using echo-dynamography, an analysis
at the ‘‘microscopic’’ (muscle fiber) level was done by measuring the myocardial axial strain rate (aSR),
while the ‘‘macroscopic’’ (muscle layer) level contraction-relaxation/extension (C-R/E) properties of the
LV wall were analyzed using high frame rate 2D echocardiography.
Results: Deformability of the LV was classified into three types depending on the non-uniformity of both
the C-R/E properties and the aSR distribution.
‘‘Basic’’ deformation (macroscopic): The apical posterior wall (PW) thickness change was concentric
and monophasic, whereas it was eccentric and biphasic in the basal part. This deformation was large in
the PW, but small in the interventricular septum (IVS). The elongation of the mitral ring diameter and the
downward movement of its posterior part were shown to be concomitant with the anterior extrusion of
the PW.
‘‘Combined’’ deformation (macroscopic and microscopic): This was observed when the basic
deformation was coupled with the spatial aSR distribution. Three patterns were observed: (a) peristaltic;
(b) bellows-like; and (c) pouch-like.
‘‘Integrated’’ deformation: This was the time serial aSR distribution coupled with the combined
deformation, illustrating the rotary pump-like function.
The deformability of the LV assigned to the apical part the control of pressure and to the basal part,
flow volume. The IVS and the PW exhibited independent behavior.
Conclusions: The non-uniformity of both the aSR distribution and the macroscopic C-R/E property were
the basic determinants of LV deformation. The apical and basal deformability was shared in LV
mechanical function.
� 2016 Japanese College of Cardiology. Published by Elsevier Ltd. All rights reserved.
Contents lists available at ScienceDirect
Journal of Cardiology
jo u rn al h om ep age: ww w.els evier .c o m/lo c ate / j j c c
* Corresponding author at: Cardiovascular Center, Tohoku Pharmaceutical
University Hospital, Fukumuro 1-12-1, Miyagino-ku, Sendai 983-8512, Japan.
Tel.: +81 22 719 5161; fax: +81 22 719 5166.
E-mail address: [email protected] (M. Tanaka).
Please cite this article in press as: Tanaka M, et al. Deformability of thresolution ultrasonic methods. J Cardiol (2016), http://dx.doi.org/10
http://dx.doi.org/10.1016/j.jjcc.2016.02.009
0914-5087/� 2016 Japanese College of Cardiology. Published by Elsevier Ltd. All rights
Introduction
The deformability of the left ventricular (LV) wall may be anindispensable determinant of smooth and effective LV mechanicalperformance [1,2]. However, this concept was not noticed byprevious researchers. Although it might have been speculated, itwould have been difficult to investigate because of the poor spatial
e pulsating left ventricular wall: A new aspect elucidated by high.1016/j.jjcc.2016.02.009
reserved.

Fig. 1. Measurement methods of the structure change of the LV wall by high frame
rate 2D echocardiography and of the high-resolution axial strain rate (aSR) by phase
difference tracking method. Cardiac structures confirmed by 2D echocardiogram.
The 1–3 beam directions to parts A (apical), C (central), and B (basal) were decided
on the long-axis section plane. In the aSR method, the beam direction was decided
on the systolic maximum image. The received echo signals from the wall for about
6 s were stocked in the digital memory and processed off-line by using our own
developed software. The aSR at the point area on the beam was calculated by the
bottom equation (strain rate). Details were shown in the previous papers
[35,37]. MRD, mitral ring diameter; US beam, ultrasonic beam; LV, left ventricle;
End, endo-cardium; Epi, epicardium; v(x1i; t), velocity at the point of x1; v(x2i; t),
velocity at the point x2.
M. Tanaka et al. / Journal of Cardiology xxx (2016) xxx–xxx2
G Model
JJCC-1263; No. of Pages 9
resolution of past investigative methods [3–11], such as X-ray,magnetic resonance imaging (MRI), and conventional 2D echocar-diography, including the speckle tracking method. Also, theexperimental studies [12–16] and artificial cardiac models[17,18] are not physiological, and cannot observe the phenomenaof the living heart moving under ‘‘negative pressure’’ in the thorax[19–24]. The present study attempts to challenge this difficultproblem by using the high-resolution non-invasive methodology(echo-dynamography) to confirm the significance of the deform-ability for LV performance.
Objectives
We attempted to disclose LV wall deformability in situ usingecho-dynamography which has been heretofore repeatedlydescribed. The ‘‘microscopic’’ method (to the muscle fiber level)measured the axial strain rate (aSR) using the phase differencetracking method [25–29]. The ‘‘macroscopic’’ method (to themuscle layer level) observed the morphology using high frame rate2D echocardiography. In addition, the spatial and time serialbehaviors [7,8,30,31] were observed.
Subjects and methods
Ten presumably healthy volunteers aged 30–50 years(39.6 � 10.4 years) who had given informed consent were thesubjects. They are working in our laboratory, and volunteers with pastand present history of adult disease were not included in this study.
Acquisition of the information
The information of the wall dynamics was obtained using thespecially designed ultrasonic machine (Aloka 6500 model, HitachiAloka Medical, Tokyo, Japan). While the examinee was in thesupine or left lateral decubitus position, a transthoracic parasternal908 sector scan was passed through three points (center of both theaortic and the mitral orifices and the LV apex) so as to include thecenter of the LV, the left atrium (LA), and both axis lines of theinflow and outflow. This plane was named ‘‘longitudinal sectionplane [32]’’ and the LV structure was symmetrical with this plane(Fig. 1). The rectangular plane perpendicular to this was named‘‘short-axis plane’’ throughout which 3D measurement of the LVwas done from the apex to base precisely. Then, we measured theintra-ventricular blood flow [30,31] and the LV mechanicalphenomena with minimum acoustical measurement error[8,33,34].
Measurement of the macroscopic (muscle layer level) dynamics of the
LV wall
A high speed of 66 frame/s with 3.5 MHz in frequency and4.5 KHz in repetition rate was used for 2D echocardiography[7,8,32]. A 908 scan from the base to the apex was performed.
During one cardiac cycle, the images of continuous 30 frames ofevery 30 ms were analyzed at each of the 3 points, that is, the apical(A: just above the papillary muscle level), basal (B: ca 10 mm apartfrom the mitral valve ring), and central (C: in the middle of A and B)(Fig. 1).
The thicknesses of the posterior wall (PW) and the interven-tricular septum (IVS), and the internal diameter of the LV weremeasured, respectively. Mitral valve ring diameter (MRD) and themitral ring movement (MRM) were also measured.
Selected heart rate was about 70/min and the time course of thecardiac cycle of each case was corrected by R–R interval afterBazett’s equation to stabilize the data among the subjects.
Please cite this article in press as: Tanaka M, et al. Deformability of thresolution ultrasonic methods. J Cardiol (2016), http://dx.doi.org/10
Measurement of the microscopic (muscle fiber level) dynamics of the
LV wall by the aSR
For methodological reasons, we measured the myocardial fiber‘‘thickness’’ change instead of the change in the fiber ‘‘length’’. Thisis because the change in the pulsating myocardial fiber length is ininverse proportion to the thickness [21–23], which is easily andaccurately measured by the present methodology.
The ultrasound used was 3.75 MHz in frequency and 133 ms inthe pulse repetition interval. The limited angle of each 308 out of908 was scanned at a high speed of 630 frame/s from the base to theapex (sparse scan) (Fig. 1A–C). The B point was decided from themaximum systolic image. The thickness (821 mm) was measuredat the microscopic level with a high spatial resolution of 200 mmby using the phase difference tracking method of ultrasound[26,27]. Furthermore, the non-uniformity of the contraction andextension in the local myocardium was estimated from the resultof the spatial aSR distribution [25–29,32,35].
The calculated aSR was displayed on the M-mode images. Thecold color indicates the increment of the aSR [contraction: aSR(+)]and the warm color, the decrement [extension: aSR(�)]. In thisregard, the relaxation (B1) (no active movement) is indicated byblack color, where there is nearly no contraction nor extension (themuscle is completely relaxed either in systole or in diastole).
e pulsating left ventricular wall: A new aspect elucidated by high.1016/j.jjcc.2016.02.009

M. Tanaka et al. / Journal of Cardiology xxx (2016) xxx–xxx 3
G Model
JJCC-1263; No. of Pages 9
Statistical analysis
The present study did not include a precise statistical analysis.The reasons were as follows:
The inscribed graphs and the measurement values were nearlyidentical throughout all subjects. There were no visible unavoidablevariations in most of the medical study. Mild heart rate variabilitywas present, but it was corrected by Bazett’s equation. It was truethat individual subjects had slightly different measurement valuesin the wall thickness and internal dimension, etc., however, thevariations are dependent on and parallel to the individual size anddimension. So, to take a mean and deviation of all subjects ismeaningless or may be misleading in this study in which all theitems had the same changing direction. Essentially, this study wasrather ‘‘physical’’ but not physiological or medical, so that it may be
Fig. 2. The various time serial LV changes measured from the successive 30 frames at ev
Out of the similar measurement values in 10 cases, a representative case is presented. Ttriangle; C, central: red square; B, basal: blue rhombus) during cardiac cycle. The number
thickness (mm) and the time interval (ms) between the peak point of the contraction in
extension (large arrow, apical contraction and basal extension coexisted; small arrow, b
diameter at the three parts (symbols are the same as the top figure), changes in the mitra
posterior part of the mitral ring movement (MRM: yellow dotted line). The numbers are t
of the bellows-like deformation, and that with the orange color, the effect of the pouch-lik
IIs, 2nd heart sound; IC, isovolumetric contraction; Ej, ejection; IR, isovolumetric relaxat
pre-ET, pre-ejection transition; post-ET, post-ejection transition; P,Q,R,S,T, ECG symbol
Please cite this article in press as: Tanaka M, et al. Deformability of thresolution ultrasonic methods. J Cardiol (2016), http://dx.doi.org/10
quite difficult to obtain the conclusion if there was variability of thedata as seen in the clinical study. The data once stored in the MO-discgave exactly the same results, whenever it was rechecked by anycollaborators, so there was no observer variation- or test-to-testvariability. This is the reason why the present article shows only oneexample in the figures. The authors believe that the limited 10 casesare sufficient to discuss and conclude the results.
Results
When the heart rate was corrected by R–R interval, the timeserial changes in the wall thickness and displacement, and theinternal diameter during one cardiac cycle showed the sametendency in all cases. Therefore, one example is shown in Fig. 2, andthe ratio to the apical data is listed in Tables 1 and 2.
ery 30 ms using long-axis section plane of the high frame rate 2D echocardiograms.
op: Changes in the IVS and PW thickness measured at three parts (A, apical: green
s indicate the contracting speed of the myocardium (mm/s), the changes of the wall
the three parts. The red thick vertical arrows indicate simultaneous contraction and
asal contraction and apical extension coexisted). Bottom: Changes in the internal
l valve ring diameter (MRD: brown dotted line), and changes in displacement of the
he same as those in the top figure. The area filled with the blue color shows the effect
e deformation. PW, posterior wall; IVS, interventricular septum; Is, 1st heart sound;
ion; SF, slow filling; AC, atrial contraction; ERF and LRF, early and late rapid filling;
s.
e pulsating left ventricular wall: A new aspect elucidated by high.1016/j.jjcc.2016.02.009
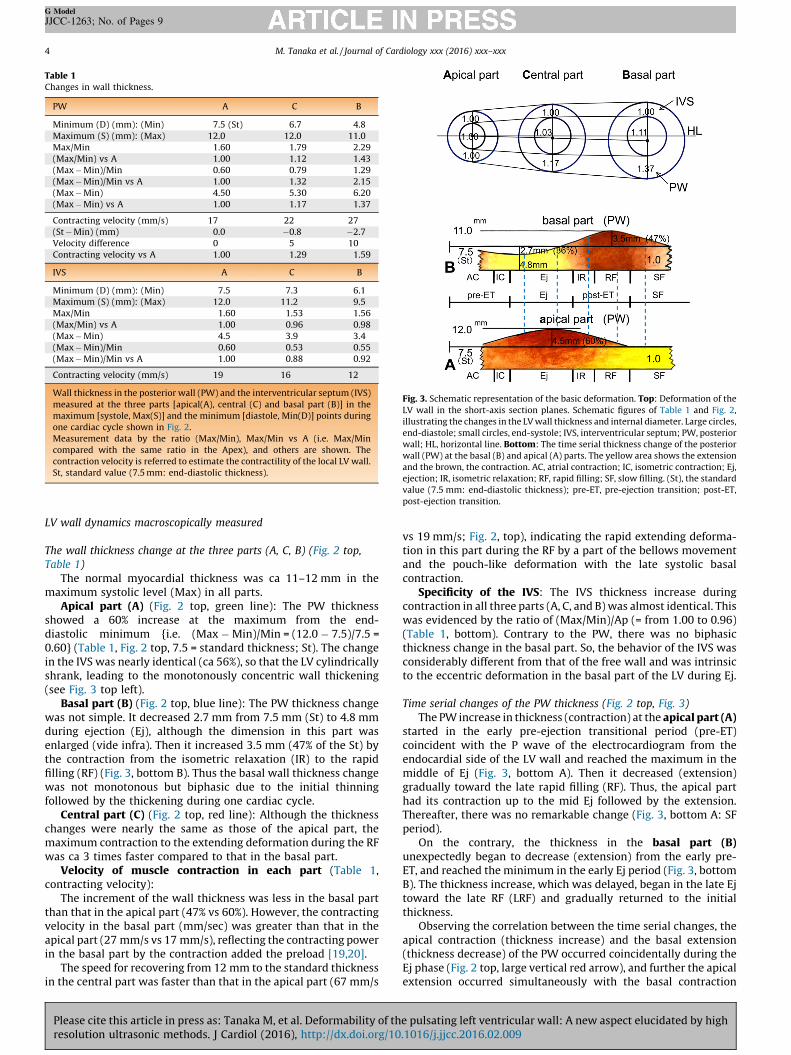
Table 1Changes in wall thickness.
PW A C B
Minimum (D) (mm): (Min) 7.5 (St) 6.7 4.8
Maximum (S) (mm): (Max) 12.0 12.0 11.0
Max/Min 1.60 1.79 2.29
(Max/Min) vs A 1.00 1.12 1.43
(Max � Min)/Min 0.60 0.79 1.29
(Max � Min)/Min vs A 1.00 1.32 2.15
(Max � Min) 4.50 5.30 6.20
(Max � Min) vs A 1.00 1.17 1.37
Contracting velocity (mm/s) 17 22 27
(St � Min) (mm) 0.0 �0.8 �2.7
Velocity difference 0 5 10
Contracting velocity vs A 1.00 1.29 1.59
IVS A C B
Minimum (D) (mm): (Min) 7.5 7.3 6.1
Maximum (S) (mm): (Max) 12.0 11.2 9.5
Max/Min 1.60 1.53 1.56
(Max/Min) vs A 1.00 0.96 0.98
(Max � Min) 4.5 3.9 3.4
(Max � Min)/Min 0.60 0.53 0.55
(Max � Min)/Min vs A 1.00 0.88 0.92
Contracting velocity (mm/s) 19 16 12
Wall thickness in the posterior wall (PW) and the interventricular septum (IVS)
measured at the three parts [apical(A), central (C) and basal part (B)] in the
maximum [systole, Max(S)] and the minimum [diastole, Min(D)] points during
one cardiac cycle shown in Fig. 2.
Measurement data by the ratio (Max/Min), Max/Min vs A (i.e. Max/Min
compared with the same ratio in the Apex), and others are shown. The
contraction velocity is referred to estimate the contractility of the local LV wall.
St, standard value (7.5 mm: end-diastolic thickness).
Fig. 3. Schematic representation of the basic deformation. Top: Deformation of the
LV wall in the short-axis section planes. Schematic figures of Table 1 and Fig. 2,
illustrating the changes in the LV wall thickness and internal diameter. Large circles,
end-diastole; small circles, end-systole; IVS, interventricular septum; PW, posterior
wall; HL, horizontal line. Bottom: The time serial thickness change of the posterior
wall (PW) at the basal (B) and apical (A) parts. The yellow area shows the extension
and the brown, the contraction. AC, atrial contraction; IC, isometric contraction; Ej,
ejection; IR, isometric relaxation; RF, rapid filling; SF, slow filling. (St), the standard
value (7.5 mm: end-diastolic thickness); pre-ET, pre-ejection transition; post-ET,
post-ejection transition.
M. Tanaka et al. / Journal of Cardiology xxx (2016) xxx–xxx4
G Model
JJCC-1263; No. of Pages 9
LV wall dynamics macroscopically measured
The wall thickness change at the three parts (A, C, B) (Fig. 2 top,
Table 1)
The normal myocardial thickness was ca 11–12 mm in themaximum systolic level (Max) in all parts.
Apical part (A) (Fig. 2 top, green line): The PW thicknessshowed a 60% increase at the maximum from the end-diastolic minimum {i.e. (Max � Min)/Min = (12.0 � 7.5)/7.5 =0.60} (Table 1, Fig. 2 top, 7.5 = standard thickness; St). The changein the IVS was nearly identical (ca 56%), so that the LV cylindricallyshrank, leading to the monotonously concentric wall thickening(see Fig. 3 top left).
Basal part (B) (Fig. 2 top, blue line): The PW thickness changewas not simple. It decreased 2.7 mm from 7.5 mm (St) to 4.8 mmduring ejection (Ej), although the dimension in this part wasenlarged (vide infra). Then it increased 3.5 mm (47% of the St) bythe contraction from the isometric relaxation (IR) to the rapidfilling (RF) (Fig. 3, bottom B). Thus the basal wall thickness changewas not monotonous but biphasic due to the initial thinningfollowed by the thickening during one cardiac cycle.
Central part (C) (Fig. 2 top, red line): Although the thicknesschanges were nearly the same as those of the apical part, themaximum contraction to the extending deformation during the RFwas ca 3 times faster compared to that in the basal part.
Velocity of muscle contraction in each part (Table 1,contracting velocity):
The increment of the wall thickness was less in the basal partthan that in the apical part (47% vs 60%). However, the contractingvelocity in the basal part (mm/sec) was greater than that in theapical part (27 mm/s vs 17 mm/s), reflecting the contracting powerin the basal part by the contraction added the preload [19,20].
The speed for recovering from 12 mm to the standard thicknessin the central part was faster than that in the apical part (67 mm/s
Please cite this article in press as: Tanaka M, et al. Deformability of thresolution ultrasonic methods. J Cardiol (2016), http://dx.doi.org/10
vs 19 mm/s; Fig. 2, top), indicating the rapid extending deforma-tion in this part during the RF by a part of the bellows movementand the pouch-like deformation with the late systolic basalcontraction.
Specificity of the IVS: The IVS thickness increase duringcontraction in all three parts (A, C, and B) was almost identical. Thiswas evidenced by the ratio of (Max/Min)/Ap (= from 1.00 to 0.96)(Table 1, bottom). Contrary to the PW, there was no biphasicthickness change in the basal part. So, the behavior of the IVS wasconsiderably different from that of the free wall and was intrinsicto the eccentric deformation in the basal part of the LV during Ej.
Time serial changes of the PW thickness (Fig. 2 top, Fig. 3)
The PW increase in thickness (contraction) at the apical part (A)started in the early pre-ejection transitional period (pre-ET)coincident with the P wave of the electrocardiogram from theendocardial side of the LV wall and reached the maximum in themiddle of Ej (Fig. 3, bottom A). Then it decreased (extension)gradually toward the late rapid filling (RF). Thus, the apical parthad its contraction up to the mid Ej followed by the extension.Thereafter, there was no remarkable change (Fig. 3, bottom A: SFperiod).
On the contrary, the thickness in the basal part (B)unexpectedly began to decrease (extension) from the early pre-ET, and reached the minimum in the early Ej period (Fig. 3, bottomB). The thickness increase, which was delayed, began in the late Ejtoward the late RF (LRF) and gradually returned to the initialthickness.
Observing the correlation between the time serial changes, theapical contraction (thickness increase) and the basal extension(thickness decrease) of the PW occurred coincidentally during theEj phase (Fig. 2 top, large vertical red arrow), and further the apicalextension occurred simultaneously with the basal contraction
e pulsating left ventricular wall: A new aspect elucidated by high.1016/j.jjcc.2016.02.009

Table 2Changes in internal diameter.
A C B (B � A)Ej (B � A)RF
Maximum (D) (mm): (Max) 39.0 42.5 49.0 10 12
Minimum (S) (mm): (Min) 32.0 (St) 33.0 35.5 3.5 3.5
Max vs A 1.00 1.09 1.26
Min vs A 1.00 1.03 1.11
(Max � Min) 7.0 9.5 13.5
(Max � Min)/Min 0.22 0.29 0.38
(Max � Min)/Min vs A 1.00 1.32 1.73
Max/St 1.22 1.33 1.53 2.9 3.4
(Max/St) vs A 1.00 1.09 1.25
Contracting velocity (mm/s) 52 54 26
Internal diameter changes of the left ventricle (LV) at the three parts (Table 1) in
the maximum [diastole, Max(D)] and the minimum [systole, Min(S)] points
during one cardiac cycle in Fig. 2.
A, apical data; St, standard value (32.0 mm: end-systolic diameter); (B � A)Ej,
difference between B and A at the IC phase; (B � A)RF, difference between B and
A at the end of the RF point.
Fig. 4. Schema represents the deformability of the posterior wall and the mitral ring
in the long-axis direction. A, B, and C, end-diastolic points at the apical (A), basal (B),
and central (C) parts; B0 , C0 , end-systolic points (Apical point is fixed); during cardiac
cycle, the points B (basal) and C (central) move to the points B0 and C0 . The change in
the internal diameter during systole is depicted by the distance between the paired
blue arrows in the Max and Min at points B and C (cf. Table 2). The percentage
numbers (%) are the changing ratios to the apical diameter (A). Red line is the mitral
ring diameter (long: systole, short: diastole), broken line: period of extension,
+61% = increment of the ring diameter during systole compared with that at the
endo-diastole. Ao, aorta; MV, mitral valve; LV, left ventricle; orange colored area, LV
wall and interventricular septum.
M. Tanaka et al. / Journal of Cardiology xxx (2016) xxx–xxx 5
G Model
JJCC-1263; No. of Pages 9
during the LRF phase (Fig. 2 top, small vertical red arrow). Thisindicated the non-uniform contraction of the PW.
Discrepant changes in the LV wall thickness and the concept of
peristalsis
As shown in Fig. 2 top, and schematically shown in Fig. 3bottom, the wall contraction started from the apex and wasfollowed by the delayed basal contraction. Namely, the contractiontransmitted from the apical part to the basal part. The onset, themaximum, as well as the end of the contraction of the PW and IVSoccurred at the apical (A), central (C) and basal (B) parts in thisorder. This confirmed the presence of the ‘‘peristalsis’’ of the PWand the IVS.
The time discrepancy in the maximum thickening between theapical and the basal part in the PW was about 210 ms (A–C = 120 ms, C–B = 90 ms) and about 180 ms in the IVS (Fig. 2, top).
Changes in the LV internal diameter and the sequel (extruding
deformation)
Changes at the three parts of the LV (Fig. 2, bottom, Fig. 3, Table 2)
Another feature of LV deformability was the effects of thechanges in the internal diameter. The measured data for each partare shown in Table 2, where the Max(D) is the so-called maximumend-diastolic, and the Min(S), the minimum end-systolic dimen-sions.
As each diameter changed concomitantly with the wallthickness changes, the shape of the LV and also the mitral valve(vide infra) were obliged to change as schematically shown inFig. 4.
When compared with the apical part during so-called diastole,the Max(D) in the central and basal parts was bigger by 9% and26%, respectively; however, the Min(S) during so-called systolewas smaller in C and B, i.e. only 3% and 11%, respectively (Fig. 2;shaded blue area). This indicated much more dilatation in thecentral and basal parts during the apical end-systolic phase, theincrease of which was 32% (part C) and 73% (part B). Thus, thecontraction of the LV wall was not equal, indicating that the apicalcontraction promoted the rather ‘‘systolic’’ dilatation, particularlyin the basal part.
Moreover, central diameter [Min(S)] (Fig. 2, middle; red line)was transiently less than that of the apical part (green line) duringthe late systolic phase, indicating the ‘‘systolic extrudingdeformation’’ toward the LV cavity. Also, it should be mentionedthat the central and basal PW were still continuing to thicken
Please cite this article in press as: Tanaka M, et al. Deformability of thresolution ultrasonic methods. J Cardiol (2016), http://dx.doi.org/10
beyond the IR, while the diameters of these parts were increasingat the same time.
Time serial change of the internal diameter in the LV (Fig. 2, bottom)
The difference in the diameter between the apical (green line)and the basal parts (blue line) was about 10 mm in the IC period,but it decreased rapidly to about 3.5 mm in the RF period (bluecolor area). The nearly parallel movement of these two lines wasdue to volume change and was regarded as the ‘‘bellows-likedeformation’’ during the LV contraction.
Thereafter, this difference rapidly increased toward the SFperiod due to the LV filling (orange color area) followed by thegentle expansion of all parts.
Among them, it is of note that there was a rather rapid increasein the diameter of part C, which indicated the prompt recoveryfrom the extruding deformation described above, which will berelated to the RF described below.
When the thickness in the basal part of the PW was at themaximum during the LRF the apical and central parts were at theminimum (Fig. 2, top), indicating the inevitable expansion of theseparts.
Changes in the mitral valve ring diameter (MRD) and the valve ring
movement (displacement: MRM)
Changes in the diameter (brown line in Fig. 2, bottom; MRD)
The MRD increased in average from ca 15.4 mm in the IC to ca25.0 mm in the end of the early RF (ERF) during Ej (ca 61% increase).
e pulsating left ventricular wall: A new aspect elucidated by high.1016/j.jjcc.2016.02.009
M. Tanaka et al. / Journal of Cardiology xxx (2016) xxx–xxx6
G Model
JJCC-1263; No. of Pages 9
Then, it rapidly deceased during the late RF (ca 18 mm; about 40%)followed by the further decrease (about 20%) toward the next IC.
Systolic increment of the MRD resulted in the increase in thesurface area of the valve ring and then the volume of the left atrium(LA). The change in the ring configuration from circular to oval andthe rapid upward movement of the ring during the RF caused theLV swallowing action to the intra-atrial blood. This is the ‘‘pouchlike’’ action (Fig. 4).
Displacement of the posterior part of the mitral valve ring (MRM)
The mitral ring moved ca 15 mm downward during the Ej(yellow line in Fig. 2, bottom) and reached the lowest level at theearly RF (Fig. 4B–B0, a part of the bellows action). At this time, themaximum contraction of the central part in the PW appeared.When the muscle showed the maximal contraction in the basalpart, rapid upward movement of the ring accompanied with therapid expansion of the central part of the LV occurred during the RF(recovering from the extruding deformation of the LV) and reachedthe upper level at the end of the late RF. Then the maximumdisplacement (ca 24 mm) was seen at the atrial contraction (AC).
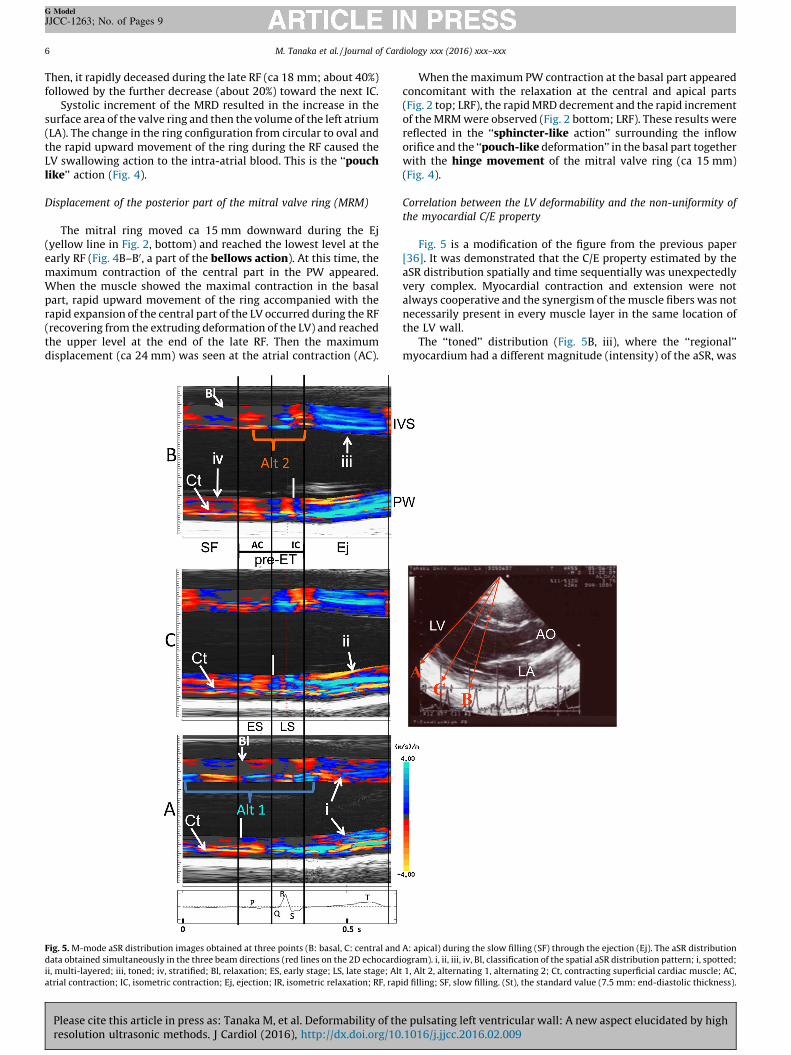
Fig. 5. M-mode aSR distribution images obtained at three points (B: basal, C: central and
data obtained simultaneously in the three beam directions (red lines on the 2D echocard
ii, multi-layered; iii, toned; iv, stratified; Bl, relaxation; ES, early stage; LS, late stage; Alt
atrial contraction; IC, isometric contraction; Ej, ejection; IR, isometric relaxation; RF, rap
Please cite this article in press as: Tanaka M, et al. Deformability of thresolution ultrasonic methods. J Cardiol (2016), http://dx.doi.org/10
When the maximum PW contraction at the basal part appearedconcomitant with the relaxation at the central and apical parts(Fig. 2 top; LRF), the rapid MRD decrement and the rapid incrementof the MRM were observed (Fig. 2 bottom; LRF). These results werereflected in the ‘‘sphincter-like action’’ surrounding the infloworifice and the ‘‘pouch-like deformation’’ in the basal part togetherwith the hinge movement of the mitral valve ring (ca 15 mm)(Fig. 4).
Correlation between the LV deformability and the non-uniformity of
the myocardial C/E property
Fig. 5 is a modification of the figure from the previous paper[36]. It was demonstrated that the C/E property estimated by theaSR distribution spatially and time sequentially was unexpectedlyvery complex. Myocardial contraction and extension were notalways cooperative and the synergism of the muscle fibers was notnecessarily present in every muscle layer in the same location ofthe LV wall.
The ‘‘toned’’ distribution (Fig. 5B, iii), where the ‘‘regional’’myocardium had a different magnitude (intensity) of the aSR, was
A: apical) during the slow filling (SF) through the ejection (Ej). The aSR distribution
iogram). i, ii, iii, iv, Bl, classification of the spatial aSR distribution pattern; i, spotted;
1, Alt 2, alternating 1, alternating 2; Ct, contracting superficial cardiac muscle; AC,
id filling; SF, slow filling. (St), the standard value (7.5 mm: end-diastolic thickness).
e pulsating left ventricular wall: A new aspect elucidated by high.1016/j.jjcc.2016.02.009

M. Tanaka et al. / Journal of Cardiology xxx (2016) xxx–xxx 7
G Model
JJCC-1263; No. of Pages 9
observed in the Ej, resulting in the monotonous deformation of thebasal PW and IVS.
The ‘‘multi-layered’’ distribution (Fig. 5C, ii) showed thesimultaneously contracting and extending muscles. Namely, theopposite aSR was piled up on the other. This was observed in theapical and central PW during the IC and the Ej.
Of the mixed pattern, the ‘‘spotted’’ distribution (Fig. 5A, i)appeared during the Ej in the apical part, and the ‘‘stratified’’distribution (Fig. 5B, iv) was seen in the SF.
In between SR(+) and SR(�), there was the widely spreaddistribution Bl (black zone), where neither contraction norextension was observed. Namely, the muscle fiber was nearly orcompletely relaxed (real relaxation) during either diastole or evensystole. Thus the myocardial muscles essentially had non-uniformactivities.
Discussion
Since the era of M-mode echocardiography, we have noticedthat the timings of the maximal systolic contraction of either theIVS or the PW are not simultaneous [36] and usually the peak ofintrusion of the PW into the LV is slightly delayed. Such a non-uniform change in the length or thickness of the myocardial fiberwas verified in the present study. In fact, this induces the distortionof the myocardial tissue [35,36] and so deforms the wall [1,2].
This deformation is three-dimensional, therefore, the numerousshort-axis sections perpendicular to the long-axis plane were threedimensionally stocked from the apex to the base and theseconstituted the fundamental measurement source of the presentstudy. The study of the macroscopic (muscle layer) and themicroscopic (muscle fiber) levels afore-mentioned [8,27,30]disclosed three types of deformation named (1) basic, (2)combined, and (3) integrated deformations which constitute theLV wall dynamics.
The significance of the basic deformation (Figs. 3 and 4)
The macroscopic study included the change in the LV wall andthe mitral valve deformity. First, the thickness change in the IVSwas slight, whereas change in the free wall (represented by thePW) was quite different.
Namely, the wall thickening was concentric and monotonous atthe apical part, while it was biphasic in the basal part (Fig. 3,bottom). Furthermore, the behavior of the central part was inbetween them, i.e. the extruded deformation toward the LV cavityduring systole followed by the brisk rebound during diastole.
It is of note that, contrary to expectation, the ‘‘systolicthickening’’ and the ‘‘diastolic thinning’’ of the LV wall do notnecessarily indicate the classically defined ‘‘systole’’ and ‘‘diasto-le’’, respectively. At the time of the apical thickening, whichstarted prior to the classical systole, the basal part showedthinning even during classical systole. Also, the division of thecontraction and the extension differs depending on the part of theLV wall. During classical systole, both contraction and extensionin the LV wall coexisted. Also during classical diastole, the samewas true, i.e. the LV extension and contraction co-existed.Therefore, the division of the systole and diastole in a sense ofclassic cardiac physiology is nothing but the clinical use, i.e.electrocardiogram, direct or indirect pressure tracings or heartsounds and phonocardiogram.
The simultaneous LV internal diameter change observed in thelong-axis section was also important. Concomitant with thesystolic downward displacement of the lateral side of the mitralring and the enlarged circular deformation, there was the extrudedPW deformation of the central part toward the LV cavity (Fig. 4).
Please cite this article in press as: Tanaka M, et al. Deformability of thresolution ultrasonic methods. J Cardiol (2016), http://dx.doi.org/10
This was associated with the greatly enlarged internal diameterof the basal part which helped the bellows action described below.In the late systole, the decreased valve ring diameter and theabrupt upward displacement (sphincter movement) caused thepouch-like deformation.
The basal part played an important role. Combined with thelarge change in the internal diameter on the one hand andrelatively small thickness change on the other hand, this partworks just like the controller for blood flow volume and structurewith high mechanical efficiency regarding the LV function. Thisimportance, however, has not been discussed yet by anyone.
The apical part played an important role as the generator andcontroller of the intra-ventricular pressure. This was evidenced bythe big thickness change and relatively small diameter change.
The work of the central part (mid-ventricular portion) was justlike the hinge of the PW movement. In between the apical andbasal parts, the accelerating ejection was enhanced by its ‘‘bellowslike’’ effect, and also the suction effect [36] for the mitral inflowwas introduced by the extrusion during the RF phase.
The significance of the combined deformation
This is just like an extended spectrum of the basal deformationby adding the microscopic C-R/E properties using the aSR.
Peristaltic deformation
This peristaltic deformation is confirmed by the apical to basaltransition of the contraction with the appropriate time lag (210 msin the normal case) (Fig. 2). This is reasonable to understand thesqueezing effect of the LV during the systolic phase [32] and thesuction effect in the diastolic phase [36].
Bellows-like deformation
The aSR study disclosed that in the Ej phase, the contraction ofthe PW progressed from the epicardial side to the endocardial sideand that of the IVS, from the right ventricular (RV) side to the LVside. The extrusion of the central PW into the LV cavity and thevarious mitral ring movements, both assist the eccentric deforma-tion (Fig. 6, Ej), resulting in the bellows-like movement which givesthe forceful LV ejection [32] (the area filled with the blue color inFig. 2).
Pouch-like deformation
In the late Ej and post-ET period (basal contraction and apicalextension coexist), the special form of the deformation named‘‘pouched-like’’ was seen [35,36] (Fig. 6 LS-ERF, LRF). Thereafter,the rapid LV dilatation occurs by the movement of the apical andthe central parts (Fig. 6 LRF-SF). Meanwhile, the paravalvularmuscle acts as the sphincter to the inflow orifice which occurs withthe elliptical deformation of the mitral ring. This rather uniquepouch-like deformation is valuable to swallow the mitral inflow bythe sucking effect of the LV [37] during the RF (Fig. 6 SF).
The integrated deformation
As previous reports stated [35,37], the cardiac cycle iscomposed of four phases. The overlap of the contraction and theextension exists, and in total, the length of contraction andextension is equal. The overall deformation is the integrateddeformation, as schematically shown in Fig. 6, and which isbrought up en bloc on the right column.
Fig. 6 shows the sequence of the wall movement due to thedeformation. In the right column, blue arrows indicate the
e pulsating left ventricular wall: A new aspect elucidated by high.1016/j.jjcc.2016.02.009

Fig. 6. Schematic representation of the LV deformability in the longitudinal section plane during a cardiac cycle. Left column shows the propagating process of the contraction
(blue thick arrows), and middle column, the extension (red thick arrows) propagate from the apical to the basal parts. Yellow area, extending area; brown area, contracting
area; orange area, tension area; blue thick arrows, magnitude of contraction; red thick arrows, magnitude of extension; black arrows, direction and magnitude of
displacement of the wall; thick black arrow T, circumferential tension; light blue arrow P, local pressure change; black arrow F, flow direction; AC, atrial contraction; IC,
isometric contraction; Ej, ejection; SF, slow filling; LS-ERF, late systole-early rapid filling; LRF, late rapid filling. Right column: En bloc diagram is the overlapping display of the
LV in the early systole and diastole showing the integrated deformation of the LV wall during a cardiac cycle. Periodical and reciprocal deformations between the apical and
the basal parts are demonstrated. The horizontal dotted line passing through the center signifies an imaginary boundary line of the reciprocal deformation. Details: see the
text. Yellow area; extending area, brown area, contracting area; red arrow, deforming direction and magnitude of the LV wall in diastole; blue arrow, deforming direction and
magnitude of the LV wall in systole; LV, left ventricular; PW, posterior wall; IVS, inter-ventricular septum; horizontal dotted line, imaginary boundary line; AV, aortic valve;
MV, mitral valve.
M. Tanaka et al. / Journal of Cardiology xxx (2016) xxx–xxx8
G Model
JJCC-1263; No. of Pages 9
simultaneous apical contraction and the basal extension duringsystole, and red arrows, the simultaneous basal contraction andthe apical extension during diastole. In between, the dotted lineindicates the imaginary boundary zone crossing the central part.
In total, the concrete results of the present study substantiallydiffer from the ordinary physiological concept of LV wall motion.
The LV pressure (P) develops by contraction when the internaldiameter decreases (Fig. 6 IC). Simultaneously, however, the basalpart dilates producing a large eddy flow in the basal area [32](symbol F in Fig. 6 IC). Successively, the contractions of the centraland basal parts (extruding of the PW) conduct LV ejection (Fig. 6Ej), and also result in the apical extension (Fig. 6 LS-ERF). Theprogressive LV dilatation (pouch-like deformation) (Fig. 6 LRF) isfollowed by the successive and gentle extension (Fig. 6 SF) and thenthe atrial contraction (Fig. 6 AC).
Whenever this reciprocal deformation occurs periodicallyduring a cardiac cycle, the profile of the LV dynamics will be justlike that of a rotary pump with continuous circular movementwithout any pause or any overload in any specific part. It mightplay an important role in preventing sudden changes in LV functionin either pressure, volume, or heart rate. A disorder of thisdeformation may produce various mechanical dysfunctions justlike the takotsubo cardiomyopathy, although further studies arenecessary to obtain clinical implications.
Please cite this article in press as: Tanaka M, et al. Deformability of thresolution ultrasonic methods. J Cardiol (2016), http://dx.doi.org/10
Study limitations
First, the small number of subjects makes it impossible togeneralize our results and precludes strong statistical conclusions,although a self-controlled design in this study may have made theresults more reliable. The subjects are presumably healthy adults,but a small effect from age differences may not be excluded. Also, itmay be more accurate to present high-resolution movie images tobetter understand the results.
Second, both of the present technologies of ‘‘phase differencetracking method in ultrasound’’ and ‘‘high frame rate 2Dechocardiography’’ have not been widely used because they weredeveloped in our laboratory. Therefore, the present results mightnot be easy to acknowledge particularly to those who adhere to thetraditional physiological concept, although the present study doesnot necessarily deny the previous noninvasive studies.
Third, we did not refer to or compare with the large amount ofliterature, and could not refer to a comparative study. We postponeour final conclusions.
Conclusions
By using the high frame rate 2D echocardiography and the aSRdistribution developed by us, the deformability of the LV
e pulsating left ventricular wall: A new aspect elucidated by high.1016/j.jjcc.2016.02.009

M. Tanaka et al. / Journal of Cardiology xxx (2016) xxx–xxx 9
G Model
JJCC-1263; No. of Pages 9
throughout the cardiac cycle was investigated. We found that thenon-uniformity of the myocardial contraction and the axial strainrate (aSR) distribution of the myocardial fibers were the principaldeterminants of LV deformability. Based on these observations, thefollowing three types of deformations were established, i.e. basic,combined, and integrated deformations. The integrated deforma-tion seemed to have the identical mechanism to a rotary pump andwas regarded as the final feature of the smooth, tireless, and quiteefficient cardiac beat.
Funding
This research received no grant from any funding agency in thepublic, commercial, or not-for-profit sectors.
Conflict of interest
The authors declare that there is no conflict of interest.
References
[1] Brutsaert DL. Nonuniformity: a physiologic modulator of contraction andrelaxation of the normal heart. JACC 1987;9:341–8.
[2] Brutsaert DL, Sys SU. Relaxation and diastole of the heart. Physiol Rev1989;69:1228–315.
[3] Schoephoerster RT, Silva CL, Ray G. Evaluation of left ventricular functionbased on simulated systolic flow dynamics computed from regional wallmotion. J Biomech 1994;27:125–36.
[4] Bogaert J, Rademakers FE. Regional nonuniformity of normal adult human leftventricle. Am J Physiol Heart Circ Physiol 2001;280:610–20.
[5] Shapiro E, Marier DL, St John Sutton MG, Gibson DG. Regional non-uniformityof wall dynamics in normal left ventricle. Br Heart J 1981;45:264–70.
[6] Miyatake K, Yamagisi M, Tanaka N, Uematsu M, Yamazaki N, Mine Y, Sano A,Hirama M. New method for evaluation of left ventricular wall motion bycolor-coded tissue Doppler imaging: in vitro and in vivo study. JACC1995;25:717–24.
[7] Tanaka M. Usefulness of ultrasonic imaging in medical field. In: Shimizu H,Chubachi N, Kushibiki J, editors. Acoustical imaging, vol. 17. New York:Plenum Press; 1989. p. 453–66.
[8] Tanaka M. Historical perspective of the development of echocardiography andmedical ultrasound. In: Schneider SC, Levy M, McAvoy BR, editors. Proceedingsof the IEEE Ultrasonics Symp., 2002 IEEE, vol. 2. New York: IEEE Inc.; 1998. p.1517–24. Available: http://www.ieee-uffc.orig/ultrasonics/teaching/us0000.pdf.
[9] Sato Y, Maruyama A, Ichihashi K. Myocardial strain of the left ventricle innormal children. J Cardiol 2012;60:145–9.
[10] Nishimura K, Okayama H, Inoue K, Saito M, Yoshii T, Hiasa G, Sumimoto T,Inaba S, Ogimoto A, Funada J, Higaki J. Direct measurement of the radial strainin the inner-half layer of the left ventricular wall in hypertensive patients. JCardiol 2012;59:64–71.
[11] Suzuki K, Akashi Y, Mizukoshi K, Kou S, Takai M, Izumo M, Hayashi A, Ohtaki E,Nobuoka S, Miyake F. Relationship between left ventricular ejection fractionand mitral anuular displacement derived by speckle tracking echocardiogra-phy in patients with different heart diseases. J Cardiol 2012;60:55–60.
[12] Arts T, Veenstra PC, Reneman RS. Epicardial deformation and left ventricularwall mechanics during ejection in the dog. Am J Physiol 1982;243:H379–90.
[13] Myers JH, Stirling MC, Choy M, Buda AJ, Gallager KP. Direct measurement ofinner and outer wall thickening dynamics with epicardial echocardiography.Circulation 1986;74:164–72.
[14] Sabbah HN, Marzilli M, Stain PD. The relative role of subendocardium andsubepicardium in left ventricular mechanics. Am J Physiol Heart Circ Physiol1981;240:920–7.
[15] Gallagher KP, Osakada G, Matuzaki M, Miller M, Kemper WS, Ross Jr J. Non-uniformity of inner and outer systolic wall thickening in conscious dogs. Am JPhysiol Heart Circ Physiol 1985;249:241–8.
Please cite this article in press as: Tanaka M, et al. Deformability of thresolution ultrasonic methods. J Cardiol (2016), http://dx.doi.org/10
[16] Derumeaux G, Ovize M, Loufoua J, Pontier G, Andre-Fouet X, Gribier A.Assessment of nonuniformity of transmural myocardial velocity by color-coded tissue Doppler imaging: characterization of normal, ischemic, andstunned myocardium. Circulation 2000;101:1390–5.
[17] Kilner PJ. Our tortuous heart in dynamic mode – an echocadiographic studyof mitral flow and movement in exercising subjects. Heart Vessels 1997;12:103–10.
[18] Watanabe H, Hisada T, Sugiura S, Okada J, Fukunari H. Computer simulation ofblood flow, left ventricular motion and their interrelationship by fluid-struc-ture interaction finite element method. JSMEJC 2002;45:1003–12.
[19] Ishida N, Takishima T. Dynamics of the myocardium. In: Ishida N, Takishima T,editors. Cardiodynamics and its clinical application. 2nd ed., Tokyo: Bunkodo;1992. p. 1–63.
[20] Braunwald E, Sonnenblick EH, Ross Jr J. Contraction of the normal heart. In:Braunwald E, editor. Heart disease. 2nd ed., Philadelphia: WB Saunders; 1984.p. 409–46.
[21] Matsumoto T, Komori R, Mashima H. The functional morphology of the heart &mechanical performance of the myocardium. In: Matsuda K, editor. Physiol-ogy of circulation: Japanese handbook of physiology, vol. III. Tokyo: IgakushoinLtd.; 1969. p. 70–147.
[22] Barnett VA. Cardiac myocytes. In: Iaizzo PA, editor. Physiology and devices:handbook of cardiac anatomy. Part III. New Jersey: Humana Press; 2005. p.113–21.
[23] Sonnenblick EH, Ross Jr J, Covell JW, Spotnitz HM, Spiro D. The ultrastructure ofthe heart in systole and diastole: changes in sarcomer length. Circ Res1967;21:423–31.
[24] Rushmer RF. Functional anatomy and control of the heart. In: Rushmer RF,editor. Cardiovascular dynamics. 4th ed., Philadelphia: WB Saunders; 1970. p.76–131.
[25] Tanaka M, Kanai H, Sato M, Chubachi N. Measurement of the moving speed oflocal myocardial tissue by using the phase difference tracking method and itsclinical significance. J Cardiol 1996;28(Suppl.):163.
[26] Kanai H, Hasegawa H, Chubachi N, Koiwa Y, Tanaka M. Non-invasive evalua-tion of spatial distribution of local instantaneous strain energy in heart wall.In: Lees S, Ferrari LA, editors. Acoustic imaging, vol. 23. New York: PlenumPress; 1997. p. 187–92.
[27] Kanai H, Hasegawa H, Chubachi N, Koiwa Y, Tanaka M. Noninvasive evaluationof local myocardial thickening and its color-coded imaging. IEEE Trans Ultra-son Ferroelectr Freq Control 1997;44:752–68.
[28] Kanai H, Tanaka M. Minute mechanical-excitation wave-front propagation inhuman myocardial tissue. J Appl Phys 2011;50. 07HAO1-7.
[29] Yoshiara H, Hasegawa H, Kanai H, Tanaka M. Ultrasonic imaging of propaga-tion of contraction and relaxation in heart walls at high temporal resolution. JAppl Phys 2007;46:4889–96.
[30] Ohtsuki S, Tanaka M. The flow velocity distribution from the Doppler infor-mation on a plane in three-dimensional flow. J Vis 2006;9:69–82.
[31] Ohtsuki S, Tanaka M. Doppler pressure field deduced from the Dopplervelocity field in an observation plane in a fluid. Ultrasound Med Biol2003;29:1431–8.
[32] Tanaka M, Sakamoto T, Sugawara S, Nakajima H, Katahira Y, Ohtsuki S,Kanai H. Blood flow structure and dynamics, and ejection mechanism inthe left ventricle: analysis using echo-dynamography. J Cardiol 2008;52:86–101.
[33] Tanaka M. In: Tanaka M, editor. Ultrasonic diagnosis of the heart. 1st ed.,Tokyo: Medic ElectroTimes; 1978.
[34] Tanaka M, Dunn F. Acoustic properties of the fibrous tissue in myocardium anddetectability of the fibrous tissue by echo method. In: Dunn F, Tanaka M,Ohtsuki S, Saijo Y, editors. Ultrasonic tissue characterization. Tokyo: Springer-Verlag; 1996. p. 231–43.
[35] Tanaka M, Sakamoto T, Sugawara S, Katahira Y, Tabuchi H, Nakajima H,Kurokawa T, Kanai H, Hasagawa H, Ohtsuki S. A new concept of the contrac-tion-extension property of the left ventricular myocardium. J Cardiol 2014;63:313–9.
[36] Tanaka M, Sakamoto T, Katahira Y, Tabuchi H, Nakajima H, Kurokawa T, KanaiH, Hasegawa H, Ohtsuki S. Non-uniform distribution of the contraction/extension (C-E) in the ventricular myocardium related to the myocardialfunction. J Cardiol 2014;64:401–8.
[37] Tanaka M, Sakamoto T, Sugawara S, Nakajima H, Kameyama T, Tabuchi H,Katahira Y, Ohtsuki S, Kanai H. Physiological basis and clinical significance ofleft ventricular suction studied using echo-dynamography. J Cardiol 2011;58:232–44.
e pulsating left ventricular wall: A new aspect elucidated by high.1016/j.jjcc.2016.02.009