Embed Size (px)
Citation preview

Article
Journal of Building Physics
1–20
� The Author(s) 2015
Reprints and permissions:
sagepub.co.uk/journalsPermissions.nav
DOI: 10.1177/1744259115589680
jen.sagepub.com
Temperature andmoisture storage incrop-based materials:Modelling a straw balewall subject to a thermalshock
Dubois Samuel1, Evrard Arnaud2,Blecker Christophe1 and Lebeau Frederic1
AbstractModelling the hygrothermal behaviour of crop-based insulation products is essential toassess their impact on the energy performance of the building, predict indoor climateconditions, and prevent any risk of unexpected degradation. Traditionally, transientnumerical models that predict internal conditions of construction materials considerthat the variation of moisture storage with temperature is negligible although the sorp-tion behaviour is known to be temperature dependent. This paper investigates this par-ticular effect for crop-based materials and uses a refinement of standard mathematicalrepresentations. For this purpose, the effects of a thermal shock on the evolution ofhygrothermal conditions inside a straw-bale wall are studied with several versions of aflexible research model. The latter is capable of incorporating the temperature depen-dency of the sorption curve with both a physically-based and an empirical description.A large climate chamber is used to gather experimental data and is able to host a full-size straw bale prefabricated panel. Internal conditions of straw bales are obtained withproper sensors bars. Results show that when large temperature gradients occur in acrop-based material, a model that considers temperature effect on moisture storageenhances greatly the prediction of internal conditions.
1Gembloux Agro-Bio Tech, Universite de Liege, Gembloux, Belgium
2Architecture et Climat, Universite Catholique de Louvain, Louvain-la-Neuve, Belgium
Corresponding author:
Dubois Samuel, Gembloux Agro-Bio Tech, Universite de Liege, Passage des Deportes 2, 5030 Gembloux,
Belgium.
Email: [email protected]
at Universite de Liege on July 1, 2015jen.sagepub.comDownloaded from

KeywordHAM modelling, Bio-based materials, Hygroscopicity, Thermal shock, Straw bale
Introduction
Straw bales have been successfully used as building material in the last century,either in load-bearing or infill techniques (King, 2006). Interest in this atypicalproduct has recently resurfaced mainly due to sustainability and health-relatedqualities (Cripps et al., 2004) associated with good thermal and acoustic perfor-mance (Fuchs et al., 2009; Shea et al., 2013). Moreover, such crop-based materialsare characterized by their moisture storage and exchange capacity, which may havea direct impact in terms of comfort and energy consumption (Madurwar et al.,2013; Osanyintola and Simonson, 2006). The extent of these phenomena is relatedto the porous structure of the material as the latter will determine the sorption andcapillary properties as well as heat and moisture transfer functions. An accurateprediction of the underlying physical phenomena is thus critical to assess the spe-cific advantages arising there from.
Heat, air and moisture (HAM) models were developed in order to predictcoupled heat and mass transfers in porous media. The use of non-linear partialdifferential equations (PDEs) with numerical solvers is the more accurate tech-nique to account for the complexity of highly hygroscopic products’ behaviour.Many available models are able to perform such computations and were com-pared in previous studies (Delgado et al., 2013; Hagentoft et al., 2004; Janssens etal., 2008). From the mathematical point of view, they differ mainly in the under-lying assumptions and resulting simplifications in the mathematical expressions.Additionally, some authors (Tariku et al., 2010; Van Schijndel, 2009) showedthat models developed in general computational software are attractive in termsof evolution potential and interoperability with other computational tools.Recently, Dubois et al. (2013) illustrated how a heat and moisture transfer modeldeveloped in the COMSOL Multiphysics software can be used to accuratelysimulate highly hygroscopic materials during a moisture buffer value evaluationtest. Now, this numerical tool can be further validated by confrontation to casestudies where materials are subject to strongly non-isothermal conditions. In fact,there are still very few validation studies in which hygroscopic materials are sub-ject to significant temperature gradients in literature related to HAM models.
One of the most frequent hypotheses in HAM models is to neglect the effect oftemperature on moisture storage (Hens, 2008). Most of them use a unique moist-ure storage curve (MSC) to express the relationship between equilibrium moist-ure content (EMC) and relative humidity (RH) in hygroscopic materials, afunction needed to solve the moisture balance equation. Exhaustive studiesrelated to moisture storage in wood and plant fibres can be found (Simpson,1980; Strømdahl, 2000; Time, 1998) and it is now widely accepted that the
2 Journal of Building Physics
at Universite de Liege on July 1, 2015jen.sagepub.comDownloaded from
variation of EMC with temperature exists in the hygroscopic domain and islinked to the thermodynamics of sorption. Hereafter, we aim to benefit from themodularity of the proposed heat and moisture transfer to test different moisturestorage descriptions in parallel and evaluate their efficiency when applied tocrop-based products modelling.
In this article, the modelling of a straw bales panel subjected to a thermal shockis investigated. The first part of the study describes the experimental set-up involv-ing a large scale climate chamber and specific sensors that are used to produce thevalidation data. In a second step, a research model is presented along with differentmethods for characterizing the sorption curve dependence on temperature. Amongthese techniques, an original method that relies on a single parameter definition isproposed. Finally, the experimental results are compared to the simulations of dif-ferent versions of the model, one for each technique described and a version with-out temperature effect on moisture storage.
Materials and methods
Test wall and hygrothermal sensors
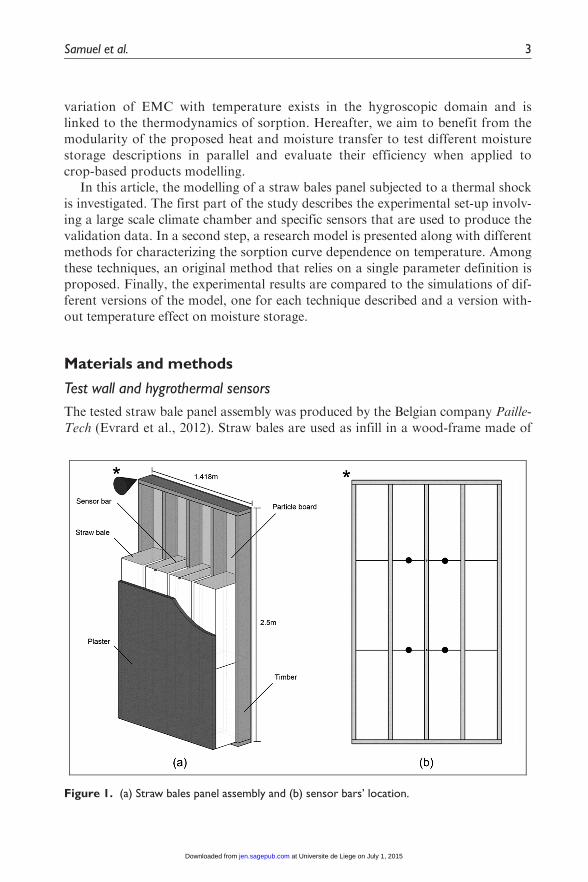
The tested straw bale panel assembly was produced by the Belgian company Paille-Tech (Evrard et al., 2012). Straw bales are used as infill in a wood-frame made of
Figure 1. (a) Straw bales panel assembly and (b) sensor bars’ location.
Samuel et al. 3
at Universite de Liege on July 1, 2015jen.sagepub.comDownloaded from
45-mm3 175-mm lumbers. Vertical studs are spaced at 345mm on centre withbales stacked vertically between them. The resulting preferential orientation ofstraws is parallel to wall depth. To complete the structure, the frame is braced onthe external side with breathable wood particle boards. On the internal side, thestraw bales are covered with a 40-mm earth plaster. The details of construction areshown in Figure 1(a).
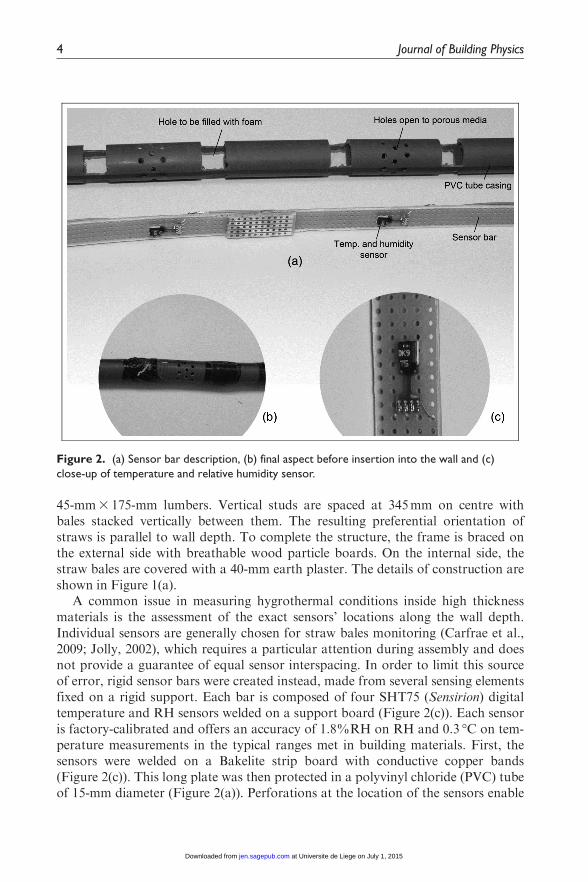
A common issue in measuring hygrothermal conditions inside high thicknessmaterials is the assessment of the exact sensors’ locations along the wall depth.Individual sensors are generally chosen for straw bales monitoring (Carfrae et al.,2009; Jolly, 2002), which requires a particular attention during assembly and doesnot provide a guarantee of equal sensor interspacing. In order to limit this sourceof error, rigid sensor bars were created instead, made from several sensing elementsfixed on a rigid support. Each bar is composed of four SHT75 (Sensirion) digitaltemperature and RH sensors welded on a support board (Figure 2(c)). Each sensoris factory-calibrated and offers an accuracy of 1.8%RH on RH and 0.3 �C on tem-perature measurements in the typical ranges met in building materials. First, thesensors were welded on a Bakelite strip board with conductive copper bands(Figure 2(c)). This long plate was then protected in a polyvinyl chloride (PVC) tubeof 15-mm diameter (Figure 2(a)). Perforations at the location of the sensors enable
Figure 2. (a) Sensor bar description, (b) final aspect before insertion into the wall and (c)close-up of temperature and relative humidity sensor.
4 Journal of Building Physics
at Universite de Liege on July 1, 2015jen.sagepub.comDownloaded from
the measurement. Finally, thermal insulation foam was injected between sensorsthrough large holes provided for this purpose and protected with plastic tape(Figure 2(b)).
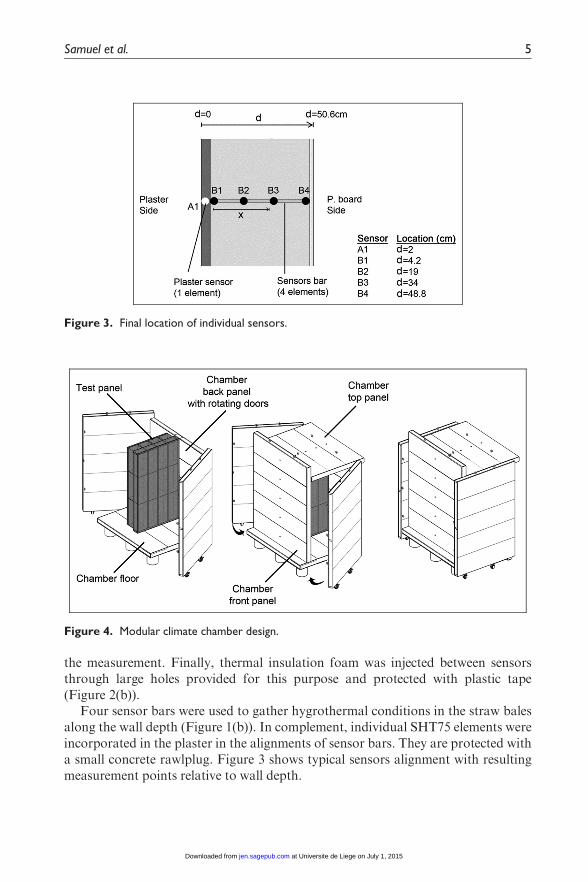
Four sensor bars were used to gather hygrothermal conditions in the straw balesalong the wall depth (Figure 1(b)). In complement, individual SHT75 elements wereincorporated in the plaster in the alignments of sensor bars. They are protected witha small concrete rawlplug. Figure 3 shows typical sensors alignment with resultingmeasurement points relative to wall depth.
Figure 3. Final location of individual sensors.
Figure 4. Modular climate chamber design.
Samuel et al. 5
at Universite de Liege on July 1, 2015jen.sagepub.comDownloaded from

Thermal shock in a controlled climate chamber
Various sizes of walls were planned to be tested with the device; therefore, the cli-matic chamber was made modular with a fixed base and some movable parts. Adiagram illustrating the operation of a test wall is shown in Figure 4. The positionof the floor and front chamber panels can be adjusted to fit the desired dimensions.Each structural panel composing the chamber is made from 100-mm3 38-mm tim-bers wood-frame closed with 18-mm oriented strand board (OSB) bracing.Extruded polystyrene provides thermal insulation and the inside surface is coveredwith a moisture barrier layer to avoid moisture movement from the inside air vol-ume. The chamber panels were firmly fixed around the test wall with multiple boltsand compressible air tight joints on contact area.
Once the back panel rotating doors are closed, two climates can be controlledand monitored on each side of the test wall. That is why the testing device can bereferred to as a ‘Bi-climatic chamber’ (Figure 5). It offers opportunities for 1Danalysis of the wall assembly and was designed to impose various climatic schemes:realistic conditions or more artificial solicitations among which are hydric or ther-mal shocks. Here, a 2-kW pulsed air heater was placed in the ‘Climate A’ volumetogether with a proportional–integral–derivative (PID) control system. At thebeginning of the experiment, a temperature step was applied on the plaster side of
Figure 5. Bi-climatic system with heater on plaster side.
6 Journal of Building Physics
at Universite de Liege on July 1, 2015jen.sagepub.comDownloaded from
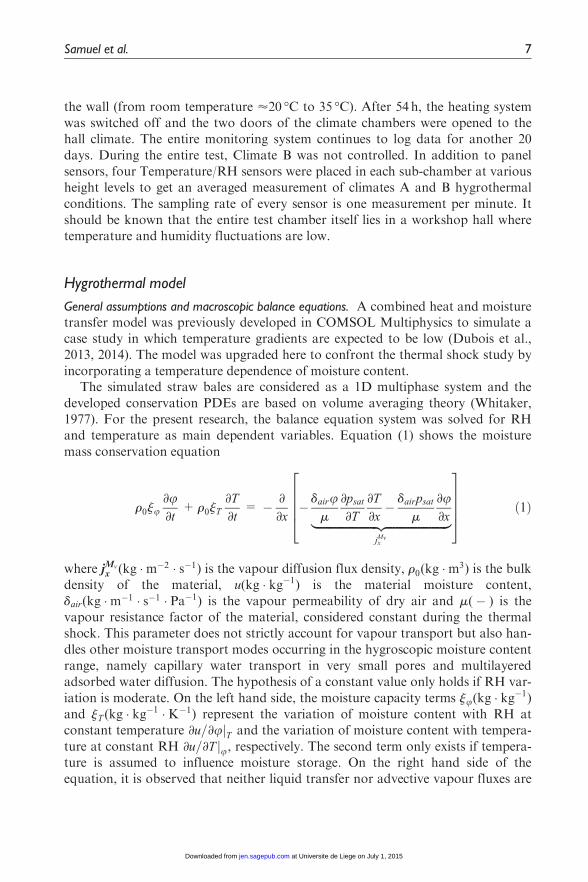
the wall (from room temperature ’20 �C to 35 �C). After 54 h, the heating systemwas switched off and the two doors of the climate chambers were opened to thehall climate. The entire monitoring system continues to log data for another 20days. During the entire test, Climate B was not controlled. In addition to panelsensors, four Temperature/RH sensors were placed in each sub-chamber at variousheight levels to get an averaged measurement of climates A and B hygrothermalconditions. The sampling rate of every sensor is one measurement per minute. Itshould be known that the entire test chamber itself lies in a workshop hall wheretemperature and humidity fluctuations are low.
Hygrothermal model
General assumptions and macroscopic balance equations. A combined heat and moisturetransfer model was previously developed in COMSOL Multiphysics to simulate acase study in which temperature gradients are expected to be low (Dubois et al.,2013, 2014). The model was upgraded here to confront the thermal shock study byincorporating a temperature dependence of moisture content.
The simulated straw bales are considered as a 1D multiphase system and thedeveloped conservation PDEs are based on volume averaging theory (Whitaker,1977). For the present research, the balance equation system was solved for RHand temperature as main dependent variables. Equation (1) shows the moisturemass conservation equation
r0ju∂u∂t
+ r0jT
∂T
∂t= � ∂
∂x� dairu
m
∂psat
∂T
∂T
∂x� dairpsat
m
∂u∂x|fflfflfflfflfflfflfflfflfflfflfflfflfflfflfflfflfflfflfflfflfflffl{zfflfflfflfflfflfflfflfflfflfflfflfflfflfflfflfflfflfflfflfflfflffl}
jMvx
26664
37775 ð1Þ
where jMv
x (kg �m�2 � s�1) is the vapour diffusion flux density, r0(kg �m3) is the bulkdensity of the material, u(kg � kg�1) is the material moisture content,dair(kg �m�1 � s�1 � Pa�1) is the vapour permeability of dry air and m(� ) is thevapour resistance factor of the material, considered constant during the thermalshock. This parameter does not strictly account for vapour transport but also han-dles other moisture transport modes occurring in the hygroscopic moisture contentrange, namely capillary water transport in very small pores and multilayeredadsorbed water diffusion. The hypothesis of a constant value only holds if RH var-iation is moderate. On the left hand side, the moisture capacity terms ju(kg � kg�1)and jT (kg � kg�1 �K�1) represent the variation of moisture content with RH atconstant temperature ∂u=∂ujT and the variation of moisture content with tempera-ture at constant RH ∂u=∂T ju, respectively. The second term only exists if tempera-ture is assumed to influence moisture storage. On the right hand side of theequation, it is observed that neither liquid transfer nor advective vapour fluxes are
Samuel et al. 7
at Universite de Liege on July 1, 2015jen.sagepub.comDownloaded from

accounted for as they are assumed to play only a little role during the simulatedheat shock.
Applying the law of conservation of heat, the enthalpy change in an averagedvolume element is determined by the divergence of heat conduction flux density,by sensible heat transport and by latent heat involved in the phase change process
∂H∂t
= ∂∂x
leff
∂T
∂x
� �|fflfflfflfflffl{zfflfflfflfflffl}Conduction
� jMv
x � cv
∂T
∂x|fflfflfflfflfflffl{zfflfflfflfflfflffl}Sensible heat
� _m Qstð Þ|fflfflffl{zfflfflffl}latent heat
ð2Þ
where H(J �m�3) is the enthalpy, _m(kg �m�3 � s�1) is the phase change rate, leff isthe effective thermal conductivity of the material and Qst(J � kg�1) is the amount ofenergy involved in the sorption process, known as the isosteric heat of sorption.Under the assumption that moisture storage in vapour phase is negligible comparedto liquid phase, the phase change rate term is equal to the vapour flux divergence.The effective thermal conductivity is considered constant during the thermal shock,and its value was chosen to account for an average value met during the thermalshock. By developing the enthalpy term, the heat balance equation becomes
∂ r0c0 T � T0ð Þ+ r0ucl T � T0ð Þð Þ∂t
=∂
∂xleff
∂T
∂x
� �� jMv
x � cv
∂T
∂x� ∂jMv
x
∂x� Qstð Þ ð3Þ
Finally, with additional transformations and the assumption that sensible heattransport is negligible in comparison to latent heat, the heat balance equationbecomes
r0 c0 + ucl + jT cl(T � T0)ð Þ ∂T
∂t+ r0ju
∂u∂t
cl T � T0ð Þ= ∂
∂xleff
∂T
∂x
� �� ∂jMv
x
∂xQstð Þ
ð4ÞTemperature effect on moisture storage. When water molecules are absorbed on theinner porous structure, some heat of sorption is released, and a correspondingamount of energy is required to desorb it. This enthalpy change is greater than theheat of vapourization of free water L(J � kg�1), and the difference is expressed asthe differential heat of sorption or net isosteric heat qst(J � kg�1)=Qst � L. Thisquantity depends on the moisture content because successive water molecule layersshow different bonding energy to the solid matrix of the material. One of the meth-ods to determine this function is based on the Clausius–Clapeyron (CC) formula(Skaar, 1972). With a minimum of two sorption curves data sets, measured at dif-ferent temperatures, we have
qst(u)=RvlnuT1(u)
uT2(u)
� �T1T2
T1 � T2
� �ð5Þ
where Rv(J � kg�1 �K�1) is the water vapour specific gas constant and uT1(u) anduT2(u) are the sorption isotherms at temperatures T1 and T2, respectively. From this
8 Journal of Building Physics
at Universite de Liege on July 1, 2015jen.sagepub.comDownloaded from
equation, it is easily observed that the EMC increases with decreasing temperaturewith a maximum at 0 �C (Cudinov and Andreev, 1978).
Sorption curves of straw bales were measured on the 0%RH–90%RH range at23 �C and 35 �C with a dynamic vapour sorption (DVS) apparatus. This devicewas precisely parameterized to account for the specific equilibrium time observedfor the straw material for each temperature. The Oswin moisture storage function(Oswin, 1946) was then fitted on resulting (ui, ui) experimental points. It offers acontinuous expression of moisture content in dependence with RH
u(u)=C3u
1� u
� �n
ð6Þ
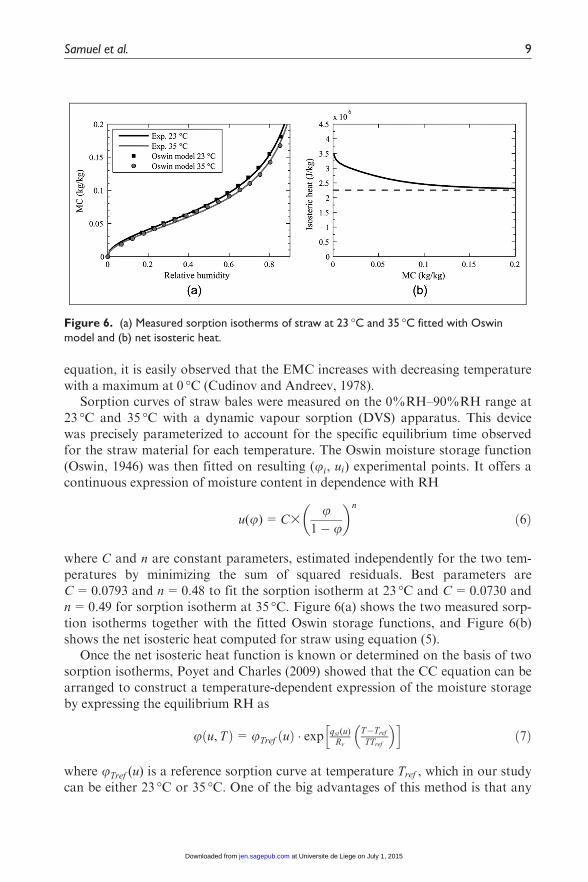
where C and n are constant parameters, estimated independently for the two tem-peratures by minimizing the sum of squared residuals. Best parameters areC=0.0793 and n=0.48 to fit the sorption isotherm at 23 �C and C=0.0730 andn=0.49 for sorption isotherm at 35 �C. Figure 6(a) shows the two measured sorp-tion isotherms together with the fitted Oswin storage functions, and Figure 6(b)shows the net isosteric heat computed for straw using equation (5).
Once the net isosteric heat function is known or determined on the basis of twosorption isotherms, Poyet and Charles (2009) showed that the CC equation can bearranged to construct a temperature-dependent expression of the moisture storageby expressing the equilibrium RH as
u u, Tð Þ=uTref uð Þ � exp qst(u)Rv
T�Tref
TTref
� �h ið7Þ
where uTref (u) is a reference sorption curve at temperature Tref , which in our studycan be either 23 �C or 35 �C. One of the big advantages of this method is that any
Figure 6. (a) Measured sorption isotherms of straw at 23 �C and 35 �C fitted with Oswinmodel and (b) net isosteric heat.
Samuel et al. 9
at Universite de Liege on July 1, 2015jen.sagepub.comDownloaded from

model can be used to describe this reference isotherm. However, in order to solvethe heat shock case study, a continuous expression in the form u(u, T ) is desirable.Indeed, such ‘three-dimensional (3D)’ representation of the moisture content u
would provide values for moisture capacities in all combinations of temperatureand humidity conditions that are potentially met in the material. Unfortunately,equation (7) is not directly reversible and two different approaches were undertakento overcome this issue. These approaches result in two different descriptions of themoisture storage function u(u, T ), one is physically based and the other is purelyempirical.
The most physically accurate method is to create an arbitrary number of MSCsu(u, Ti) at different temperatures Ti using equation (7). Then, it is possible to obtainthe continuous u(u, T ) expression by linear interpolation between the reciprocal ofthese individual isotherms. This operation requires that 3D interpolation is avail-able in the numerical environment.
An interpolated ‘surface’, based on nine individual curves, is shown inFigure 7(a). As an illustration purpose, the two boundary isotherms, which corre-spond to 0 �C and 40 �C, are shown in Figure 7(b). We recall that only the adsorp-tion curve is considered in this work as hysteresis phenomena are assumed to benegligible in the heat shock working range.
The second modelling technique studied here is characterized by a simpler repre-sentation of temperature effect on moisture storage. In contrast to the physicallybased method embodied in equation (7), Keey (1978) proposed an empiricalexpression of thermal moisture capacity assuming a linear dependence on moisturecontent
Figure 7. (a) Temperature-dependent MSC constructed by linearization between nineisotherms and (b) theoretical MSCs of straw at 0 �C and 40 �C with physically based model andthe two experimental curves used to determine them.MSC: moisture storage curve.
10 Journal of Building Physics
at Universite de Liege on July 1, 2015jen.sagepub.comDownloaded from
∂u
∂T
u
= � A � u ð8Þ
According to Keey, the parameter A(K�1) lies between 0.005 and 0.01 for wood,for RH values in the 10%RH–90%RH range. On the basis of this simplifiedassumption, we propose to write the following expression for the temperature-dependent MSC
u u, Tð Þ= uTref uð Þ � 1� A T � Tref
� �ð9Þ
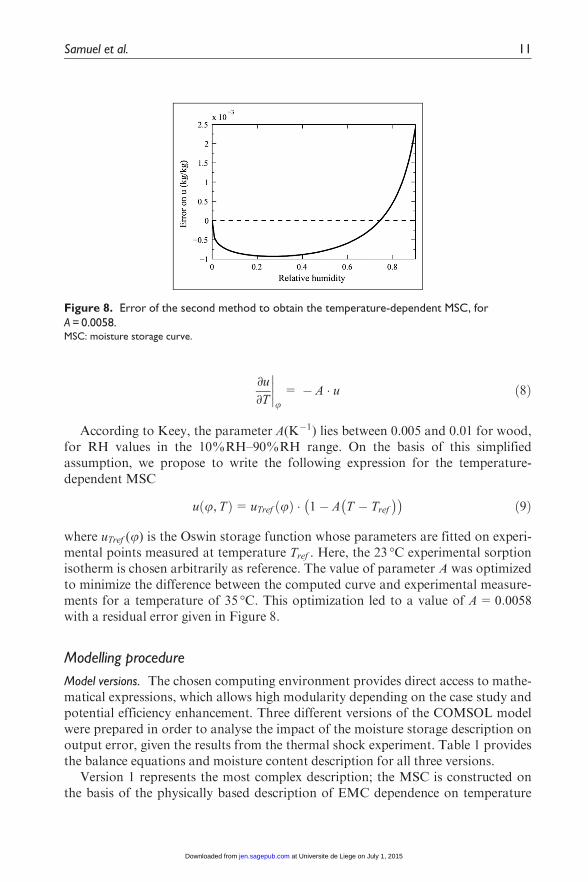
where uTref (u) is the Oswin storage function whose parameters are fitted on experi-mental points measured at temperature Tref . Here, the 23 �C experimental sorptionisotherm is chosen arbitrarily as reference. The value of parameter A was optimizedto minimize the difference between the computed curve and experimental measure-ments for a temperature of 35 �C. This optimization led to a value of A= 0:0058
with a residual error given in Figure 8.
Modelling procedure
Model versions. The chosen computing environment provides direct access to mathe-matical expressions, which allows high modularity depending on the case study andpotential efficiency enhancement. Three different versions of the COMSOL modelwere prepared in order to analyse the impact of the moisture storage description onoutput error, given the results from the thermal shock experiment. Table 1 providesthe balance equations and moisture content description for all three versions.
Version 1 represents the most complex description; the MSC is constructed onthe basis of the physically based description of EMC dependence on temperature
Figure 8. Error of the second method to obtain the temperature-dependent MSC, forA = 0.0058.MSC: moisture storage curve.
Samuel et al. 11
at Universite de Liege on July 1, 2015jen.sagepub.comDownloaded from
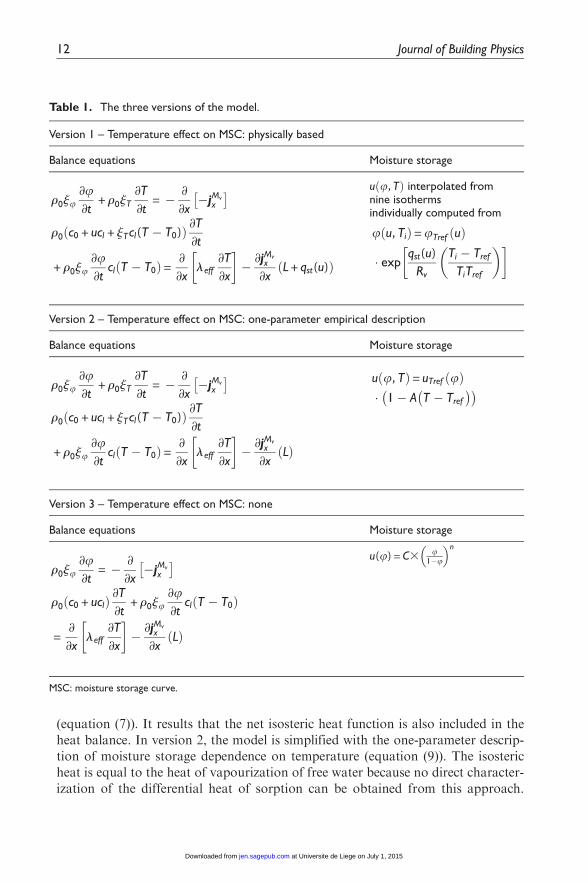
(equation (7)). It results that the net isosteric heat function is also included in theheat balance. In version 2, the model is simplified with the one-parameter descrip-tion of moisture storage dependence on temperature (equation (9)). The isostericheat is equal to the heat of vapourization of free water because no direct character-ization of the differential heat of sorption can be obtained from this approach.
Table 1. The three versions of the model.
Version 1 – Temperature effect on MSC: physically based
Balance equations Moisture storage
r0ju∂u∂t
+ r0jT
∂T
∂t= � ∂
∂x�jMv
x
� r0 c0 + ucl + jTcl(T � T0)ð Þ ∂T
∂t
+ r0ju∂u∂t
cl T � T0ð Þ =∂
∂xleff
∂T
∂x
� �� ∂jMv
x
∂xL + qst(u)ð Þ
u u, Tð Þ interpolated fromnine isothermsindividually computed from
u u, Tið Þ= uTref uð Þ
� expqst(u)
Rv
Ti � Tref
TiTref
� �� �
Version 2 – Temperature effect on MSC: one-parameter empirical description
Balance equations Moisture storage
r0ju∂u∂t
+ r0jT
∂T
∂t= � ∂
∂x�jMv
x
� r0 c0 + ucl + jTcl(T � T0)ð Þ ∂T
∂t
+ r0ju∂u∂t
cl T � T0ð Þ =∂
∂xleff
∂T
∂x
� �� ∂jMv
x
∂xLð Þ
u u, Tð Þ = uTref uð Þ� 1� A T � Tref
� �
Version 3 – Temperature effect on MSC: none
Balance equations Moisture storage
r0ju∂u∂t
= � ∂
∂x�jMv
x
� r0 c0 + uclð Þ ∂T
∂t+ r0ju
∂u∂t
cl T � T0ð Þ
=∂
∂xleff
∂T
∂x
� �� ∂jMv
x
∂xLð Þ
u(u) = C3 u1�u
� �n
MSC: moisture storage curve.
12 Journal of Building Physics
at Universite de Liege on July 1, 2015jen.sagepub.comDownloaded from

Finally, version 3 is characterized by the standard description found in most HAMsoftware packages, which is a single sorption isotherm. Similar to the version 2, theheat of sorption shows a simplified representation. It should be noted that all ver-sions are similar with regard to the description of heat and moisture transport.
Boundary and initial conditions. In order to reduce the number of parameters neededto solve the problem, it was decided to limit the study domain to the straw balematerial. The behaviours of the particle board and the plaster are not simulated.Dirichlet boundary conditions are thus applied to both extremities of the domainwith temperature and RH values measured just behind the plaster (sensor B1) andjust behind the particle board (sensor B4). Referring to Figure 3, we can write thefollowing expressions for boundary and initial conditions
u(t)=uB1(t)T (t)= TB1(t)
�x= 0m B1ð Þ ð10Þ
u(t)=uB4(t)T (t)= TB4(t)
�x= 0:45m B4ð Þ ð11Þ
u(x, 0)=u0(x)T (x, 0)= T0(x)
�0\x\0:45m ð12Þ
where ua(t) and Ta(t) are the actual RH and temperature time series measured atsensor a, respectively; u0(x) is the initial RH vector and T0(x) is the initial tempera-ture vector. The last two vectors are determined from initial temperature and RHmeasured at sensors B1, B2, B3 and B4.
Straw bales properties. For version 1 of the model, a total of eight material para-meter values (r0, c0, leff ,CT1, nT1,CT2, nT1,m) are needed in order to solve the heatand moisture balance equations (equations (1) and (4)) in the straw bale material,knowing the conditions imposed on its limits with B1 and B4 sensors. In order tosolve version 2 of the model, the value of parameter A is needed instead of two
Table 2. Straw bales parameters used in simulations.
Parameter Unit Value Method
r0 (kg �m�3) 100 Estimated from standard valuesc0 (J � kg�1 � K�1) 2426 DTAleff (W �m�1 � K�1) 0.08 Estimated from dry value (GHP)C23 8C (� ) 0.0793 DVSn23 8C (� ) 0.48 DVSC35 8C (� ) 0.0730 DVSn35 8C (� ) 0.49 DVSA (K�1) 0.0058 Estimated from DVSm (� ) 2 Estimated from literature
DTA: differential thermal analysis; GHP: guarded hot plate; DVS: dynamic vapour sorption.
Samuel et al. 13
at Universite de Liege on July 1, 2015jen.sagepub.comDownloaded from

Oswin parameters needed in version 1 to define a second isotherm. Finally, thethird version requires neither the definition of a second isotherm nor the value ofparameter A.
Measuring all those parameters can be particularly tricky because of the size ofstraw bales and the intrinsic variability they show. The parameters used during thedirect modelling approach are given in Table 2.
First, the bulk density is expected to be around the 80–120kg m23 range, but itis impossible to know the actual value for the straw bales incorporated in the panel.In consequence, the median value was implemented in simulations. The dry ther-mal capacity was determined by differential thermal analysis on a crushed samplepreviously dried. A guarded hot plate (GHP) apparatus designed for high thicknessspecimens (Dubois and Lebeau, 2013) was used to determine the dry thermal con-ductivity of an entire straw bale at 20 �C. With thermal flow parallel to fibres, thevalue obtained was l0 = 0:0682W �m�1 �K�1. In subsequent simulations, a con-stant effective thermal conductivity is used, leff , which represents an averagedvalue over conditions met during the test. In consequence, it should be expect to behigher than the measured conductivity.
In section ‘Temperature effect on moisture storage’, the values for the Oswinmodel parameters were presented, on the basis of DVS measurement analysis. Itwas also described how the value of parameter A could be obtained. With one orthe other technique retained for the description of the temperature effect on moist-ure storage, the isothermal and non-isothermal moisture capacity functionsju(u, T ) and jT (u, T ) are then easily determined. A large uncertainty remains
Figure 9. Temperature and relative humidity measured in sub-chambers A and B.
14 Journal of Building Physics
at Universite de Liege on July 1, 2015jen.sagepub.comDownloaded from
concerning the actual moisture content modification with temperature and the‘representativeness’ of the chosen mathematical description which has to be con-firmed in this research. Finally, the vapour resistance factor of straw is quite diffi-cult to measure with standard dry- or wet-cup methods. At first approximation, itsvalue was fixed based on the work of Wihan (2007). As for effective thermal con-ductivity, a constant vapour transport is assumed given the lack of available datain literature and the difficulties in assessing the vapour transport variation withdependent variables. However, it can be expected to be negligible based on mea-surements performed on other materials and expected conditions in the straw balesduring the thermal shock (Galbraith et al., 2000).
Results and discussions
Sub-chambers’ sensor data
The temperature measured in sub-chambers A and B is shown in Figure 9. Thetemperature is maintained around 34 �C in the A air volume during the first 54 h ofthe test. Then, as the doors of the chamber are opened on both end sides, its valuedrops rapidly to meet the hall temperature. Thereafter, the temperature measuredin both sub-chambers corresponds to the variations occurring in the large test hall
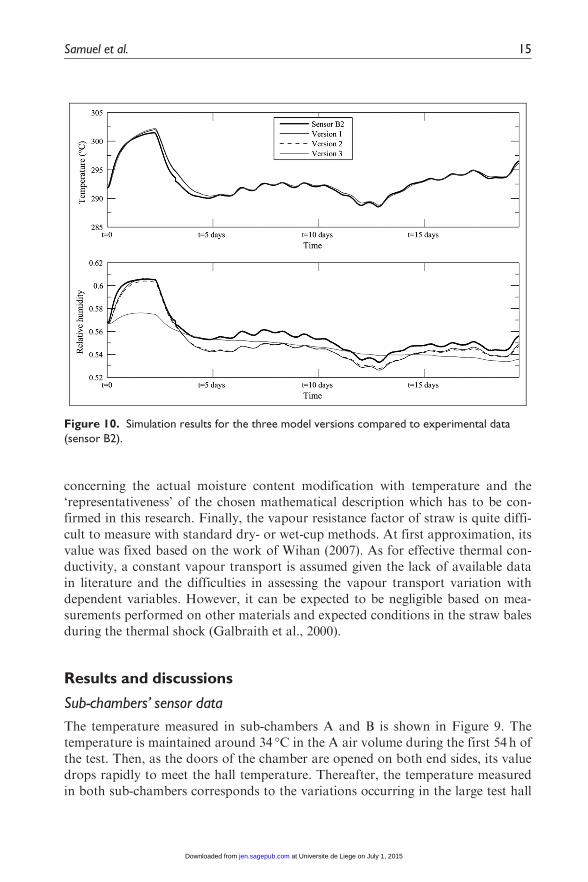
Figure 10. Simulation results for the three model versions compared to experimental data(sensor B2).
Samuel et al. 15
at Universite de Liege on July 1, 2015jen.sagepub.comDownloaded from

where the device was placed. Values oscillated around 20 �C following a naturaldaily cycle with higher temperature during the day.
Numerical results
Figure 10 presents the temperature and RH simulated at B2 sensor location by thethree versions of the model compared to measured data. Figure 11 provides thesame information at B3 sensor location, a bit further in the straw depth relativelyto the thermal shock progression. No distinction can be made visually between
Figure 11. Simulation results for the three model versions compared to experimental data(sensor B3).
Table 3. Efficiency criteria computed for all model versions and temperature and relativehumidity separately.
Temperature Relative humidity
NSE PBIAS RMSE NSE PBIAS RMSE
Version 1 0.966 20.07% 0.502 0.834 1.13% 0.0077Version 2 0.962 20.08% 0.530 0.819 1.19% 0.0080Version 3 0.958 20.09% 0.553 0.504 1.57% 0.0133
NSE: Nash–Sutcliffe efficiency; PBIAS: percent bias; RMSE: root mean square error.
16 Journal of Building Physics
at Universite de Liege on July 1, 2015jen.sagepub.comDownloaded from
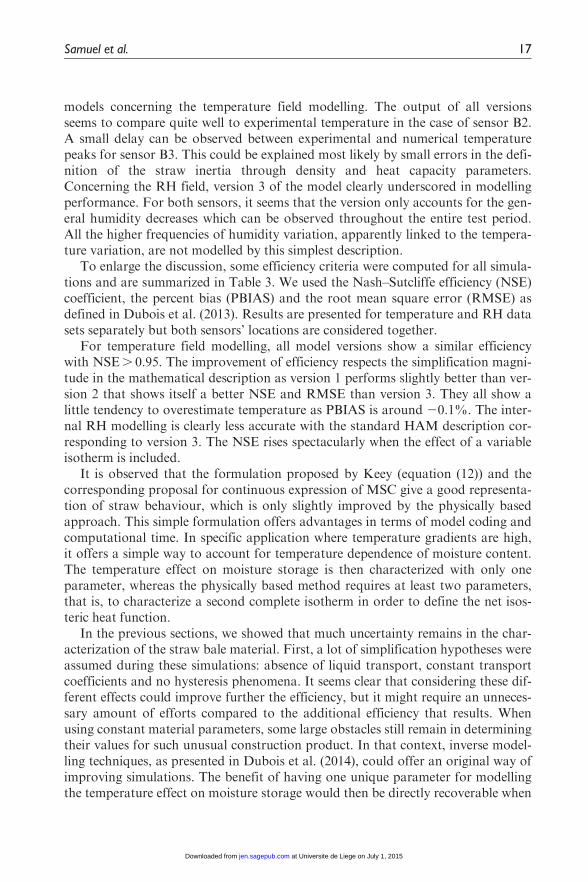
models concerning the temperature field modelling. The output of all versionsseems to compare quite well to experimental temperature in the case of sensor B2.A small delay can be observed between experimental and numerical temperaturepeaks for sensor B3. This could be explained most likely by small errors in the defi-nition of the straw inertia through density and heat capacity parameters.Concerning the RH field, version 3 of the model clearly underscored in modellingperformance. For both sensors, it seems that the version only accounts for the gen-eral humidity decreases which can be observed throughout the entire test period.All the higher frequencies of humidity variation, apparently linked to the tempera-ture variation, are not modelled by this simplest description.
To enlarge the discussion, some efficiency criteria were computed for all simula-tions and are summarized in Table 3. We used the Nash–Sutcliffe efficiency (NSE)coefficient, the percent bias (PBIAS) and the root mean square error (RMSE) asdefined in Dubois et al. (2013). Results are presented for temperature and RH datasets separately but both sensors’ locations are considered together.
For temperature field modelling, all model versions show a similar efficiencywith NSE. 0.95. The improvement of efficiency respects the simplification magni-tude in the mathematical description as version 1 performs slightly better than ver-sion 2 that shows itself a better NSE and RMSE than version 3. They all show alittle tendency to overestimate temperature as PBIAS is around 20.1%. The inter-nal RH modelling is clearly less accurate with the standard HAM description cor-responding to version 3. The NSE rises spectacularly when the effect of a variableisotherm is included.
It is observed that the formulation proposed by Keey (equation (12)) and thecorresponding proposal for continuous expression of MSC give a good representa-tion of straw behaviour, which is only slightly improved by the physically basedapproach. This simple formulation offers advantages in terms of model coding andcomputational time. In specific application where temperature gradients are high,it offers a simple way to account for temperature dependence of moisture content.The temperature effect on moisture storage is then characterized with only oneparameter, whereas the physically based method requires at least two parameters,that is, to characterize a second complete isotherm in order to define the net isos-teric heat function.
In the previous sections, we showed that much uncertainty remains in the char-acterization of the straw bale material. First, a lot of simplification hypotheses wereassumed during these simulations: absence of liquid transport, constant transportcoefficients and no hysteresis phenomena. It seems clear that considering these dif-ferent effects could improve further the efficiency, but it might require an unneces-sary amount of efforts compared to the additional efficiency that results. Whenusing constant material parameters, some large obstacles still remain in determiningtheir values for such unusual construction product. In that context, inverse model-ling techniques, as presented in Dubois et al. (2014), could offer an original way ofimproving simulations. The benefit of having one unique parameter for modellingthe temperature effect on moisture storage would then be directly recoverable when
Samuel et al. 17
at Universite de Liege on July 1, 2015jen.sagepub.comDownloaded from

performing parameter optimization. The inverse modelling approaches also allowus to analyse experimental parameters. In the experiment presented here, the loca-tion of sensors is still subject to some uncertainty even if the ‘sensor bar’ offers asignificant improvement in comparison to traditional single-point measurements.
Conclusion
In this article, a flexible numerical model for heat and moisture transfer in buildingmaterials is used to simulate the behaviour of a hygroscopic wall assembly undernon-isothermal solicitations. A prefabricated straw bale panel was first subjectedto a 35 �C thermal shock in a climate chamber. Specific T/RH sensors were createdto answer the need for proper sensing location. The monitoring of internal condi-tions in straw bales during this test constitutes the measurement data intended tobe compared with the output of the model.
The numerical model used to describe the heat and moisture transfer in thestraw during the heat shock is developed in COMSOL and uses a mass balanceequation in which moisture content variation with temperature can be considered.Two approaches were chosen to characterize a continuous ‘sorption surface’ withRH and temperature dependency. The upgrading potential of the model is high-lighted as three different versions are studied based on the type of moisture storagedescription.
This study shows that a one-parameter empirical approach to describe tempera-ture effect on moisture storage can enhance greatly the efficiency of a HAM modelin comparison to the frequent isothermal sorption characteristic assumption. Thistechnique is easy to implement and offers a true continuous description of moisturecapacities. The physically based method needs to be constructed from multipleindividual isotherms and only offers a slight further improvement. It should bespecified that these refinements might become insignificant when temperature gra-dients are moderate, as often in normal use conditions of a building. A better defi-nition of material parameters should then provide a better source for predictionoptimization. Still, this article proves that in some particular conditions, the singleisotherm assumption does not transpose adequately the actual behaviour of crop-based materials. The one-parameter description of the temperature effect on moist-ure storage would then be a useful model improvement, allowing us to deepen theunderstanding of complex hygroscopic materials especially through the use of para-meter optimization.
Declaration of conflicting interests
The authors declared no potential conflicts of interest with respect to the research, author-ship, and/or publication of this article.
18 Journal of Building Physics
at Universite de Liege on July 1, 2015jen.sagepub.comDownloaded from

Funding
This work was supported by the FNRS (Fonds National de la Recherche Scientifique) inBelgium (FRIA grant).
References
Carfrae J, De Wilde P, Littlewood J, et al. (2009) Long term evaluation of the performance
of a straw bale house built in a temperate maritime climate. In: 11th international
conference on non-conventional materials and technologies, Bath, 6–9 September.
Cripps A, Handyside R, Dewar L, et al. (2004) Crops in Construction Handbook (Report).
London: CIRIA.
Cudinov B and Andreev M (1978) Hygroscopicity of wood at temperatures below zero
degrees centigrade. 2. The condition of the hygroscopic moisture and the equilibrium
moisture content, Leipzig, VEB Fachbuchverlag. Holztechnologie 19: 147–151.
Delgado JM, Barreira E and Ramos NM (2013) Hygrothermal Numerical Simulation Tools
Applied to Building Physics. Berlin: Springer.
Dubois S and Lebeau F (2013) Design, construction and validation of a guarded hot plate
apparatus for thermal conductivity measurement of high thickness crop-based specimens.
Materials and Structures. Epub ahead of print 18 October. DOI: 10.1617/s11527-013-
0192-4.
Dubois S, Evrard A and Lebeau F (2013) Modeling the hygrothermal behavior of biobased
construction materials. Journal of Building Physics. Epub ahead of print 14 June. DOI:
10.1177/1744259113489810.
Dubois S, McGregor F, Lebeau F, et al. (2014) An inverse modelling approach to estimate
the hygric parameters of clay-based masonry during a moisture buffer value test. Building
and Environment 81: 192–203.
Evrard A, Louis A, Biot B, et al. (2012) Moisture equilibrium in straw bales walls. In: 28th
passive and low energy architecture conference, Lima, 7–9 November.
Fuchs S, Krumm O and Cauderay E (2009) La construction en botte de paille (Report).
Geneve: ATBA.
Galbraith G, Guo J and McLean R (2000) The effect of temperature on the moisture
permeability of building materials. Building Research and Information 28: 245–259.
Hagentoft C-E, Kalagasidis AS, Adl-Zarrabi B, et al. (2004) Assessment method of
numerical prediction models for combined heat, air and moisture transfer in building
components: benchmarks for one-dimensional cases. Journal of Thermal Envelope and
Building Science 27: 327–352.
Hens H (2008) Building Physics – Heat, Air and Moisture: Fundamentals and Engineering
Methods with Examples and Exercises. New York: John Wiley & Sons.
Janssens A, Woloszyn M, Rode C, et al. (2008) From EMPD to CFD – overview of different
approaches for Heat Air and Moisture modeling in IEA Annex 41. In: IEA ECBCS
Annex 41 closing seminar, Copenhagen, 19 June.
Jolly R (2002) Straw Bale Moisture Monitoring Report (Report). Ottawa, ON, Canada:
CMHC.
Keey RB (1978) Introduction to Industrial Drying Operations. Oxford: Pergamon Press.
King B (2006) Design of Straw Bale Buildings. San Rafael, CA: Green Building Press.
Samuel et al. 19
at Universite de Liege on July 1, 2015jen.sagepub.comDownloaded from

Madurwar MV, Ralegaonkar RV and Mandavgane SA (2013) Application of agro-waste
for sustainable construction materials: a review. Construction and Building Materials 38:
872–878.
Osanyintola OF and Simonson CJ (2006) Moisture buffering capacity of hygroscopic
building materials: experimental facilities and energy impact. Energy and Buildings 38:
1270–1282.
Oswin C (1946) The kinetics of package life. III. The isotherm. Journal of the Society of
Chemical Industry 65: 419–421.
Poyet S and Charles S (2009) Temperature dependence of the sorption isotherms of cement-
based materials: heat of sorption and Clausius–Clapeyron formula. Cement and Concrete
Research 39: 1060–1067.
Shea A, Wall K and Walker P (2013) Evaluation of the thermal performance of an
innovative prefabricated natural plant fibre building system. Building Service Engineering
Research and Technology 34: 369–380.
Simpson W (1980) Sorption theories applied to wood. Wood and Fiber Science 12: 183–195.
Skaar C (1972) Water in Wood. Syracuse, NY: Syracuse University Press.
Strømdahl K (2000) Water sorption in wood and plant fibres. PhD Thesis, Technical
University of Denmark, Kongens Lyngby.
Tariku F, Kumaran K and Fazio P (2010) Integrated analysis of whole building heat, air and
moisture transfer. International Journal of Heat and Mass Transfer 53: 3111–3120.
Time B (1998)Hygroscopic moisture transport in wood. PhD Thesis, Norwegian University of
Science and Technology, Trondheim.
Van Schijndel AWM (2009) Integrated modeling of dynamic heat, air and moisture
processes in buildings and systems using SimuLink and COMSOL. Building Simulation
2: 143–155.
Whitaker S (1977) A theory of drying. Advances in Heat Transfer 13: 119–203.
Wihan J (2007) Humidity in straw bale walls and its effect on the decomposition of straw. PhD
Thesis, School of Computing and Technology, University of East London, London.
20 Journal of Building Physics
at Universite de Liege on July 1, 2015jen.sagepub.comDownloaded from