Embed Size (px)
Citation preview

lable at ScienceDirect
Journal of Archaeological Science 78 (2017) 99e111
Contents lists avai
Journal of Archaeological Science
journal homepage: http : / /www.elsevier .com/locate/ jas
Facilitating tree-ring dating of historic conifer timbers using BlueIntensity
Rob Wilson a, b, *, David Wilson c, Milo�s Rydval a, Anne Crone d, Ulf Büntgen e, f, g,Sylvie Clark a, Janet Ehmer h, Emma Forbes i, Mauricio Fuentes j, Bj€orn E. Gunnarson k,Hans W. Linderholm j, Kurt Nicolussi l, Cheryl Wood a, Coralie Mills a
a School of Geography and Geosciences, University of St Andrews, Fife, KY16 9AL, UKb Lamont-Doherty Earth Observatory of Columbia University, Palisades, New York, 10964, USAc The Roslin Institute, University of Edinburgh, Midlothian, EH25 9RG, UKd AOC Archaeology Group, Edinburgh, UKe Department of Geography, University of Cambridge, Cambridge, UKf Swiss Federal Research Institute WSL, Birmensdorf, Switzerlandg Global Change Research Centre AS CR, Brno, Czechiah Department of Environmental Studies, University of Richmond, USAi Earth and Environmental Sciences, University of Michigan, USAj Department of Earth Sciences, University of Gothenburg, SE-40530, Gothenburg, Swedenk Department of Physical Geography, Stockholm University, SE-106 91, Stockholm, Swedenl Institute of Geography, University of Innsbruck, Innrain 52, 6020, Innsbruck, Austria
a r t i c l e i n f o
Article history:Received 26 August 2016Received in revised form28 November 2016Accepted 30 November 2016
Keywords:Tree-ring datingDendroarchaeologyBlue IntensityConifers
* Corresponding author. School of Geography andAndrews, Fife, KY16 9AL, UK.
E-mail address: [email protected] (R. Wilson
http://dx.doi.org/10.1016/j.jas.2016.11.0110305-4403/© 2016 Elsevier Ltd. All rights reserved.
a b s t r a c t
Dendroarchaeology almost exclusively uses ring-width (RW) data for dating historical structures andartefacts. Such data can be used to date tree-ring sequences when regional climate dominates RWvariability. However, the signal in RW data can be obscured due to site specific ecological influences(natural and anthropogenic) that impact crossdating success. In this paper, using data from Scotland, weintroduce a novel tree-ring parameter (Blue Intensity e BI) and explore its utility for facilitating dendro-historical dating of conifer samples. BI is similar to latewood density as they both reflect the combinedhemicellulose, cellulose and lignin content in the latewood cell walls of conifer species and the amountof these compounds is strongly controlled, at least for trees growing in temperature limited locations, bylate summer temperatures. BI not only expresses a strong climate signal, but is also less impacted by sitespecific ecological influences. It can be concurrently produced with RW data from images of finelysanded conifer samples but at a significantly reduced cost compared to traditional latewood density. Ourstudy shows that the probability of successfully crossdating historical samples is greatly increased usingBI compared to RW. Furthermore, due to the large spatial extent of the summer temperature signalexpressed by such data, a sparse multi-species conifer network of long BI chronologies across Europecould be used to date and loosely provenance imported material.
© 2016 Elsevier Ltd. All rights reserved.
1. Introduction
Dendrochronology is multidisciplinary in nature and has manyapplications in the environmental sciences including ecology,geomorphology and climatology (Schweingruber, 1996; Hughes
Geosciences, University of St
).
et al., 2010; Speer, 2010; Stoffel et al., 2010). The common funda-mental keystone to all dendrochronological sub-disciplines is theability to ensure exact calendar dating of the tree-ring (TR) series.Crossdating is the ability to pattern-match or synchronise TR se-quences between samples of the same species across a climaticallyhomogenous region to allow the identification of the exact year inwhich a particular TR was formed (Stokes and Smiley, 1968; Fritts,1976). One of the earliest uses of dendrochronological methods wasthe dating of historical structures and artefacts (so-called den-droarchaeology) and a large body of published work now exists

R. Wilson et al. / Journal of Archaeological Science 78 (2017) 99e111100
detailing the development of this sub-discipline (Baillie and Pilcher,1973; Baillie, 1982; Pilcher et al., 1984; Kuniholm, 2001).
Until now, dendroarchaeology has almost exclusively utilisedring-width (RW) as the main tree growth variable for crossdating.RW is inexpensive to produce, not only directly from samples (viamicroscope graticules or measuring stages), but can also bemeasured from sample casts (Crone, 2008), photographs (Mills,1988; Levani�c, 2007) and scanned images (Rydval et al., 2014).The success of dendroarchaeology from many regions across boththe Old (Baillie, 1995; Kuniholm and Striker, 1987; Manning andBruce, 2009) and New (Douglass, 1929; Nash, 1999) Worlds high-lights the importance of this variable for historical dating.
Crossdating is possible because trees of the same species withinthe same region respond in a similar way to climate. This meansthat during years of favourable growth conditions, all trees, onaverage, will develop a relatively wide ring, whereas thinner ringswill develop when environmental conditions are less favourable.RW patterns, therefore, can be synchronised between trees in thesame area and the strength of the common signal between treesand across wide regions often reflects the strength of the climaticinfluence on growth.
The sensitivity of tree-growth to climate is a function of thetree's geographical location which influences what aspect ofclimate most limits tree productivity. As a general rule, in highlatitude/altitude situations, growth is limited by summer temper-atures, whereas at low latitude/altitude sites, tree-growth is morecommonly limited by moisture availability. Many transect andregional network studies have shown this change in general treeresponse to climate with elevation and/or latitude (Fritts et al.,1965; LaMarche, 1974; Lingg, 1986; Kienast et al., 1987; Wilsonand Hopfmueller, 2001; Babst et al., 2012; St. George, 2014). Inregions of complex topography, however, the varying response oftree-growth to climate for a single species can complicate between-site crossdating and dendroarchaeological dating. For example,Wilson et al. (2004) showed for the Bavarian Forest in Germany,that when using RW, low elevationmoisture limited Norway sprucetrees (<700 m.a.s.l.) could not be crossdated with high elevationtemperature sensitive trees above 1100 m.a.s.l despite these tworegions being only about 50 km apart.
An additional limiting factor influencing the utility of RW fordendroarchaeology is that RW variability is an aggregated productof multiple environmental factors (e.g. climate, site ecology, naturaland anthropogenic disturbance, etc.) influencing tree-growththroughout the year (Cook, 1985). From a dating perspective, it isdesirable for the common regional scale climatic influence upongrowth to dominate the variability in RW series and the impact oflocal factors (natural and anthropogenic) to be minimal. Optimisingthe climatic influence expressed in TR series and minimising the“noise” of all other factors therefore facilitates crossdating. This isstrategically performed through careful site selection in den-droclimatological studies (Fritts, 1976), but for dendroarchaeology,the exact provenance of historic timbers may never be ideal tooptimise the climatic influence expressed by RW data and so theclimate related signal is often weaker with resultant detrimentalimplications for dating.
RW is not the only variable that can be measured from tree ringshowever. Density based parameters (Polge, 1970; specificallymaximum latewood density) have been successfully used over thelast 30 years as an effective proxy of past summer temperatures(Briffa et al., 1992, 2001; Wilson and Luckman, 2003; Esper et al.,2012; Schneider et al., 2015). Stable isotopes, in recent years, havealso been shown to provide additional information expressing awhole new swath of climatic information that can be extractedfrom TR samples (McCarroll and Loader, 2004; Treydte et al., 2007;Young et al., 2015). However, measuring ring density or stable
isotopes requires specialised equipment (which few TR laboratoriespossess) and are much more expensive to produce compared toRW.
A novel TR variable that has been championed for den-droclimatology in recent years is Blue Intensity (BI - McCarroll et al.,2002; Bj€orklund et al., 2014; Rydval et al., 2014;Wilson et al., 2014).BI is similar to maximum latewood density (MXD) as they bothessentially measure the combined hemicellulose, cellulose andlignin content (related to cell wall thickness) in the latewood ofconifer trees. The intensity of the light reflectance in the blue part ofthe spectrum is a good proxy of the amount of these compounds(especially lignin) and cell wall thickness as they readily absorbblue light. Therefore, dense, darker latewood will result in less re-flected blue light. BI and MXD are therefore related (inverselycorrelated) and have been shown to express a much strongerrelationship with summer temperatures than RW as they express a“purer” climate signal and are less influenced by other site specificnon-climatic factors (Bj€orklund et al., 2014; Rydval et al., 2014;Wilson et al., 2014). BI data can be generated at the same time asRW data at no additional cost by measuring directly from images(scans or photographs) of finely sanded conifer wood samples andcan theoretically be generated by any dendrochronological labo-ratory with minimal investment (see Campbell et al. (2011); Rydvalet al. (2014) and €Osterreicher et al. (2015) for different approachesfor BI measurement). As BI generally expresses a stronger summertemperature signal than RW, at least at inter-annual time-scales(Rydval et al., 2014, 2016b; Wilson et al., 2012; 2014) and is lesssusceptible to site specific ecological “noise”, we hypothesise thatthe use of BI will substantially improve our ability to successfullydate historical structures where conifer wood is the main con-struction material.
In this paper, we present the first exploration of using BI data toaid dendro-historical dating using a Scottish case study. In Scotland,the dendrochronological dating of imported archaeological oakusing RW has been reasonably successful, aided by a network ofreference chronologies across northern Europe (Crone and Mills,2012). However, dating native timber is less straightforward, inpart due to chronological and geographical gaps in native referencechronologies (Mills and Crone, 2012). Using just RW data, historicaldating of native pine in Scotland has been an especially formidablechallenge (Crone and Mills, 2002, 2011) and until recently only afew structures, built with local pine, had been dated (Mills andCrone, 2012). While in part this is related to the need for thedevelopment of a network of native pine reference chronologies(Mills, 2008) it also appeared to be related to intrinsic character-istics of pine used in Scottish buildings, including the predominantuse of young (<80-year) timbers, which make dating more difficult(Crone and Mills, 2011; Mills and Crone, 2012). BI has changed thissituation substantially, and its use has significantly increased thechance of attaining a robust date for historical structuresewhetherthe conifer construction material was sourced in Scotland or fromother regions in Europe.
This paper first details the current status of the Scottish pine TRnetwork and the defined regional reference chronologies used forhistorical dating. The dating potential of BI versus RW is thenexamined using four independently sampled living sites and sixhistorical structures. A sub-sampling exercise, using the full Scot-tish pine data-set, is then performed to model how many timberswould theoretically need to be measured and dated from a his-torical phase/structure to “guarantee” a successful crossdate usingeither RW and BI. The paper ends by examining the wider impli-cations of using BI data for crossdating and provenancing acrossEurope in light of the significant amount of trade and trans-portation of conifer construction material over the last 500 yearsthroughout the whole region.

R. Wilson et al. / Journal of Archaeological Science 78 (2017) 99e111 101
2. Data and methods
The current network of Scots pine chronologies, developed aspart of the Scottish Pine Project (https://www.st-andrews.ac.uk/~rjsw/ScottishPine/), includes 44 sites of which BI data have beenmeasured from 20 (Rydval et al., 2016b, Fig. 1). For historical datingpurposes, the individual site data have been pooled to create fiveregional reference series to maximise replication and commonsignal and minimise site specific noise. The North-West (NW e AD1621e2013), South-West (SW e AD 1508e2011) and Southern
Fig. 1. Location map showing the individual locations of all 44 pine sites in Scotland, the regreplication for each parameter), the four living “analogue” test sites and the six historical s
Cairngorm (SCe AD 1477e2012) regional reference series arederived entirely from living trees while West-Central (CNT e AD1260e2013) and the Northern Cairngorms (NC e AD 1089e2013)have been extended using preserved sub-fossil material collectedfrom near-shore shallow lake sediments (Wilson et al., 2012;Rydval et al. in review-a). The data from all five regions were alsocombined to create the Scottish Mega Master (SMM).
Sample replication for each regional reference series decreasesback in time (Supplementary Fig. 1) with associated weakening inthe expressed population signal (EPS) strength statistic (Wigley
ions represented by the five pine region reference series (including individual TR seriestructures.

Table 1Analogue historical sites using independent living data from the Scottish Pine network. MSL ¼ mean sample length. RBAR ¼ mean inter-series correlation of 1st differenceddetrended data; N (EPS 0.85) ¼ number of trees needed to attain an EPS of 0.85.
Site name Site code Period No. of trees MSL RW RBAR N (EPS 0.85) BI RBAR N (EPS 0.85)
Ryvoan Pass RYV 1787e1900 9 88.3 0.30 13.0 0.46 6.6Loch an Eilein LAE 1850e1950 6 80.5 0.26 15.8 0.44 7.1Glen Orchy GOS 1800e1900 10 77.7 0.34 10.9 0.27 15.5Loch Coldair LCL 1863e1960 10 85.7 0.34 11.1 0.42 7.9
Mean 0.31 12.7 0.40 9.3
R. Wilson et al. / Journal of Archaeological Science 78 (2017) 99e111102
et al., 1984). EPS is an empirical metric commonly used in den-droclimatology to assess how well a sample chronology of finitereplication represents the theoretical infinitely replicated popula-tion chronology. It is derived using the following equation:
EPS ¼ n rn r þ ð1� rÞ (1)
where n is the number of TR series and r (often referred to as RBAR)is the mean inter-series correlation of all possible detrendedbivariate pairs of TR series in a chronology. RBAR is a measure of thecommon signal between the TR series and the EPS values can beinterpreted as the squared correlation between the sample chro-nology and the theoretical population chronology. Values > 0.85are often cited as adequate for dendroclimatological purposes(Wigley et al., 1984). All analyses in this paper are focussed on thepost 1700 period where EPS is >0.85 for most regional referenceseries (Supplementary Fig. 1). The above equation can be re-arranged to predict how many TR series would be needed toattain an EPS of a certain value (i.e. 0.85) for a given empiricallyestimated chronology RBAR value:
n ¼ ðr � 1ÞEPSr ðEPS� 1Þ (2)
Comparison of the dating potential of BI versus RW was per-formed using data from; (1) four living sites (Fig. 1 and Table 1) thatwere used as historical “analogues”, where sample provenance isknown, and (2) data from six historical sites (Fig. 1 and Table 2),where the original growth location of the timbers is unknown butpresumed to be local to the sampled structure. Although the datafor the living sites come up to present, the recent end of the RWandBI time-series was truncated to create site chronologies with amean sample length (MSL) of ca. 80 years to create “analogue”chronologies that represent the mean sample length oftenobserved from samples taken from historical structures in Scotland(Table 2). It should be noted that the six test historical sitesrepresent data measured from samples that have been successfullydated using both RW and BI. Many samples from each of thesestructures have not been successfully dated mainly due to shortsequences, fragmented samples or substantial worm related decay(Table 2).
The RW and BI data for the regional reference series and testsites were detrended via 1st differencing and the individualtransformed series averaged to create regional and site chronolo-gies. 1st differencing removes all low frequency variability in the TRseries (reducing 1st order autocorrelation) and allows crossdatingto be performed using only the inter-annual signal. The chronolo-gies for each TR variable were correlated with each regional refer-ence chronology and the associated T-value (Baillie and Pilcher,1973) calculated to assess the significance of the crossdate. The T-value, commonly used in European dendroarchaeology, essentiallytransforms the correlation between two time-series to a probabi-listic value following the Student T-distribution using the followingequation:
T ¼ rffiffiffiffiffiffiffiffiffiffiffiffi
n� 2pffiffiffiffiffiffiffiffiffiffiffiffiffi
1� r2p (3)
where n is the number of years in the period of overlap and r is thePearson's correlation value between the two time-series. A T-value>3.5 is often used as a minimum threshold to identify a significantcrossdate but herein we use a value of 4.0 as a more conservativeacceptance threshold.
To model the theoretical number of TR series needed to acquirea “robust” crossdate, a bootstrapped sub-sampling exercise, forboth RW and BI, was performed using the full SMM data-set.Random sample chronologies (from 1 TR series up to 20 TR se-ries) were extracted from the full SMM data-set (performed usingthe 1721e1800 and 1821e1900 periods) and the correlation be-tween each random sub-sample mean chronology and the mean ofthe remaining series calculated. For each replication step, thisrandom sub-sampling was performed 1000 times allowing an es-timate of the range in correlation values for each incremental in-crease in n.
Finally, to examine the potential utility of using BI to facilitatecrossdating of historical material from various conifer species withunknown provenance from regions around Europe, RW, BI (Scot-land, Sweden, the Alps) and MXD (Sweden, the Alps and the Pyr-enees) chronologies were used to examine the spatial climaticfingerprint of each of these TR variables. The BI data were invertedto exhibit the same positive correlation relationship with temper-ature displayed by the MXD data.
3. Results and discussion
3.1. Chronology metrics
Table 1 details meta information for the four living “analogue”test sites while their locations are shown in Fig. 1. Ryvoan (RYV) andLoch an Eilein (LAE) are located in the core pine woods of thenorthern Cairngorms, the latter area being chosen as there is astrong history of human felling related disturbance (Rydval et al.,2016a) which might affect the ability to crossdate tree samplestaken from these woods. Glen Orchy (GOS) is located on the south-western edge of the Scottish pine network while Loch Coldair (LCL),an abandoned 19th century plantation, is situated in what we referto as “the network hole” where no semi-natural pine woodlandsexist today. The RBAR values for RW vary from 0.26 (LAE) to 0.34(GOS and LCL) with a mean of 0.31, while values are generallyhigher for BI ranging from 0.27 (GOS) to 0.46 (RYV) with a mean of0.40 (Table 1). Using Equation (2), on average about 13 trees areneeded to attain an EPS of 0.85 for RW, while only 9 trees areneeded using BI. Examining the same metrics for the six historicalsites (Table 2) identifies a similar range for RW (0.25e0.49;mean¼ 0.36) and BI (0.27e0.46; mean¼ 0.36). Statistically, there isno difference between the overall RBAR values for RW and BI be-tween the living and historic sites (Tables 1 and 2) and 11 treeswould be needed to attain an EPS > 0.85 in both cases.

Table 2Historical sitemeta-information. MSL¼mean sample length. RBAR¼mean inter-series correlation of 1st differenced detrended data; N (EPS 0.85)¼ number of trees needed toattain an EPS of 0.85.
Site name Fig. 1 code Date MSL No. of datedseries
No. of trees No. of undatedseries and comment
RW RBAR N (EPS 0.85) BI RBAR N (EPS 0.85)
Inverey Byre A 1668e1791 85.0 10 10 1. Short sequence 0.40 8.5 0.41 8.1MacRobert House B 1724e1848 93.0 7 7 13. Fragmented, broken and short series 0.25 17.0 0.32 12.2Red House C 1707e1808 89.3 2 2 14. Fragmented, broken and short series 0.29 13.7 0.32 11.9Belladrum D 1742e1861 97.8 4 2 zero 0.40 8.5 0.46 6.7Granton-on-Spey E 1775e1852 62.7 32 12 3. Short series 0.34 10.8 0.38 9.1Badden Cottage F 1691e1801 70.5 11 5 2. Fragmented, broken and short series 0.49 5.8 0.27 15.0
Mean 0.36 10.7 0.36 10.5
R. Wilson et al. / Journal of Archaeological Science 78 (2017) 99e111 103
Low RBAR values can reflect either (1) non-climatic influenceson tree-growth which could explain the lower values for LAE or (2)mixed assemblages of timbers reflecting different source areas forthe historical timbers. Although BI reflects a stronger climate signalthan RW (Wilson et al., 2012; Rydval et al., 2016b), the quality of thereflectance data can be impacted by discoloration (e.g. due to algalstaining and decay), sample integrity (i.e. worm holes) and/or thepresence of reaction wood, resulting in lower RBAR values. Overall,however, the signal strength metrics of the six historical sites aregenerally similar to those seen for the living analogue sites,although this is perhaps not surprising as these data representsamples which have been successfully dated. The signal strengthanalysis for both groups (Tables 1 and 2) indicate that the actualreplication in the dated historical samples is often lower thanneeded to attain an EPS of 0.85. This is not a problem per se, butdoes hint that crossdating against the regional reference chronol-ogies would improve if site/phase chronology replication washigher (see later discussion).
3.2. Crossdating results
The T-values for each of the four living “analogue” sites against
Fig. 2. T value crossdating results against regional and SMM reference chronologies. RW in wLoch Coldair is located in the so called “network hole” so no shading is shown but geograp
the five regional reference chronologies and the SMM (Fig. 2) showthat BI is clearly superior to RW for crossdating the living pinechronologies. In all cases, and compared with all regional referenceseries, T-values using BI are substantially higher than 4.0 and manyvalues are >10. For RW, the crossdating results are much weakerand more variable. RYV, LAE and GOS still, however, yield signifi-cant dating results with the regional reference series from wherethe trees were actually located. LCL shows marginally stronger re-sults with the Northern Cairngorms e the geographically closestregional reference data-set. Both GOS and LCL show reasonablystrong T-values using RW against all regional records. This obser-vation might reflect the higher replication (and stronger signalstrength, Table 1) of these two sites compared to RYV and LAE.Weakest crossdating results are noted for the LAE site using RWaffirming the weak signal strength results (Table 1) as well as the“muddying” effect of the signal related to known felling relateddisturbance (Rydval et al., 2016a). Surprisingly, however, the BIbased crossdating results for LAE are the strongest of all four livingsites with a T-value of 13.2. These observations for LAE clearly showthe “purer” climatically dominated common signal expressed in BIcompared to RW which can be strongly affected by non-climaticfactors.
hite and BI in black. Grey shading denotes the region within which each site is located.hically it is more closely located to NC

R. Wilson et al. / Journal of Archaeological Science 78 (2017) 99e111104
It is important to highlight that the T-value results for both RWand BI against the SMM are only marginally weaker than for the“optimal” regional reference record. This is an encouraging obser-vation as it suggests that initial dating of a historical site could beperformed using the full SMM data-set. Once dated, provenancingthe historical material could then be performed using the regionalreference data-sets or even individual sites.
As with the living “analogue” sites (Fig. 2), BI based T-values forthe six historical sites are generally stronger compared to RW, butoverall the results are weaker (Fig. 3). This observation is partlyrelated to the relatively low number of dated TR series included insome of the historical site chronologies (e.g. only two timbers forRed House and Belladrum, Table 2). However, the fact that a sig-nificant crossdate can be identified using such a low number oftimbers is encouraging (but see later discussion). The low T-valueswhen using RW (Fig. 3) clearly show why it has been so difficult todate historical structures in Scotland using this TR variable alone.The utilisation of BI has greatly improved our chances of datinghistorical pine samples.
Compared to living “analogue” sites (Fig. 2), the provenancingresults for the historical samples are more ambiguous (Fig. 3).Often, the highest T-values using RW and BI identify differenttimber source regions. For example, for Inverey Byre, RW suggestSC, while BI suggests CNT. We are fairly confident that the Inverey
Fig. 3. As Fig. 2 but for the historical sites. Grey shading denote
Byre timbers would have been locally sourced and thereforeshould crossdate more strongly with the SC region (highlighted inFig. 3). Similar ambiguities with respect to potential timberprovenance are noted for all the historical sites except BaddenCottage which appears to be most closely related to the NC region.These ambiguous provenancing results do not influence theoverall conclusion that BI is a superior TR variable for datinghistorical conifer material but they do indicate that site/phasechronology replication is an important factor that must be takeninto account when crossdating.
3.3. Crossdating and site replication
Fig. 4 presents the mean correlation (±2 standard deviations)between the increasingly replicated sub-sampled site chronologies(1 through to 20 trees) and the mean of the rest of the data in theSMM data-set. As would be expected (see Wigley et al., 1984) themean correlation is lower for chronologies derived from only asingle tree and becomes higher as replication increases. On average,the mean correlation for a site chronology of only a single tree is0.35 and 0.48 for RW and BI respectively. For 10 trees, these valuesincrease to 0.76 and 0.86. So again, the correlation results arehigher for BI than RW as was noted from the crossdating T-valueresults (Figs. 2 and 3).
s the closest regional reference series to the historic sites.

Fig. 4. Modelled change in correlation as sample replication (N) increases. The black line mean correlation and 2-sigma envelopes (upper ¼ RW; lower ¼ BI) denotes bootstrapsampling (1000 times) of the SMM of sample replication with 1e20 trees using two 80-year periods (1720e1800 and 1820e1900). The full period correlation values used togenerate T-values in Figs. 2 and 3 are also plotted against the number of timbers for the four test and six historical sites.
R. Wilson et al. / Journal of Archaeological Science 78 (2017) 99e111 105
These mean correlation values, however, only tell half the story.As with any sub-sampling exercise, the range in values is crucial tounderstand the noise and variability in the data. It is not surprisingthat for sites replicated with only one tree, the 2-sigma standarddeviation range of correlation values is rather large e essentiallyfrom 0 to 1 for BI. As replication increases, this 2-sigma range de-creases. Crucially, this large range in potential correlation values,when replication is low, highlights the potential danger of bothtype I and II dating errors and caution is advised when dating usingonly single series. This is also relevant when attempting to datesingle sub-fossil samples (Wilson et al., 2012). Of course, identifyingthe same calendar date using both RW and BI provides addedconfidence that the identified date is more likely to be correct. Thehorizontal dotted lines in Fig. 4 denote the correlation needed(r ¼ 0.41) to attain a T-value of 4.0 when the period of overlap is 80years. As the 2-sigma error range decreases with increasing repli-cation, we can use this variability range to predict that a “correct”date can be identified 95% of the time when site/phase chronologyreplication is ca. 5 and ca. 4 trees when using RW and BIrespectively.
In many respects, the subsampling exercise of the SMM data-set(Fig. 4) is an idealised exercise as the results likely will only berelevant for historical sites built using timbers that grew originallyin the areas represented by the SMM data. However, the exercisedoes provide a guide to identify an ideal minimum number ofsamples needed to date a historical phase chronology within theScottish Highlands. To test the applicability of this modelling ex-ercise, the correlation values for the living “analogue” and historicalsites used to generate the T-values in Figs. 2 and 3 are also plottedon Fig. 4. Although the results are better for BI than RW, the actualcorrelation values for many of the sites are outside the 2-sigmavariability range of the sub-sampling results. Using BI, the fourliving analogue site correlations do sit within the modelling range,but for RW, LAE and RYV are weaker than expected. Although the
LAE results could be explained by disturbance influences on thissite's growth (Rydval et al., 2016a), this explanation is likely notrelevant for RYV. The results are less robust for the historical sites.Only Red House and Belladrum sit within the modelled range usingRW. The other four sites are muchweaker and a T-value of 4.0 couldnot be attained against the SMM. Results are marginally betterusing BI for Inverey Byre, Granton-on-Spey and Badden Cottage butare still weaker than expected.
To explore these poorer than expected results, we examine thecoherence between the historical site chronologies and the SMMreference chronology in more detail (Fig. 5). Specifically, sliding 31-year window correlations are shown between the historical andSMM chronologies for both TR variables. As expected, the BI basedcorrelations are higher than RW. However, for all six sites, thecoherence between the site and regional chronologies is not time-stable and in general terms, when replication is low, between seriescorrelation is also low. This is hardly surprising (see Fig. 4), but itdoes appear that when calculating the correlation (and associatedT-value) using the full period of overlap, the values can be detri-mentally impacted due to poorly replicated periods. To partlyovercome this, the mean of the sliding correlations could be usedrather than the correlation calculated over the full overlap period.This reduces the overall influence of the low replicated periods. Thedifference between the correlation values for the full period and themean of the sliding correlations (Fig. 5 - top right corner of eachpanel) can be substantial. For example, the full period RW (BI)based correlation for Inverey Byre is 0.31 (0.60), but increases, usingthe sliding correlations, to 0.55 (0.75). In fact, the mean of thesliding correlations is almost always higher than the full periodcorrelation except for Belladrumwhere there is a slight decrease forRW.
As well as deriving a mean correlation using 31-year slidingwindows, mean tree replication (derived from the replication his-tograms in Fig. 5) can also be calculated via the sliding window

Fig. 5. Sliding 31-year correlation values between each historical site chronology and the SMM master chronologies for both RW (triangles) and BI (black line). Grey histogramsdenote TR series replication for each historical site, while the black line shows individual tree replication. “Full period r” ¼ the correlation value generated between the historicalchronology and SMM used to produce the T-values in Fig. 3. “Mean sliding r” ¼ the mean correlation from the sliding 31-year correlations.
R. Wilson et al. / Journal of Archaeological Science 78 (2017) 99e111106
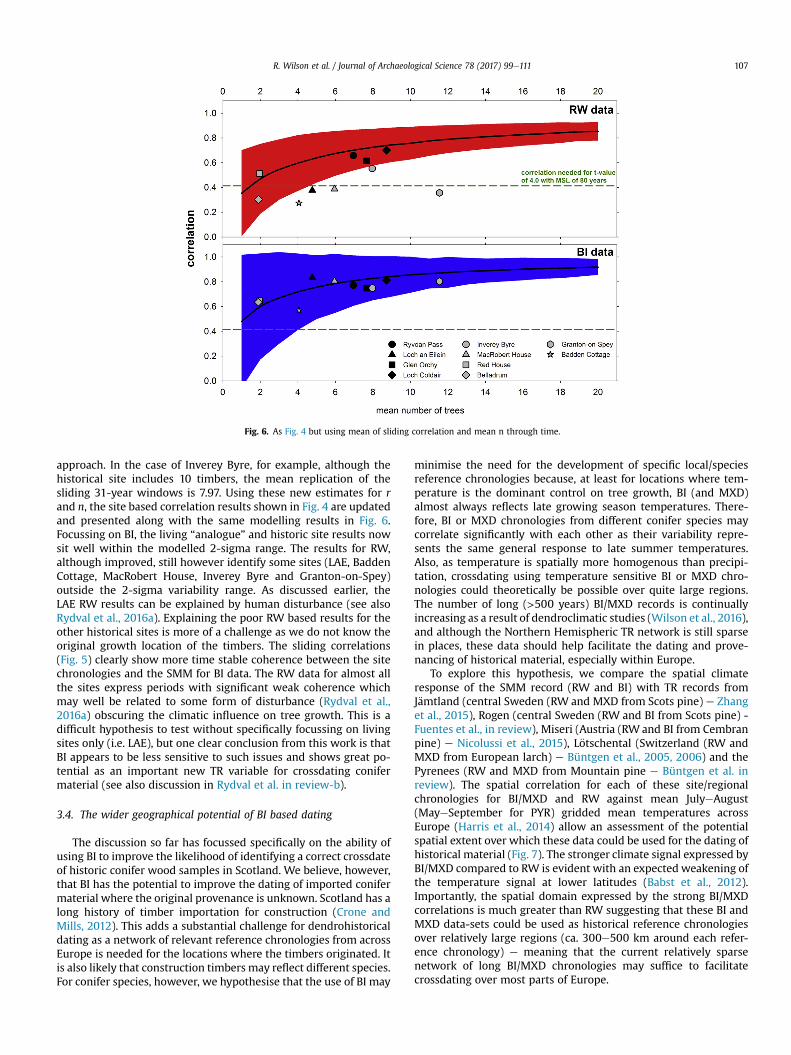
Fig. 6. As Fig. 4 but using mean of sliding correlation and mean n through time.
R. Wilson et al. / Journal of Archaeological Science 78 (2017) 99e111 107
approach. In the case of Inverey Byre, for example, although thehistorical site includes 10 timbers, the mean replication of thesliding 31-year windows is 7.97. Using these new estimates for rand n, the site based correlation results shown in Fig. 4 are updatedand presented along with the same modelling results in Fig. 6.Focussing on BI, the living “analogue” and historic site results nowsit well within the modelled 2-sigma range. The results for RW,although improved, still however identify some sites (LAE, BaddenCottage, MacRobert House, Inverey Byre and Granton-on-Spey)outside the 2-sigma variability range. As discussed earlier, theLAE RW results can be explained by human disturbance (see alsoRydval et al., 2016a). Explaining the poor RW based results for theother historical sites is more of a challenge as we do not know theoriginal growth location of the timbers. The sliding correlations(Fig. 5) clearly show more time stable coherence between the sitechronologies and the SMM for BI data. The RW data for almost allthe sites express periods with significant weak coherence whichmay well be related to some form of disturbance (Rydval et al.,2016a) obscuring the climatic influence on tree growth. This is adifficult hypothesis to test without specifically focussing on livingsites only (i.e. LAE), but one clear conclusion from this work is thatBI appears to be less sensitive to such issues and shows great po-tential as an important new TR variable for crossdating conifermaterial (see also discussion in Rydval et al. in review-b).
3.4. The wider geographical potential of BI based dating
The discussion so far has focussed specifically on the ability ofusing BI to improve the likelihood of identifying a correct crossdateof historic conifer wood samples in Scotland. We believe, however,that BI has the potential to improve the dating of imported conifermaterial where the original provenance is unknown. Scotland has along history of timber importation for construction (Crone andMills, 2012). This adds a substantial challenge for dendrohistoricaldating as a network of relevant reference chronologies from acrossEurope is needed for the locations where the timbers originated. Itis also likely that construction timbers may reflect different species.For conifer species, however, we hypothesise that the use of BI may
minimise the need for the development of specific local/speciesreference chronologies because, at least for locations where tem-perature is the dominant control on tree growth, BI (and MXD)almost always reflects late growing season temperatures. There-fore, BI or MXD chronologies from different conifer species maycorrelate significantly with each other as their variability repre-sents the same general response to late summer temperatures.Also, as temperature is spatially more homogenous than precipi-tation, crossdating using temperature sensitive BI or MXD chro-nologies could theoretically be possible over quite large regions.The number of long (>500 years) BI/MXD records is continuallyincreasing as a result of dendroclimatic studies (Wilson et al., 2016),and although the Northern Hemispheric TR network is still sparsein places, these data should help facilitate the dating and prove-nancing of historical material, especially within Europe.
To explore this hypothesis, we compare the spatial climateresponse of the SMM record (RW and BI) with TR records fromJ€amtland (central Sweden (RW and MXD from Scots pine) e Zhanget al., 2015), Rogen (central Sweden (RW and BI from Scots pine) -Fuentes et al., in review), Miseri (Austria (RW and BI from Cembranpine) e Nicolussi et al., 2015), L€otschental (Switzerland (RW andMXD from European larch) e Büntgen et al., 2005, 2006) and thePyrenees (RW and MXD from Mountain pine e Büntgen et al. inreview). The spatial correlation for each of these site/regionalchronologies for BI/MXD and RW against mean JulyeAugust(MayeSeptember for PYR) gridded mean temperatures acrossEurope (Harris et al., 2014) allow an assessment of the potentialspatial extent over which these data could be used for the dating ofhistorical material (Fig. 7). The stronger climate signal expressed byBI/MXD compared to RW is evident with an expected weakening ofthe temperature signal at lower latitudes (Babst et al., 2012).Importantly, the spatial domain expressed by the strong BI/MXDcorrelations is much greater than RW suggesting that these BI andMXD data-sets could be used as historical reference chronologiesover relatively large regions (ca. 300e500 km around each refer-ence chronology) e meaning that the current relatively sparsenetwork of long BI/MXD chronologies may suffice to facilitatecrossdating over most parts of Europe.
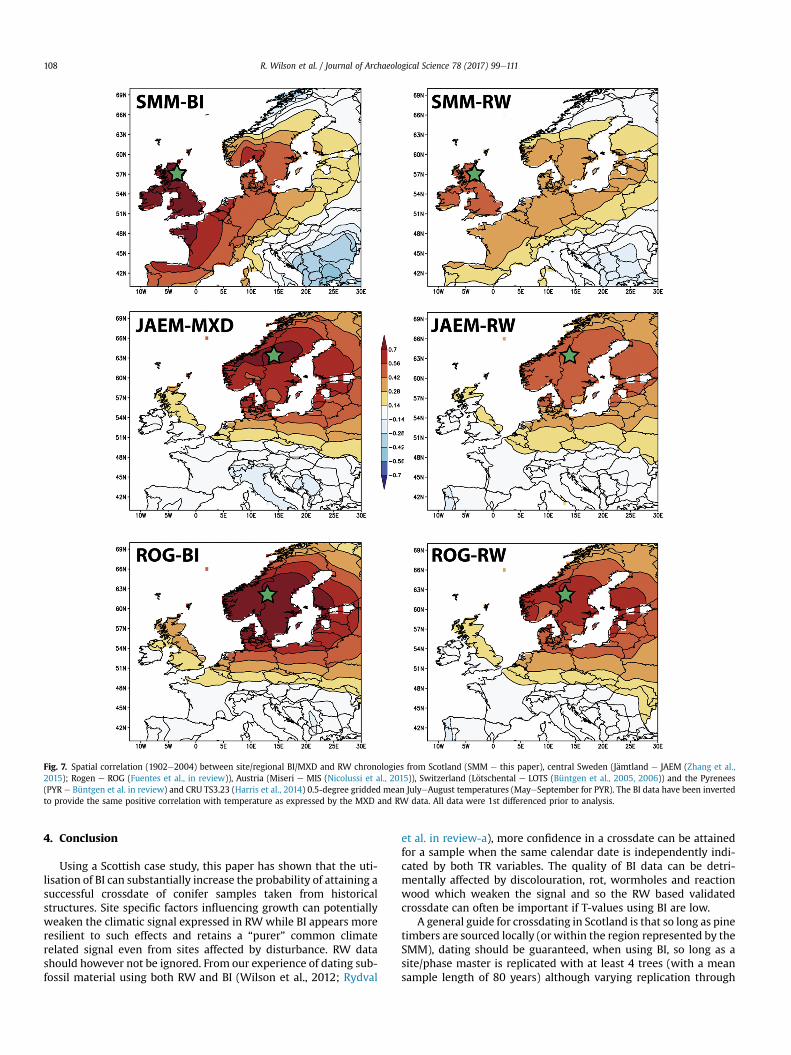
Fig. 7. Spatial correlation (1902e2004) between site/regional BI/MXD and RW chronologies from Scotland (SMM e this paper), central Sweden (J€amtland e JAEM (Zhang et al.,2015); Rogen e ROG (Fuentes et al., in review)), Austria (Miseri e MIS (Nicolussi et al., 2015)), Switzerland (L€otschental e LOTS (Büntgen et al., 2005, 2006)) and the Pyrenees(PYR e Büntgen et al. in review) and CRU TS3.23 (Harris et al., 2014) 0.5-degree gridded mean JulyeAugust temperatures (MayeSeptember for PYR). The BI data have been invertedto provide the same positive correlation with temperature as expressed by the MXD and RW data. All data were 1st differenced prior to analysis.
R. Wilson et al. / Journal of Archaeological Science 78 (2017) 99e111108
4. Conclusion
Using a Scottish case study, this paper has shown that the uti-lisation of BI can substantially increase the probability of attaining asuccessful crossdate of conifer samples taken from historicalstructures. Site specific factors influencing growth can potentiallyweaken the climatic signal expressed in RWwhile BI appears moreresilient to such effects and retains a “purer” common climaterelated signal even from sites affected by disturbance. RW datashould however not be ignored. From our experience of dating sub-fossil material using both RW and BI (Wilson et al., 2012; Rydval
et al. in review-a), more confidence in a crossdate can be attainedfor a sample when the same calendar date is independently indi-cated by both TR variables. The quality of BI data can be detri-mentally affected by discolouration, rot, wormholes and reactionwood which weaken the signal and so the RW based validatedcrossdate can often be important if T-values using BI are low.
A general guide for crossdating in Scotland is that so long as pinetimbers are sourced locally (or within the region represented by theSMM), dating should be guaranteed, when using BI, so long as asite/phase master is replicated with at least 4 trees (with a meansample length of 80 years) although varying replication through

Fig. 7. (continued).
R. Wilson et al. / Journal of Archaeological Science 78 (2017) 99e111 109
time may have a significant impact on dating success and caution isadvised when including poorly replicated sections of chronologies.Samples of greater length, as well as measuring 2 or more radiifrom the same sample, will of course increase the probability ofcrossdating success. Crossdating is undoubtedly possible with RWdata, but as such data express aweaker regional scale climate signaland can be influenced by site specific effects, the probability ofacquiring a correct date will be reduced without also concurrentlyusing BI.
Finally, it is important to emphasise that the Scottish pinenetwork was sampled for dendroclimatic purposes (Wilson et al.,2012; Rydval et al., 2016b; in review-a) using trees from siteslocated at higher elevations (300e600 m a.s.l.) where temperature
is the predominant limiting factor controlling growth. It is basicdendroecological theory that the response of trees to climate willvary with elevation (Fritts et al., 1965; LaMarche, 1974; Kienastet al., 1987; Wilson and Hopfmueller, 2001) so low and highelevation chronologies of the same species may not necessarilycorrelate (Wilson et al., 2004). This is not a problem in itself, butreference chronologies must be developed for regions (and species)relevant to the source regions of construction timbers. The largespatial finger-print of the temperature signal expressed by BI (andMXD) data across Europe (Fig. 7) suggests that a sparse network oftemperature sensitive BI/MXD chronologies could suffice for datingand possibly provenancing historical material from across this largecontinental region. However, no analysis of the climate signal

R. Wilson et al. / Journal of Archaeological Science 78 (2017) 99e111110
expressed in BI/MXD data from lower elevation conifer sites hasbeen performed. Therefore, for historic structures built with conifertimbers from lower elevations, substantial effort is needed to createlower elevation BI/MXD reference chronologies not only to testtheir spatial coherence but also to assess their dating (and climatic)potential.
Acknowledgments
The Scottish pine network expansion has been an ongoing tasksince 2006 and funding must be acknowledged to the followingprojects: EU project ‘Millennium’ (017008-2), Leverhulme Trustproject ‘RELiC: Reconstructing 8000 years of Environmental andLandscape change in the Cairngorms (F/00 268/BG)’, the Native Oakand Pine project or ‘NOAP’ (Historic Scotland) and the NERC project‘SCOT2K: Reconstructing 2000 years of Scottish climate from treerings (NE/K003097/1)’. Further PhD funding for Milos Rydval isacknowledged from The Carnegie Trust.
Appendix A. Supplementary data
Supplementary data related to this article can be found at http://dx.doi.org/10.1016/j.jas.2016.11.011.
References
Babst, F., Poulter, B., Trouet, V., Tan, K., Neuwirth, B., Wilson, R., Carrer, M.,Grabner, M., Tegel, W., Levanic, T., Panayotov, M., Urbinati, C., Bouriaud, O.,Ciais, P., Frank, D., 2012. Site- and species-specific responses of forest growth toclimate across the European continent. Glob. Ecol. Biogeogr. http://dx.doi.org/10.1111/geb.12023.
Baillie, M.G.L., Pilcher, J.R., 1973. A simple crossdating program for tree-ringresearch. Tree Ring Bull. 33, 7e14.
Baillie, M.G.L., 1982. Tree-ring Dating and Archaeology. University of Chicago Press,Chicago, IL.
Baillie, M.G.L., 1995. A Slice through Time. Batsford, London.Bj€orklund, J., Gunnarson, B., Seftigen, K., Esper, J., Linderholm, H., 2014. Blue in-
tensity and density from northern Fennoscandian tree rings, exploring thepotential to improve summer temperature reconstructions with earlywoodinformation. Clim. Past 10, 877e885.
Briffa, Keith R., Jones, P.D., Schweingruber, F.H., 1992. Tree-ring density re-constructions of summer temperature patterns across western North Americasince 1600. J. Clim. 5.7, 735e754.
Briffa, K.R., Osborn, T.J., Schweingruber, F.H., Harris, I.C., Jones, P.D., Shiyatov, S.G.,Vaganov, E.A., 2001. Low-frequency temperature variations from a northerntree ring density network. J. Geophys. Res. Atmos. 106 (D3), 2929e2941.
Büntgen, U., Esper, J., Frank, D.C., Nicolussi, K., Schmidhalter, M., 2005. A 1052-yeartree-ring proxy for Alpine summer temperatures. Clim. Dyn. 25, 141e153.
Büntgen, U., Frank, D.C., Nievergelt, D., Esper, J., 2006. Summer temperature vari-ations in the European Alps, A.D. 755-2004. J. Clim. 19, 5606e5623.
Büntgen., U, Verstege, A., Barreda, G., Wagner, S., Camarero, J., Krusic, P., Zorita, E.,Ljungqvist, F., Konter, O., Oppenheimer, C., Tegel, O., G€artner, H., Cherubini, P.,Reinig, F and Esper, J., Western Mediterranean climate variability since medievaltimes e new tree-ring evidence from the Pyrenees. Submitted to Journal ofClimate, in review.
Campbell, R., McCarroll, D., Robertson, I., Loader, N.J., Grudd, H., Gunnarson, B., 2011.Blue intensity in Pinus sylvestris tree rings: a manual for a new palaeoclimateproxy. Tree Ring Res. 67 (2), 127e134.
Cook, E.R., 1985. A Time Series Analysis Approach to Tree Ring Standardization.Unpublished PhD thesis. University of Arizona.
Crone, A., Mills, C.M., 2002. Seeing the wood and the trees: dendrochronologicalstudies in Scotland. Antiquity 76 (293), 788e794.
Crone, B.A., 2008. Dendrochronological Analysis of the Oak and Pine Timbers. In:Stirling Castle Palace. Archaeological and historical research, 9.
Crone, A., Mills, C.M., 2011. The Native Oak and Pine Project e some observations ontimber and woodworking in Scottish buildings circa AD 1600 e 1800. Vernac.Build. 34, 19e42.
Crone, A., Mills, C.M., 2012. Timber in Scottish buildings, 1450-1800: a dendro-chronological perspective. Proc. Soc. Antiq. Scot. 142, 329e369.
Douglass, A.E., 1929. The secret of the Southwest solved by talkative tree rings. Natl.Geogr. Mag. 56 (6), 736e770.
Esper, J., Frank, D.C., Timonen, M., Zorita, E., Wilson, R.J., Luterbacher, J.,Holzk€amper, S., Fischer, N., Wagner, S., Nievergelt, D., Verstege, A., 2012. Orbitalforcing of tree-ring data. Nat. Clim. Chang. 2 (12), 862e866.
Fuentes M., Bj€orklund J., Seftigen K., Salo R., Gunnarson B., Aravena J and Linder-holm H. in review. The longest tree-ring Blue Intensity based reconstruction inthe world? 970 years of summer temperature from Rogen, west central
Sweden.Fritts, H.C., Smith, D.G., Cardis, J.W., Budelsky, C.A., 1965. Tree-ring characteristics
along a vegetation gradient in northern Arizona. Ecology 46 (4), 393e401.Fritts, H.C., 1976. Tree Rings and Climate. Academic, San Diego, Calif, p. 567.Harris, I.P.D.J., Jones, P.D., Osborn, T.J., Lister, D.H., 2014. Updated high-resolution
grids of monthly climatic observationsethe CRU TS3. 10 Dataset. Int. J. Clima-tol. 34 (3), 623e642.
Hughes, Malcolm K., Swetnam, Thomas W., Diaz, Henry F. (Eds.), 2010. Den-droclimatology: Progress and Prospects, vol. 11. Springer Science & BusinessMedia.
Kienast, F., Schweingruber, F.H., Br€aker, O.U., Sch€ar, E., 1987. Tree-ring studies onconifers along ecological gradients and the potential of single-year analyses.Can. J. For. Res. 17, 683e696.
Kuniholm, P.I., Striker, C.L., 1987. Dendrochronological investigations in the Aegeanand neighbouring regions, 1983-1986. J. Field Archaeol. 14, 385e398.
Kuniholm, P.I., 2001. Dendrochronology and Other Applications of Tree-ring Studiesin Archaeology. In: Handbook of Archaeological Sciences, pp. 35e46.
LaMarche Jr., V.C., 1974. Frequency-dependent relationships between tree-ring se-ries along an ecological gradient and some dendroclimatic implications. Tree-Ring Bull.
Levani�c, T., 2007. ATRICS-A new system for image acquisition in dendrochronology.Tree Ring Res. 63 (2), 117e122.
Lingg, W., 1986. Dendrooekologische Studien an Nadelbaeumen im alpinen Trock-ental Wallis (Schweiz). Berichte. Rapports. Rapporti. Reports (Switzerland). no.287.
Manning, S.W., Bruce, M.J. (Eds.), 2009. Tree-rings, Kings and Old World Archae-ology and Environment. Oxbow Books, Oxford.
McCarroll, D., Pettigrew, E., Luckman, A., Guibal, F., Edouard, J., 2002. Blue reflec-tance provides a surrogate for latewood density of high-latitude pine tree rings.Arct. Antarct. Alp. Res. 34, 450e453.
McCarroll, D., Loader, N.J., 2004. Stable isotopes in tree rings. Quat. Sci. Rev. 23 (7),771e801.
Mills, C.M., 1988. Dendrochronology in Exeter and its Application. University ofSheffield. PhD Thesis.
Mills, C.M., 2008. Historic pine and dendrochronology in Scotland. Scott. Woodl.Hist. Discuss. Group Notes XIII, 9e14. ISSN 1470e0271.
Mills, C.M., Crone, A., 2012. Dendrochronological evidence for Scotland's nativetimber resources over the last 1000 years. Scott. For. 66 (1), 18e33.
Nash, S., 1999. Time, Trees, and Prehistory: Tree-ring Dating and the Developmentof North American Archaeology, 1914-1950. University of Utah Press, Salt LakeCity, p. 294.
Nicolussi, K., €Osterreicher, A., Weber, G., Leuenberger, M., Bauer, A., Vogeleit, T.,2015. Blue intensity analyses on spruce, larch and cembran pine cores of livingtrees from the Alps. In: Akkemik, Ü. (Ed.), EuroDendro 2015-Book of Abstracts,pp. 139e140.
€Osterreicher, A., Weber, G., Leuenberger, M., Nicolussi, K., 2015. Exploring blue in-tensity - comparison of blue intensity and MXD data from Alpine spruce trees.In: Wilson, R., Helle, G., G€artner, H. (Eds.), TRACE e Tree Rings in Archaeology,Climatology and Ecology, vol. 13, pp. 56e61. Scientific Technical Report 15/06,GFZ German Research Centre for Geosciences.
Pilcher, J.R., Baillie, M.G., Schmidt, B., Becker, B., 1984. A 7,272-year tree-ring chro-nology for western Europe. Nature 312 (5990), 150e152.
Polge, H., 1970. The use of X-ray densitometric methods in dendrochronology. TreeRing Bull. 30, 1e4.
Rydval, M., Larsson, L.-Å., McGlynn, L., Gunnarson, B.E., Loader, N.J., Young, G.H.F.,Wilson, R., 2014. Blue intensity for dendroclimatology: should we have theblues? Experiments from Scotland. Dendrochronologia 32 (3), 191e204.
Rydval, M., Druckenbrod, D., Anchukaitis, K., Wilson, R., 2016a. Detection andremoval of disturbance trends in tree-ring series for dendroclimatology. Can. J.For. Res. 46 (3), 387e401. http://dx.doi.org/10.1139/cjfr-2015-0366.
Rydval, M., Gunnarson, B.E., Loader, N.J., Cook, E.R., Druckenbrod, D.L., Wilson, R.,2016b. Spatial reconstruction of Scottish summer temperatures from tree rings.Int. J. Climatol. http://dx.doi.org/10.1002/joc.4796.
Rydval, M., Loader, N., Gunnarson, B., Druckenbrod, D., Linderholm, H., Moreton, S.,Wood, C., and Wilson, R. Reconstructing 800 years of summer temperatures inScotland. Climate Dynamics. In review-a.
Rydval, M., Druckenbrod, D., Svoboda, M., Trotsiuk, V., Janda, P., Mikol�a�s, M., �Cada,V., Ba�ce, R., Teodosiu, M. and Wilson, R. Influence of sampling and disturbancehistory on climatic sensitivity of temperature limited conifers. Submitted toJournal of Agricultural and Forest Meteorology. In review-b.
Schneider, L., Smerdon, J.E., Büntgen, U., Wilson, R.J., Myglan, V.S., Kirdyanov, A.V.,Esper, J., 2015. Revising midlatitude summer temperatures back to AD 600based on a wood density network. Geophys. Res. Lett. 42 (11), 4556e4562.
Schweingruber, Fritz Hans, 1996. Tree Rings and Environment: Dendroecology. PaulHaupt AG Bern.
Speer, J.H., 2010. Fundamentals of Tree-ring Research. University of Arizona Press.St. George, S., 2014. An overview of tree-ring width records across the Northern
Hemisphere. Quat. Sci. Rev. 95, 132e150.Stoffel, M., Bollschweiler, M., Butler, D.R., Luckman, B.H., 2010. In: Tree Rings and
Natural Hazards: a State-of-art, vol. 41. Springer Science & Business Media.Stokes, M.A., Smiley, T.L., 1968. Tree-ring Dating.Treydte, K., Frank, D., Esper, J., Andreu, L., Bednarz, Z., Berninger, F., Boettger, T.,
D'Alessandro, C.M., Etien, N., Filot, M., Grabner, M., 2007. Signal strength andclimate calibration of a European tree-ring isotope network. Geophys. Res. Lett.34 (24).

R. Wilson et al. / Journal of Archaeological Science 78 (2017) 99e111 111
Wilson, R.J.S., Hopfmueller, M., 2001. Dendrochronological investigations of Norwayspruce along an elevational transect in the Bavarian Forest, Germany. Den-drochronologia 19 (1), 67e79.
Wilson, R.J., Luckman, B.H., 2003. Dendroclimatic reconstruction of maximumsummer temperatures from upper treeline sites in Interior British Columbia,Canada. Holocene 13 (6), 851e861.
Wilson, R.J.S., Esper, J., Luckman, B.H., 2004. Utilising historical tree-ring data fordendroclimatology: a case study from the bavarian forest, Germany. Den-drochronologia 21 (2), 53e68.
Wilson, R.J.S., Rao, R., Rydval, M., Wood, C., Larsson, L.-A., Luckman, B.H., 2014. Blueintensity for dendroclimatology: the BC blues: a case study from BritishColumbia Canada. Holocene 24 (11), 1428e1438.
Wilson, R., Anchukaitis, K., Briffa, K., Büntgen, U., Cook, E., D'Arrigo, R., Davi, N.,
Esper, J., Frank, D., Gunnarson, B., Hegerl, G., Helema, S., Klesse, S., Krusic, P.,Linderholm, H.W., Myglan, V., Osborn, T., Rydval, M., Schneider, L., Schurer, A.,Wiles, G., Zhang, P., Zorita, 2016. Last millennium Northern Hemisphere sum-mer temperatures from tree rings: Part I: the long term context. Quat. Sci. Rev.134, 1e18.
Young, G.H., Loader, N.J., McCarroll, D., Bale, R.J., Demmler, J.C., Miles, D.,Nayling, N.T., Rinne, K.T., Robertson, I., Watts, C., Whitney, M., 2015. Oxygenstable isotope ratios from British oak tree-rings provide a strong and consistentrecord of past changes in summer rainfall. Clim. Dyn. 45 (11e12), 3609e3622.
Zhang, P., Linderholm, H., Gunnarson, B., Bj€orklund, J., Chen, D., 2015. 1200 years ofwarm-season temperature variability in central Fennoscandia inferred fromtree-ring density. Clim. Past Discuss. 11, 489e519. http://dx.doi.org/10.5194/cpd-11-489-2015.