Embed Size (px)
Citation preview
lable at ScienceDirect
Journal of Archaeological Science 36 (2009) 1103–1114
Contents lists avai
Journal of Archaeological Science
journal homepage: ht tp: / /www.elsevier .com/locate/ jas
Integrated geological, petrologic and geochemical approach to establish sourcematerial and technology of Late Cypriot Bronze Age Plain White ware ceramics
Cornelius Tschegg a,*, Theodoros Ntaflos a, Irmgard Hein b
a Department of Lithospheric Research, University of Vienna, Althanstr. 14, 1090 Vienna, Austriab Institute of Egyptology, University of Vienna, Frankgasse 1, 1090 Vienna, Austria
a r t i c l e i n f o
Article history:Received 24 July 2008Received in revised form20 November 2008Accepted 7 December 2008
Keywords:CeramicsCyprusSedimentsMesaoria PlainProvenance studyTechnologyRaw material
* Corresponding author.E-mail address: [email protected] (C.
0305-4403/$ – see front matter � 2008 Elsevier Ltd.doi:10.1016/j.jas.2008.12.004
a b s t r a c t
Late Cypriot Bronze Age Plain White Wheelmade ware samples from several Cypriot excavation sites andthe northern Canaanite coast were studied to ascertain their production centres and details of theirmanufacturing processes and post-depositional alteration. The investigation of the ceramics, usingcombined geoscientific analytical techniques (XRF, ICP-MS, XRD and EPMA) allowed four groups ofpottery to be distinguished based on their common raw-material sources and/or technological analogies.Sediments that were sampled in East Cyprus (eastern Mesaoria Plain) for comparative purposes indicatedthat most of the investigated ceramics were produced from raw materials available around the ancientsettlement of Enkomi. Appraising technological variations and discriminative raw-material characteris-tics, several pottery producing workshops in ancient Enkomi (Eastern Cypriot coast) have been identifiedthat merchandised their commodities on Cyprus and, in all probability, also overseas.
� 2008 Elsevier Ltd. All rights reserved.
1. Introduction
1.1. Archaeological background
During the Late phase of the Middle Cypriot Bronze Age (MC III)and the Late Cypriot Bronze Age (LC, 1750–1050 B.C., acc. to Steel(2002)), Cyprus became an important focus for trade and exchangeof cultural goods. The prime position of the island in the easternMediterranean, as well as its richness in copper and the increase indemand for this metal, is considered to be the pivotal reasons forthe intensive integration of Cyprus into the Mediterranean tradingsystems. Together with the distribution of Cu-ores, also culturalgoods and pottery started being exchanged within and beyondCyprus. Several studies have demonstrated that pottery wasexported from Cyprus to ancient eastern and southern Mediterra-nean markets (e.g. Knapp and Cherry, 1994 and ref. therein;Maguire, 1995; Gomez et al., 2002 and ref. therein; Tschegg et al.,2008). Trade networks within Cyprus are less well understood andit is clear that whilst pottery can often be assigned to a certainproduction region by style, the provenancing of ceramics to the
Tschegg).
All rights reserved.
different areas of Cyprus is often problematic (Gomez et al., 2002and ref. therein).
In this study, we present a direct comparison of Late CypriotBronze Age ceramics from stratified contexts at Enkomi (to a largeextent Plain White Wheelmade (PWW) ware samples) withmaterial from other Cypriot localities and the Canaanite coast andtheir source material. Enkomi is a Late Cypriot Bronze Age settle-ment that lies 1 km east of the modern village of Enkomi, ca. 3 kmfrom the eastern Cypriot coast (see Fig. 1). It is the most extensivelyexcavated LC site on Cyprus and is considered to be the firstestablished ‘‘state-like’’ settlement on the island (Crewe, 2004,2007a). Beside a well-developed copper smelting site, Enkomi alsooccupied the main Cypriot harbour for trade to the eastern Medi-terranean and, therefore, stands out as a centre for exports andimports of numerous products (Knapp and Cherry, 1994).
The Cypriot PWW ware on which the study focused is one of thesubgroups of the large Plain White ware family, a ware group thatfirst appeared as handmade forms in small numbers in MC III (1750–1600 B.C.) and continued throughout the LC phases (1600–1050B.C.), expanding to include wheelmade versions (Åstrom, 1972;Crewe, 2007b). A large majority are closed vessels, although all ofthem are still categorizable as table-, household- and storage-pottery. The ware represents a radical transformation and techno-logical innovation in Cypriot ceramic style and manufacturing

Fig. 1. Map of the circum-Troodos sedimentary successions (modified by author; provided by the Geological Survey Department, Nicosia, Cyprus) and detail from the geologicalmap of Cyprus (modified by author; GSD, 1995). Squares indicate sediment sample positions from this study; triangles, sample points from Vaughan (1987); circles indicateexcavation sites of the studied sherds. The cross locates the Enkomi excavation site. (GP – Galinoporni, HF – Halefga, HST – Hala Sultan Tekke, KD – Kalopsidha; Q – PleistoceneAthalassa Fm., Q1 – Pleistocene Fanglomerate Fm., H – Holocene alluviums and colluviums.)
C. Tschegg et al. / Journal of Archaeological Science 36 (2009) 1103–11141104
techniques, appearing concurrently with the first evidence forextensive trade contacts of Cyprus to other Mediterranean regions.Although the PW ware was not initially thought to be a regularexport ware, it was also distributed outside Cyprus, as was demon-strated by sherds found in the Egyptian Nile Delta in late SecondIntermediate Period levels (Tell el-Dabca – Hein and Janosi, 2004),and for instance in a later stage equivalent to LC II at the northernCanaanite coastal region (Tell Abu Hawam – Artzy, 2006). Central-ized pottery productions are assumed to have increased during theProtohistoric Bronze Age on Cyprus, although there is evidence thatlocal, sometimes specialized manufacturing took place at the sametime (Knapp and Cherry, 1994). Typological studies indicate a highlikelihood both of several manufacturing centres and of regionalceramic exchange throughout the island. Provenancing pottery viaidentification of the original source material facilitates pinpointingdefinite production centres/manufacturing workshops, as well asspecific trading contacts on the island.
1.2. Geological setting
Enkomi is located in the eastern part of the Mesaoria Plain, nearFamagusta Bay (see Fig. 1). This plain extends from Morphou Bay inthe west to Famagusta Bay in eastern Cyprus and is bounded to thenorth by the Kyrenia Range, comprising Carboniferous to Creta-ceous limestones overlain by Late Palaeogene to Neogene flyschdeposits, passing up to recent alluvial/colluvial sediments. In thesouth, the basin adjoins Upper Cretaceous rocks of the Troodosophiolite sequence and its Upper Cretaceous to recent sedimentarysuccessions. Morphologically, the Mesaoria Plain lies at a maximumheight of 300 m.a.s.l (metres above sea level) and is bounded by theKyrenia range to the north, with elevations of up to 910, and theTroodos massif to the south, with heights of up to 1940 m.a.s.l.(Neal, 2002).
Geologically, the eastern Mesaoria Basin comprises sediments ofthe Pliocene Nicosia Formation and the Pleistocene AthalassaFormation, stratigraphically overlain by Pliocene–Pleistocene fan-glomerates and terrace deposits, as well as Holocene alluvial
sediments (McCallum and Robertson, 1995; Robertson et al., 1995).The Nicosia Formation consists of limestones, marls, sandstones,conglomerates, gravels and silts (Calon et al., 2005; GSD, 1995). Thissuccession of marine sedimentation is conformably followed byshallow marine calcarenites, sandstones, marls and conglomeratesof the upper Pliocene to Pleistocene Athalassa Formation (GSD,1995; Robertson and Woodcock, 1986). The overlying extensivedeposition of fluvial and alluvial material during the Quaternarywas related to erosion resulting from the uplift of the Troodosmassif. These consist of an unconformably deposited undifferenti-ated lower marine sequence and an upper terrigenous sequence ofconglomerates, breccias, gravels, sands, silts and lacustrine muds,summarized as the Pleistocene fanglomerates (Calon et al., 2005;GSD, 1995). The Holocene alluvium, represented by spaciousfloodplains, alluvial channels and fan deposits, comprises sands,silts, clays and gravels (GSD, 1995; Newell et al., 2004).
2. Ceramic collection and raw-material sampling
Sample identification numbers, specific ware types and exca-vation sites of all analyzed ceramic specimens and raw materialsare summarized in Table 1.
The majority (22 sherds) of the Plain White Wheelmade (PWW)ware specimen investigated here were taken from material held inthe Larnaca Museum stores, from excavations at Enkomi in the late1940–1950 (Dikaios, 1969–1971) and were recently analyzed byCrewe (2004, 2007a). The Cypriot PWW ware is an appropriateware group for provenance investigations as, firstly, it wasproduced in large quantities and, secondly, as a utilitarian ware it isquite simply made, without intensive raw-material conditioning orcomplex surface treatments. Consequently, it reflects the used rawmaterial in a relatively pristine state, which considerably eases thequest for its provenance.
Additional PWW samples, excavated in Cyprus and the northernCanaanite coast, were added to the study for comparison (seeTable 1). Samples from sherd material currently held in the CyprusMuseum Nicosia from pre-1974 were from rescued tombs: two

Table 1List of ceramic samples and sediments with their associated place of finding.
Plain White Wheelmade ware
Enkomi 2191/2, 2191/5, 2191/13, 2191/14, 2191/15, 2248/1, 2248/4,2248/5, 2248/6, 2248/8, 2248/9, 4527/17, 2300a, 2300b, 2300/4,2300/7, 2300/12, 2300/13
Galinoporni Sherd 1, Sherd 6 Comparative materialHalefga T2Hala Sultan Tekke F1, F1/1, F6002/1, F6008Kalopsidha LCIITell Abu Hawam 5014/6, 5046/36, 5064/69, 5103/7
Red on Black ware
Enkomi 2191/6, 2192/10, 2267/1, 2267/2
Sediments (see also Fig. 1)
Eastern Mesaoria Plain ENK1, ENK2, ENK5, GYP1, GYP2, GYP3, HST
C. Tschegg et al. / Journal of Archaeological Science 36 (2009) 1103–1114 1105
sherds from Galinoporni Tomb 1 (1956) and one from HalefgaForest Station tomb. F1 and F1/1 represent sherds from a well atHala Sultan Tekke (Cyprus, early 14th century B.C.), F6002/1 andF6008 from an LC IIIA1 layer at Hala Sultan Tekke (Åstrom andÅstrom, 1972; Obrink, 1979, 1983). The sample LCII was found ina disturbed LC layer (assumed to be LC II) at Kalopsidha (Cyprus).Four comparative PWW specimens were found during a salvageexcavation in 2001 in Tell Abu Hawam, a site in the vicinity ofmodern Haifa (Israel), where a large percentage of the ceramicmaterial has been assumed to be imported from Cyprus. Thepottery samples can mainly be assigned from the 14th to the firsthalf of the 13th century B.C. (Artzy, 2006). Finally, four Red on Black(RoB) samples, also from Enkomi (Dikaios’ excavations) wereadditionally analyzed to determine the differences and analogies ofunequal ware groups from the same excavation site and the sameassumed provenance.
Representative amounts of fine-grained raw materials suitablefor pottery production were collected from typical outcrops of thegeological formations in the vicinity of the Enkomi excavation site,to compare their chemical and mineralogical composition withceramic samples that were supposedly locally produced at Enkomi.Three samples were collected from Pleistocene fanglomerateterraces; one (ENK1) from close to the Enkomi excavation site, two(GYP1, GYP2) from roadside outcrops between Lapathos andSygkrasi (see Fig. 1). These loose silty clays (USDA classification; SoilSurvey Division Staff, 1993) consist mainly of siliceous and calcar-eous constituents; the clay mineral fraction is composed of smec-tite-, illite- and chlorite-group minerals at more or less the sameproportions, and some kaolinite (see Fig. 5b–d). All three Pleisto-cene samples contained a few coarse (0.5–3 mm) calcareous shellfragments. Sample ENK2 was taken from a horizon near the exca-vation, whereas GYP3 samples a floodplain to the north; bothsamples are Holocene silty loams (USDA classification; Soil SurveyDivision Staff, 1993) from different alluvial environments. ENK5reflects the silty fraction of a fluvially deposited Holocene sequenceto the west of the excavation. Apart from the considerable amountsof dolomite, the Holocene samples have a similar bulk mineralogyto the Pleistocene samples, although their clay mineral fraction issmaller and consists mainly of smectite group minerals (see Fig. 5a).An additional sample was taken near Larnaca, at Hala Sultan Tekke.This is similar to the other Holocene samples, in that it is alsodolomite bearing, but additionally shows substantial amounts ofhalite. Comparative ICP-AES analyzed marl clays from the PlioceneNicosia Formation (Vaughan, 1987) in the vicinity of Famagusta andin the southern Mesaoria Plain (see Fig. 1), were also included in thegeochemical interpretation. These mainly contain smectite andchlorite group minerals (Vaughan, 1987).
3. Analytical techniques
Bulk major element compositions of pottery specimens andcollected raw materials were analyzed with a Philips PW 2400sequential wavelength-dispersive X-ray fluorescence spectrometer(XRF), trace- and rare-earth element compositions were deter-mined using a Perkin Elmer Elan 6100 DRC inductively coupledmass spectrometer (ICP-MS; both from the Department of Litho-spheric Research, University of Vienna). Sample preparation andmeasuring techniques followed the procedure described in Tschegget al. (2008). Loss on ignition (LOI) was determined by firing thespecimens for 3 h at 950 �C.
For qualitative bulk mineralogical analyses, oriented samples wereprepared and measured on a Philips PW 1820 X-ray diffraction spec-trometer (XRD; Department of Geodynamics and Sedimentology,University of Vienna), using 45 kV and 35 mA and a scanning range of2–70� 2q. Clay mineralogy was determined on a <2 mm fractionseparate, obtained by sedimentation. Prior to analysis, the sedimentswere disaggregated and homogenized with a 400 W ultrasonic probe;organic matter was removed by treatment with diluted H2O2.Ethylene-glycol saturated, oriented XRD mounts of the<2 mm fractionswere additionally prepared to define expandable clay mineral groups.
Mineral assemblages and textural features of the ceramics werestudied on polished thin-sections with an optical microscope.Microtextural relationships and mineral chemistries were analyzedon carbon-coated thin-sections with a Cameca SX 100 electron-microprobe (EPMA) equipped with four wavelength-dispersive(WDS) and one energy-dispersive (EDS) spectrometers (Depart-ment of Lithospheric Research, University of Vienna) at operatingconditions of 15 kV and 20 nA. All measurements were madeagainst natural standards and standard correction procedures wereapplied. For micro-chemical and micro-morphological character-ization of the raw material, samples and for the comparison ofceramic-included minerals/microfossils with minerals/microfossilsin the raw materials, a >63 mm grain-size separate was embeddedin resin and analyzed with the EPMA. On some ceramic specimenswith a slip, line-scans with the defocused beam technique (5 mmbeam diameter) were made, to compare ceramic body and slipgeochemical compositions. The distribution of elements in slip andbody was also determined with a high-resolution qualitative WDSelemental mapping procedure (20 kV, 20 nA). Image analyses withScion Image for Windows (�Scion Corporation) were performed todetermine the porosity. SPSS 15.0 for Windows (�SPSS Inc.) wasused to perform statistical data reduction treatments.
4. Results
4.1. Bulk geochemistry – major elements
Bulk geochemical compositions of ceramics and sediments arereported in Table 2 and illustrated in Figs. 2 and 3. After statisticaldata reduction treatments, four groups of ceramics were discrimi-nated, on the basis of their bulk major and trace element chemistry.Group A comprises the largest number of PWW ware samplesexcavated in Enkomi, but also includes sherds from Galinoporni,Halefga, Hala Sultan Tekke, Kalopsidha and Tell Abu Hawam. TheSiO2 content ranges from 47.5 to 55.3 wt.%, Al2O3 from 12.1 to14.4 wt.%, CaO varies from 11.4 to 23.6 wt.% and K2O from 1.7 to3.3 wt.%. Group B includes three PWW and four RoB sherds fromEnkomi and one PWW sample from Hala Sultan Tekke. Comparedto Group A, the specimens of this group have lesser internal vari-ations in chemical composition, with higher concentrations of SiO2
(56.3–58.3 wt.%), Al2O3 (15.6–16.5 wt.%) and K2O (3.2–3.5 wt.%)and lower amounts of CaO (7.5–10.5 wt.%). Group C comprises twoPWW ware samples from Tell Abu Hawam with SiO2, Al2O3, CaO

Table 2Bulk major and trace element abundances of Cypriot PWW samples as well as related ceramics and raw materials.
Group A
2191-2 2191-5 2191-13 2191-14 2191-15 2248-1 2248-4 2248-5 2248-6 2248-8 2248-9 4527/17 2300b 2300/4 2300/12 Sherd1 Sherd6 T2 F6002/1 F6008 LCII 5103/7
Major elements [XRF analyses in wt.%]SiO2 51.4 51.2 51.3 51.0 51.4 52.2 54.8 48.5 51.5 50.7 52.0 48.3 51.0 50.8 49.8 55.2 55.3 50.6 52.0 51.3 47.5 51.4TiO2 0.77 0.73 0.82 0.74 0.74 0.79 0.73 0.76 0.74 0.81 0.72 0.70 0.75 0.77 0.69 0.75 0.82 0.78 0.71 0.72 0.70 0.78Al2O3 14.0 13.0 12.9 13.8 13.2 14.4 13.3 13.9 14.01 14.2 13.5 13.1 13.0 13.4 12.1 14.2 13.9 13.2 12.9 12.6 12.5 14.0FeOa 7.08 6.76 7.26 7.10 6.81 7.25 6.77 7.59 7.09 7.99 6.94 6.95 7.32 7.06 6.36 6.99 7.18 6.98 7.07 6.42 6.28 6.27MnO 0.16 0.15 0.15 0.17 0.16 0.18 0.15 0.15 0.17 0.15 0.16 0.13 0.15 0.13 0.11 0.13 0.14 0.13 0.14 0.13 0.12 0.13MgO 6.32 7.73 4.54 6.74 7.01 6.41 5.13 5.62 6.10 5.51 6.68 5.49 6.21 5.02 5.97 5.61 5.54 4.22 4.47 4.98 4.78 5.05CaO 16.0 15.9 17.7 16.1 15.6 15.1 14.6 19.1 15.8 16.2 14.7 20.3 16.7 17.6 19.2 11.4 12.7 19.7 17.9 19.4 23.6 18.1Na2O 1.47 1.68 2.69 1.55 1.82 1.54 1.50 1.44 1.35 1.59 1.48 1.68 1.88 1.89 1.89 1.32 1.87 1.89 1.99 1.61 1.70 1.63K2O 2.34 2.13 1.73 2.41 2.22 2.04 2.89 2.24 2.95 2.29 2.72 2.05 2.11 2.26 2.32 3.27 2.13 1.85 1.66 1.99 1.77 2.12P2O5 0.23 0.21 0.24 0.30 0.24 0.23 0.21 0.28 0.23 0.20 0.31 0.34 0.27 0.26 0.54 0.17 0.12 0.30 0.16 0.16 0.20 0.29
Total 99.8 99.6 99.3 99.9 99.2 100.1 100.1 99.6 100.1 99.7 99.2 99.0 99.5 99.1 98.9 99.1 99.7 99.6 98.9 99.4 99.1 99.7LOI 7.9 8.8 4.6 4.8 10.3 7.7 12.5 7.5 11.4 5.2 12.2 9.6 8.0 4.4 9.3 9.3 14.4 11.7 16.3 5.7 12.7 7.9
Trace elements [ICP-MS analyses in ppm]Li 44.0 41.0 27.3 39.9 30.3 39.6 27.7 34.7 38.0 38.7 35.9 28.0 22.5 30.7 27.6 33.5 47.3 28.2 33.5 25.9 28.5 28.2Be 1.55 1.42 0.82 1.57 1.33 1.62 1.18 1.11 1.69 1.27 1.42 0.99 0.86 1.07 0.86 1.12 1.92 0.94 1.03 0.84 1.01 0.99Sc 12.6 13.4 13.4 15.5 14.0 14.9 11.4 15.5 12.8 16.4 13.4 15.3 12.3 12.7 9.94 13.2 12.4 12.9 22.1 18.8 10.3 17.7V 129 128 167 143 128 161 130 188 150 185 152 169 153 177 125 168 169 151 225 206 145 169Cr 259 357 358 317 274 357 325 305 284 415 385 417 324 382 242 796 568 323 973 857 333 334Co 29.1 30.4 25.3 34.7 29.6 37.2 28.2 32.6 33.9 34.8 34.0 28.8 26.5 28.4 21.4 30.1 31.6 26.5 31.3 29.0 20.8 25.4Cu 74.4 76.7 101 112 50.2 73.9 73.4 86.8 86.3 83.2 83.3 529 770 616 623 64.5 89.0 55.9 78.2 65.8 59.3 131Zn 90.5 96.4 88.1 92.4 84.0 108 95.7 93.5 85.3 97.2 153 66.4 77.0 116 87.5 72.7 95.8 75.9 81.8 68.6 63.6 63.7As 6.17 6.89 8.14 6.69 1.30 4.91 8.36 10.8 7.04 11.9 7.24 11.6 12.6 23.1 15.7 10.1 5.63 6.69 8.52 11.9 7.18 35.5Rb 72.7 63.8 50.8 80.1 58.5 75.4 66.3 63.9 83.5 70.7 69.2 59.0 40.8 58.2 51.4 65.7 108 52.3 52.7 41.2 55.6 52.6Sr 616 543 501 674 445 489 556 684 552 602 562 794 673 673 743 358 325 354 403 668 560 532Y 21.6 22.7 21.3 24.0 21.1 26.5 19.5 24.0 23.5 24.2 22.9 23.2 20.5 23.6 21.1 24.3 24.3 23.5 26.2 24.6 23.1 19.7Zr 78.0 109 72.6 97.0 72.3 101 87.9 102 105 99.2 87.6 105 75.1 83.8 68.6 111 109 76.3 81.2 69.4 78.4 139Nb 11.6 11.9 9.58 13.9 11.6 14.6 10.4 10.4 13.4 9.52 11.3 9.45 7.86 9.94 8.83 11.4 15.8 8.47 8.99 8.00 9.93 7.07Cs 4.40 3.70 3.19 4.25 3.91 4.75 3.33 3.45 3.98 3.76 3.28 2.89 1.97 3.01 2.36 3.34 5.02 2.75 2.43 1.95 2.85 2.65Ba 375 363 240 400 300 384 301 300 356 257 285 535 246 295 344 224 256 188 378 434 447 258La 22.2 21.6 15.9 22.1 19.4 24.3 18.1 17.1 21.6 16.8 19.6 17.2 13.6 17.4 15.5 17.2 23.9 14.9 15.3 13.9 16.5 13.5Ce 41.7 40.4 29.1 41.6 36.9 46.0 34.3 31.9 40.9 32.7 36.8 31.1 24.9 32.6 27.4 31.5 49.0 26.5 27.4 24.4 28.3 24.3Pr 5.58 5.43 4.08 5.55 4.89 6.11 44.4 4.39 5.43 4.31 4.98 4.29 3.46 4.39 3.93 4.40 6.25 3.82 4.04 3.61 4.12 3.39Nd 22.7 22.3 16.3 22.5 19.8 24.7 17.9 18.0 21.9 17.6 20.2 17.9 14.4 18.2 16.3 18.2 25.1 16.1 17.1 15.2 17.1 14.0Sm 4.48 4.43 3.27 4.47 3.96 4.96 3.59 3.84 4.36 3.74 4.14 3.75 3.17 3.85 3.41 3.79 5.07 3.43 3.82 3.75 3.63 3.03Eu 1.06 1.07 0.92 1.07 0.91 1.16 0.92 1.00 1.01 0.98 0.98 0.99 0.85 1.00 0.90 0.98 1.11 0.92 1.08 1.16 0.95 0.81Gd 3.91 3.92 3.11 3.89 3.45 4.32 3.18 3.51 3.81 3.45 3.58 3.37 2.86 3.51 3.09 3.48 4.28 3.28 3.57 3.26 3.25 2.80Tb 0.62 0.64 0.54 0.63 0.56 0.71 0.52 0.59 0.62 0.59 0.59 0.56 0.49 0.59 0.53 0.59 0.70 0.56 0.62 0.57 0.54 0.48Dy 3.78 3.89 3.49 4.05 3.41 4.29 3.17 3.72 3.77 3.79 3.65 3.55 3.20 3.71 3.28 3.74 4.16 3.63 4.03 3.77 3.45 3.03Ho 0.79 0.81 0.74 0.81 0.69 0.87 0.66 0.80 0.77 0.80 0.76 0.76 0.69 0.78 0.69 0.79 0.83 0.76 0.87 0.81 0.72 0.65Er 1.98 2.04 1.89 2.06 1.81 2.28 1.69 2.09 2.02 2.08 1.96 1.96 1.78 2.01 1.77 2.03 2.13 2.00 2.23 2.08 1.87 1.69Tm 0.33 0.34 0.32 0.34 0.30 0.38 0.28 0.35 0.34 0.35 0.33 0.33 0.30 0.34 0.30 0.35 0.36 0.33 0.37 0.36 0.32 0.29Yb 2.03 1.95 1.88 2.03 1.72 2.18 1.69 1.64 1.99 2.09 1.95 1.95 1.80 2.01 1.75 2.03 2.16 2.00 2.25 2.09 1.84 1.69Lu 0.27 0.28 0.26 0.29 0.24 0.31 0.24 0.30 0.29 0.30 0.28 0.28 0.25 0.29 0.25 0.29 0.30 0.29 0.32 0.30 0.26 0.24Ta 1.08 1.05 1.69 0.99 1.07 1.05 0.67 0.82 0.92 0.81 0.75 1.46 0.84 0.89 0.77 0.99 1.44 1.80 0.71 1.69 1.39 0.65Pb 14.6 13.9 10.6 12.6 9.24 12.8 18.6 13.0 15.9 18.9 16.9 12.6 12.4 27.4 12.8 17.3 25.3 11.7 9.44 8.38 10.6 14.2Th 6.58 6.42 5.03 7.40 6.50 8.12 7.54 5.94 7.97 6.06 7.07 5.96 4.27 5.59 5.22 5.76 9.55 4.74 4.70 4.20 5.43 4.27U 1.74 1.76 1.46 2.10 1.23 1.93 1.79 1.57 1.77 1.75 1.96 2.41 1.53 2.32 2.54 1.66 1.98 1.70 2.25 1.96 4.06 1.60P
LILE 1072 977 798 1164 812 958 933 1056 1001 938 926 1397 965 1034 1146 655 700 601 840 1149 1072 848P
HFSE 111 143 104 135 105 142 118 137 142 133 122 137 104 117 98.5 146 149 108 116 102 111 166P
TTE 594 702 753 714 580 751 664 721 652 832 821 1226 1362 1333 1108 1145 965 646 1411 1245 631 740P
REE 111 109 81.8 111 98.1 123 90.7 89.2 109 89.7 100 88.0 71.7 90.7 79.1 89.4 125 78.5 83.0 75.3 82.8 69.9
C.Tschegget
al./Journal
ofA
rchaeologicalScience
36(2009)
1103–11141106

Group B Group C Group D PL. SEDIMENTS HO. SEDIMENTS
2191/6 2192/10 2267/1 2267/2 2300a 2300/7 2300/13 F1/1 5014/6 5046/69 F1 5064/36 ENK1 G 1 GYP2 ENK2 ENK5 GYP3 HST
Major elements [XRF analyses in wt.%]SiO2 58.3 56.7 56.9 58.3 56.3 56.4 57.2 57.2 47.7 51.2 44.8 46.6 50.0 48 56.5 38.0 44.1 44.6 36.2TiO2 0.91 0.92 0.93 0.91 0.90 0.82 0.90 1.29 0.80 0.58 0.98 1.25 0.65 0. 0.71 0.56 0.68 0.53 0.40Al2O3 16.0 16.5 16.3 15.9 16.0 16.0 15.5 15.2 10.7 11.9 12.2 12.8 12.2 14 11.4 9.65 10.0 8.79 9.61FeOa 6.84 6.86 6.87 6.91 7.09 6.18 6.73 6.66 6.28 7.23 5.96 5.85 6.74 7. 5.55 5.00 4.80 4.74 5.23MnO 0.16 0.15 0.13 0.17 0.18 0.09 0.15 0.16 0.22 0.20 0.08 0.07 0.14 0. 0.15 0.10 0.12 0.12 0.15MgO 4.73 4.66 4.17 4.56 4.80 4.80 7.5 4.56 5.99 7.56 1.42 2.09 6.28 6. 2.95 6.69 8.12 3.14 10.5CaO 7.49 8.59 9.08 7.61 9.17 10.5 9.94 9.16 23.7 17.0 31.6 28.7 20.6 18 18.8 36.3 28.2 33.8 33.7Na2O 1.38 1.35 1.35 1.23 1.49 1.12 1.31 1.62 1.61 1.63 0.36 0.53 0.79 1. 0.76 1.06 1.66 1.24 2.86K2O 3.27 3.36 3.35 3.31 3.50 3.49 3.33 3.17 1.44 1.81 1.07 0.66 1.80 2. 2.02 1.20 0.86 1.41 0.54P2O5 0.24 0.24 0.20 0.60 0.20 0.35 0.27 0.29 1.14 0.39 0.37 1.17 0.10 0. 0.07 0.10 0.12 0.08 0.08
Total 99.4 99.3 99.3 99.5 99.7 99.7 100 99.4 99.5 99.5 98.9 99.7 99.4 99 98.9 98.7 98.6 98.5 99.3LOI 2.6 4.3 3.6 3.9 13.3 10.2 6.8 3.2 8.4 6.7 14.6 12.5 18.4 16 14.7 26.0 22.7 22.2 31.3
Trace elements [ICP-MS analyses in ppm]Li 52.0 53.9 53.9 53.2 63.0 43.4 60.1 59.0 17.9 16.3 22.1 11.9 27.4 32 19.4 15.6 20.5 11.9 16.2Be 2.61 2.59 2.64 2.28 2.26 2.37 2.17 2.08 0.60 0.77 1.46 1.23 n.d. 0. 0.85 n.d. n.d. n.d. n.d.Sc 12.8 12.3 12.1 12.1 13.6 10.1 13.3 13.3 20.5 22.6 7.62 11.0 13.1 11 8.45 6.15 6.72 5.31 9.66V 101 108 99.7 99.1 172 141 165 157 278 266 122 194 117 93 75.6 84.5 55.2 53.2 80.8Cr 139 135 123 141 244 191 230 219 1273 3022 185 237 299 29 601 190 209 265 82.8Co 19.5 17.7 16.0 18.8 29.7 19.6 28.3 26.6 26.8 54.8 60.0 17.4 18.3 18 13.9 8.92 12.0 9.01 11.7Cu 63.1 49.3 45.1 50.6 237 324 214 211 286 592 36.7 128 35.6 29 20.8 18.4 16.1 14.1 30.9Zn 100 86.8 74.8 84.6 103 128 93.6 88.4 59.8 75.5 68.9 101 56.2 55 45.9 30.6 32.7 27.1 35.4As 6.96 9.62 6.05 8.43 13.7 11.9 13.3 13.0 190 35.0 15.6 52.8 32.6 13 18.0 20.7 11.7 15.4 12.8Rb 98.9 101 101 96.1 150 139 142 139 27.2 28.8 51.6 22.3 42.2 45 41.7 22.1 21.6 22.4 10.5Sr 240 230 287 254 337 361 311 284 707 531 591 939 452 36 259 337 477 221 664Y 22.5 22.4 22.0 22.4 28.1 27.4 26.5 23.7 18.2 21.7 45.3 35.0 15.3 14 16.0 9.38 11.1 9.84 9.10Zr 85.0 81.5 89.9 85.5 138 127 130 116 75.8 120 130 108 51.4 56 58.2 28.0 35.3 31.6 19.8Nb 15.0 15.1 15.7 14.6 21.2 18.5 20.0 18.9 5.04 6.39 17.3 13.5 5.60 6. 7.15 2.70 4.25 2.60 1.59Cs 5.86 5.78 5.84 5.70 7.02 6.67 6.68 6.56 1.00 1.10 2.27 0.73 2.86 3. 2.57 1.56 1.45 1.36 0.50Ba 541 356 1044 295 522 295 489 435 346 218 305 675 242 24 295 79.8 101 115 186La 30.8 30.6 30.7 29.3 33.5 32.4 31.6 29.4 10.1 12.4 8.40 11.0 12.0 14 16.5 8.03 9.90 9.77 4.63Ce 54.7 55.3 57.1 53.8 69.9 61.9 66.1 61.2 17.1 23.5 15.5 17.8 22.8 26 31.8 14.8 18.8 17.9 8.17Pr 7.43 7.36 7.49 7.14 8.49 7.88 8.01 7.44 2.67 3.26 2.05 2.60 2.90 3. 3.92 1.93 2.42 2.31 1.00Nd 27.9 27.8 28.1 26.9 31.8 29.4 30.0 27.8 11.4 13.6 8.09 11.0 10.9 12 14.8 7.23 9.07 8.64 4.12Sm 5.45 5.32 5.59 5.19 6.34 5.74 5.98 5.51 2.89 3.01 1.68 2.22 2.38 2. 3.06 1.58 2.00 1.87 0.85Eu 1.12 1.09 1.17 1.08 1.34 1.14 1.27 1.16 0.92 0.79 0.40 0.59 0.61 0. 0.72 0.39 0.51 0.46 0.31Gd 4.46 4.41 4.43 4.34 5.21 4.74 4.91 4.49 2.41 2.85 1.54 2.01 2.22 2. 2.71 1.45 1.83 1.67 1.12Tb 0.69 0.69 0.69 0.68 0.82 0.74 0.78 0.71 0.43 0.49 0.25 0.32 0.36 0. 0.43 0.24 0.30 0.27 0.19Dy 4.12 4.05 4.06 4.13 4.81 4.46 4.54 4.14 2.76 3.21 1.51 1.95 2.34 2. 2.67 1.47 1.88 1.69 1.30Ho 0.84 0.82 0.82 0.84 0.98 0.91 0.92 0.84 0.61 0.69 0.32 0.41 0.49 0. 0.55 0.31 0.39 0.35 0.29Er 2.16 2.12 2.10 2.19 2.53 2.38 2.39 2.18 1.57 1.82 0.82 1.06 1.29 1. 1.45 0.80 1.02 0.90 0.75Tm 0.35 0.34 0.34 0.36 0.41 0.40 0.39 0.36 n.d. 0.30 0.13 0.18 0.21 0. 0.23 0.13 0.16 0.15 0.12Yb 2.05 2.03 2.00 2.10 2.48 2.37 2.34 2.13 1.54 1.81 0.77 0.99 1.29 1. 1.38 0.77 0.98 0.88 0.74Lu 0.29 0.28 0.28 0.30 0.35 0.34 0.33 0.30 0.22 0.27 0.11 0.14 0.18 0. 0.20 0.11 0.14 0.12 0.11Ta 1.13 1.07 1.11 1.04 1.57 1.56 1.51 1.41 0.81 0.63 1.30 0.88 0.36 0. 0.50 0.25 0.32 0.18 0.14Pb 32.2 31.1 31.6 31.1 35.6 22.8 34.5 33.4 8.86 9.46 13.9 62.8 10.5 16 14.8 7.57 10.9 10.4 2.70Th 9.57 9.49 9.98 9.14 13.3 13.2 12.6 12.0 2.33 3.20 8.05 5.00 3.43 4. 4.69 2.02 2.78 2.75 0.77U 2.48 2.39 2.56 3.00 3.16 3.19 2.99 2.85 1.79 0.82 2.57 6.61 n.d. 1. 0.99 0.58 0.75 0.57 0.45P
LILE 892 699 1445 658 1025 811 959 873 1084 783 958 1648 740 66 601 441 603 362 862P
HFSE 122 119 128 123 188 173 176 159 99.0 148 193 156 72.3 77 81.3 40.1 50.7 44.1 30.5P
TTE 437 408 370 406 799 814 744 715 1943 4033 480 687 539 50 765 338 331 373 251P
REE 142 142 145 138 169 155 160 148 54.6 68.0 41.6 52.2 60.0 69 80.4 39.3 49.4 47.0 23.7
Loss on ignition; n.d. – not detected; PL. – Pleistocene; HO – Holocene; LILE – Rb, Sr, Ba, Th, U; HFSE – Y, Zr, Nb; TTE – Sc, V, Cr, Co, Cu, Zn; REE – La to Lu.a Total iron is shown as FeO.
C.Tschegget
al./Journal
ofA
rchaeologicalScience
36(2009)
1103–11141107
YP
.278.0
241646.7
071417
.0.0
.480.7.87.4.5.6.2.64.9.0
47307.2.8
37.7
7268454049523522341943.3
4913
2.46.4

40 50 60 70 800
10
20
30
40
CaO
[w
t. %
]
SiO2+Al
2O
3+K
2O [wt. %]
40 50 60 70 800
50
100
150
200
ΣR
EE
[p
pm
]
SiO2+Al
2O
3+K
2O [wt. %]
a bgroup Agroup Bgroup Cgroup DPl. sed.Ho. sed.
group Agroup Bgroup Cgroup DPl. sed.Ho. sed.
Fig. 2. Co-variation diagrams for major and trace elements of the analyzed ceramic and sediment samples. (a) Clay constituents (SiO2þ Al2O3þ K2O) plotted against CaO and (b)clay constituents against total REE concentrations. (Pl. sed. – Pleistocene sediments, Ho. sed. – Holocene sediments)
C. Tschegg et al. / Journal of Archaeological Science 36 (2009) 1103–11141108
and K2O contents varying between 47.7 and 51.2 wt.%, 10.7 and11.9 wt.%, 17.0 and 23.7 wt.% and 1.4 and 1.8 wt.% respectively and,therefore show a similar bulk major element composition as GroupA. Group D, which includes one sample from Tell Abu Hawam andone from Hala Sultan Tekke, is characterized by comparatively lowamounts of SiO2 and K2O (44.8–46.6 wt.% and 0.7–1.1 wt.%) butwith very high concentrations of CaO (28.7–31.6 wt.%).
The Pleistocene sediments have SiO2, Al2O3, CaO and K2O concen-trations that range from 48.2 to 56.5 wt.%, 11.4 to 14.0 wt.%, 18.7 to20.6 wt.% and from 1.8 to 2.4 wt.% respectively; therefore, they plot inthe same range as the Group A samples. The Holocene raw-materialspecimens have low SiO2 and Al2O3 contents (36.2–44.6 wt.% and 8.8–10.1 wt.%) at very high CaO contents (28.2–36.3 wt.%).
4.2. Bulk geochemistry – trace and rare earth elements
To simplify the large set of these elements, they were categorizedinto four groups of geochemically related elements (see Table 2): LILE(large ion lithophile elements: Rb, Sr, Ba, Th, U), HFSE (high fieldstrength elements: Y, Zr, Nb), TTE (transition trace elements: Sc, V, Cr,Co, Cu, Zn) and REE (rare earth elements: La–Lu). The total LILEconcentrations (
PLILE) in Group A range from 604 to 1397 ppm, the
summed HFSE (P
HFSE) vary from 99 to 166 ppm, total TTE (P
TTE)from 580 to 1411 ppm and the sum of REE (
PREE) ranges from 70 to
125 ppm. Group B hasP
LILE concentrations from 658 to 1445 ppm,
0.01
0.1
1
10
La Ce Pr Nd Sm Eu Gd Tb Dy Ho Er Tm Yb Lu
Ro
ck/U
CC
Upper Continental Crust REE from Taylor and McLennan, 1985, McLennan, 2001;
group A (& range)group B (& range)group Cgroup DPleistocene sediments (& range)Holocene sediments (& range)
Fig. 3. Upper Continental Crust (Taylor and McLennan, 1985; McLennan, 2001)normalized REE patterns showing average sample-group compositions and ranges(minima–maxima) of element concentrations.
PHFSE from 119 to 188 ppm,
PTTE from 370 to 814 ppm and
PREE
concentrations that range from 139 to 169 ppm. In Group C the totalamount of LILE varies between 783 and 1084 ppm, of HFSE between 99and 148 ppm, concerning TTE it ranges from 1943 to 4033 ppm andthe
PREE varies from 55 to 68 ppm. Summarized concentrations of
LILE, HFSE, TTE and REE in Group D range from 958 to 1648 ppm,156 to193 ppm, 480 to 687 ppm and 41 to 52 ppm respectively.
La and Lu concentrations of Group B as well as the overall REEpattern correspond closest to the composition of the UCC (UpperContinental Crust; Taylor and McLennan, 1985; McLennan, 2001);all other samples have lower REE concentrations (Fig. 3) due tocarbonate dilution. Compared to the UCC composition, Group A isreduced by a factor of 1.7 and 1.1 for La and Lu, respectively,whereas Group C is depleted by factors of 2.7 and 1.3 and Group Dby 3 and 2.5. The average composition of the Pleistocene sedimentsis 2.1 and 1.7 times lower for La and Lu and the Holocene sedimentsis 3.8 and 2.7 times lower, respectively.
The mean La/Sm ratio is highest in Group B at 5.5, indicating analmost flat pattern of light REE (LREE) in contrast to the lowest inGroup C (3.8), which shows the strongest depletion in LREE. Allsamples have relatively flat heavy REE (HREE) patterns, withaverage Gd/Yb ratios varying from 1.6 in Group C and 2.1 in Group B.Due to increased modal amounts of feldspars in all analyzedsamples, REE patterns show positive Eu anomalies.
In summary, of the major elements, CaO has the largest variationand correlates negatively with the major clay mineral constituents(SiO2, Al2O3, K2O), as well as the REE (see Fig. 2a, b).
Statistical processing of the dataset using principal componentanalysis summarizes and nicely illustrates the main geochemicalvariations in the studied ceramics and sediments. Group Acomprises the largest cluster of ceramics to which the Pleistocenesediments from the vicinity of Enkomi and four Pliocene sedimentsfrom Vaughan (1987) conform. The main group-determiningelements are illustrated in Fig. 4. High concentrations of REE andtheir positive correlation with Al2O3 and K2O, as well as compara-tively low amounts of CaO, account for the separation of samples inGroup B. High TTE concentrations separate samples of Group Cfrom all other samples, whereas Group D is characterized by lowREE as well as high CaO and HFSE amounts. The collected Holocenesediments have the by far highest amounts of CaO, which effec-tively dilutes the minor and trace element contents.
4.3. Petrography and mineralogy
Despite variations of paste textures (sorting, size and morphology ofinclusions) and differences concerning the temperature of firing

Principal component 1
+Ca- Al, K- REE- TTE- HFSE
- Ca+ Al, K+ REE
3.02.01.00.0-1.0-2.0-3.0
3.0
2.0
1.0
0.0
-1.0
-2.0
-3.0
Prin
cip
al co
mp
on
en
t 2
5046/69
5014/6
Sherd1Sherd6
Fig. 4. Score plot of a principal component analysis based on 22 major and trace elements (TiO2, Al2O3, FeO, MgO, MnO, CaO, Na2O and K2O in wt.%; Li, Sc, V, Cr, Co, Cu, Zn, Sr, Y, Zr,Nb, Ba, La and Ce in ppm) restricted by availability of data in the literature. PC1 (46.2%) and PC2 (21.4%) explain 67.5% of the total variance of a dataset that includes all ceramicsamples and sediments of this study together with four sediment-analyses from Vaughan (1987). Ceramic specimens are indicated by open circles, sediments by full circles. Maingroup-determining elements as well as group-combining fields are also given.
C. Tschegg et al. / Journal of Archaeological Science 36 (2009) 1103–1114 1109
(already described in Tschegg et al., 2009), the ceramics can be dividedinto the same four groups based upon their included components(minerals, rock and ceramic fragments, fossils):
Group A: The phyllosilicate paste matrix covers grain dimen-sions ranging from clay to mainly silt size. Within the matrix clayminerals, 80 mm sized or smaller sub-angular inclusions of quartz,feldspars, and accessory Fe- and Ti-oxides, as well as micas arepresent. Quartz, plagioclase and calcareous grains of sand size areincluded in the paste in varying modal amounts and shapes (sub-rounded to angular). The calcareous phases mainly include micriticand sparitic rock-fragments and a conspicuous assemblage offoraminifera, together with scarce large shell fragments. A fewinclusions of gabbro and sandstone fragments are characteristic, asare accessorial single pyroxene grains.
Group B: A fine-grained silty clay-sized paste matrix is typical ofthis group, that, despite slightly smaller amounts of quartz andfeldspar inclusions, is identical to that of Group A. Very scarce andsmall inclusions of quartz and sandstone fragments, up to 1 mm insize, together with angular and scattered embedded grains of thesame mineral and same rock type have been observed. Occasion-ally, grog inclusions as well as fossils can be found.
Group C: The paste matrix is essentially similar to that of GroupA. A high amounts of diopside, olivine and Fe-, Cr- and Ti-richoxides like magnetite, Cr-spinel and Ti-magnetite as well asnumerous gabbroic rock-fragments have been recorded in thesesherds. Furthermore grog-tempering, with clasts up to 500 mm andconsiderable amounts of carbonate fragments as well as calcareousmicrofossils have been observed.
Group D: A highly calcareous silty paste matrix with includedmicritic carbonate fragments (up to 400 mm), few quartz and
anorthite grains as well as some large gabbroic rock-fragments(300–400 mm) form the paste. Grog inclusions (up to 700 mm) andsparse fossils are additional distinctive features.
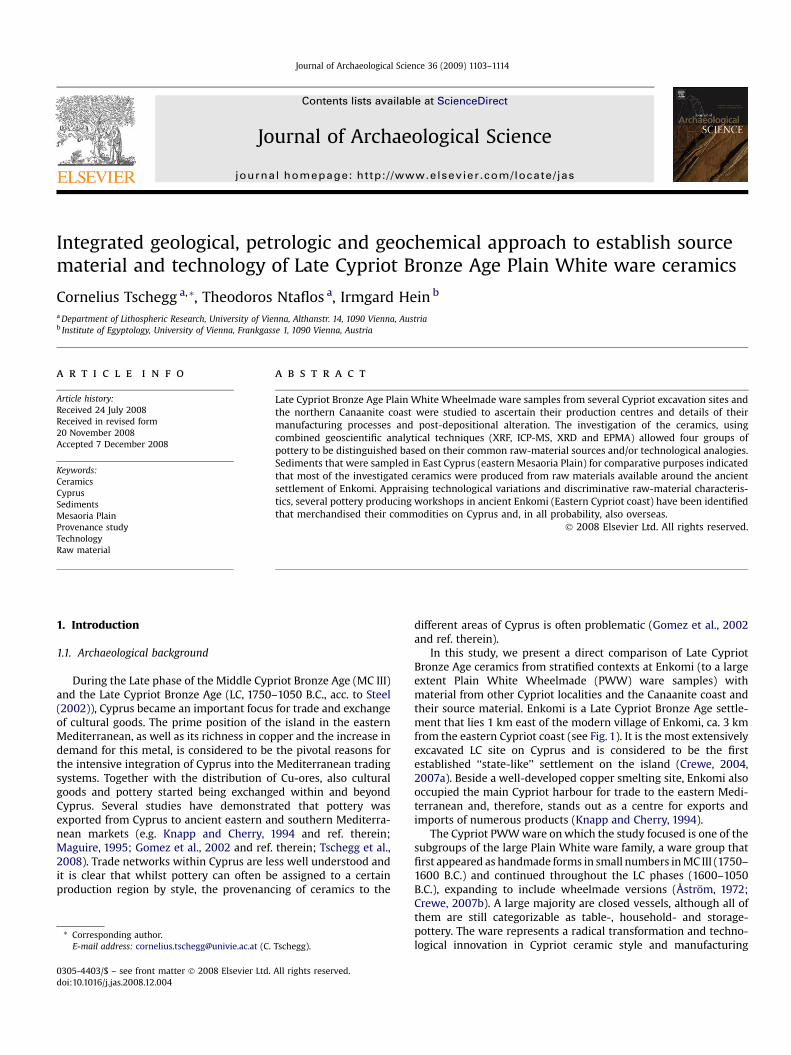
X-ray diffraction was used, first, to obtain a comparable over-view of the main minerals forming the ceramics and, second, todefine the bulk as well as clay mineral fraction of the collectedsediments. The diffraction patterns obtained from the ceramics andtheir potential raw materials were then compared and assessed.Fig. 5 shows a lineup of the two collected groups of sediments andtwo low-temperature fired (Tschegg et al., 2009) ceramic samples,one representative for Group A, the other for Group D. Thediffraction patterns of sediment ENK1 (Fig. 5b) and sample 2248/9(Fig. 5e) show the same proportions for the main quartz (3.343 Å),calcite (3.035 Å) and feldspar peaks. The <2 mm fraction of ENK1(Fig. 5c), showing the clay mineralogy, indicates the existence ofsmectite and illite group minerals (15 Å and 10 Å) as well as chloriteand lesser amount of kaolinite group minerals. The main peak ofsmectite moved from 15 Å to 17 Å when treated with ethylene-glycol (Fig. 5c, d), confirming both its existence and expandablecharacter (Moore and Reynolds, 1997). The chlorite group mineralsare indicated by the 7.17 Å and 3.541 Å peaks (Fig. 5c) and thekaolinite group by the common peak at 7.17 Å and the 3.579 Å peak.The diffraction pattern in Fig. 5a represents the analyzed Holoceneraw-materials, sediments with higher amounts of feldspars andcalcite as well as additional dolomite (2.88 Å). Their <2 mm fractiongenerally shows much lower clay mineral contents, with no illiteand hardly detectable amounts of chlorite and kaolinite groupminerals. Dominant calcite and dolomite peaks are also character-istic features of samples from Group D (Fig. 5f), that are similar tothe bulk mineralogy of the Holocene sediments (Fig. 5a).
Fig. 5. X-ray diffraction patterns of (a) ENK2 – representative for Holocene sediments, (b) ENK1 – representative for Pleistocene sediments, (c) <2 mm fraction of ENK1, (d) <2 mmfraction of ENK1 saturated with Ethylene-glycol, (e) 2248/9 – representative for Group A samples and (f) 5064/36 representative for Group D. Relevant peaks are labelled, some withabbreviations: chl – chlorite group, ill – illite group, ka – kaolinite group, sm – smectite group minerals.
C. Tschegg et al. / Journal of Archaeological Science 36 (2009) 1103–11141110
4.4. Palaeontological observations
As the investigated ceramics, especially Groups A and C, containnumerous well-preserved calcareous microfossils, the fossilcontents of the raw materials were examined. The >63 mm fractionof the Pleistocene sediment ENK1 has a fossil fauna of benthonicand planktonic foraminifera, holothurian sclerites and scaphopoddentalia. The equivalent microfossils have also been found in sherdsof Groups A and C and partly in Groups B and D. Fig. 6 compares thefossil assemblage found in both the sediment and the PWWsamples.
4.5. Microstructural observations
Examination of the ceramic samples has indicated that micro-structural features (geometric and morphological characteristics ofthe paste and its inclusions), which are commonly used to cate-gorize sherds of different origins, are inappropriate for potterydiscriminating of the available PWW samples. The reason is thatdifferent techniques of paste preparation and firing can lead topronounced variations of paste textures, despite the fact that thesame sediment was initially used (Tschegg et al., 2009).
Macroscopically, a few PWW ware sherds have what seems tobe an intentionally manufactured slip or some kind of ‘‘self-slip’’that formed as a result of final vessel smoothing. Close investigationof this material revealed that not only refining of the clay paste atthe surface of vessels can result in a whitening of ceramic surfacesbut also a strong increase in porosity at the surface can lead toa brighter appearance. Backscattered-electron imagery (Fig. 7)shows a 200 mm thick surface layer in which the average porosityhas increased by 25% compared to the body of the sherd. Threeelement-indicative WDS-mappings (Fig. 7a–c) show the distribu-tion of Ca in 150�112 mm large areas in the ceramic body, the
surface layer and their transition zone. As indicated by thesecalcium distribution maps as well as line scans that were carriedout from the ceramic body into the surface layer, the calciumcontent at the surface is reduced to more than half compared to thebody. Unlike an abrupt intersection between ceramic body andsurface that would be typical for slips, these interfaces here showa gradual transition.
5. Discussion
By combining bulk geochemical, petrographical and mineral-ogical features, the investigated Cypriot PWW ware samples,together with the comparative material from Cyprus and thenorthern Canaanite coast, have been divided into four groups. Raw/source material assignments have also generally been made:
Group A combines most of the samples that were excavateddirectly in Enkomi, but also includes additional sherds found atother Cypriot locations. A combination of the compositional dataand visual observations of the material of this group suggestsa common raw-material source, due to their mineralogical andpalaeozoological assemblage, as well as their bulk geochemical andpetrographic characteristics. As a consequence of the differentmodal amounts of included calcareous phases, their bulk CaOcontent is variable and shows a relative range of 12 wt.% (12.2–23.6 wt.%). With increasing concentrations of CaO, the percentageof clay constituents SiO2, Al2O3 and K2O decrease, as do most of thetrace elements (see Fig. 2a, b). This trend has been observed in allanalyzed samples of this study and clearly indicates the dilutivefunction of carbonates (and calcareous inclusions in general) con-taining low amounts of trace elements and REE (Taylor andMcLennan, 1985). In this case, therefore, systematic variations ofmajor and trace element concentrations can to a large extent beassigned to variable modal amounts of calcareous inclusions. The

Fig. 6. BSE images of the microfossil assemblage found in ceramics of Group A (left side) opposing the same kind of fossils found in the fraction >63 mm of the Pleistocene sedimentENK1 (right side). (a) Holothurian sclerite, (b and e) benthonic foraminifera, (c) planktonic foraminifera, (d) scaphopod dentalium.
C. Tschegg et al. / Journal of Archaeological Science 36 (2009) 1103–1114 1111

Fig. 7. Backscattered-electron image showing the surface area of sherd 2191/2 (Group A). Calcium indicative WDS-mappings illustrate the distribution of Ca in the ceramic body(Fig. 7c), its surface layer (Fig. 7a) and the transition zone (Fig. 7b). Ca maps exactly cover the areas where they are indicated.
C. Tschegg et al. / Journal of Archaeological Science 36 (2009) 1103–11141112
Pleistocene sediment samples that were collected in the immediatesurrounding of the Enkomi excavation site fulfil the qualificationsfor being a potential raw material for the production of Group Aceramics. Comparing the bulk composition (Figs. 2–4), mineralogy(Fig. 5) as well as microfossil content (Fig. 6) of the sediments withthe sherds of Group A, they show a strong similarity. The slightlylower amounts of trace elements in the sediments correlate withthe larger shell-fragments that are sporadically included in thesediment and which were not removed before bulk analysis.Comparing average REE concentrations of Group A sherds to themean REE contents of 38 Corinthian-style roof tiles derived fromMesaoria sediments around Enkomi (Gomez et al., 2002), showsvery similar REE concentrations; La in the roof tiles reaches17.79 ppm (std. dev.: 1.07), Eu 0.93 (std. dev.: 0.06) and Lu 0.29 (std.dev.: 0.03), whereas in the Group A, La reaches 18.07 ppm (std. dev.:3.30), Eu 0.99 ppm (std. dev.: 0.09) and Lu 0.28 ppm (std. dev.:0.02).
Apart from a common source material, inferred from micro-and macro-textural details, the ceramics of Group A indicatefabrication with a simple manufacturing technique. Althoughcoarse shell fragments (>2 mm) were presumably separated out ofthe Pleistocene material, in all other respects the material couldhave been used directly for manufacturing.
The geochemically homogeneous samples of Group B seem tohave the same raw-material source as Group A but indicatedifferent preparation techniques prior to manufacturing thepottery. The source material, as suggested from the observedrefinement of the fabric, was levigated. As a consequence, the lackof large calcareous inclusions (>1 mm) systematically increased thebulk budget of trace elements (Figs. 2 and 3). However, primarysediment heterogeneities in the Pleistocene outcrops that were notrecognizable in the field could also account for the lack of shellfragments.
The flat LREE patterns, as well as the high REE abundances ingeneral, confirm the features of a chemically non-diluted materialwhose composition is relatively close to UCC (Taylor and McLennan,1985; McLennan, 2001). Larger angular inclusions of sandstone andrelated quartz grains, as well as grog, may possibly indicateintentional tempering of these phases.
The microstructural investigations, mainly concerning the pastematrix, also indicate that Group C has the same characteristics asGroup A. However, the sand sized mineralogical assemblage in the
paste of this group shows a stronger affinity to rocks from theTroodos ophiolite (McCallum and Robertson, 1995; Poole andRobertson, 1998). Although they include microfossils that havebeen found in the in the Pleistocene formations of the easternMesaoria Plain, the increased modal abundance of Fe–Cr–Ti bearingores, pyroxenes and olivine reveal a raw-material source that layscloser to the Troodos massif and was therefore richer in ophiolite-derived material (Garzanti et al., 2000). The high TTE abundances(Fig. 2c) in Group C also show a link to mafic–ultramafic rocks andthus also suggest a source material from Troodos-derived sedi-mentary successions, most likely from the area between the Gulf ofFamagusta and Larnaca.
The highly calcareous paste matrix in sherds of Group Dprecludes any correlation with the Pleistocene eastern Mesaoriasediments. Their XRD patterns indicate an origin from younger,more heterogeneous sedimentary successions with a much higherCa content and dolomite in their fine-fraction (see Fig. 5).
Detailed investigations of Pleisto- and Holocene sediments fromthe eastern Mesaoria Plain show that the clay mineral content inthe <2 mm fraction is much higher in the Pleistocene than in theyounger materials. The higher amounts, especially of expandableclay minerals (smectite group minerals) and their admixture withillite and chlorite as well as the naturally included calcareousphases, made the Pleistocene silty clays a preferred, easily workableraw material that, when fired to the correct temperature, providedhigh-quality physical and mechanical properties (Tschegg et al.,2009). From bulk geochemical and mineralogical aspects, thePleistocene sediments from the area around Enkomi are probableand potential source materials for the fabrication of ceramics ofGroups A, B and C, with variations that result from different raw-material conditioning techniques and regional inhomogeneities.The microfossil assemblage that has been traced in both the sedi-ments and their ceramic products, confirms the close relationshipbetween the abovementioned materials (see Fig. 6). This demon-strates that microfossils can serve as a powerful additional tool toprovenance the raw materials of ceramics (Quinn and Day, 2007).Sherds of Group D are not associated with the Pleistocene rawmaterials and were presumably derived from young alluvialsediments in the area.
Examinations have shown that the white surfaces observed onsome samples were not caused by smoothing but are more likelya result of surface corrosion through post-depositional alteration

C. Tschegg et al. / Journal of Archaeological Science 36 (2009) 1103–1114 1113
(see Fig. 7). During burial, Ca, especially when in calcite (Schwedtet al., 2004), can leach out at of near-surface layers, thus causinga porosity increase with a concomitant enlargement of the specificsurface area. Post-depositional processes, such as soil invading andpercolating fluids particularly affect surface-near extraction/disso-lution of sherd constituents (Maggetti, 1982). The resulting high-porous, whitish appearing surface layer is an analogue effect to theespresso-crema that gets its light colour through reflection, refrac-tion and scattering of light at increased gas–solid/gas–liquidinterfaces (Durian et al., 1991; Vera et al., 2001). Moreover, just likethe espresso crema, the sherd-surface beyond the physical alter-ation additionally changes its chemical composition compared tothe base material.
6. Conclusions
In this study, Late Cypriot Bronze Age Plain White Wheelmadeware samples excavated in Cyprus and the Canaanite coast havebeen assigned to specific sediment sources on eastern Cyprus. Byusing petrographic, mineralogical, palaeontological, petrologicaland geochemical evidence, four groups of ceramics have beendistinguished. Sherds of Groups A and B were manufactured fromPleistocene sediments that occur in the eastern Mesaoria Plain,around Enkomi. However, despite utilizing the same raw-materialsource, they differ in some details, presumed to reflect varyingpaste preparation techniques. This implies not only that pottersfrom ancient Enkomi used the Pleistocene silty clays as basematerial. Moreover it signifies that in all likelihood diverse work-shops existed that had variability in clay preparation techniques,workshop differentiations through morphological vessel charac-teristics were already observed by Keswani (1991). As the rawmaterial that was used for the production of Group C is very similarto that used for Groups A and B, only differing in the noticeableinfluence of Troodos ophiolite-derived igneous components, a raw-material source geographically closer to the Troodos massif,although still in the Mesaoria Plain, has been assumed. The origin ofGroup D samples has not been located exactly; nevertheless, theyshow strong similarities to the younger Holocene sediments thatare also available around Famagusta Bay.
The assignment of ceramic commodities from several Cypriotexcavation sites and from the Canaanite coast to relativelycentralized pottery workshops that were situated in EasternCyprus proves the existence of trade networks within the islandduring the Late Bronze Age and probably beyond. In addition to thetraditional archaeological approach of typological vessel discrim-ination, we present the allocation of utilitarian ceramics such asthe PWW ware to a local production place by using the givenscientific approach.
The paper in the end demonstrates the necessity of usingintegrated methods in pottery analysis studies, to provide suffi-cient information for accurate statements concerning affiliations,provenance and technology of ancient ceramics.
Acknowledgements
This work was supported by the Austrian Science FoundationFWF (grant P18908-N19). We are grateful to Pavlos Flourentzos(Director of the Department of Antiquities, Cyprus) for permissionto export sherds from Enkomi for analysis and to Lindy Crewe(University of Manchester, Great Britain) for identifying appro-priate samples. Paul Åstrom (University of Gothenburg, Sweden)and Michal Artzy (University of Haifa, Israel) are thanked forproviding PWW samples from Cyprus and Tell Abu Hawam anduseful site-specific information. Shalom Yanklevitz, Ragna Stidsingand Yossi Salmon (University of Haifa, Israel) are thanked for
fruitful discussions and information. We would like to express oursincere gratitude to Olga Wronska for her field assistance in Cyprus.Thanks also to Prof. Johann Hohenegger (Department of Paleon-tology, University of Vienna) for the identification of microfossils.We thank the anonymous reviewers for their helpful andconstructive comments and A.H.N. Rice (Department of Geo-dynamics and Sedimentology, University of Vienna) for thoroughrevision of the final manuscript.
References
Artzy, M., 2006. The Carmel Coast during the second part of the Late Bronze Age:a center for Eastern Mediterranean transshipping. Bulletin of the AmericanSchools of Oriental Research 343, 45–64.
Åstrom, L., Åstrom, P., 1972. The Late Cypriote Bronze Age. The Swedish CyprusExpedition, vol. IV 1D, Lund.
Åstrom, P., 1972. The Late Cypriote Bronze Age. The Swedish Cyprus Expedition, vol.IV Part 1C. Lund.
Calon, T.J., Aksu, A.E., Hall, J., 2005. The Neogene evolution of the Outer LatakiaBasin and its extension into the Eastern Mesaoria Basin (Cyprus), EasternMediterranean. Marine Geology 221, 49–73.
Crewe, L., 2004. Social Complexity and Ceramic Technology on Late Bronze ageCyprus: the New Evidence From Enkomi. Unpublished PhD thesis, University ofEdinburgh.
Crewe, L., 2007a. Early Enkomi. Regionalism, Trade and Society at the Beginning ofthe Late Bronze Age on Cyprus. Archaeopress, British Archaeological Reports,Oxford.
Crewe, L., 2007b. Sophistication in simplicity: the first production of WheelmadePottery on Late Bronze Age Cyprus. Journal of Mediterranean Archaeology 20.2,209–238.
Dikaios, P., 1969–1971. Enkomi, Excavations 1948–1958, Vols. I–IIIB. Verlag Philippvon Zabern, Mainz am Rhein.
Durian, D.J., Weitz, D.A., Pine, D.J., 1991. Multiple light-scattering probes if foamstructure and dynamics. Science 252, 686–688.
Garzanti, E., Ando, S., Scutella, M., 2000. Actualistic ophiolite provenance: theCyprus case. Journal of Geology 108, 199–218.
Gomez, B., Neff, H., Rautman, M.L., Vaughan, S.J., Glascock, M.D., 2002. The sourceprovenance of Bronze Age and Roman pottery from Cyprus. Archaeometry 44(1), 23–36.
GSD – Geological Survey Department, Cyprus, 1995. Geological Map of Cyprus,1:25000. Ministry of Agriculture, Natural Resources and Environment, Nicosia.
Hein, I., Janosi, P., 2004. Tell el-Dabca XI. Areal A/V, Siedlungsrelikte der SpatenHyksoszeit. Denkschriften. Verlag Osterreichischen Akademie der Wissen-schaften, Wien. UZK XXI.
Keswani, P.S., 1991. A Preliminary Investigation of Systems of Ceramic Productionand Distribution in Cyprus during the Late Bronze Age. In: Barlow, J.A.,Bolger, D.L., Kling, B. (Eds.), Cypriot Ceramics: Reading the Prehistoric Record.University Museum Monograph 74, Philadelphia, pp. 97–118.
Knapp, A.B., Cherry, J.F., 1994. Provenance Studies and Bronze Age Cyprus. In:Monographs in World Archaeology, No. 21. Prehistory Press, Madison.
Maguire, L.C., 1995. Tell el-Dabca, The Cypriot Connection. In: Davies, W.V.,Schofield, L. (Eds.), Egypt, the Aegean and the Levant. British Museum Press,London, pp. 54–65.
Maggetti, M., 1982. Phase Analysis and its Significance for Technology and Origin.In: Olin, J.S., Franklin, A.D. (Eds.), Archaeological Ceramics. Smithsonian Insti-tution Press, pp. 121–133.
McCallum, J.E., Robertson, A.H.F., 1995. Sedimentology of two fan-delta systems inthe Pliocene–Pleistocene of the Mesaoria Basin, Cyprus. Sedimentary Geology98, 215–244.
McLennan, S.M., 2001. Relationships between the trace element composition ofsedimentary rocks and upper continental crust. Geochemistry, Geophysics,Geosystems 2 No. 2000GC000109.
Moore, D.M., Reynolds, R.C., 1997. X-ray Diffraction and the Identification andAnalysis of Clay Minerals, second ed. Oxford University Press, Oxford.
Neal, C., 2002. The mineralogy and chemistry of fine-grained sediments, MorphouBay, Cyprus. Hydrology and Earth System Sciences 6, 819–831.
Newell, W.L., Stone, B., Harrison, R., 2004. Holocene alluvium around Lefkosia(Nicosia), Cyprus: an archive of land-use, tectonic processes, and climatechange. In: Martin-Duque, J.F., Brebbia, C.A., Godfrey, A.E., Diaz de Teran, J.R.(Eds.), Geo-environment. WIT Press.
Obrink, U., 1979. Excavations in the Area 22, 1971–1973 and 1975–1979, Hala SultanTekke 5. In: Studies in Mediterranean Archaeology, XLV 5, Goteborg.
Obrink, U., et al., 1983. A Well in the Early 14th Century B.C. In: Åstrom, P. (Ed.),Excavations 1971–1979, Hala Sultan Tekke 8. Studies in MediterraneanArchaeology, XLV 8, Goteborg, 16–58.
Poole, A., Robertson, A.H.F., 1998. Pleistocene fanglomerate deposition related touplift of the Troodos ophiolite, Cyprus. In: Robertson, A.H.F., Emeis, K.C.,Richter, C., Camerlenghi, A. (Eds.), Proceedings of the Ocean Drilling Program,Scientific Results, 160, pp. 545–566.
Quinn, P.S., Day, P.M., 2007. Calcareous microfossils in Bronze Age Aegean ceramics:illuminating technology and provenance. Archaeometry 49 (4), 775–793.

C. Tschegg et al. / Journal of Archaeological Science 36 (2009) 1103–11141114
Robertson, A.H.F., Eaton, S., Follows, E.J., Payne, A.S., 1995. Depositional processesand basin analysis of Messinian evaporates in Cyprus. Terra Nova 7 (2),233–253.
Robertson, A.H.F., Woodcock, N.H., 1986. The role of Kyrenia Range lineament,Cyprus, in the geological evolution of the eastern Mediterranean area. Philo-sophical Transactions of the Royal Society of London A 317, 141–177.
Schwedt, A., Mommsen, H., Zacharias, N., 2004. Post-depositional elemental alter-ations in pottery: neutron activation analyses of surface and core samples.Archaeometry 46 (1), 85–101.
Soil Survey Division Staff, 1993. Soil Survey Manual. In: U.S. Department of Agri-culture Handbook, No. 18.
Steel, L., 2002. Cyprus before History. From Earliest Settlers to the End of the BronzeAge. Duckworth Publishing, London.
Taylor, St.R., McLennan, S.M., 1985. The Continental Crust: its Composition andEvolution. Geoscience Texts. Blackwell Scientific Publications, Oxford.
Tschegg, C., Hein, I., Ntaflos, Th., 2008. State of the art multi-analytical geoscientificapproach to identify Cypriot Bichrome Wheelmade Ware reproduction in theEastern Nile delta (Egypt). Journal of Archaeological Science 35, 1134–1147.
Tschegg, C., Ntaflos, Th., Hein, I., 2009. Thermally triggered two-stage reaction ofcarbonates and clay during ceramic firing – a case study on Bronze Age Cypriotceramics. Applied Clay Science 43, 69–78.
Vaughan, S.J., 1987. Fabric Analysis of Late Cypriot Base Ring Ware: Studies inCeramic Technology, Petrology, Geochemistry and Mineralogy. UnpublishedPhD thesis, University College London.
Vera, M.U., Saint-Jalmes, A., Durian, D.J., 2001. Scattering optics of foam. AppliedOptics 40 (24), 4210–4214.