Embed Size (px)
Citation preview

VOLUME 21 | NUMBER 1 | WINTER 2009
APPLIED CORPORATE FINANCEJournal of
A M O R G A N S T A N L E Y P U B L I C A T I O N
In This Issue: Global Competition and Corporate Governance
The Venturesome Economy: How Innovation Sustains Prosperity in a More Connected World
8 Amar Bhidé, Columbia University
Whither Capitalism? 24 Stephen S. Roach, Morgan Stanley
Financial Economists Roundtable Statement on Reforming the Role of the Rating “Agencies” in the Securitization Process
28 Richard J. Herring, University of Pennsylvania, and
Edward J. Kane, Boston College
Brazil’s Experiment with Corporate Governance 34 Gonzalo A. Chavez and Ana Cristina Silva, Bentley University
Private Equity vs. PLC Boards in the U.K.: A Comparison of Practices and Effectiveness
45 Viral V. Acharya, London Business School and New York
University, Conor Kehoe, McKinsey & Company, Inc.,
and Michael Reyner, MWM Consulting
Corporate Governance and Labor Relations 57 E. Han Kim, University of Michigan
Does Board Independence Matter in Companies with a Controlling Shareholder?
67 Jay Dahya, Baruch College, Orlin Dimitrov, SKK University,
and John J. McConnell, Purdue University
Designing a U.S. Market for CO2 79 John E. Parsons, A. Denny Ellerman, and
Stephan Feilhauer, Massachusetts Institute of Technology
Corporate Insurance and Debt: The Case of China 87 Hong Zou, City University of Hong Kong, and Mike B. Adams,
Swansea University
Thinking Like Adam Smith 90 Jerry Z. Muller, Catholic University of America

Journal of Applied Corporate Finance • Volume 21 Number 1 A Morgan Stanley Publication • Winter 2009 67
Does Board Independence Matter in Companies with a Controlling Shareholder?
B
1. These include Claessens, Stijn, Simeon Djankov, Joseph Fan, and Larry Lang, 2002, “Disentangling the incentive and entrenchment effects of large shareholdings,” Journal of Finance, 57, 2741-2771, Durnev, Art, and E. Han Kim, 2005, “To steal or not to steal: firm attributes, legal environment, and valuation,” Journal of Finance, 60 (3), 1461-1493, and La Porta, Rafael, Florencio Lopez-de-Silanes, Andrei Shleifer, and Robert W. Vishny, 2002, “Investor protection and corporate valuation,” Journal of Fi-nance, 57, 1147-1170.
2. For cross-listings see Doidge, Craig, Andrew Karolyi, and René M. Stulz, 2004, “Why are foreign firms listed in the U.S. worth more?,” Journal of Financial Economics,
71, 205-238. For governance, see Klapper, Leora, and Inessa Love, 2004, “Corporate governance, investor protection, and performance in emerging markets,” Journal of Cor-porate Finance, 10, 703-728, Durnev, Art, and E. Han Kim, 2005, “To steal or not to steal: firm attributes, legal environment, and valuation,” Journal of Finance, 60 (3), 1461-1493.
3. Dahya, Jay, Orlin Dimitrov, and John J. McConnell, 2008, “Controlling sharehold-ers, corporate boards, and corporate value: a cross-country analysis,” Journal of Finan-cial Economics, 87, 73-100.
by Jay Dahya, Baruch College, Orlin Dimitrov, SKK University, and John J. McConnell, Purdue University
Studies have reported valuation discounts for publicly traded companies based in countries that provide weak legal protection for minority shareholders.1 Such discounts are often attrib-
uted to the ability of controlling shareholders to extract “private benefits” that come at the expense of minority share-holders. Without sufficient legal deterrents, controlling shareholders have both the incentive and the ability to trans-fer corporate resources to themselves for personal consumption or gain. These transfers take a number of forms, including related-party “tunneling” transactions as well as corporate perks and, in some cases, outright theft.
But under certain circumstances—notably, when their companies want to raise capital by selling shares—the control-ling shareholders may face a stronger incentive to reduce this value discount by providing credible commitments to outside investors to forgo this diversion of corporate resources. Various commitment mechanisms have been proposed in the literature, including cross-listing on U.S. exchanges as well as general improvements in overall corporate governance systems.2 But another possible solution is more effective oversight of controlling shareholders by corporate boards.
We recently published a study that investigated the effects of appointing more independent directors on the value discounts of companies controlled by a dominant share-holder.3 Using biographical data on nearly 8,000 directors of 799 closely held companies in 22 countries, we found a significant positive correlation between corporate value and the fraction of the board made up of independent directors. Moreover, we found this relation to be especially pronounced in countries that afford investors weak legal protection—countries where controlling shareholders presumably have the greatest opportunity to increase corporate values by submit-ting to greater oversight.
Thus, the findings of our study are consistent with the possibility that the appointment of directors with no ties to
the controlling shareholder can be a powerful mechanism to reduce the threat of resource diversion and transfer of value from minority shareholders. But how reliable is this interpretation, given that the same controlling shareholders that have the power to appoint the board members also have the power—perhaps if they do too good a job—to dismiss them?
To address this issue, we performed several additional tests designed to detect the ability of independent directors to monitor the actions of the controlling shareholder. One such test revealed that 71% of independent directors in our sample sat on multiple corporate boards. We reasoned that multiple appointments are more likely to be a proxy for “reputational capital,” and that directors with multiple appointments should be less willing to jeopardize those reputations by proving to be ineffective monitors. As a second check on whether indepen-dent directors help reduce the threat of transfers of corporate resources, we also found that the frequency of related-party transactions was significantly lower in companies with larger fractions of independent directors, and that this reduced frequency was associated with higher corporate values.
A third set of tests investigated the possibility that an increase in the value of corporate shares would be most beneficial to controlling shareholders that plan either to issue equity on behalf of the firm or to sell equity on personal account. The tradeoff faced by such shareholders in these circumstances is between a higher value for their shares and reduced private control benefits. In other words, controlling shareholders are likely to appoint independent directors when their expected gains from higher share values outweigh their sacrifice of private benefits. Consistent with this argument, we found that the companies in our sample that issued equity had larger fractions of independent directors.
In the pages that follow, we explore each of the questions raised here in greater depth, report the relevant results of our recent study, and present representative case studies.

68 Journal of Applied Corporate Finance • Volume 21 Number 1 A Morgan Stanley Publication • Winter 2009
Figure 1 Number of Publicly Traded Large Firms with a Controlling Shareholder and the Type of Shareholder from 782 Firms Across 22 Countries in 2002
This chart provides data by country for a sample of 782 publicly traded firms with a controlling shareholder from 22 countries. A firm has a controlling shareholder if an individual or family (in black), privately held operating firm (in maroon), privately held
financial firm (in gray), or government (in light maroon) owns at least 10% of the voting rights in the firm.
0 10 20 30 40 50 60
Individual or family Privately held operating firm Privately held financial firm Government
US
UK
Sweden
Spain
South Korea
South Africa
Netherlands
Mexico
Malaysia
Japan
Italy
India
Hong Kong
Greece
Germany
France
Finland
Denmark
Canada
Brazil
Belgium
Australia
Cou
ntry
Number of Firms with a Dominant Shareholder
Can Independent Directors Monitor the Actions of a Controlling Shareholder?Because the board is appointed and dismissed by the control-ling shareholder, the question arises as to whether such directors can perform their duties effectively. After all, direc-tors appointed by controlling shareholders may be subject to various pressures, including the threat of dismissal at any time, for opposing the interests of those shareholders.
We believe there are three necessary conditions for boards of directors to be effective monitors of controlling sharehold-ers. First, independent directors must be able to raise the cost to the controlling shareholder of diverting resources for
personal benefit. It is worth noting that independent direc-tors do not have to monitor the controlling shareholder’s actions perfectly. To the extent they make it more difficult and costly for the controlling shareholder to extract private benefits, independent directors can help preserve value for minority shareholders.
Second, independent directors must have the incentive to monitor the controlling shareholder. As Eugene Fama and Michael Jensen argued in a classic corporate governance paper in the early 1980s, this incentive is provided by the mere existence of a well-functioning market for the services of independent directors.4 Thanks to such a market, independent directors
4. Fama, Eugene F., and Michael C. Jensen, 1983, “Separation of ownership and control,” Journal of Law and Economics, 26, 301-325.

69Journal of Applied Corporate Finance • Volume 21 Number 1 A Morgan Stanley Publication • Winter 2009
have “human” or “reputational” capital at stake that can be lost “when internal control breaks down” and the companies under their oversight perform badly. To assess the reputational capital of independent directors, we gathered information on the number of directorships held by such directors. Finding that more than 70% of the over 4,000 independent directors in our sample served on multiple boards, we concluded that there is a robust market for the services of independent directors.
But having the incentive to monitor may not be enough. Independent directors must also have the power to perform their duties well. In examining the extent to which this condi-tion for effective monitoring is likely to hold, we started by noting the finding of previous research that, in 20 of the 22 countries in our sample, directors have a legal responsibility to curb self-dealing actions by the controlling shareholder, and can be held legally accountable for failing to do so.5 This mandate gives independent directors the legal authority to act on behalf of minority shareholders. Along with such author-ity, such directors also routinely seek and obtain assurances from the controlling shareholders that they will have the freedom and power to perform their duties effectively.
Criteria for Director IndependenceWe gathered data on share ownership and boards of directors for companies from 22 countries as of the end of 2002. These are predominantly countries with well-developed economies, for whose companies we were able to locate data on both share ownership and board composition. Our initial sample included the 70 largest publicly traded companies based on market capitalization from each country.
Before we could determine director affiliation, our first task was to identify companies with a controlling shareholder. We defined a controlling shareholder as the largest single owner of voting rights in any company where that owner controlled at least 10% of the firm’s votes.6 Figure 1 provides information on the identity of the controlling shareholder by country. Of all controlling shareholders in our sample, 347 were individuals or families, 226 were privately held operat-ing or holding companies, 101 were privately held financial institutions, and 108 were governments.
The last 20 years have seen the issuance of corporate governance codes, mandates, recommendations, and listing
requirements in more than 70 countries worldwide. The vast majority of them place significant emphasis on direc-tor independence.7 We used those publications as a guide in arriving at our own definition of what constitutes an independent director. We considered directors to be affili-ated with the controlling shareholder (i.e., not independent) if they (1) had the same family name as the controlling share-holder, (2) were employees of the firm, (3) were employees of any company or subsidiary of any company that was positioned “above” the sample firm in the ownership tree, (4) were employees of another firm in which the controlling shareholder had at least a 10% ownership position regard-less of whether the second firm was in the ownership tree, (5) were politicians or employees of a government agency when the controlling shareholder was a government, or (6), in cases of a foreign controlling shareholder, were employed by a company domiciled in the same country as the control-ling shareholder. Directors who were not identified as being affiliated with the controlling shareholder in any of these ways were designated as “independent.”8
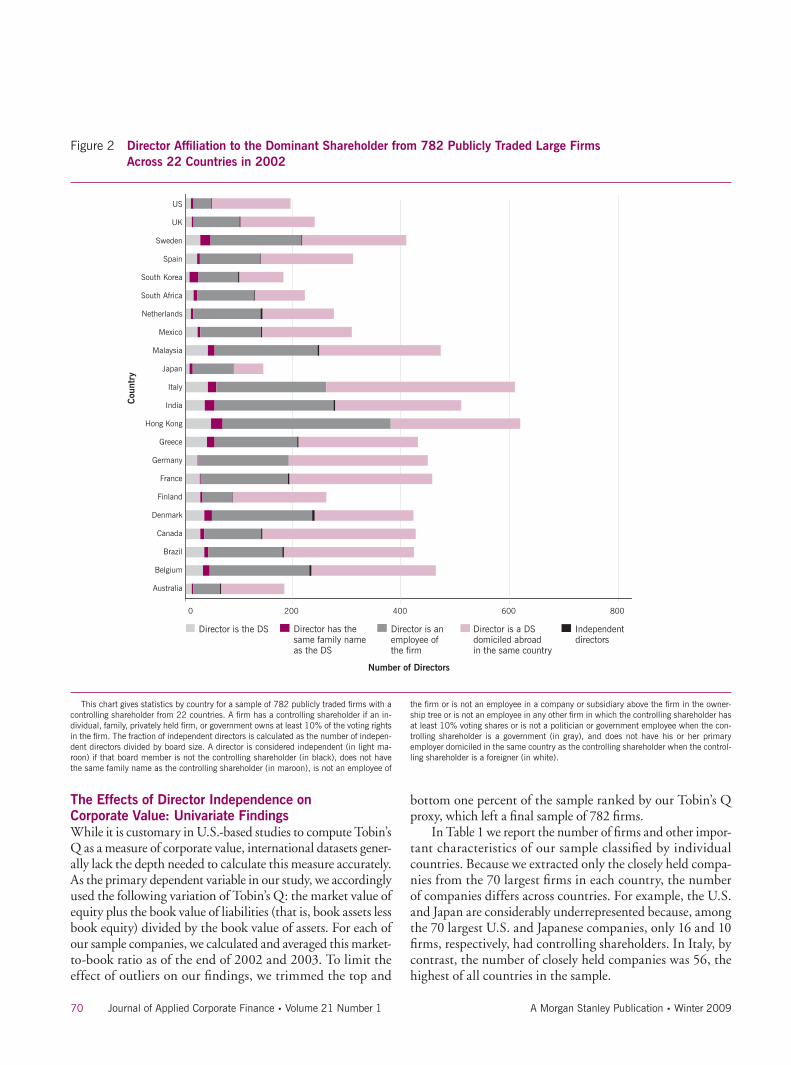
Figure 2 provides information on directors who are affiliated and unaffiliated with (i.e., independent of) the controlling shareholder. An inspection of this chart reveals that the fraction of independent directors varies significantly across countries, with the highest fraction in the U.S. and the lowest in Japan.
Because the share of voting rights held by controlling share-holders often exceeds their proportionate claims on cash flows,9 we also gathered information about the voting and ownership rights of the controlling shareholders. A large disparity between voting and cash-flow rights amplifies the incentives of control-ling shareholders to exploit minority shareholders.10 For each company with a pyramidal ownership structure in our sample, we determined the fraction of cash-flow rights owned by the controlling shareholder by multiplying his fraction of cash-flow rights held in a sample firm by the fraction of shares owned in each firm along the control chain in the ownership tree. For example, if individual X owned 10% of the shares in company A, which in turn owned 20% in company B, and there were no other large shareholders in B, we considered X to be the controlling shareholder in B with 20% of the voting and 2% (20% times 10%) of the cash-flow rights.
5. Djankov, Simeon, Rafael La Porta, Florencio Lopez-de-Silanes, and Andrei Shleifer, 2006, “The law and economics of self dealing,” Working paper, World Bank.
6. In the case of a large number of companies controlled through pyramid ownership structures, the identity of the ultimate owner was not immediately obvious. To identify the ultimate shareholder, we started by gathering and collating information on the com-plete “ownership tree” of each individual company. After identifying the “ultimate” share-holders identified in each firm’s ownership tree, we considered the largest one with more than 10% of the voting rights to be the controlling shareholder provided that shareholder was not itself a widely held company, but one of the following: an individual, a family, a privately-held operating company, a privately-held financial firm, or a government. Later, in the robustness tests, we removed all government-owned firms due to the special role governments may play, which may affect our findings.
7. For example, In Greece, the Principles of Corporate Governance (1999) prescribe more independent directors, defined as unrelated to the majority owner and having no conflicts of interest, the Australian Bosch Report on Corporate Practices and Conduct
(1995) stipulates that director independence is more likely to be assured when the direc-tor is not a substantial shareholder of the firm, and the Belgian Commission of Corporate Governance (1998) recommendations call for more directors that do not serve on boards of related firms and who have no family ties to executives.
8. None of the main results reported in our paper held when we used a simple execu-tive/non-executive distinction as a means to identify outside directors.
9. La Porta, Rafael, Florencio Lopez-de-Silanes, and Andrei Shleifer, 1999, “Corpo-rate ownership around the world,” Journal of Finance, 54, 471-517.
10. Bebchuk, Lucian, Reinier Kraakman, and George Triantis, 1999, “Stock pyra-mids, cross-ownership, and dual class equity: the creation and agency costs of separat-ing control from cash flow rights,” Working paper, National Bureau of Economic Re-search, 6951; and Claessens, Stijn, Simeon Djankov, Joseph Fan, and Larry Lang, 2002, “Disentangling the incentive and entrenchment effects of large shareholdings,” Journal of Finance, 57, 2741-2771.
70 Journal of Applied Corporate Finance • Volume 21 Number 1 A Morgan Stanley Publication • Winter 2009
Figure 2 Director Affiliation to the Dominant Shareholder from 782 Publicly Traded Large Firms Across 22 Countries in 2002
This chart gives statistics by country for a sample of 782 publicly traded firms with a controlling shareholder from 22 countries. A firm has a controlling shareholder if an in-dividual, family, privately held firm, or government owns at least 10% of the voting rights in the firm. The fraction of independent directors is calculated as the number of indepen-dent directors divided by board size. A director is considered independent (in light ma-roon) if that board member is not the controlling shareholder (in black), does not have the same family name as the controlling shareholder (in maroon), is not an employee of
the firm or is not an employee in a company or subsidiary above the firm in the owner-ship tree or is not an employee in any other firm in which the controlling shareholder has at least 10% voting shares or is not a politician or government employee when the con-trolling shareholder is a government (in gray), and does not have his or her primary employer domiciled in the same country as the controlling shareholder when the control-ling shareholder is a foreigner (in white).
Director is the DS Director has the same family name as the DS
Director is an employee of the firm
Director is a DS domiciled abroad in the same country
US
UK
Sweden
Spain
South Korea
South Africa
Netherlands
Mexico
Malaysia
Japan
Italy
India
Hong Kong
Greece
Germany
France
Finland
Denmark
Canada
Brazil
Belgium
Australia
Cou
ntry
Number of Directors
Independent directors
0 200 400 600 800
The Effects of Director Independence on Corporate Value: Univariate FindingsWhile it is customary in U.S.-based studies to compute Tobin’s Q as a measure of corporate value, international datasets gener-ally lack the depth needed to calculate this measure accurately. As the primary dependent variable in our study, we accordingly used the following variation of Tobin’s Q: the market value of equity plus the book value of liabilities (that is, book assets less book equity) divided by the book value of assets. For each of our sample companies, we calculated and averaged this market-to-book ratio as of the end of 2002 and 2003. To limit the effect of outliers on our findings, we trimmed the top and
bottom one percent of the sample ranked by our Tobin’s Q proxy, which left a final sample of 782 firms.
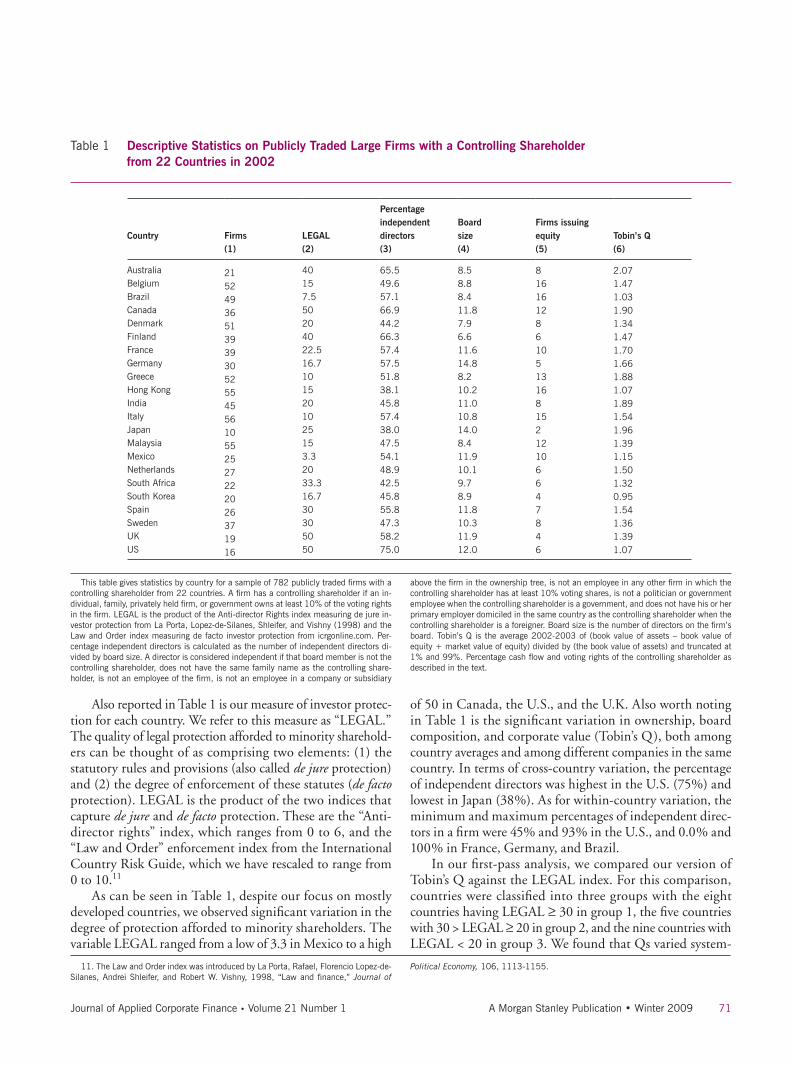
In Table 1 we report the number of firms and other impor-tant characteristics of our sample classified by individual countries. Because we extracted only the closely held compa-nies from the 70 largest firms in each country, the number of companies differs across countries. For example, the U.S. and Japan are considerably underrepresented because, among the 70 largest U.S. and Japanese companies, only 16 and 10 firms, respectively, had controlling shareholders. In Italy, by contrast, the number of closely held companies was 56, the highest of all countries in the sample.
71Journal of Applied Corporate Finance • Volume 21 Number 1 A Morgan Stanley Publication • Winter 2009
Also reported in Table 1 is our measure of investor protec-tion for each country. We refer to this measure as “LEGAL.” The quality of legal protection afforded to minority sharehold-ers can be thought of as comprising two elements: (1) the statutory rules and provisions (also called de jure protection) and (2) the degree of enforcement of these statutes (de facto protection). LEGAL is the product of the two indices that capture de jure and de facto protection. These are the “Anti-director rights” index, which ranges from 0 to 6, and the “Law and Order” enforcement index from the International Country Risk Guide, which we have rescaled to range from 0 to 10.11
As can be seen in Table 1, despite our focus on mostly developed countries, we observed significant variation in the degree of protection afforded to minority shareholders. The variable LEGAL ranged from a low of 3.3 in Mexico to a high
of 50 in Canada, the U.S., and the U.K. Also worth noting in Table 1 is the significant variation in ownership, board composition, and corporate value (Tobin’s Q), both among country averages and among different companies in the same country. In terms of cross-country variation, the percentage of independent directors was highest in the U.S. (75%) and lowest in Japan (38%). As for within-country variation, the minimum and maximum percentages of independent direc-tors in a firm were 45% and 93% in the U.S., and 0.0% and 100% in France, Germany, and Brazil.
In our first-pass analysis, we compared our version of Tobin’s Q against the LEGAL index. For this comparison, countries were classified into three groups with the eight countries having LEGAL ≥ 30 in group 1, the five countries with 30 > LEGAL ≥ 20 in group 2, and the nine countries with LEGAL < 20 in group 3. We found that Qs varied system-
11. The Law and Order index was introduced by La Porta, Rafael, Florencio Lopez-de-Silanes, Andrei Shleifer, and Robert W. Vishny, 1998, “Law and finance,” Journal of
Political Economy, 106, 1113-1155.
Table 1 Descriptive Statistics on Publicly Traded Large Firms with a Controlling Shareholder from 22 Countries in 2002
This table gives statistics by country for a sample of 782 publicly traded firms with a controlling shareholder from 22 countries. A firm has a controlling shareholder if an in-dividual, family, privately held firm, or government owns at least 10% of the voting rights in the firm. LEGAL is the product of the Anti-director Rights index measuring de jure in-vestor protection from La Porta, Lopez-de-Silanes, Shleifer, and Vishny (1998) and the Law and Order index measuring de facto investor protection from icrgonline.com. Per-centage independent directors is calculated as the number of independent directors di-vided by board size. A director is considered independent if that board member is not the controlling shareholder, does not have the same family name as the controlling share-holder, is not an employee of the firm, is not an employee in a company or subsidiary
above the firm in the ownership tree, is not an employee in any other firm in which the controlling shareholder has at least 10% voting shares, is not a politician or government employee when the controlling shareholder is a government, and does not have his or her primary employer domiciled in the same country as the controlling shareholder when the controlling shareholder is a foreigner. Board size is the number of directors on the firm’s board. Tobin’s Q is the average 2002-2003 of (book value of assets – book value of equity + market value of equity) divided by (the book value of assets) and truncated at 1% and 99%. Percentage cash flow and voting rights of the controlling shareholder as described in the text.
Country Firms(1)
LEGAL(2)
Percentageindependentdirectors(3)
Boardsize(4)
Firms issuing equity(5)
Tobin’s Q(6)
AustraliaBelgiumBrazilCanadaDenmarkFinlandFranceGermanyGreeceHong KongIndiaItalyJapanMalaysiaMexicoNetherlandsSouth AfricaSouth KoreaSpainSwedenUKUS
21524936513939305255455610552527222026371916
40157.550204022.516.71015201025153.32033.316.730305050
65.549.657.166.944.266.357.457.551.838.145.857.438.047.554.148.942.545.855.847.358.275.0
8.58.88.411.87.96.611.614.88.210.211.010.814.08.411.910.19.78.911.810.311.912.0
8161612861051316815212106647846
2.071.471.031.901.341.471.701.661.881.071.891.541.961.391.151.501.320.951.541.361.391.07

72 Journal of Applied Corporate Finance • Volume 21 Number 1 A Morgan Stanley Publication • Winter 2009
atically across these three different levels of legal shareholder protection, with higher protection associated with higher Qs: the mean Q of 1.58 for group 1 was significantly greater than the mean Q of 1.38 in group 3 (p-value = 0.01).
This analysis served to confirm the generally accepted view that stronger country-level legal shareholder protec-tion is associated with higher firm values. A more interesting finding emerged when we split the entire sample of companies into three groups according to the percentage of independent directors. The mean and median Qs increase monotonically
with the increase in the percentage of independent directors and the differences in means and medians between groups 1 and 3 were statistically significant (p-values < 0.01). The mean Tobin’s Q was 1.32 for companies where less than one-third of the board was independent directors and 1.57 for those with more than two-thirds.
Director Independence Affects Corporate Value: Multivariate FindingsTo add rigor to our descriptive statistics, we then estimated
The Case of OPAP: A Strong Board of Directors in a Weak Legal Regime
The Hellenic Organization of Football Prognostics S.A. (OPAP) began life in 1958 as a Greek lottery system
operator. Today the company is primarily engaged in the management, advertisement, and operation of lottery games. In 2003 OPAP was among the ten largest Greek companies in terms of market value. In the following years, OPAP continued to grow and by September 2008 had become the third largest company in Greece, with sales of over €5 billion, gross profit of over €1 billion, and a market cap of over €7 billion. OPAP is based in Athens but has 5,316 agencies with one or more terminals, both at home and abroad, that are connected online with a central information system.
Although incorporated in one of the countries that ranks lowest in our sample in terms of legal investor protection, OPAP is an exception among Greek companies.12 During the past five years 2003-2008 the board of directors has had 11 members, eight of whom are independent of the controlling shareholder.
The controlling shareholder in OPAP is the State of Greece, which in 2003 owned 75% of the firm’s shares. Because all outstanding (including minority) shares had full and equal voting rights, the shares owned by the state have commanded equal percentages of ownership and cash flow rights, allowing OPAP to avoid the distortion of interests created by a pyramidal ownership structure.13 Starting in 2001, when the company was first listed on the Athens stock exchange, the state began gradually to decrease its equity position in the firm. By July 2005 its ownership had been reduced to 45%, and by May 2008 it was 34%. In this sense,
the main impetus behind the push for independent directors and a higher level of corporate governance can be seen as the State’s decision to sell equity to the public.
OPAP’s high governance and disclosure standards, including disclosure of director and officer remuneration, were then and continue to go well beyond the mandated requirements. For example, unlike most publicly traded Greek companies the company has an internal code of corpo-rate governance that articulates the firm’s commitment to the protection of minority shareholder rights. According to this internal code, both the audit and the compensation commit-tees must have from one to three non-executive members of the board and be chaired by an independent member of the board. In December 2002, moreover, OPAP was one of the first companies to comply with the requirements of a new law on corporate governance and the formation of an internal audit department.
What evidence do we have that such standards are effec-tive? During the period we examined (2002-07), OPAP reported no related party transactions, which are often considered red flags for self-dealing actions by the control-ling shareholder.14 And the company’s operating and stock market performance were impressive. In 2003, for example, its stock return was 35%, in 2004 it was nearly 100%, and in 2005 it was about 50%. The shares of the company continued to outperform the relevant stock index (GD) in 2006-2008 as well.15 OPAP also boasts remarkable profit-ability ratios, including ROAs of 54% in 2007 and 51% in 2008 and ROEs of 105% in 2007 and 98% in 2008.
12. Greece’s score of 10 on our Investor Protection Index is the lowest in Europe and ranks only above those of Brazil and Mexico. Moreover, according to ICRG, Greece ranked least favorably in the EU in terms of corruption in 2003. According to a Transpar-ency International report, this position is unchanged as of September 23, 2008. In our sample only India, Mexico, and South Africa have lower corruption scores.
13. It is common knowledge that high cash flow rights align the interests of the con-trolling shareholder with those of minority investors. Jensen, Michael and William Meck-ling, 1976, “Theory of the firm: managerial behavior, agency costs, and ownership struc-ture,” Journal of Financial Economics, 3, 305-360, La Porta, Rafael, Florencio
Lopez-de-Silanes, Andrei Shleifer, and Robert W. Vishny, 2002, “Investor protection and corporate valuation,” Journal of Finance, 57, 1147-1170.
14. Several small transactions were reported in 2006-2007. These occurred primar-ily between the company and its subsidiaries.
15. During this period OPAP had a small positive dividend-adjusted return, while the Greek stock market index collapsed in 2007-2008 losing over 60% of its value. Our measure of Tobin’s Q for the company was 4.67 in 2003, 8.10 in 2004, and 5.22 in 2007 (as compared to an average Q for Greek companies in our sample of 1.88 in 2003, and 1.26 in 2007).

73Journal of Applied Corporate Finance • Volume 21 Number 1 A Morgan Stanley Publication • Winter 2009
a series of regressions designed to show the effect of the frac-tion of independent directors on Tobin’s Q.16
The key coefficients from our regression tests are repro-duced in Table 2. Column 1 presents the results of what can be thought of as our “base case” regression. It serves to compare our results to results from previous studies. However, this regres-sion excludes the primary independent variable of interest, the fraction of independent directors on the board (“INDDIR%”). Consistent with prior studies, the nationwide coefficient of LEGAL was positive (and significant with a p-value = 0.01), suggesting that stronger shareholder protection increases firm value. There was also some indication that a higher fraction of cash-flow rights owned by the controlling shareholder enhances corporate value (though the corresponding coefficient is signifi-cant at the 10% level only). In subsequent regressions, moreover, these base case results remained essentially unchanged. All in all, in companies with a controlling shareholder, firm value was shown to be positively correlated with the country-level of legal
shareholder protection and with the fraction of cash-flow rights held by the controlling shareholder.17
Having estimated the base-case regression, we then added the key variable of interest, INDDIR%—again, the fraction of independent directors—to the base case regres-sion. As reported in column 2 of the table, the coefficient on INDDIR% in this column was positive and statistically significant (p-value = 0.01). This coefficient could be inter-preted as saying that, in the case of a representative company in our sample, a 10% increase in the fraction of a company’s independent directors (in other words, for each additional independent director on a board with ten members) is gener-ally associated with a 4% increase in its Tobin’s Q ratio. And thus, for each additional $1 billion of assets (in terms of book value), each additional independent director translates into an additional $40 million of value.
Next, to test the limits of the “linearity” of this relation-ship, we replaced INDIRR% with a natural log and non-linear
16. Before running these tests, we gathered data on a number of additional control variables that had previously been linked to Tobin’s Q, including industry indicators based on single-digit SIC codes to control for inter-industry differences in valuation; the growth of company sales to control for investment opportunities; the natural logarithm of board size; an indicator variable that was set to 1 if the firm was cross-listed in the U.S.; the controlling shareholder’s percentage cash flow rights, an interaction term of the
percentage cash flow rights multiplied by LEGAL; the logarithm of sales as a proxy for firm size; a measure of the firm’s level of diversification to account for a possible diversi-fication discount; the variance of the firm’s last 60 monthly stock returns; and the ratio of intangible to total assets.
17. Of the control variables, the only one that was statistically significant at the 0.05 level or less was ln (SALES).
Table 2 Key Coefficients of Regressions of Tobin’s Q on the Proportion of Independent Directors on Boards from 782 Publicly Traded Large Firms Across 22 Countries in 2002
Regressions of Tobin’s Q on LEGAL, INDDIR%, board size, and control variables. This table reports the coefficients and p-values for random country effects regressions using Tobin’s Q as the dependent variable for 782 industrial firms with a controlling share-holder from 22 countries. A firm has a controlling shareholder if an individual, family, privately held firm, or government owns at least 10% of the voting rights. LEGAL is the product of the Anti-director Rights index and the Law and Order index as of 2003 in which Anti-director Rights index measures de jure investor protection (La Porta, Lopez-de-Silanes, Shleifer, and Vishny, 1998) and Law and Order index measures de facto investor protection from icrgonline.com. Percentage independent directors, INDDIR%, is the num-ber of independent directors divided by board size. A director is considered independent if that board member is not the controlling shareholder, does not have the same family name as the controlling shareholder, is not an employee of the firm, is not an employee in a company or subsidiary above the firm in the ownership tree, is not an employee in an-
other firm in which the controlling shareholder owns at least 10% of the voting shares, is not a politician or government employee when the controlling shareholder is a govern-ment, and does not have his or her primary employer domiciled in the same country as the controlling shareholder when the controlling shareholder is a foreigner. Tobin’s Q is the average 2002-2003 of (book value of assets – book value of equity + market value of equity) divided by (the book value of assets). CROSS-LIST is an indicator to identify whether a foreign stock is listed on a US exchange. CF = cash flow. Though not shown in the table, we also include Ln (SALES) which is the natural log of sales for 2003, IN-TANG which is the ratio of intangible-to-total assets as of year-end 2003, GROWTH which is sales growth measured over 2002-2003, DIVERSE which is an indicator for firms with multiple business segments as measured by two-digit standard industrial clas-sification codes, and VAR as the variance of stock returns calculated with monthly returns over 2001-2002. Coefficients are in the columns. P-values are in parentheses.
Independent variableQ2002/2003
Q2002/2003
Q2002/2003
Q2002/2003LEGAL <20
Q2002/2003LEGAL ≥30
LEGAL
INDDIR%ln (INDDIR%)
ln (board size)CROSS-LIST
CF rightsCF rights*LEGAL
0.014 (0.01)
0.101 (0.19)
0.004 (0.10)-0.001 (0.10)
0.011 (0.03)
0.004 (0.01)
-0.149 (0.10)0.100 (0.19)
0.004 (0.10)-0.001 (0.14)
0.012 (0.03)
0.185 (0.02)
-0.195 (0.05)0.132 (0.10)
0.004 (0.10)-0.001 (0.10)
-0.019 (0.44)
0.276 (0.00)
-0.074 (0.55)0.142 (0.10)
-0.004 (0.55)0.000 (0.39)
0.015 (0.22)
0.087 (0.55)
0.057 (0.76)-0.031 (0.82)
-0.009 (0.49)0.000 (0.75)
Sample sizeAdjusted R2
7820.0866
7820.0985
7700.1102
3810.1211
2160.2414

74 Journal of Applied Corporate Finance • Volume 21 Number 1 A Morgan Stanley Publication • Winter 2009
specification of INDDIR%. In that regression, the coefficient (reported in column 3) was not only positive and statistically significant (p-value = 0.02), but the adjusted R2 increased relative to the linear specification. The better “fit” associ-ated with this logarithmic specification of INDDIR% can be interpreted as saying that although firm value increases with the fraction of independent directors, it increases at a
decreasing rate as that fraction increases (and thus adding the fifth independent director adds less value than the third or the fourth).
Country Effects. In sum, the findings of our regression analysis suggest that controlling shareholders intent on raising the value of their company’s shares should consider the appointment of independent directors.18 We next turned our
Another Success Story: Mobistar of Belgium
Mobistar entered the mobile phone operator market in Belgium as a joint venture between Telinfo and
France Telecom in 1996. The majority owner was France Telecom’s wireless subsidiary Orange. France Telecom was in turn owned by the French government, making it the ultimate shareholder in Mobistar. Up until 2008 Orange has maintained an ownership stake of slightly above 50% and no other company owns more than 10% of the shares.
As a civil law country, Belgium offers limited protec-tion to shareholders against self-dealings by the dominant shareholder.19 Furthermore, the Belgian Code of Corpo-rate Governance did not come into effect until December, 2004, i.e. the year after our sample was collected. The foreign owner of the company, however, was committed to creating the best environment possible for its management to succeed. Both the chairman of the board and the CEO of Mobistar were local, and independent of the dominant shareholder. The board of directors as a whole displayed a considerable level of independence that was uncharac-teristic of other Belgian companies. Thus, in spite of the large percentage of voting rights controlled by France Telecom, 62% of the board members were unrelated to the dominant shareholder, management, or any company in which the French government had a controlling stake.
During the years we examined (2002-03), Mobistar reported no related party transactions (unlike 17 other Belgian companies in our sample). With the exception of a joint venture with France Telecom, in subsequent years up through 2007, there were no related party trans-actions with the company’s dominant shareholder or its officers and directors. In its first ten years of existence,
the company expanded its market share aggressively. Its market share increased from 3% to 33% between 1996 and 2007, and it became a member of the Bel20 stock market index, which accounts for 80% of the Belgian $274 billion stock market. It was also the first GPRS operator in Belgium. At the same time, the company’s profitability ratios were above the average in the industry.20
To achieve this success Mobistar initially raised capital from both the debt and equity markets. For example, it relied heavily on new equity to finance the expansion of its 3G network in 2001-02. (In compari-son, only about 10% of the companies in our sample resorted to secondary equity offerings in a given year.) Maximizing the return on newly issued shares is one of the primary considerations for dominant sharehold-ers who practice high-quality corporate governance.21 In more recent times the company’s needs for external funds have decreased and since February 2008 Mobistar has started repurchasing shares.
And the shares of the company have performed remarkably well. In 2002, when the Bel20 index was falling, Mobistar shares appreciated by 20%, in 2003 they gained more than 100%, and a further 40% was added in 2004. Since then, the share price has been relatively stable and has outperformed the Belgian stock market index by 25% between December 2004 and December 2008. Mobistar’s Tobin’s Q ratio, a measure of the value added by management to the firm’s assets, increased from 2.63 in 2002 to 3.85 in 2003, and has been at or above 3.0 since then. In comparison, the average Q ratio of other publicly traded Belgian firms has hovered around 1.5.
18. One concern in interpreting our results is the possibility of “endogeneity” between board composition and corporate value. Endogeneity arises when the variables of interest are co-determined. For example, if independent directors have a strong preference to serve mainly on the boards of more efficient and higher valued companies—say, to pro-tect their own reputations—then our interpretation of the findings could be reversing the actual direction of “causality.”
To address that issue, we estimated a linear system of two equations with Q and IND-DIR% as the endogenously determined variables. To that end, we used a two-stage least squares instrumental variable regression model. The results from the two-stage model indicated that firm value was positively correlated to INDDIR% and LEGAL, but IND-
DIR% did not appear to depend on firm value. That is, causality appeared to run in one direction only. This provided some assurance that our results were not spurious.
19. La Porta, Rafael, Florencio Lopez-de-Silanes, Andrei Shleifer, and Robert W. Vishny, 1998, “Law and finance,” Journal of Political Economy, 106, 1113-1155.
20. E.g. operating profit margin of 27% in 2007 and 28% in 2008, and ROE of 38% in 2007 and 49% in 2008.
21. Durnev, Art, and E. Han Kim, 2005, “To steal or not to steal: firm attributes, legal environment, and valuation,” Journal of Finance, 60 (3), 1461-1493 and Dahya, Jay, Orlin Dimitrov, and John J. McConnell, 2008, “Controlling shareholders, corporate boards, and corporate value: a cross-country analysis,” Journal of Financial Economics, 87, 73-100.

75Journal of Applied Corporate Finance • Volume 21 Number 1 A Morgan Stanley Publication • Winter 2009
attention to a different but related issue. We examined whether the observed positive relation between ln (INDDIR%) and Tobin’s Q varied across countries with different levels of legal shareholder protection. It can be argued that a strong board is likely to be more valuable in a country that offers investors weak legal protection because the potential for increasing value is greater. But there is also a plausible counter argument—that a strong board is likely to have little effect in a country with weak legal protection because, in the absence of a protective legal environment, the board is fundamentally at the mercy of the controlling shareholder.
To address these arguments, we re-estimated our primary regression from column 3 for two subsets of companies: companies from countries with the lowest investor protec-tion (those from the 9 countries where LEGAL < 20) and those from countries with the greatest protection (those from the 8 countries where LEGAL ≥ 30). As reported in columns 4 and 5 of Table 2. In column 4, the coefficient of ln (INDDIR%) was positive and statistically significant in the low legal protection sample (p-value < 0.01). This coefficient implies, for example, that by increasing the percentage of unaffiliated directors from 10% to 90% in a company based in a country like Mexico (with a LEGAL index of 3.3), a
controlling shareholder can nearly double the Q ratio of its company (from 0.68 to 1.29). By contrast, for our sample of companies in countries with high degrees of shareholder protection, the coefficient was not reliably different from zero (p-value = 0.55).
Thus, our findings support the position that independent boards are more effective in reducing value discounts associ-ated with controlling shareholders in countries with weak legal protection for shareholders.
Companies Raising Equity Have a Higher Fraction of Independent DirectorsGiven our assumption that controlling shareholders are more likely to appoint independent directors when their companies issue equity, we set out to examine the relation between the frequency of seasoned equity offerings (SEOs) and board composition. We found that, during the period 2002-2004, 198, or about one in four, of our 799 sample companies undertook one or more SEOs that raised at least $10 million.
As a first pass, we identified those sample firms that had issued equity and those that had not, and calculated the mean percentage of independent directors, INDDIR%, for the two
Coefficients from country random effects models:dependent variable = percentage independent directors
Independent variable
LEGAL
SEOSEO (including rights issues)
ln (board size)CROSS-LIST
CF rightsCF rights*LEGAL
0.438 (0.00)
4.999 (0.00)
7.101 (0.00)1.143 (0.54)
-0.041 (0.56)-0.002 (0.45)
0.440 (0.00)
4.989 (0.00)
6.948 (0.00)1.175 (0.53)
-0.042 (0.55)-0.002 (0.47)
Sample sizeAdjusted R2
7420.1106
7820.1122
Table 3 Equity Issuance and Independent Directors in Firms with a Controlling Shareholder from 782 Firms Across 22 Countries in 2002
Regressions of INDDIR% on seasoned equity offering (SEO) and control variables. This table gives coefficients and p-values for random country effects regressions with percentage independent directors as the dependent variable for 782 industrial firms with a controlling shareholder from 22 countries. A firm has a controlling shareholder if an individual, family, privately held firm, or government owns at least 10% of its voting rights. Percentage independent directors, INDDIR%, is the number of independent direc-tors divided by board size. A director is considered independent if he or she is not the controlling shareholder, does not have the same family name as the controlling share-holder, is not an employee of the firm, is not an employee of a firm above the firm in the ownership tree, is not an employee in another firm in which the controlling shareholder owns at least 10% of the voting rights, is a not a politician or government employee when the controlling shareholder is a government, and does not have his or her primary employer domiciled in the same country as the controlling shareholder when the control-
ling shareholder is a foreigner. LEGAL is the product of the Anti-director Rights index and the Law and Order index as of 2003 in which Anti-director Rights index measures de jure investor protection (La Porta, Lopez-de-Silanes, Shleifer, and Vishny, 1998) and Law and Order index measures de facto investor protection from icrgonline.com. Tobin’s Q is the average 2002-2003 of (book value of assets – book value of equity + market value of equity) divided by (the book value of assets). Percentage cash flow (CF) rights are com-puted as described in the text. Though not shown in the table, we also include Ln (SALES) which is the natural log of sales for 2003, INTANG which is the ratio of intan-gible-to-total assets as of year-end 2003, GROWTH which is sales growth measured over 2002-2003, DIVERSE which is an indicator for firms with multiple business seg-ments as measured by two-digit standard industrial classification codes, and VAR as the variance of stock returns calculated with monthly returns over 2001-2002. Coefficients are in the columns. P-values are in parentheses.

76 Journal of Applied Corporate Finance • Volume 21 Number 1 A Morgan Stanley Publication • Winter 2009
22. In rights offerings, by contrast, controlling shareholders can, and typically intend to, preserve their ownership positions. The other independent variables are the same as those used in column 2 of Table 2 plus the age of the firm, FIRMAGE, and industry indi-cators. The independent variables were meant to capture other factors that appear to be determinants of board composition. Boone, Audra L., Laura Casares Field, Jonathan M. Karpoff, and Charu G. Raheja, 2007, “The determinants of corporate board size and composition: an empirical analysis,” Journal of Financial Economics, 85, 65-101; and Linck, James S., Jeffry M. Netter, and Tina Yang, 2008, “The determinants of board structure,” Journal of Financial Economics, 87, 308-328.
23. As were the coefficients of LEGAL and ln (board size). 24. Friedman, Eric, Simon Johnson, and Todd Mitton, 2003, “Propping and tunnel-
ing,” Journal of Comparative Economics, 31, 732-750; and Johnson, Simon, Peter Boone, Alasdair Breach, and Eric Friedman, 2000, “Corporate governance in the Asian financial crisis,” Journal of Financial Economics, 58, 141-186.
25. Except in the rare case when they are revealed in large corporate scandals.26. Djankov, Simeon, Rafael La Porta, Florencio Lopez-de-Silanes, and Andrei
Shleifer, 2006, “The law and economics of self dealing,” Working paper, World Bank.27. Djankov, Simeon, Rafael La Porta, Florencio Lopez-de-Silanes, and Andrei
Shleifer, 2006, “The law and economics of self dealing,” Working paper, World Bank.
groups. The average INDDIR% for firms that had issued equity was 56.1%, while the average INDDIR% for non-issuing firms was 50.2%. (The difference in means between the two groups was statistically significant with a p-value < 0.01).
Next we undertook a regression analysis intended to investigate the extent to which SEOs have systematic effects on board composition. The dependent variable in this model was INDDIR% and the key independent variable was a 1/0 indicator of an SEO (not including rights offerings).22 As reported in the first column of Table 3, the coefficient of SEO was positive and statistically significant (at the 0.01 level or less),23 supporting our conjecture that the issuance of outside equity is an important determinant of board composition in companies with controlling shareholders.
Independent Directors Limit Related-Party TransactionsOne of the primary means by which controlling shareholders are alleged to take advantage of minority shareholders is through transactions with related companies that transfer corporate resources and value to firms in which the control-ling shareholder has a majority ownership position. Such transactions are frequently referred to as tunneling.24
Although such transactions cannot be directly observed,25 we assumed that much of this activity is accomplished through related party transactions (RPTs). Strong boards have the potential to limit such wealth transfers by monitor-ing the terms of RPTs and preventing those that are clearly against the interests of minority holders. Following this line of reasoning, we hypothesized that RPTs should occur less frequently in firms with more independent directors; and when RPTs do occur, they should have more advantageous terms for the minority shareholders than in firms with mostly affiliated directors. Though we have no way of knowing the terms of RPTs, we can observe their frequency because each of our sample countries requires disclosure of RPTs in periodic filings.
To classify a transaction as a RPT, we borrowed a classi-fication scheme adopted by prior research studies.26 We considered five types of dealings to be RPTs: (1) acquisition by the sample firm of assets and/or stock from the control-ling shareholder or from any other firm affiliated with the controlling shareholder; (2) asset sales by the sample firm to the controlling shareholder or any other firm affiliated with the controlling shareholder; (3) asset swaps between the
sample firm and the controlling shareholder or any other firm affiliated with the controlling shareholder; (4) debt and/or loan relief from the sample firm to the controlling shareholder or any other firm affiliated with the controlling shareholder; and (5) sales and/or purchases of merchandise from and/or to the sample firm from and/or to the controlling shareholder or any other firm affiliated with the controlling shareholder.27 A search of filings for RPTs yielded information on RPTs conducted by 148 sample firms in 2002.
For those of our sample companies that reported RPTs, the mean percentage of independent directors (INDDIR%) was 49.4%, as compared to 53.2% for those companies that did not. (The difference in means was 3.8%, with a p-value of 0.14; the difference in median INDDIR% values between the groups revealed a difference of 7.1% with a p-value of 0.03.)
To control for other factors that could affect the likeli-hood of RPTs, we estimated a logit regression in which the dependent variable was a 1/0 indicator for the occurrence of an RPT and the key independent variable was ln (INDDIR%). As reported in Table 4, the coefficient of ln (INDDIR%) was negative and statistically significant, implying that a higher fraction of independent directors on the board reduces the likelihood of RPTs. For a typical firm in our sample, holding everything else at a fixed value, increasing the fraction of independent directors from 40% to 60% will reduce the odds of observing an RPT by 19%, and increasing the fraction of independent directors from 40% to 80% will reduce those odds by approximately 30%.
To supplement our logit analysis on RPTs and ln (INDIRR%) we estimated a country random effects regres-sion in which the dependent variable was the average Tobin’s Q for 2002-2003 and the key independent variable was RPT. The other independent variables were the same as in the second column of Table 2 except that we excluded the two board variables ln (INDDIR%) and ln (board size). In this regression, presented in column 2 of table 4, the coefficient of RPT is negative (with a p-value of 0.06), while the coefficient of LEGAL is positive (with a p-value of 0.04). Thus RPTs appear to have a negative effect on corporate value, even after controlling for the legal environment.
In sum, the results of our regression analyses are consis-tent with the interpretation that independent directors can reduce the threat of wealth transfers to the controlling share-holder by limiting disadvantageous RPTs.

77Journal of Applied Corporate Finance • Volume 21 Number 1 A Morgan Stanley Publication • Winter 2009
ConclusionOur findings indicate that controlling shareholders intent on increasing the value of their companies can do so by appointing independent directors. For example, our results can be interpreted as saying that, in the case of a representa-tive company in a country with an average level of protection for minority shareholders, a 10% increase in the fraction of a company’s independent directors is associated with a 4% increase in its Tobin’s Q ratio. But, as our findings also suggest, such effects on value are expected to be considerably larger in countries with limited minority shareholder rights. For example, by increasing the percentage of unaffiliated directors from 10% to 90%, a controlling shareholder of a company in a country such as Mexico can expect to see the Q ratio of his company increase by almost 15% (from
1.41 to 1.60). Nevertheless, that percentage increase in value would not be enough to make up the full loss in value asso-ciated with weak country-level shareholder legal protection. Our analysis suggests that the same company, if based say in the U.K., would be expected to have a Q ratio of about 1.90 even with a board composed of no more than 10% independent directors.
But what about controlling shareholders of companies in a country with moderate legal protection? Can they benefit from appointing a strong board? Our analysis suggests that for a controlling shareholder in a country such as India, with a LEGAL index of 20, increasing the percentage of independent directors from 10% to 90% will raise the firm’s Q from 1.58 to 1.80.
At the same time, our findings also suggest that this
Table 4 Related-Party Transactions from 782 Publicly Traded Large Firms Across 22 Countries in 2002
This table gives coefficients and p-values for logit regressions with RPT as the de-pendent variable, and random country effects regressions with Tobin’s Q as the depen-dent variable, for 742 industrial firms with a dominant shareholder from 22 countries. A firm has a dominant shareholder if an individual, family, privately held firm, or gov-ernment owns at least 10% of its voting rights. Percentage independent directors, INDDIR%, is the number of independent directors divided by board size. A director is considered independent if he or she is not the dominant shareholder, does not have the same family name as the dominant shareholder, is not an employee of the firm, is not an employee of a firm above the firm in the ownership tree, is not an employee in another firm in which the dominant shareholder owns at least 10% of the voting rights, is not a politician or government employee when the dominant shareholder is a govern-ment, and does not have his or her primary employer domiciled in the same country as the dominant shareholder when the dominant shareholder is a foreigner. LEGAL is the product of the Anti-director Rights index and the Law and Order index as of 2003 in which Anti-director Rights index measures de jure investor protection (La Porta, Lopez-de-Silanes, Shleifer, and Vishny, 1998) and Law and Order index measures de facto investor protection from icrgonline.com. Tobin’s Q is the average 2002-2003 or
2003-2004 of (book value of assets / book value of equity + market value of equity) divided by (the book value of assets). Percentage cash flow (CF) rights are computed as per Appendix A. RPT is a 0/1 indicator for firms that reported a RPT in periodic filings in 2002. A transaction is considered to be a RPT if the sample firm acquires assets or stock from the dominant shareholder or dominant shareholder-affiliated com-panies, sells assets to the dominant shareholder or dominant shareholder-affiliated companies, swaps assets with the dominant shareholder or dominant shareholder-af-filiated companies, provides debt or loan relief to the dominant shareholder or domi-nant shareholder-affiliated companies, and supplies or purchases merchandise to or from the dominant shareholder or dominant shareholder-affiliated companies. Ln (SALES) is the natural log of sales for 2003. INTANG is the ratio of intangible-to-total assets as of year-end 2003. GROWTH is sales growth measured over 2002-2003. DIVERSE is a 1/0 indicator for whether the firm has multiple business segments as measured by two-digit standard industrial classification codes. VAR is the variance of stock returns calculated with monthly returns over 2001-2002. Coefficients are in the columns. P-values are in parentheses.
Dependent variable
Coefficients from Logit regression Coefficients from country randomeffects regression model: Q
Independent variable model: RPT 2002/2003
LEGAL -0.082 (0.26) 0.016 (0.04)
RPT -0.066 (0.06)
ln (INDDIR%) -0.508 (0.05)
ln (board size) -0.049 (0.87)
CROSS-LIST -0.131 (0.58) 0.131 (0.09)
CF rights 0.011 (0.25) 0.005 (0.06)
CF rights*LEGAL -0.001 (0.13) -0.001 (0.10)
Sample size 742 742
Adjusted R2 0.0598 0.1082
78 Journal of Applied Corporate Finance • Volume 21 Number 1 A Morgan Stanley Publication • Winter 2009
increase in Q is equivalent to the expected effect of raising a country’s legal protection score from 20 to 40 (the score in Australia). Thus, in countries like India, appointing independent boards can be an effective, though probably not a complete, substitute for strengthening a country’s legal system.
In sum, independent directors can make a big difference, particularly in countries where legal protection for share-holders is weak.
jay dahya is Associate Professor of Finance at Baruch College, The
City University of New York.
orlin dimitrov is Assistant Professor of Finance at the Graduate
School of Business, SKK University, in Seoul, Korea.
john mcconnell is E. T. Weiler University Distinguished Professor
of Management at Purdue University’s Krannert Graduate School of
Management.
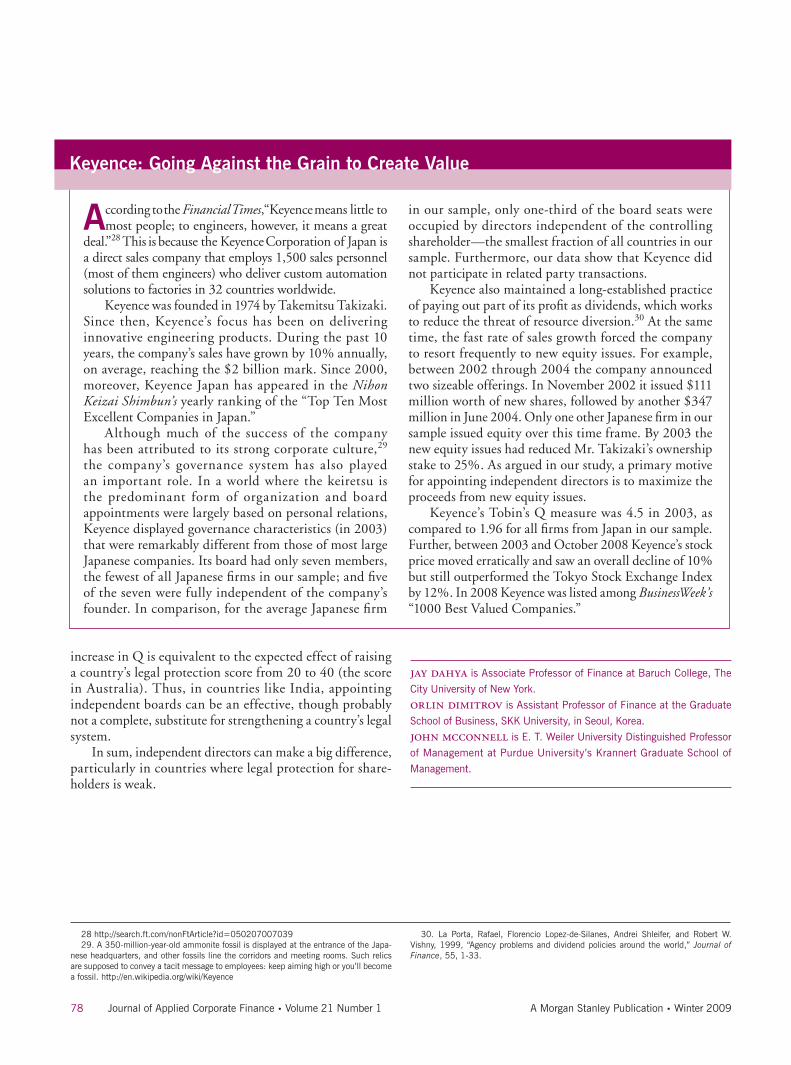
Keyence: Going Against the Grain to Create Value
According to the Financial Times, “Keyence means little to most people; to engineers, however, it means a great
deal.”28 This is because the Keyence Corporation of Japan is a direct sales company that employs 1,500 sales personnel (most of them engineers) who deliver custom automation solutions to factories in 32 countries worldwide.
Keyence was founded in 1974 by Takemitsu Takizaki. Since then, Keyence’s focus has been on delivering innovative engineering products. During the past 10 years, the company’s sales have grown by 10% annually, on average, reaching the $2 billion mark. Since 2000, moreover, Keyence Japan has appeared in the Nihon Keizai Shimbun’s yearly ranking of the “Top Ten Most Excellent Companies in Japan.”
Although much of the success of the company has been attributed to its strong corporate culture,29 the company’s governance system has also played an important role. In a world where the keiretsu is the predominant form of organization and board appointments were largely based on personal relations, Keyence displayed governance characteristics (in 2003) that were remarkably different from those of most large Japanese companies. Its board had only seven members, the fewest of all Japanese firms in our sample; and five of the seven were fully independent of the company’s founder. In comparison, for the average Japanese firm
in our sample, only one-third of the board seats were occupied by directors independent of the controlling shareholder—the smallest fraction of all countries in our sample. Furthermore, our data show that Keyence did not participate in related party transactions.
Keyence also maintained a long-established practice of paying out part of its profit as dividends, which works to reduce the threat of resource diversion.30 At the same time, the fast rate of sales growth forced the company to resort frequently to new equity issues. For example, between 2002 through 2004 the company announced two sizeable offerings. In November 2002 it issued $111 million worth of new shares, followed by another $347 million in June 2004. Only one other Japanese firm in our sample issued equity over this time frame. By 2003 the new equity issues had reduced Mr. Takizaki’s ownership stake to 25%. As argued in our study, a primary motive for appointing independent directors is to maximize the proceeds from new equity issues.
Keyence’s Tobin’s Q measure was 4.5 in 2003, as compared to 1.96 for all firms from Japan in our sample. Further, between 2003 and October 2008 Keyence’s stock price moved erratically and saw an overall decline of 10% but still outperformed the Tokyo Stock Exchange Index by 12%. In 2008 Keyence was listed among BusinessWeek’s “1000 Best Valued Companies.”
28 http://search.ft.com/nonFtArticle?id=05020700703929. A 350-million-year-old ammonite fossil is displayed at the entrance of the Japa-
nese headquarters, and other fossils line the corridors and meeting rooms. Such relics are supposed to convey a tacit message to employees: keep aiming high or you’ll become a fossil. http://en.wikipedia.org/wiki/Keyence
30. La Porta, Rafael, Florencio Lopez-de-Silanes, Andrei Shleifer, and Robert W. Vishny, 1999, “Agency problems and dividend policies around the world,” Journal of Finance, 55, 1-33.
Journal of Applied Corporate Finance (ISSN 1078-1196 [print], ISSN 1745-6622 [online]) is published quarterly, on behalf of Morgan Stanley by Wiley Subscription Services, Inc., a Wiley Company, 111 River St., Hoboken, NJ 07030-5774. Postmaster: Send all address changes to JOURNAL OF APPLIED CORPORATE FINANCE Journal Customer Services, John Wiley & Sons Inc., 350 Main St., Malden, MA 02148-5020.
Information for Subscribers Journal of Applied Corporate Finance is pub-lished in four issues per year. Institutional subscription prices for 2009 are: Print & Online: US$416 (US), US$499 (Rest of World), €323 (Europe), £255 (UK). Commercial subscription prices for 2009 are: Print & Online: US$556 (US), US$663 (Rest of World), €429 (Europe), £338 (UK). Indi-vidual subscription prices for 2009 are: Print & Online: US$105 (US), £59 (Rest of World), €88 (Europe), £59 (UK). Student subscription prices for 2009 are: Print & Online: US$37 (US), £21 (Rest of World), €32 (Europe), £21 (UK).
Prices are exclusive of tax. Asia-Pacific GST, Canadian GST and European VAT will be applied at the appropriate rates. For more information on current tax rates, please go to www3.interscience.wiley.com/about us/journal_order-ing_and_payment.html#Tax. The price includes online access to the current and all online back files to January 1997, where available. For other pricing options, including access information and terms and conditions, please visit www.interscience.wiley.com/journal-info.
For ordering information, claims and any enquiry concerning your journal subscription please go to interscience.wiley.com/support or contact your nearest office or email [email protected].
Americas: Tel: +1 781 388 8598 or 1 800 835 6770 (Toll free in the USA & Canada). Europe, Middle East and Africa: Tel: +44 (0) 1865 778315. Asia Pacific: Tel: +65 6511 8000
Delivery Terms and Legal Title Prices include delivery of print journals to the recipient’s address. Delivery terms are Delivered Duty Unpaid (DDU); the recipient is responsible for paying any import duty or taxes. Legal title passes to the customer on despatch by our distributors.
Back Issues Single issues from current and recent volumes are available at the current single issue price from [email protected]. Earlier issues may be obtained from Periodicals Service Company, 11 Main Street, German-town, NY 12526, USA. Tel: +1 518 537 4700, Fax: +1 518 537 5899, Email: [email protected]
This journal is available online at Wiley InterScience. Visit www.inter-science.wiley.com to search the articles and register for table of contents e-mail alerts.
Abstracting and Indexing ServicesThe Journal is indexed by Accounting and Tax Index, Emerald Management Reviews (Online Edition), Environmental Science and Pollution Manage-ment, Risk Abstracts (Online Edition), and Banking Information Index.
Disclaimer The Publisher, Morgan Stanley, its affiliates, and the Editor cannot be held responsible for errors or any consequences arising from the use of information contained in this journal. The views and opinions expressed in this journal do not necessarily represent those of the Publisher, Morgan Stanley, its affiliates, and Editor, neither does the pub-lication of advertisements constitute any endorsement by the Publisher, Morgan Stanley, its affiliates, and Editor of the products advertised. No person should purchase or sell any security or asset in reliance on any information in this journal.
Morgan Stanley is a full-service financial services company active in the securities, investment management, and credit services businesses. Morgan Stanley may have and may seek to have business relationships with any person or company named in this journal.
Copyright © 2009 Morgan Stanley. All rights reserved. No part of this publi-cation may be reproduced, stored or transmitted in any form or by any means without the prior permission in writing from the copyright holder. Authoriza-tion to photocopy items for internal and personal use is granted by the copy-right holder for libraries and other users registered with their local Reproduc-tion Rights Organization (RRO), e.g. Copyright Clearance Center (CCC), 222 Rosewood Drive, Danvers, MA 01923, USA (www.copyright.com), provided the appropriate fee is paid directly to the RRO. This consent does not extend to other kinds of copying such as copying for general distribution, for adver-tising or promotional purposes, for creating new collective works or for resale. Special requests should be addressed to: [email protected].
This journal is printed on acid-free paper.