Embed Size (px)
Citation preview
Journal of Affective Disorders 203 (2016) 382–395
Contents lists available at ScienceDirect
Journal of Affective Disorders
http://d0165-03
n Corrences, A
E-m
journal homepage: www.elsevier.com/locate/jad
Research paper
Identifying depression with the PHQ-2: A diagnostic meta-analysis
Laura Manea a, Simon Gilbody a, Catherine Hewitt b, Alice North b, Faye Plummer b,Rachel Richardson b, Brett D. Thombs a,b, Bethany Williams b, Dean McMillan a,n
a Hull York Medical School and Department of Health Sciences, University of York, United Kingdomb Department of Health Sciences, University of York, United Kingdom
a r t i c l e i n f o
Article history:Received 22 March 2016Received in revised form28 May 2016Accepted 3 June 2016Available online 6 June 2016
Keywords:Major depressionScreeningDiagnostic accuracyPhq-2Ultra-brief screening instrumentsDiagnostic meta-analysis
x.doi.org/10.1016/j.jad.2016.06.00327/& 2016 Published by Elsevier B.V.
espondence to: Hull York Medical School anRRC Building, University of York, YO10 5DD,ail address: [email protected] (D. Mc
a b s t r a c t
Background: There is interest in the use of very brief instruments to identify depression because of theadvantages they offer in busy clinical settings. The PHQ-2, consisting of two questions relating to coresymptoms of depression (low mood and loss of interest or pleasure), is one such instrument.Method: A systematic review was conducted to identify studies that had assessed the diagnostic per-formance of the PHQ-2 to detect major depression. Embase, MEDLINE, PsychINFO and grey literaturedatabases were searched. Reference lists of included studies and previous relevant reviews were alsoexamined. Studies were included that used the standard scoring system of the PHQ-2, assessed itsperformance against a gold-standard diagnostic interview and reported data on its performance at therecommended (Z3) or an alternative cut-off point (Z2). After assessing heterogeneity, where appro-priate, data from studies were combined using bivariate diagnostic meta-analysis to derive sensitivity,specificity, likelihood ratios and diagnostic odds ratios.Results: 21 studies met inclusion criteria totalling N¼11,175 people out of which 1529 had major de-pressive disorder according to a gold standard. 19 of the 21 included studies reported data for a cut-offpoint of Z3. Pooled sensitivity was 0.76 (95% CI ¼0.68–0.82), pooled specificity was 0.87 (95% CI ¼0.82–0.90). However there was substantial heterogeneity at this cut-off (I2¼81.8%). 17 studies reported data onthe performance of the measure at cut-off point Z2. Heterogeneity was I2¼43.2% pooled sensitivity atthis cut-off point was 0.91 (95% CI ¼0.85–0.94), and pooled specificity was 0.70 (95% CI ¼0.64–0.76).Conclusion: The generally lower sensitivity of the PHQ-2 at cut-off Z3 than the original validation study(0.83) suggests that Z2 may be preferable if clinicians want to ensure that few cases of depression aremissed. However, in situations in which the prevalence of depression is low, this may result in an un-acceptably high false-positive rate because of the associated modest specificity. These results, however,need to be interpreted with caution given the possibility of selectively reported cut-offs.
& 2016 Published by Elsevier B.V.
1. Introduction
Depression is common and disabling, but its management issuboptimal in primary and secondary care (Gilbody et al., 2008).Screening has been proposed as a solution to improving depres-sion care, but the value of routine screening and case findingprocedures to detect depression has not been proven (Gilbodyet al., 2008; Thombs et al., 2012). Some national guidelines re-commend it in primary care (U.S. Preventive Services Task Force,2009), whereas others do not (Joffres et al., 2013; Allaby 2010).
Recently there has been an increased interest in the potential ofusing very brief instruments to identify patients with major
d Department of Health Sci-United Kingdom.Millan).
depression, because of the advantages they may offer in busyclinical settings in which time is limited (Mitchell and Coyne,2007). One such very brief screening measure for depression is thetwo-item Patient Health Questionnaire (PHQ-2) (Kroenke et al.,2003), an abbreviated version of the widely used PHQ-9 (Kroenkeet al., 2001). It is comprised of the first two questions of the PHQ-9, which reflect the core symptoms of depression (low mood, lossof interest/pleasure). The original validation study of the PHQ-2provided preliminary evidence that it may be an effective screenfor depression (Kroenke et al., 2003). In that study, a cut-off pointof Z3 (out of a possible score of 6) had a sensitivity of 0.83 and aspecificity of 0.90 to identify major depression in a sample of 580primary and secondary care patients, although this included only41 patients with major depression, a small number for estimatingdiagnostic accuracy. This contrasts favourably with sensitivity of0.88 and specificity of 0.88 in the nine-item PHQ-9 among thesame patients (Kroenke et al., 2001).
L. Manea et al. / Journal of Affective Disorders 203 (2016) 382–395 383
A previous systematic review of the diagnostic properties of thePHQ-2 identified only a small number of studies (N ¼3) that hadexamined the diagnostic performance of the PHQ-2 (Gilbody et al.,2007). The review concluded that no recommendations could bemade about the PHQ-2 without further validation studies across arange of clinical settings and populations. The authors of the re-view, however, did suggest that preliminary evidence suggestedthat the PHQ-2 could be a brief, yet accurate tool. Since that initialreview the PHQ-2 has been much more widely evaluated in pri-mary studies, but there is not an updated systematic review. Thecurrent systematic review aims to evaluate the current evidencebase for the PHQ-2 to identify patients with major depression.
2. Methods
2.1. Literature search
We searched Embase, MEDLINE, PsycINFO and grey literaturedatabases (OIASTER, OpenGrey, ZETOC) from inception to August2014. The search terms used for Embase, Medline and PsycINFOare given in Appendix A. The terms were adapted as necessary forthe grey databases. In addition, we examined the reference lists ofall included studies and previous relevant reviews, including re-views of the PHQ-9 (Gilbody et al., 2007; Wittkampf et al., 2007;Kroenke et al., 2010; Manea et al., 2012) and a review of ultra-briefscreening instruments for depression (Mitchell and Coyne, 2007).
2.2. Study selection
A pre-piloted coding manual outlining a priori inclusion-ex-clusion criteria along with operational definitions of each wasdeveloped. Population: Any population or setting was included.Instrument: We included studies that used the PHQ-2 scored in thestandard way (each item scored 0–3 and summed to give a totalscore between 0 and 6). Studies that used atypical methods ofscoring the PHQ-2 (e.g., scored as positive if either itemwas scoredas two or above) were excluded. Comparison (reference standard):The accuracy of the PHQ-2 had to be assessed against a recognisedgold-standard instrument for the diagnosis of either Diagnosticand Statistical Manual (DSM) or International Classification ofDisease (ICD) criteria for major depression. Studies that used otherreference standards, such as unaided clinician diagnosis or scoresabove a cut-off point on another self-report instrument, wereexcluded. Studies were also excluded if the target diagnosis wasnot major depression (e.g., any depressive disorder). Outcome:Studies had to report sufficient information to calculate a 2*2contingency table for the cut-off point Z3 recommended by theoriginal validation study or the lower, alternative cut-off re-commended by some studies (Z2). Study design: Any design.Additional criterion: Studies were excluded if the sample over-lapped with that used in another included study. Citations withoverlapping samples were examined to establish whether theycontained information relevant to the research question that wasnot contained in the included report. We included in the reviewthe study that had the larger sample or, if the samples were thesame size, the study that provided all the details required for tisreview. No restrictions were made in terms of publication status,publication year or language.
All identified citations were first assessed on the basis of titleand abstract. At this stage, the inclusion-exclusion criteria wereinterpreted liberally; if there was doubt about whether a citationmet the criteria it was included. Full paper copies of those thatpassed this first sift were obtained and examined in detail againstthe inclusion-exclusion criteria. Studies that met this second siftwere included in the systematic review. Where necessary authors
were contacted to provide further clarification or to obtain addi-tional information.
2.3. Data extraction
We extracted the following data to a pre-piloted, standardisedform: sample characteristics (country, setting, age, gender), sam-ple size and percentage with major depression according to thegold standard, information on the PHQ-2 (method of administra-tion, cut-offs reported, language), and details of the referencestandard. In addition, we calculated cell Ns of the 2*2 tables at cut-offs Z2 and Z3. Again, where necessary authors were contactedto provide clarification.
2.4. Quality assessment
Quality assessment was conducted at the study level and usedcriteria based on the QUADAS-2 (the revised tool for the QualityAssessment of Diagnostic Accuracy Studies) (Whiting et al., 2011).QUADAS-2 incorporates assessments of risk of bias across four coredomains: patient selection, the index test, the reference standard,and the flow and timing of assessments The QUADAS-2 guidelinesrequire that it is adapted for each specific review; this can involveadding or omitting questions and providing clarification abouthow specific questions are to be rated. We retained all of the riskof bias signaling questions and applicability questions, for whichwe developed specific guidance on coding in the form of a brieffield guide. For the signaling question ‘Is the reference standardlikely to correctly classify the target condition?’ we oper-ationalised this as whether the researchers who conducted thegold standard interview had received appropriate training. For thesignaling question ‘Was there an appropriate interval between theindex test and reference standard?’ we defined an appropriateinterval as less than two weeks in keeping with how this item hasbeen applied in previous diagnostic test accuracy studies of de-pression (Mann et al., 2009).
We added four additional questions that were applied to stu-dies using translated versions of the PHQ-2 and reference test. Fortranslations of the PHQ-2, we asked whether appropriate trans-lation methods were used and whether psychometric properties ofthe translated version were reported. The same two questions(appropriate translation, psychometric properties) were also ap-plied to any translated version of the reference test.
2.5. Data analysis and synthesis
Sensitivity, specificity, positive and negative likelihood ratios anddiagnostic odds ratios along with their associated 95% confidenceintervals were calculated for cut-off points Z2 and Z3. Hetero-geneity was assessed using I2 for the diagnostic odds ratio, an esti-mate of the proportion of study variability that is due to between-study variability rather than sampling error. We considered valuesof Z50% to indicate substantial heterogeneity (Centre for Reviewsand Dissemination, 2009). Where heterogeneity was not substantialwe used bivariate diagnostic meta-analyses to generate pooled es-timates of sensitivity and specificity. Summary Receiver OperatingCharacteristics (sROC) were calculated to produce 95% confidenceinterval ellipses within ROC space.
Where substantial heterogeneity was identified, we conductedpre-planned subgroup analyses based on clinical setting. We fur-ther explored possible reasons for heterogeneity by conductingpre-planned meta-regressions of key descriptive variables and thequality assessment criteria (Centre for Reviews and Dissemination,2009).
We attempted to limit publication bias by searching a range ofgrey literature databases. The potential for selective outcome

L. Manea et al. / Journal of Affective Disorders 203 (2016) 382–395384
reporting bias related to the reporting of results for some but notother cut-off points is explored in the discussion section.
Bayesian nomograms were generated to examine the perfor-mance of the PHQ-2 at different prevalence estimates.
3. Results
The initial search identified 1054 unique citations (2882 cita-tions before de-duplication). 59 of these citations met initial in-clusion criteria and were selected for further screening of the fullarticle. 21 of the 59 met final stage inclusion criteria (Kroenkeet al., 2003; Arroll et al., 2010; Chagas et al., 2011; de Lima Osorioet al., 2009, Osorio et al., 2012; de Man-van Ginkel et al., 2012;Delgadillo et al., 2011; Fiest et al., 2014; Inagaki et al., 2013; Loweet al., 2005; Margrove et al., 2011a; Phelan et al., 2010a; Richard-son et al., 2010a, 2010b; Smith et al., 2010; Thombs et al., 2008a;Tsai et al., 2014; Williams et al., 2005; Zhang et al., 2013; Zuithoffet al., 2010a).
The remaining 38 were excluded for the following reasons:screening instrument was not the PHQ-2 (N ¼9), PHQ-2 was
Fig. 1. PRISMA Flow diagram
scored in a non-standard way (N ¼7), reference standard was nota recognised gold-standard instrument (N ¼7), reference standarddiagnosis was not solely major depression (N ¼3), study reportedinsufficient information to calculate a 2*2 table for at least one ofthe cut-off points (N ¼2), and overlap in samples with includedstudies (N ¼7). Two additional citations were excluded becausewe were unable to obtain further information from the authors toestablish whether they met inclusion criteria. Finally, one studywas excluded, as all included patients were known to have de-pression and would, thus, not be screened in practice. The selec-tion of studies is summarised in the PRISMA flowchart (Moheret al., 2009) in Fig. 1 and further details about the reasons forexclusion are given in Appendix B.
3.1. Overview of included studies
Table 1 summarises the characteristics of the included studies.Three studies used general primary care samples (Kroenke et al.,2003; Arroll et al., 2010; Zuithoff et al., 2010b), with a further onefocused on older adults in primary care (Phelan et al., 2010b). Onestudy focused on patients with epilepsy, but recruited these from
outlining study selection.

Table 1Descriptive characteristics of the included studies.
Study Sample characteristics (Country, setting, age,sex)
Sample size and %depressed
PHQ-2 characteristics Diagnostic standard
Arroll et al. (2010) Country: New Zealand N ¼ 2642 Administration: Not stated DSM-IV CIDISetting: Primary care Depressed: 6.2% Language: EnglishAge (yrs): Av. ¼ 49 (range ¼ 17–99)Female: 61%
Chagas et al. (2011) Country: Brazil N ¼ 110 Administration: Neurologistadministered
DSM-IV SCID
Setting: Movement disorders outpatient clinic Depressed: 25.5% Language: BrazilianAge (yrs): M ¼ 71.09 (sd ¼ 12.62)Female: 53%
De Lima Osorio et al.(2009)
Country: Brazil N ¼ 177 Administration: Not stated DSM-IV SCID
Setting: Gynaecology and General Practice Depressed: 34% Language: Brazilian PortugueseAge (yrs): 48% o 30Female: 100%
De Lima Osorio et al.(2012)
Country: Brazil N ¼ 100 Administration: Not stated DSM-IV SCIDSetting: General hospital Depressed: 2% Language: Brazilian PortugueseAge (yrs): M ¼ 49 (SD ¼12.4) CIDIFemale: 39%
De Man-van Ginkel et al.(2012)
Country: Netherlands N ¼ 164 Administration: Face to face
Setting: Stroke patients Depressed: 12.2% Language: Unclear (?Dutch andEnglish)
Age (yrs): M ¼ not specifiedFemale: % not specified
Delgadillo et al. (2011) Country: UK N ¼ 103 Administration: Self-report (assistanceif required)
ICD-10 CIS-R
Setting: Community drug treatment service Depressed: 61.2%Age (yrs): M ¼ 35 (range: 23–54) Language: EnglishFemale: 23%Country: Canada N¼ 185 Administration: Self-report DSM IV/V SCID
Fiest et al. (2014) Setting: Secondary care (epilepsy clinic) Depressed: 14.6% Language: EnglishAge (yrs): M ¼ 40.3 (range: 18.2–78.1)Female: 51.4%
Inagaki et al. (2013) Country: Japan N¼ 104 Administration: Face to faceSetting: Secondary care (general medical clinic)Age (yrs): M ¼ 73.5 (SD 12.3) Depressed: 7.4% Language: Japanese MINIFemale: 59.3%
Kroenke et al. (2003) Country: US N ¼ 580 Administration: Self-report DSM-III-R PRIME-MDSetting: Primary care Depressed: 7.1% Language: English
Age (yrs): Primary: M ¼ 46Female: Primary ¼ 66%
Liu et al. (2011) Country: Taiwan N ¼ 1532 Administration: Not stated DSM-IV SCANSetting: Community-based primary care andhospital-based family physician clinics
Depressed: 3.3% Language: Chinese
Age (yrs): Not reportedFemale: % not reported
Lowe et al. (2005) Country: Germany N ¼ 520 Administration: Self-report DSM–IV SCIDSetting: Outpatient clinics and family practices Depressed: 13.7% Language: GermanAge (yrs): M ¼ 42.0 (sd ¼ 13.8)Female: 67.5%
Margrove et al. (2011) Country: UK N ¼ 52 Administration: Self-report DSM-IV SCIDSetting: Diagnosis of epilepsy in primary care Depressed: 48.1% Language: EnglishAge (yrs): M ¼ 49 (sd ¼ 16)Female: 49.8%
Phelan et al. (2010) Country: US N ¼ 69 Administration: Self-report (assistanceif required)
DSM-IV SCID
Setting: Older adults in primary care clinics Depressed: 12% Language: EnglishAge (yrs): M ¼ 78 (sd ¼ 7)Female: 62%
Richardson et al. (2010) Country: US N ¼ 444 Administration: Telephoneadministered
DSM-IV DISCSetting: Group Health Research Institute Depressed: 54.5%Age (yrs): M ¼ 15.3 (sd ¼ 1.1) Language: EnglishFemale: 60%
Richardson et al. (2010) Country: US N ¼ 378 Administration: Unclear DSM-IV SCIDSetting: Community-based aging services agency Depressed: 26.7% Cut-offs: Z1 to 6Age (yrs): M ¼ 76.5 Language: English(sd ¼ 9.2)Female: 68.5%
Smith et al. (2010) Country: US N ¼ 213 Administration: Not stated DSM-IV CIDISetting: Obstetrical settings Depressed: 6.1% Language: EnglishAge (yrs): Depressed: 29.31 (sd ¼ 5.98)Non depressed: 28.87 (sd ¼ 6.72)Female: 100%
Thombs et al. (2008) Country: US N ¼ 1024 Administration: Not stated DSM C-DIS
L. Manea et al. / Journal of Affective Disorders 203 (2016) 382–395 385

Table 1 (continued )
Study Sample characteristics (Country, setting, age,sex)
Sample size and %depressed
PHQ-2 characteristics Diagnostic standard
Setting: Outpatients with coronary heart disease Depressed: 22% Language: EnglishAge (yrs): M ¼ 67 (sd ¼ 11)Female: 18%
Tsai et al. (2014) Country: Taiwan N¼ 165 Administration: Self-report DSM K-SADS-ESetting: Community (high-schools) Depressed 10% Language: ChineseAge (yrs): M ¼ 16.9 (sd ¼ 0.6)Female: 59.6%
Williams et al. (2005) Country: US N ¼ 316 Administration: Not stated DSM-IV SCIDSetting: Inpatient stroke Depressed: 34% Language: EnglishAge (yrs): 42% o 60Female: 51%Country: China N ¼ 959 Administration: Face to face DSM-IV SCID
Zhang et al. (2013) Setting: Community (university students) Depressed: 8.8% Language: ChineseAge (yrs): M ¼ 21.45 (sd ¼ 1.04)Female: 54.3%
Zuithoff et al. (2010) Country: Netherlands N ¼ 1338 Administration: Self-report DSM-IV CIDISetting: Primary care Depressed: 13% Language: DutchAge (yrs): M ¼ 51 (sd ¼ 16.7)Female: 63%
Abbreviations: C-DIS ¼ Computerised Diagnostic Interview Schedule; CIDI ¼ Composite International Diagnostic Interview; CIS-R ¼ Clinical Interview Schedule (Revised);DISC ¼ Diagnostic Interview Schedule for Children; DSM-III-R ¼ Diagnostic and Statistical Manual (Version III Revised); DSM-IV ¼ Diagnostic and Statistical Manual(Version IV); International Classification of Diseases (Version 10); PHQ-2 ¼ Patient Health Questionnaire two-item version; PRIME-MD ¼ Primary Care Evaluation of MentalDisorders; SCAN ¼ Schedule for Clinical Assessments in Neuropsychiatry; SCID ¼ Structured Clinical Interview for DSM
L. Manea et al. / Journal of Affective Disorders 203 (2016) 382–395386
primary care (Margrove et al., 2011b). A further three studies useda combination of a primary care setting and another setting, suchas outpatient clinics (Lowe et al., 2005; De Lima Osorio et al., 2009;Liu et al., 2011). Eight studies recruited from hospital- or out-pa-tient-based medical specialties (Osorio et al., 2012; de Man-vanGinkel et al., 2012; Fiest et al., 2014; Inagaki et al., 2013; Smithet al., 2010; Williams et al., 2005; Chagas et al., 2011; Thombset al., 2008b). Of the remainder, one recruited from a community-drug treatment service (Delgadillo et al., 2011), one from a com-munity-based aging service (Richardson et al., 2010b), one from aresearch institute focusing on adolescents (Richardson et al.,2010a) and two from community settings (students) (Tsai et al.,2014; Zhang et al., 2013).
All of the studies apart from two (Richardson et al., 2010; Tsaiet al., 2014) had working age or older adult samples. In the ma-jority of studies, there were markedly more females than males orthe samples were entirely female. The proportion of the samplethat met reference standard criteria for major depression rangedfrom 2% (Osorio et al., 2012) to 61.2% (Delgadillo et al., 2011). Someof the studies had a high prevalence of depression because thestudy design over-sampled people with positive PHQ-2 scores foradministration of the reference standard (Richardson et al., 2010a;Williams et al., 2005; Margrove et al., 2011b).
Six studies stated that a self-report version of the PHQ-2 wasused (Kroenke et al., 2003; Delgadillo et al., 2011; Fiest et al., 2014;Lowe et al., 2005; Tsai et al., 2014; Zuithoff et al., 2010b; Phelanet al., 2010b). In one study it was administered over the telephone(Richardson et al., 2010a) and in four studies it was administeredface to face (Chagas et al., 2011; de Man-van Ginkel et al., 2012;Inagaki et al., 2013; Zhang et al., 2013); the remaining studies didnot clearly state the method of administration. Translated versionsof the PHQ-2 were used in ten studies (Chagas et al., 2011; Osorioet al., 2012; de Man-van Ginkel et al., 2012; Delgadillo et al., 2011;Inagaki et al., 2013; Lowe et al., 2005; Tsai et al., 2014; Zhang et al.,2013; Zuithoff et al., 2010b; Liu et al., 2011), including Brazilian,Chinese, Dutch, Japanase and German versions.
3.2. Quality assessment
Table 2 summarises the results of the quality assessment usingQUADAS-2. The studies varied in quality. Only two of the studies
were judged to be at a low risk of bias across all of the domains(Arroll et al., 2010; Zuithoff et al., 2010b). One of these studies(Zuithoff et al., 2010b), however, was the only one not to meet allof the applicability criteria. The reference standard in Zuithoff et al.Zuithoff et al., (2010b) assessed major depression over a one-yeartime-frame, so, unlike the PHQ-2, is not assessing current de-pression. This may have lowered the observed accuracy of thePHQ-2 in that study. A number of studies had high prevalencerates of depression because the studies use a design in whichparticipants who are at an increased risk of depression (e.g. thosescoring above a threshold on the PHQ-2) were more likely to begiven the reference standard (Richardson et al., 2010a; Williamset al., 2005; Margrove et al., 2011b).
3.3. Narrative overview of diagnostic performance
Table 3 summarises the test accuracy characteristics of thePHQ-2 at the standard cut-off point of Z3; Table 4 gives the samedata for the alternative cut-off point of Z2.
Nineteen studies reported the performance of the PHQ-2 atcut-off point Z3. At this cut-off, sensitivity ranged from 0.39(Thombs et al., 2008a) to 1 (Osorio et al., 2012) and specificityfrom 0.59 (Smith et al., 2010) to 1 (Margrove et al., 2011b). Fivestudies, one of which was the original validation study, wereconducted in primary care. Of these, one study focused solely onpeople with epilepsy (Margrove et al., 2011b) so was not con-sidered a general primary care sample.
Seventeen studies reported details of the performance of thePHQ-2 at cut-off point Z2 (see Table 4). The distinction betweenthe performance of the PHQ-2 in the original validation study andthe other studies was less marked than at cut-off point Z3,though for those studies in which a diagnostic odds ratio could becalculated, the value was higher in the original validation studiesthan the subsequent studies.
3.4. Diagnostic meta-analyses
An initial diagnostic meta-analysis was run including all 19studies reporting the performance of the PHQ-2 at cut-off pointZ3. Pooled sensitivity was 0.76 (95% CI 0.68–0.82), pooled speci-ficity 0.87 (95% CI 0.82–0.90), pooled positive likelihood ratio 6.02
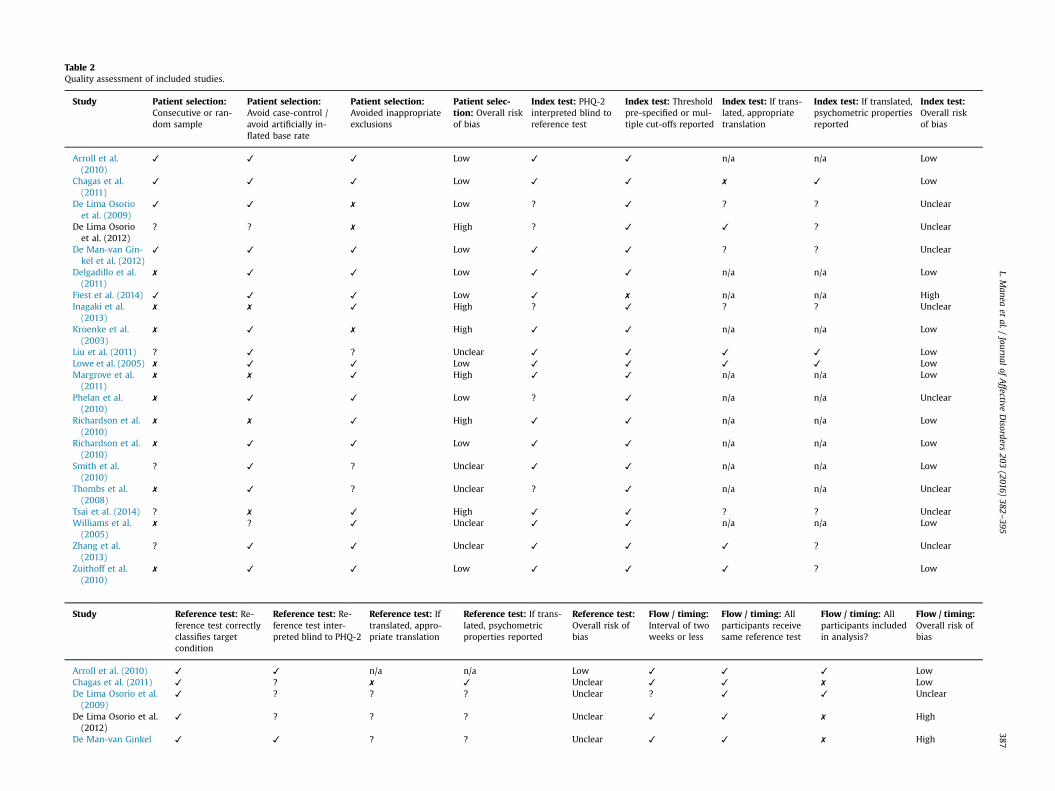
Table 2Quality assessment of included studies.
Study Patient selection:Consecutive or ran-dom sample
Patient selection:Avoid case-control /avoid artificially in-flated base rate
Patient selection:Avoided inappropriateexclusions
Patient selec-tion: Overall riskof bias
Index test: PHQ-2interpreted blind toreference test
Index test: Thresholdpre-specified or mul-tiple cut-offs reported
Index test: If trans-lated, appropriatetranslation
Index test: If translated,psychometric propertiesreported
Index test:Overall riskof bias
Arroll et al.(2010)
✓ ✓ ✓ Low ✓ ✓ n/a n/a Low
Chagas et al.(2011)
✓ ✓ ✓ Low ✓ ✓ ✗ ✓ Low
De Lima Osorioet al. (2009)
✓ ✓ ✗ Low ? ✓ ? ? Unclear
De Lima Osorioet al. (2012)
? ? ✗ High ? ✓ ✓ ? Unclear
De Man-van Gin-kel et al. (2012)
✓ ✓ ✓ Low ✓ ✓ ? ? Unclear
Delgadillo et al.(2011)
✗ ✓ ✓ Low ✓ ✓ n/a n/a Low
Fiest et al. (2014) ✓ ✓ ✓ Low ✓ ✗ n/a n/a HighInagaki et al.(2013)
✗ ✗ ✓ High ? ✓ ? ? Unclear
Kroenke et al.(2003)
✗ ✓ ✗ High ✓ ✓ n/a n/a Low
Liu et al. (2011) ? ✓ ? Unclear ✓ ✓ ✓ ✓ LowLowe et al. (2005) ✗ ✓ ✓ Low ✓ ✓ ✓ ✓ LowMargrove et al.(2011)
✗ ✗ ✓ High ✓ ✓ n/a n/a Low
Phelan et al.(2010)
✗ ✓ ✓ Low ? ✓ n/a n/a Unclear
Richardson et al.(2010)
✗ ✗ ✓ High ✓ ✓ n/a n/a Low
Richardson et al.(2010)
✗ ✓ ✓ Low ✓ ✓ n/a n/a Low
Smith et al.(2010)
? ✓ ? Unclear ✓ ✓ n/a n/a Low
Thombs et al.(2008)
✗ ✓ ? Unclear ? ✓ n/a n/a Unclear
Tsai et al. (2014) ? ✗ ✓ High ✓ ✓ ? ? UnclearWilliams et al.(2005)
✗ ? ✓ Unclear ✓ ✓ n/a n/a Low
Zhang et al.(2013)
? ✓ ✓ Unclear ✓ ✓ ✓ ? Unclear
Zuithoff et al.(2010)
✗ ✓ ✓ Low ✓ ✓ ✓ ? Low
Study Reference test: Re-ference test correctlyclassifies targetcondition
Reference test: Re-ference test inter-preted blind to PHQ-2
Reference test: Iftranslated, appro-priate translation
Reference test: If trans-lated, psychometricproperties reported
Reference test:Overall risk ofbias
Flow / timing:Interval of twoweeks or less
Flow / timing: Allparticipants receivesame reference test
Flow / timing: Allparticipants includedin analysis?
Flow / timing:Overall risk ofbias
Arroll et al. (2010) ✓ ✓ n/a n/a Low ✓ ✓ ✓ LowChagas et al. (2011) ✓ ? ✗ ✓ Unclear ✓ ✓ ✗ LowDe Lima Osorio et al.(2009)
✓ ? ? ? Unclear ? ✓ ✓ Unclear
De Lima Osorio et al.(2012)
✓ ? ? ? Unclear ✓ ✓ ✗ High
De Man-van Ginkel ✓ ✓ ? ? Unclear ✓ ✓ ✗ High
L.Manea
etal./
Journalof
Affective
Disorders
203(2016)
382–395
387
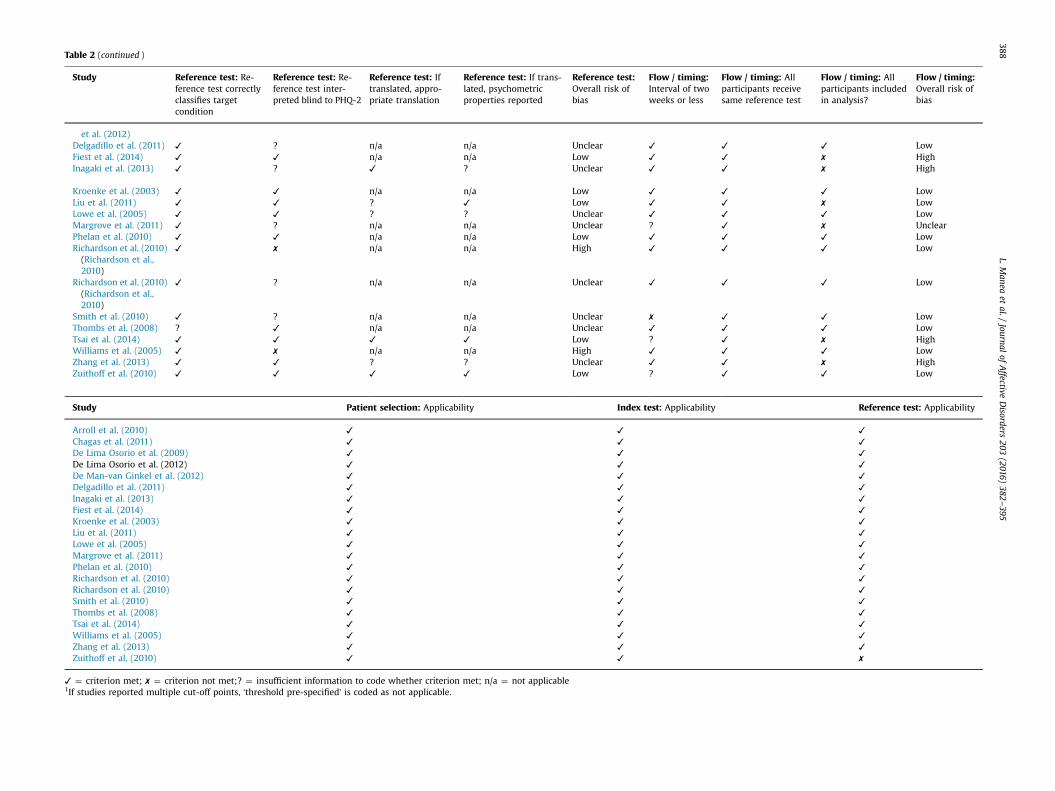
Table 2 (continued )
Study Reference test: Re-ference test correctlyclassifies targetcondition
Reference test: Re-ference test inter-preted blind to PHQ-2
Reference test: Iftranslated, appro-priate translation
Reference test: If trans-lated, psychometricproperties reported
Reference test:Overall risk ofbias
Flow / timing:Interval of twoweeks or less
Flow / timing: Allparticipants receivesame reference test
Flow / timing: Allparticipants includedin analysis?
Flow / timing:Overall risk ofbias
et al. (2012)Delgadillo et al. (2011) ✓ ? n/a n/a Unclear ✓ ✓ ✓ LowFiest et al. (2014) ✓ ✓ n/a n/a Low ✓ ✓ ✗ HighInagaki et al. (2013) ✓ ? ✓ ? Unclear ✓ ✓ ✗ High
Kroenke et al. (2003) ✓ ✓ n/a n/a Low ✓ ✓ ✓ LowLiu et al. (2011) ✓ ✓ ? ✓ Low ✓ ✓ ✗ LowLowe et al. (2005) ✓ ✓ ? ? Unclear ✓ ✓ ✓ LowMargrove et al. (2011) ✓ ? n/a n/a Unclear ? ✓ ✗ UnclearPhelan et al. (2010) ✓ ✓ n/a n/a Low ✓ ✓ ✓ LowRichardson et al. (2010)(Richardson et al.,2010)
✓ ✗ n/a n/a High ✓ ✓ ✓ Low
Richardson et al. (2010)(Richardson et al.,2010)
✓ ? n/a n/a Unclear ✓ ✓ ✓ Low
Smith et al. (2010) ✓ ? n/a n/a Unclear ✗ ✓ ✓ LowThombs et al. (2008) ? ✓ n/a n/a Unclear ✓ ✓ ✓ LowTsai et al. (2014) ✓ ✓ ✓ ✓ Low ? ✓ ✗ HighWilliams et al. (2005) ✓ ✗ n/a n/a High ✓ ✓ ✓ LowZhang et al. (2013) ✓ ✓ ? ? Unclear ✓ ✓ ✗ HighZuithoff et al. (2010) ✓ ✓ ✓ ✓ Low ? ✓ ✓ Low
Study Patient selection: Applicability Index test: Applicability Reference test: Applicability
Arroll et al. (2010) ✓ ✓ ✓
Chagas et al. (2011) ✓ ✓ ✓
De Lima Osorio et al. (2009) ✓ ✓ ✓
De Lima Osorio et al. (2012) ✓ ✓ ✓
De Man-van Ginkel et al. (2012) ✓ ✓ ✓
Delgadillo et al. (2011) ✓ ✓ ✓
Inagaki et al. (2013) ✓ ✓ ✓
Fiest et al. (2014) ✓ ✓ ✓
Kroenke et al. (2003) ✓ ✓ ✓
Liu et al. (2011) ✓ ✓ ✓
Lowe et al. (2005) ✓ ✓ ✓
Margrove et al. (2011) ✓ ✓ ✓
Phelan et al. (2010) ✓ ✓ ✓
Richardson et al. (2010) ✓ ✓ ✓
Richardson et al. (2010) ✓ ✓ ✓
Smith et al. (2010) ✓ ✓ ✓
Thombs et al. (2008) ✓ ✓ ✓
Tsai et al. (2014) ✓ ✓ ✓
Williams et al. (2005) ✓ ✓ ✓
Zhang et al. (2013) ✓ ✓ ✓
Zuithoff et al. (2010) ✓ ✓ ✗
✓ ¼ criterion met; ✗ ¼ criterion not met;? ¼ insufficient information to code whether criterion met; n/a ¼ not applicable1If studies reported multiple cut-off points, ‘threshold pre-specified’ is coded as not applicable.
L.Manea
etal./
Journalof
Affective
Disorders
203(2016)
382–395
388
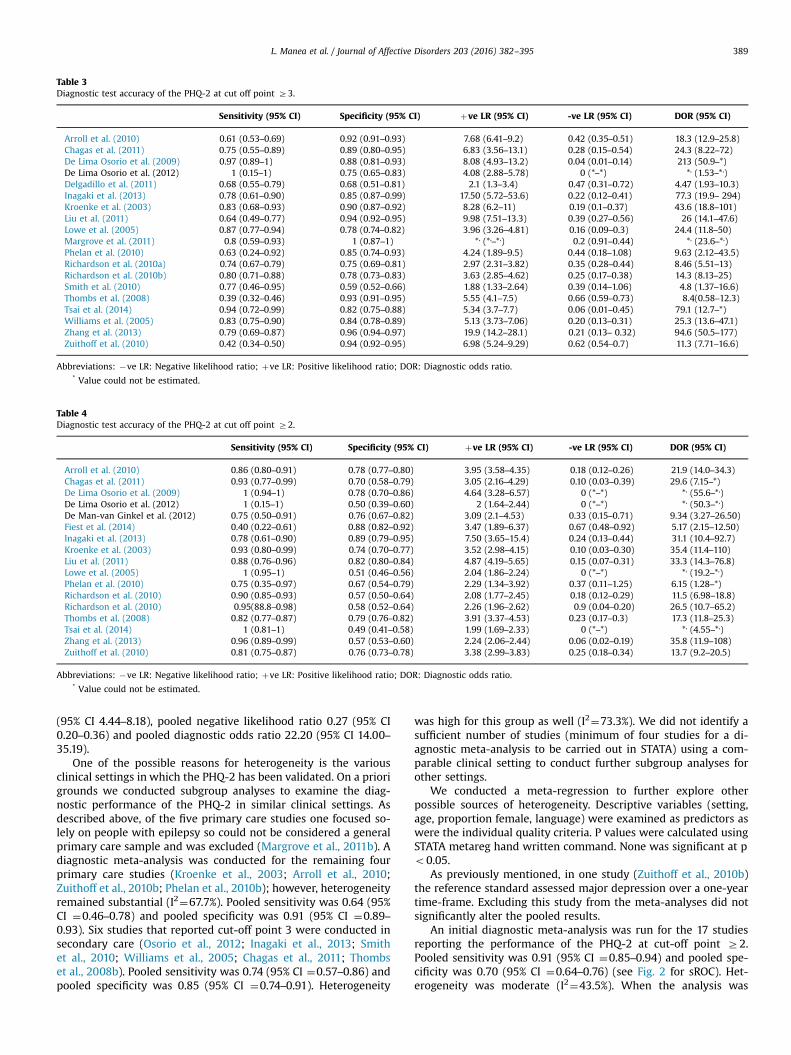
Table 3Diagnostic test accuracy of the PHQ-2 at cut off point Z3.
Sensitivity (95% CI) Specificity (95% CI) þve LR (95% CI) -ve LR (95% CI) DOR (95% CI)
Arroll et al. (2010) 0.61 (0.53–0.69) 0.92 (0.91–0.93) 7.68 (6.41–9.2) 0.42 (0.35–0.51) 18.3 (12.9–25.8)Chagas et al. (2011) 0.75 (0.55–0.89) 0.89 (0.80–0.95) 6.83 (3.56–13.1) 0.28 (0.15–0.54) 24.3 (8.22–72)De Lima Osorio et al. (2009) 0.97 (0.89–1) 0.88 (0.81–0.93) 8.08 (4.93–13.2) 0.04 (0.01–0.14) 213 (50.9–*)De Lima Osorio et al. (2012) 1 (0.15–1) 0.75 (0.65–0.83) 4.08 (2.88–5.78) 0 (*–*) *, (1.53–*,)Delgadillo et al. (2011) 0.68 (0.55–0.79) 0.68 (0.51–0.81) 2.1 (1.3–3.4) 0.47 (0.31–0.72) 4.47 (1.93–10.3)Inagaki et al. (2013) 0.78 (0.61–0.90) 0.85 (0.87–0.99) 17.50 (5.72–53.6) 0.22 (0.12–0.41) 77.3 (19.9– 294)Kroenke et al. (2003) 0.83 (0.68–0.93) 0.90 (0.87–0.92) 8.28 (6.2–11) 0.19 (0.1–0.37) 43.6 (18.8–101)Liu et al. (2011) 0.64 (0.49–0.77) 0.94 (0.92–0.95) 9.98 (7.51–13.3) 0.39 (0.27–0.56) 26 (14.1–47.6)Lowe et al. (2005) 0.87 (0.77–0.94) 0.78 (0.74–0.82) 3.96 (3.26–4.81) 0.16 (0.09–0.3) 24.4 (11.8–50)Margrove et al. (2011) 0.8 (0.59–0.93) 1 (0.87–1) *, (*,–*,) 0.2 (0.91–0.44) *, (23.6–*,)Phelan et al. (2010) 0.63 (0.24–0.92) 0.85 (0.74–0.93) 4.24 (1.89–9.5) 0.44 (0.18–1.08) 9.63 (2.12–43.5)Richardson et al. (2010a) 0.74 (0.67–0.79) 0.75 (0.69–0.81) 2.97 (2.31–3.82) 0.35 (0.28–0.44) 8.46 (5.51–13)Richardson et al. (2010b) 0.80 (0.71–0.88) 0.78 (0.73–0.83) 3.63 (2.85–4.62) 0.25 (0.17–0.38) 14.3 (8.13–25)Smith et al. (2010) 0.77 (0.46–0.95) 0.59 (0.52–0.66) 1.88 (1.33–2.64) 0.39 (0.14–1.06) 4.8 (1.37–16.6)Thombs et al. (2008) 0.39 (0.32–0.46) 0.93 (0.91–0.95) 5.55 (4.1–7.5) 0.66 (0.59–0.73) 8.4(0.58–12.3)Tsai et al. (2014) 0.94 (0.72–0.99) 0.82 (0.75–0.88) 5.34 (3.7–7.7) 0.06 (0.01–0.45) 79.1 (12.7–*)Williams et al. (2005) 0.83 (0.75–0.90) 0.84 (0.78–0.89) 5.13 (3.73–7.06) 0.20 (0.13–0.31) 25.3 (13.6–47.1)Zhang et al. (2013) 0.79 (0.69–0.87) 0.96 (0.94–0.97) 19.9 (14.2–28.1) 0.21 (0.13– 0.32) 94.6 (50.5–177)Zuithoff et al. (2010) 0.42 (0.34–0.50) 0.94 (0.92–0.95) 6.98 (5.24–9.29) 0.62 (0.54–0.7) 11.3 (7.71–16.6)
Abbreviations: �ve LR: Negative likelihood ratio; þve LR: Positive likelihood ratio; DOR: Diagnostic odds ratio.* Value could not be estimated.
Table 4Diagnostic test accuracy of the PHQ-2 at cut off point Z2.
Sensitivity (95% CI) Specificity (95% CI) þve LR (95% CI) -ve LR (95% CI) DOR (95% CI)
Arroll et al. (2010) 0.86 (0.80–0.91) 0.78 (0.77–0.80) 3.95 (3.58–4.35) 0.18 (0.12–0.26) 21.9 (14.0–34.3)Chagas et al. (2011) 0.93 (0.77–0.99) 0.70 (0.58–0.79) 3.05 (2.16–4.29) 0.10 (0.03–0.39) 29.6 (7.15–*)De Lima Osorio et al. (2009) 1 (0.94–1) 0.78 (0.70–0.86) 4.64 (3.28–6.57) 0 (*–*) *, (55.6–*,)De Lima Osorio et al. (2012) 1 (0.15–1) 0.50 (0.39–0.60) 2 (1.64–2.44) 0 (*–*) *, (50.3–*,)De Man-van Ginkel et al. (2012) 0.75 (0.50–0.91) 0.76 (0.67–0.82) 3.09 (2.1–4.53) 0.33 (0.15–0.71) 9.34 (3.27–26.50)Fiest et al. (2014) 0.40 (0.22–0.61) 0.88 (0.82–0.92) 3.47 (1.89–6.37) 0.67 (0.48–0.92) 5.17 (2.15–12.50)Inagaki et al. (2013) 0.78 (0.61–0.90) 0.89 (0.79–0.95) 7.50 (3.65–15.4) 0.24 (0.13–0.44) 31.1 (10.4–92.7)Kroenke et al. (2003) 0.93 (0.80–0.99) 0.74 (0.70–0.77) 3.52 (2.98–4.15) 0.10 (0.03–0.30) 35.4 (11.4–110)Liu et al. (2011) 0.88 (0.76–0.96) 0.82 (0.80–0.84) 4.87 (4.19–5.65) 0.15 (0.07–0.31) 33.3 (14.3–76.8)Lowe et al. (2005) 1 (0.95–1) 0.51 (0.46–0.56) 2.04 (1.86–2.24) 0 (*–*) *, (19.2–*,)Phelan et al. (2010) 0.75 (0.35–0.97) 0.67 (0.54–0.79) 2.29 (1.34–3.92) 0.37 (0.11–1.25) 6.15 (1.28–*)Richardson et al. (2010) 0.90 (0.85–0.93) 0.57 (0.50–0.64) 2.08 (1.77–2.45) 0.18 (0.12–0.29) 11.5 (6.98–18.8)Richardson et al. (2010) 0.95(88.8–0.98) 0.58 (0.52–0.64) 2.26 (1.96–2.62) 0.9 (0.04–0.20) 26.5 (10.7–65.2)Thombs et al. (2008) 0.82 (0.77–0.87) 0.79 (0.76–0.82) 3.91 (3.37–4.53) 0.23 (0.17–0.3) 17.3 (11.8–25.3)Tsai et al. (2014) 1 (0.81–1) 0.49 (0.41–0.58) 1.99 (1.69–2.33) 0 (*–*) *, (4.55–*,)Zhang et al. (2013) 0.96 (0.89–0.99) 0.57 (0.53–0.60) 2.24 (2.06–2.44) 0.06 (0.02–0.19) 35.8 (11.9–108)Zuithoff et al. (2010) 0.81 (0.75–0.87) 0.76 (0.73–0.78) 3.38 (2.99–3.83) 0.25 (0.18–0.34) 13.7 (9.2–20.5)
Abbreviations: �ve LR: Negative likelihood ratio; þve LR: Positive likelihood ratio; DOR: Diagnostic odds ratio.* Value could not be estimated.
L. Manea et al. / Journal of Affective Disorders 203 (2016) 382–395 389
(95% CI 4.44–8.18), pooled negative likelihood ratio 0.27 (95% CI0.20–0.36) and pooled diagnostic odds ratio 22.20 (95% CI 14.00–35.19).
One of the possible reasons for heterogeneity is the variousclinical settings in which the PHQ-2 has been validated. On a priorigrounds we conducted subgroup analyses to examine the diag-nostic performance of the PHQ-2 in similar clinical settings. Asdescribed above, of the five primary care studies one focused so-lely on people with epilepsy so could not be considered a generalprimary care sample and was excluded (Margrove et al., 2011b). Adiagnostic meta-analysis was conducted for the remaining fourprimary care studies (Kroenke et al., 2003; Arroll et al., 2010;Zuithoff et al., 2010b; Phelan et al., 2010b); however, heterogeneityremained substantial (I2¼67.7%). Pooled sensitivity was 0.64 (95%CI ¼0.46–0.78) and pooled specificity was 0.91 (95% CI ¼0.89–0.93). Six studies that reported cut-off point 3 were conducted insecondary care (Osorio et al., 2012; Inagaki et al., 2013; Smithet al., 2010; Williams et al., 2005; Chagas et al., 2011; Thombset al., 2008b). Pooled sensitivity was 0.74 (95% CI ¼0.57–0.86) andpooled specificity was 0.85 (95% CI ¼0.74–0.91). Heterogeneity
was high for this group as well (I2¼73.3%). We did not identify asufficient number of studies (minimum of four studies for a di-agnostic meta-analysis to be carried out in STATA) using a com-parable clinical setting to conduct further subgroup analyses forother settings.
We conducted a meta-regression to further explore otherpossible sources of heterogeneity. Descriptive variables (setting,age, proportion female, language) were examined as predictors aswere the individual quality criteria. P values were calculated usingSTATA metareg hand written command. None was significant at po0.05.
As previously mentioned, in one study (Zuithoff et al., 2010b)the reference standard assessed major depression over a one-yeartime-frame. Excluding this study from the meta-analyses did notsignificantly alter the pooled results.
An initial diagnostic meta-analysis was run for the 17 studiesreporting the performance of the PHQ-2 at cut-off point Z2.Pooled sensitivity was 0.91 (95% CI ¼0.85–0.94) and pooled spe-cificity was 0.70 (95% CI ¼0.64–0.76) (see Fig. 2 for sROC). Het-erogeneity was moderate (I2¼43.5%). When the analysis was
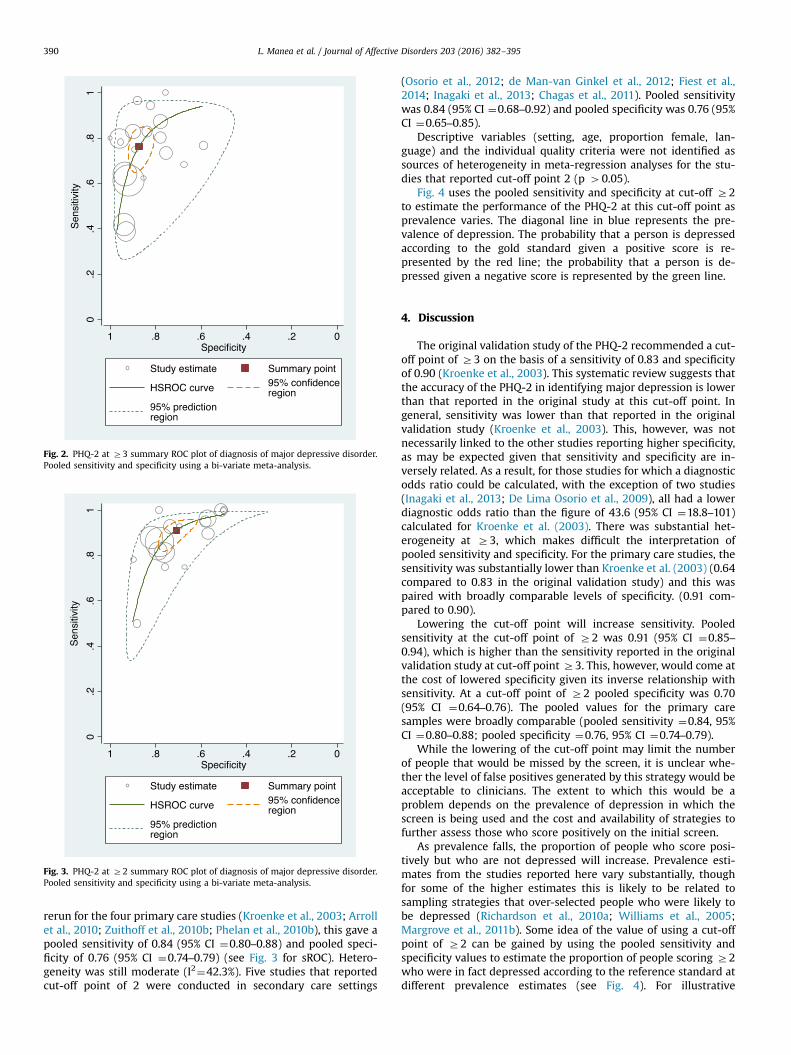
Fig. 2. PHQ-2 at Z3 summary ROC plot of diagnosis of major depressive disorder.Pooled sensitivity and specificity using a bi-variate meta-analysis.
Fig. 3. PHQ-2 at Z2 summary ROC plot of diagnosis of major depressive disorder.Pooled sensitivity and specificity using a bi-variate meta-analysis.
L. Manea et al. / Journal of Affective Disorders 203 (2016) 382–395390
rerun for the four primary care studies (Kroenke et al., 2003; Arrollet al., 2010; Zuithoff et al., 2010b; Phelan et al., 2010b), this gave apooled sensitivity of 0.84 (95% CI ¼0.80–0.88) and pooled speci-ficity of 0.76 (95% CI ¼0.74–0.79) (see Fig. 3 for sROC). Hetero-geneity was still moderate (I2¼42.3%). Five studies that reportedcut-off point of 2 were conducted in secondary care settings
(Osorio et al., 2012; de Man-van Ginkel et al., 2012; Fiest et al.,2014; Inagaki et al., 2013; Chagas et al., 2011). Pooled sensitivitywas 0.84 (95% CI ¼0.68–0.92) and pooled specificity was 0.76 (95%CI ¼0.65–0.85).
Descriptive variables (setting, age, proportion female, lan-guage) and the individual quality criteria were not identified assources of heterogeneity in meta-regression analyses for the stu-dies that reported cut-off point 2 (p 40.05).
Fig. 4 uses the pooled sensitivity and specificity at cut-off Z2to estimate the performance of the PHQ-2 at this cut-off point asprevalence varies. The diagonal line in blue represents the pre-valence of depression. The probability that a person is depressedaccording to the gold standard given a positive score is re-presented by the red line; the probability that a person is de-pressed given a negative score is represented by the green line.
4. Discussion
The original validation study of the PHQ-2 recommended a cut-off point of Z3 on the basis of a sensitivity of 0.83 and specificityof 0.90 (Kroenke et al., 2003). This systematic review suggests thatthe accuracy of the PHQ-2 in identifying major depression is lowerthan that reported in the original study at this cut-off point. Ingeneral, sensitivity was lower than that reported in the originalvalidation study (Kroenke et al., 2003). This, however, was notnecessarily linked to the other studies reporting higher specificity,as may be expected given that sensitivity and specificity are in-versely related. As a result, for those studies for which a diagnosticodds ratio could be calculated, with the exception of two studies(Inagaki et al., 2013; De Lima Osorio et al., 2009), all had a lowerdiagnostic odds ratio than the figure of 43.6 (95% CI ¼18.8–101)calculated for Kroenke et al. (2003). There was substantial het-erogeneity at Z3, which makes difficult the interpretation ofpooled sensitivity and specificity. For the primary care studies, thesensitivity was substantially lower than Kroenke et al. (2003) (0.64compared to 0.83 in the original validation study) and this waspaired with broadly comparable levels of specificity. (0.91 com-pared to 0.90).
Lowering the cut-off point will increase sensitivity. Pooledsensitivity at the cut-off point of Z2 was 0.91 (95% CI ¼0.85–0.94), which is higher than the sensitivity reported in the originalvalidation study at cut-off point Z3. This, however, would come atthe cost of lowered specificity given its inverse relationship withsensitivity. At a cut-off point of Z2 pooled specificity was 0.70(95% CI ¼0.64–0.76). The pooled values for the primary caresamples were broadly comparable (pooled sensitivity ¼0.84, 95%CI ¼0.80–0.88; pooled specificity ¼0.76, 95% CI ¼0.74–0.79).
While the lowering of the cut-off point may limit the numberof people that would be missed by the screen, it is unclear whe-ther the level of false positives generated by this strategy would beacceptable to clinicians. The extent to which this would be aproblem depends on the prevalence of depression in which thescreen is being used and the cost and availability of strategies tofurther assess those who score positively on the initial screen.
As prevalence falls, the proportion of people who score posi-tively but who are not depressed will increase. Prevalence esti-mates from the studies reported here vary substantially, thoughfor some of the higher estimates this is likely to be related tosampling strategies that over-selected people who were likely tobe depressed (Richardson et al., 2010a; Williams et al., 2005;Margrove et al., 2011b). Some idea of the value of using a cut-offpoint of Z2 can be gained by using the pooled sensitivity andspecificity values to estimate the proportion of people scoring Z2who were in fact depressed according to the reference standard atdifferent prevalence estimates (see Fig. 4). For illustrative

0.0000.1000.2000.3000.4000.5000.6000.7000.8000.9001.000
0 0.1 0.2 0.3 0.4 0.5 0.6 0.7 0.8 0.9 1 1.1
Post
-test
Pro
babi
lity
Pre-test Probability
Bayesian Graph: Post-test probability as function of test result and pre-test probability
Probability given Positive Test Probability given Negative Test If no test
Fig. 4. Performance of PHQ-2 at Z2 using pooled sensitivity and specificity at different prevalence estimates. (For interpretation of the references to color in this figurelegend, the reader is referred to the web version of this article.)
0.0000.1000.2000.3000.4000.5000.6000.7000.8000.9001.000
0 0.1 0.2 0.3 0.4 0.5 0.6 0.7 0.8 0.9 1 1.1
Post
-test
Pro
babi
lity
Pre-test Probability
Bayesian Graph: Post-test probability as function of test result and pre-test probability
Probability given Positive Test Probability given Negative Test If no test
Fig. 5. Performance of PHQ-2 at Z2 using pooled sensitivity and specificity at different prevalence estimates in primary care studies (Gilbody et al., 2007).
L. Manea et al. / Journal of Affective Disorders 203 (2016) 382–395 391
purposes, prevalence values of 5%, 15% and 25% are discussed. Onthe basis of the pooled sensitivity and specificity values, at a 5%prevalence of depression approximately 14% of people who scoredat Z2 would be depressed according to the gold standard; at 15%prevalence the value becomes approximately 37% and at 25%prevalence the value would be 51%. The pooled sensitivity andspecificity of the primary care studies at this cut-off point givessimilar results (5% prevalence: 16%; 15% prevalence: 38%; 25%prevalence 54%) (see Fig. 5). This analysis assumes that no patientsare being treated for depression, which is perhaps an unrealisticassumption. About half of patients are recognised withoutscreening and in primary care and a large number are alreadytreated. However the studies do not present sufficiently detaileddata to re-run the analyses for people not known to be depressed(Thombs et al., 2011).
At the lower estimates of prevalence, this cut-off point maygenerate too high a proportion of people scoring positively whoare not depressed to make it a useful clinical tool. This suggeststhat it may be of limited use as a case-finding instrument, in whichall people presenting to a service, such as a general practitioner
surgery, are opportunistically screened, because in such a contextthe prevalence is likely to be low. As the prevalence increases,however, it may become useful. This suggests that the PHQ-2 at acut-off point of Z2 may be of use in screening situations in whicha group known to be at high risk of depression is targeted forscreening, because of the increased prevalence of depression.There are, however, a number of caveats to this conclusion. First,the studies reviewed here typically used it in a general screeningcontext; evaluation in selective contexts would be needed toconfirm it performance in these situations. Secondly, as alreadymentioned, the studies reviewed do not distinguish between thosepeople who are already known to services to be depressed andthose who are depressed but not known. The aim of selectivescreening would be to identify cases that are not already known toclinical services. The prevalence of previously unknown depres-sion will be lower than the overall depression prevalence, whichmay again limit the value of any identification tool. It is also un-clear how the different context of identifying only previouslyunidentified depression would affect the diagnostic characteristicsof the measure. Thirdly, the value of a screening tool cannot be
L. Manea et al. / Journal of Affective Disorders 203 (2016) 382–395392
assessed solely on the basis of its sensitivity and specificity, butcan only be assessed as part of a wider evaluation that examinesthe effectiveness and cost-effectiveness of not only screening, butthe consequences of screening in terms of treatment and theoutcome of that treatment (Allaby, 2010).
While this cut-off point may have some limitations in identi-fying people likely to have depression when there is a low pre-valence of depression, given the high false positive rate, the ne-gative likelihood ratios for this cut-off point suggest that thosepeople who are predicted to be not depressed according to thiscut-of point are unlikely to be depressed, particularly when theprevalence of depression is low. The PHQ-2 at Z2, therefore, mayhave value in ruling out depression. Fig. 4 illustrates this for thepooled sensitivity and specificity. If the pooled sensitivity andspecificity values are used, at 5% prevalence approximately 99% ofpeople scoring below the cut-off would not be depressed; at 15%the figure is 97% and at 25% the figure is 94%. The correspondingfigures based on the primary care pooled estimates of sensitivityand specificity are 99% (5% prevalence), 96% (15% prevalence) and93% (25% prevalence) (see Fig. 5).
It is important to note that the results of this meta-analysis donot apply to the Whooley questions (also known as the ‘yes/no’PHQ-2). The Whooley questions are often confused with, and re-ferred to as, the PHQ-2. However, the relatively poor sensitivityand specificity reported for the PHQ-2 in this study does not applyto the Whooley questions. A recent diagnostic meta-analysis of theWhooley questions has shown that the Whooley questions appearto be more sensitive but less specific (Bosanquet et al., 2015).
4.1. Limitations
Although we sought to review grey literature databases, wecannot rule out the possibility of publication bias. Study selectionand data extraction were performed by one author, which mayhave also introduced bias.
Three studies (Richardson et al., 2010a; Williams et al., 2005;Margrove et al., 2011b) used a design in which participants whowere more likely to be depressed were also more likely to be giventhe reference standard, which may have introduced a partial ver-ification bias. The QUADAS-II assessment identified variability instudy quality, with only a small number of studies rated as at lowrisk of bias across all domains. Variations in study quality, how-ever, did not appear to be related to outcome according to themeta-regression for cut-off point Z3.
There was some lack of detail in the reporting of studies, whichmade it difficult to assess some of the QUADAS-2 criteria. This wasparticularly the case for the reporting of whether the referencestandard was conduced blind to the PHQ-2. Future studies shouldmake clear statements about the blinding of the reference stan-dard and more generally ensure that the method is reported insufficient detail to assess the standard QUADAS-2 criteria.
Some studies may have selectively reported cut-off points – thestudies that reported the two cut-off points (2 and 3) varied. It ispossible that there is a relationship between the observed per-formance of the PHQ-2 at a particular cut-off point and the like-lihood that it is reported for a particular study. Future studiesshould report the performance of the PHQ-2 at all available cut-offpoints to protect against the possibility of selective outcome re-porting. Some studies reported details of sensitivity and specificitybut were excluded because we were unable to identify the addi-tional information required to calculate the 2*2 tables that permitthe calculation of the full range of accuracy statistics. Future stu-dies should also report sufficient information to ensure that a 2*2table can be reconstructed form the information reported. As de-scribed above, the role of screening is to identify previously un-known cases, yet typically the studies identified in this review do
not differentiate between previously known and previously un-known cases. It is not clear what impact restricting the analysis topreviously unknown cases would have on sensitivity and specifi-city, but such an approach would necessarily reduce the pre-valence of depression, which may affect whether the instrument islikely to be useful in a particular clinical context. Future validationstudies should seek to report the diagnostic performance of thePHQ-2 in identifying previously unknown cases.
The pooled estimates should be interpreted with caution giventhe high level of heterogeneity. Although I2 may exaggerate het-erogeneity in DTA studies, there is no clear guidance available onthe best way to manage this.
Another interesting finding of this review is the relatively smallnumber of validation studies of the PHQ-2 compared to thenumber of validation studies of the PHQ-9, which incorporates thePHQ-2. A recent meta-analysis of the PHQ-9 has identified 36validation studies and most of these do not specifically report thepsychometric properties of the PHQ-2.
4.2. Conclusion
In screening situations, reasonably high sensitivity is often re-quired to ensure that the screening process misses few peoplewith the diagnosis. The original validation study of Kroenke et al.(2003) reported sensitivity of 0.83 at a cut-off point of Z3, but anumber of subsequent studies have tended to report somewhatlower sensitivity at this cut-off point. If sensitivity comparable tothat reported in the original validation study is required in ascreening situation, then the lower cut-off point may be needed toensure sufficiently high sensitivity. However, the associated spe-cificity value at this cut-off point is modest, which may limit theusefulness of the PHQ-2 at this cut-off point to identify peoplelikely to be depressed when the prevalence of depression is low.
Conflicts of interest
No authors have any conflicts of interest disclosures.
Acknowledgements
We would like to thank the authors of both the included andexcluded studies for their help in answering our questions abouttheir studies. Dr Manea was supported by an NIHR Lectureshipaward. There was no specific funding for this study, and no fundershad any role in the study design, in the collection, analysis or in-terpretation of data, in the writing of the manuscript or in thedecision to submit the manuscript for publication.
Appendix A. Search terms used in Embase, MEDLINE andPsycINFO
(phq adj5 “2″).ti, ab.(phq adj5 abbreviate$).ti, ab.(phq adj5 brief).ti, ab.(phq adj5 item$).ti, ab.(phq adj5 short$).ti, ab.(phq adj5 two).ti, ab.(patient health questionnaire adj5 “2″).ti, ab.(patient health questionnaire adj5 abbreviate$).ti, ab.(patient health questionnaire adj5 brief).ti, ab.(patient health questionnaire adj5 item$).ti, ab.(patient health questionnaire adj5 short$).ti, ab.(patient health questionnaire adj5 two).ti, ab.(prime md adj5 “2″).ti, ab.
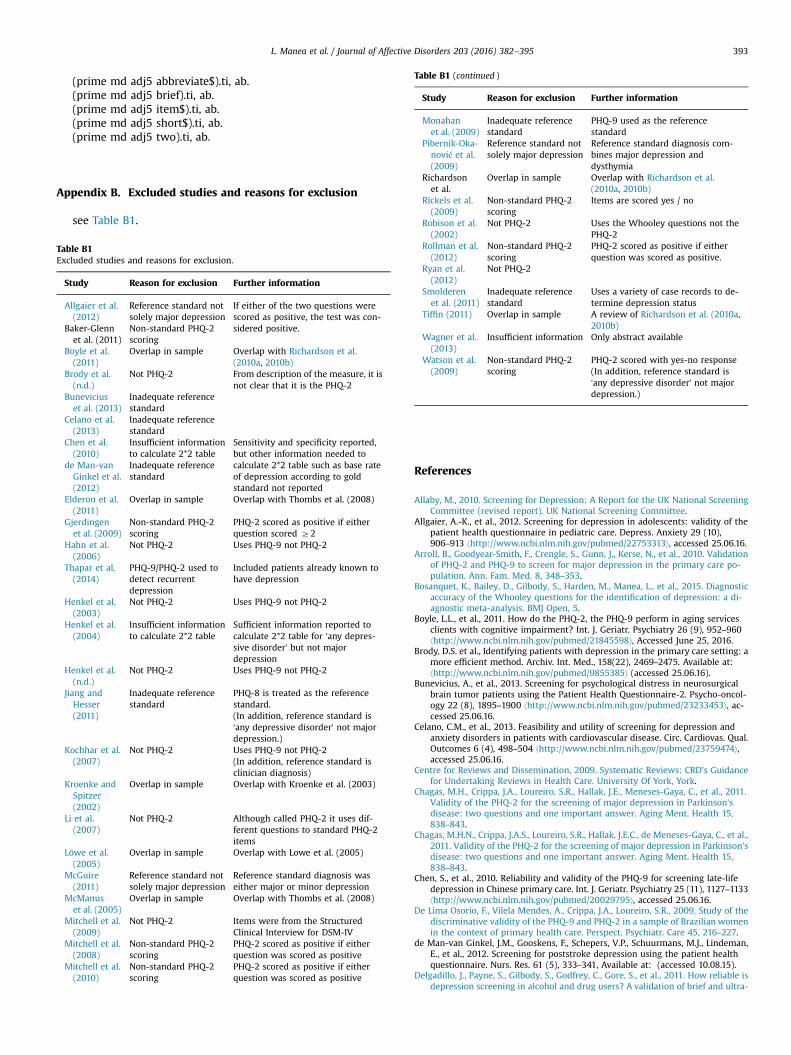
Table B1 (continued )
Study Reason for exclusion Further information
Monahanet al. (2009)
Inadequate referencestandard
PHQ-9 used as the referencestandard
Pibernik-Oka- Reference standard not Reference standard diagnosis com-
L. Manea et al. / Journal of Affective Disorders 203 (2016) 382–395 393
(prime md adj5 abbreviate$).ti, ab.(prime md adj5 brief).ti, ab.(prime md adj5 item$).ti, ab.(prime md adj5 short$).ti, ab.(prime md adj5 two).ti, ab.
nović et al.(2009)
solely major depression bines major depression anddysthymia
Richardsonet al.
Overlap in sample Overlap with Richardson et al.(2010a, 2010b)
Rickels et al.(2009)
Non-standard PHQ-2scoring
Items are scored yes / no
Robison et al. Not PHQ-2 Uses the Whooley questions not the
Appendix B. Excluded studies and reasons for exclusion
see Table B1.
Table B1Excluded studies and reasons for exclusion.
Study Reason for exclusion Further information
Allgaier et al.(2012)
Reference standard notsolely major depression
If either of the two questions werescored as positive, the test was con-sidered positive.Baker-Glenn
et al. (2011)Non-standard PHQ-2scoring
Boyle et al.(2011)
Overlap in sample Overlap with Richardson et al.(2010a, 2010b)
Brody et al.(n.d.)
Not PHQ-2 From description of the measure, it isnot clear that it is the PHQ-2
Buneviciuset al. (2013)
Inadequate referencestandard
Celano et al.(2013)
Inadequate referencestandard
Chen et al.(2010)
Insufficient informationto calculate 2*2 table
Sensitivity and specificity reported,but other information needed tocalculate 2*2 table such as base rateof depression according to goldstandard not reported
de Man-vanGinkel et al.(2012)
Inadequate referencestandard
Elderon et al.(2011)
Overlap in sample Overlap with Thombs et al. (2008)
Gjerdingenet al. (2009)
Non-standard PHQ-2scoring
PHQ-2 scored as positive if eitherquestion scored Z2
Hahn et al.(2006)
Not PHQ-2 Uses PHQ-9 not PHQ-2
Thapar et al.(2014)
PHQ-9/PHQ-2 used todetect recurrentdepression
Included patients already known tohave depression
Henkel et al.(2003)
Not PHQ-2 Uses PHQ-9 not PHQ-2
Henkel et al.(2004)
Insufficient informationto calculate 2*2 table
Sufficient information reported tocalculate 2*2 table for ‘any depres-sive disorder’ but not majordepression
Henkel et al.(n.d.)
Not PHQ-2 Uses PHQ-9 not PHQ-2
Jiang andHesser(2011)
Inadequate referencestandard
PHQ-8 is treated as the referencestandard.(In addition, reference standard is‘any depressive disorder’ not majordepression.)
Kochhar et al.(2007)
Not PHQ-2 Uses PHQ-9 not PHQ-2(In addition, reference standard isclinician diagnosis)
Kroenke andSpitzer(2002)
Overlap in sample Overlap with Kroenke et al. (2003)
Li et al.(2007)
Not PHQ-2 Although called PHQ-2 it uses dif-ferent questions to standard PHQ-2items
Löwe et al.(2005)
Overlap in sample Overlap with Lowe et al. (2005)
McGuire(2011)
Reference standard notsolely major depression
Reference standard diagnosis waseither major or minor depression
McManuset al. (2005)
Overlap in sample Overlap with Thombs et al. (2008)
Mitchell et al.(2009)
Not PHQ-2 Items were from the StructuredClinical Interview for DSM-IV
Mitchell et al.(2008)
Non-standard PHQ-2scoring
PHQ-2 scored as positive if eitherquestion was scored as positive
Mitchell et al.(2010)
Non-standard PHQ-2scoring
PHQ-2 scored as positive if eitherquestion was scored as positive
(2002) PHQ-2Rollman et al.(2012)
Non-standard PHQ-2scoring
PHQ-2 scored as positive if eitherquestion was scored as positive.
Ryan et al.(2012)
Not PHQ-2
Smolderenet al. (2011)
Inadequate referencestandard
Uses a variety of case records to de-termine depression status
Tiffin (2011) Overlap in sample A review of Richardson et al. (2010a,2010b)
Wagner et al.(2013)
Insufficient information Only abstract available
Watson et al.(2009)
Non-standard PHQ-2scoring
PHQ-2 scored with yes-no response(In addition, reference standard is‘any depressive disorder’ not majordepression.)
References
Allaby, M., 2010. Screening for Depression: A Report for the UK National ScreeningCommittee (revised report). UK National Screening Committee.
Allgaier, A.-K., et al., 2012. Screening for depression in adolescents: validity of thepatient health questionnaire in pediatric care. Depress. Anxiety 29 (10),906–913 ⟨http://www.ncbi.nlm.nih.gov/pubmed/22753313⟩, accessed 25.06.16.
Arroll, B., Goodyear-Smith, F., Crengle, S., Gunn, J., Kerse, N., et al., 2010. Validationof PHQ-2 and PHQ-9 to screen for major depression in the primary care po-pulation. Ann. Fam. Med. 8, 348–353.
Bosanquet, K., Bailey, D., Gilbody, S., Harden, M., Manea, L., et al., 2015. Diagnosticaccuracy of the Whooley questions for the identification of depression: a di-agnostic meta-analysis. BMJ Open, 5.
Boyle, L.L., et al., 2011. How do the PHQ-2, the PHQ-9 perform in aging servicesclients with cognitive impairment? Int. J. Geriatr. Psychiatry 26 (9), 952–960⟨http://www.ncbi.nlm.nih.gov/pubmed/21845598⟩, Accessed June 25, 2016.
Brody, D.S. et al., Identifying patients with depression in the primary care setting: amore efficient method. Archiv. Int. Med., 158(22), 2469–2475. Available at:⟨http://www.ncbi.nlm.nih.gov/pubmed/9855385⟩ (accessed 25.06.16).
Bunevicius, A., et al., 2013. Screening for psychological distress in neurosurgicalbrain tumor patients using the Patient Health Questionnaire-2. Psycho-oncol-ogy 22 (8), 1895–1900 ⟨http://www.ncbi.nlm.nih.gov/pubmed/23233453⟩, ac-cessed 25.06.16.
Celano, C.M., et al., 2013. Feasibility and utility of screening for depression andanxiety disorders in patients with cardiovascular disease. Circ. Cardiovas. Qual.Outcomes 6 (4), 498–504 ⟨http://www.ncbi.nlm.nih.gov/pubmed/23759474⟩,accessed 25.06.16.
Centre for Reviews and Dissemination, 2009. Systematic Reviews: CRD's Guidancefor Undertaking Reviews in Health Care. University Of York, York.
Chagas, M.H., Crippa, J.A., Loureiro, S.R., Hallak, J.E., Meneses-Gaya, C., et al., 2011.Validity of the PHQ-2 for the screening of major depression in Parkinson'sdisease: two questions and one important answer. Aging Ment. Health 15,838–843.
Chagas, M.H.N., Crippa, J.A.S., Loureiro, S.R., Hallak, J.E.C., de Meneses-Gaya, C., et al.,2011. Validity of the PHQ-2 for the screening of major depression in Parkinson'sdisease: two questions and one important answer. Aging Ment. Health 15,838–843.
Chen, S., et al., 2010. Reliability and validity of the PHQ-9 for screening late-lifedepression in Chinese primary care. Int. J. Geriatr. Psychiatry 25 (11), 1127–1133⟨http://www.ncbi.nlm.nih.gov/pubmed/20029795⟩, accessed 25.06.16.
De Lima Osorio, F., Vilela Mendes, A., Crippa, J.A., Loureiro, S.R., 2009. Study of thediscriminative validity of the PHQ-9 and PHQ-2 in a sample of Brazilian womenin the context of primary health care. Perspect. Psychiatr. Care 45, 216–227.
de Man-van Ginkel, J.M., Gooskens, F., Schepers, V.P., Schuurmans, M.J., Lindeman,E., et al., 2012. Screening for poststroke depression using the patient healthquestionnaire. Nurs. Res. 61 (5), 333–341, Available at: (accessed 10.08.15).
Delgadillo, J., Payne, S., Gilbody, S., Godfrey, C., Gore, S., et al., 2011. How reliable isdepression screening in alcohol and drug users? A validation of brief and ultra-
L. Manea et al. / Journal of Affective Disorders 203 (2016) 382–395394
brief questionnaires. J. Affect. Disord. 134, 266–271.Elderon, L., et al., 2011. Accuracy and prognostic value of American Heart Asso-
ciation: recommended depression screening in patients with coronary heartdisease: data from the Heart and Soul Study. Circ. Cardiovas. Qual. Outcomes 4(5), 533–540 ⟨http://www.ncbi.nlm.nih.gov/pubmed/21862720⟩, accessed25.06.16.
Fiest, K.M., Patten, S.B., Wiebe, S., Bulloch, A.G.M., Maxwell, C.J., et al., 2014. Vali-dating screening tools for depression in epilepsy. Epilepsia 55, 1642–1650.
Gilbody, S., Richards, D., Brealey, S., Hewitt, C., 2007. Screening for depression inmedical settings with the Patient Health Questionnaire (PHQ): a diagnosticmeta-analysis. J. Gen. Intern. Med. 22, 1596–1602.
Gilbody, S., Sheldon, T., House, A., 2008. Screening and case-finding instruments fordepression: a meta-analysis. Can. Med. Assoc. J. 178, 997–1003.
Gjerdingen, D., et al., 2009. Postpartum depression screening at well-child visits:validity of a 2-question screen and the PHQ-9. Ann. Fam. Med. 7 (1), 63–70⟨http://www.ncbi.nlm.nih.gov/pubmed/19139451⟩, Accessed June 25, 2016.
Hahn, D., Reuter, K., Härter, M., 2006. Screening for affective and anxiety disordersin medical patients - comparison of HADS, GHQ-12 and Brief-PHQ. Psycho-social Med. 3, Doc09 ⟨http://www.ncbi.nlm.nih.gov/pubmed/19742274⟩, ac-cessed 25.06.16.
Henkel, V. et al., Use of brief depression screening tools in primary care: con-sideration of heterogeneity in performance in different patient groups. Generalhospital psychiatry, 26(3) 190–198. Available at: ⟨http://www.ncbi.nlm.nih.gov/pubmed/15121347⟩ (accessed 25.06.16).
Henkel, V., et al., 2003. Identifying depression in primary care: a comparison ofdifferent methods in a prospective cohort study. Br. Med. J. (Clinical researched.) 326 (7382), 200–201 ⟨http://www.ncbi.nlm.nih.gov/pubmed/12543837⟩,accessed 25.06.16.
Henkel, V., et al., 2004. Screening for depression in primary care: will one or twoitems suffice? Eur. Arch. Psychiatry Clin. Neurosci. 254 (4), 215–223 ⟨http://www.ncbi.nlm.nih.gov/pubmed/15309389⟩, accessed 25.06.16.
Inagaki, M., Ohtsuki, T., Yonemoto, N., Kawashima, Y., Saitoh, A., et al., 2013. Validityof the Patient Health Questionnaire (PHQ)-9 and PHQ-2 in general internalmedicine primary care at a Japanese rural hospital: a cross-sectional study.Gen. Hosp. Psychiatry 35, 592–597.
Jiang, Y., Hesser, J.E., 2011. A comparison of depression and mental distress in-dicators, Rhode Island Behavioral Risk Factor Surveillance System, 2006. Prev.Chron. Dis. 8 (2), A37 ⟨http://www.ncbi.nlm.nih.gov/pubmed/21324251⟩, ac-cessed 25.06.16.
Joffres, M., Jaramillo, A., Dickinson, J., Lewin, G., Pottie, K., et al., 2013. Re-commendations on screening for depression in adults. Can. Med. Assoc. J. ( J. de.l’Assoc. Med. Can.) 185, 775–782.
Kochhar, P., Rajadhyaksha, S., Suvarna, V., 2007. Translation and validation of briefpatient health questionnaire against DSM IV as a tool to diagnose major de-pressive disorder in Indian patients. J. Postgrad. Med. 53 (2), 102 ⟨http://www.jpgmonline.com/text.asp?2007/53/2/102/32209⟩, accessed 25.06.16.
Kroenke, K., Spitzer, R.L., 2002. The PHQ-9. Psychiatr. Ann. 32 (9), 509–515.Kroenke, K., Spitzer, R.L., Williams, J.B.W., 2001. The PHQ-9: validity of a brief de-
pression severity measure. J. Gen. Intern. Med. 16, 606–613.Kroenke, K., Spitzer, R.L., Williams, J.B., 2003. The patient health questionnaire-2:
validity of a two-item depression screener. Med. Care 41, 1284–1292.Kroenke, K., Spitzer, R.L., Williams, J.B.W., Lowe, B., 2010. The patient health
questionnaire somatic, anxiety, and depressive symptom scales: a systematicreview. Gen. Hosp. Psychiatry 32, 345–359.
Li, C., et al., 2007. Validity of the patient health questionnaire 2 (PHQ-2) in iden-tifying major depression in older people. J. Am. Geriatr. Soc. 55 (4), 596–602⟨http://www.ncbi.nlm.nih.gov/pubmed/17397440⟩, accessed 25.06.16.
Liu, S.I., Yeh, Z.T., Huang, H.C., Sun, F.J., Tjung, J.J., et al., 2011. Validation of patienthealth questionnaire for depression screening among primary care patients inTaiwan. Compr. Psychiatry 52, 96–101.
Lowe, B., Kroenke, K., Grafe, K., 2005. Detecting and monitoring depression with atwo-item questionnaire (PHQ-2). J. Psychosom. Res. 58, 163–171.
Löwe, B., Kroenke, K., Gräfe, K., 2005. Detecting and monitoring depression with atwo-item questionnaire (PHQ-2). J. Psychosomat. Res. 58 (2), 163–171 ⟨http://www.ncbi.nlm.nih.gov/pubmed/15820844⟩, accessed 25.06.16.
Manea, L., Gilbody, S., McMillan, D., 2012. Optimal cut-off score for diagnosingdepression with the Patient Health Questionnaire (PHQ-9): a meta-analysis.Can. Med. Assoc. J. 184, E191–E196.
Mann, R., Hewitt, C.E., Gilbody, S.M., 2009. Assessing the quality of diagnosticstudies using psychometric instruments: applying QUADAS. Soc. PsychiatryPsychiatr. Epidemiol. 44, 300–307.
Margrove, K., Mensah, S., Thapar, A., Kerr, M., 2011a. Depression screening for pa-tients with epilepsy in a primary care setting using the patient health ques-tionnaire-2 and the neurological disorders depression inventory for epilepsy.Epilepsy Behav. 21, 387–390.
Margrove, K., Mensah, S., Thapar, A., Kerr, M., 2011b. Depression screening forpatients with epilepsy in a primary care setting using the patient healthquestionnaire-2 and the neurological disorders depression inventory for epi-lepsy. Epilepsy Behav. 21, 387–390.
McGuire, A.W., 2011. Depression Screening by Nurses in Hospitalized Acute Cor-onary Syndrome Patients,.
McManus, D., Pipkin, S.S., Whooley, M.A., 2005. Screening for depression in patientswith coronary heart disease (data from the Heart and Soul Study). The Amer-ican journal of cardiology 96 (8), 1076–1081 ⟨http://www.ncbi.nlm.nih.gov/pubmed/16214441⟩, accessed 25.06.16.
Mitchell, A.J., Coyne, J.C.J., 2007. Do ultra-short screening instruments accurately
detect depression in primary care? A pooled analysis and meta-analysis of 22studies. Br. J. Gen. Pract. 57, 144–151.
Mitchell, A.J., et al., 2008. Acceptability of common screening methods used todetect distress and related mood disorders—preferences of cancer specialistsand non-specialists. Psycho-Oncology 17 (3), 226–236. http://dx.doi.org/10.1002/pon.1228, accessed 25.06.16.
Mitchell, A.J., et al., 2009. Accuracy of specific symptoms in the diagnosis of majordepressive disorder in psychiatric out-patients: data from the MIDAS project.Psychol. Med. 39 (07), 1107 ⟨http://www.journals.cambridge.org/abstract_S0033291708004674⟩, accessed 25.06.16.
Mitchell, A.J., Rao, S., Vaze, A., 2010. Do primary care physicians have particulardifficulty identifying late-life depression? A meta-analysis stratified by age.Psychother. Psychosomat. 79 (5), 285–294. http://dx.doi.org/10.1159/000318295, accessed 25.06.16.
Moher, D., Liberati, A., Tetzlaff, J., Altman, D.G., The PRISMA Group, 2009. Preferredreporting items for systematic reviews and meta-analyses: the PRISMA state-ment. J. Clin. Epidemiol. 62, 1006–1012.
Monahan, P.O., et al., 2009. Validity/reliability of PHQ-9 and PHQ-2 depressionscales among adults living with HIV/AIDS in western Kenya. J. Gen. Int. Med. 24(2), 189–197 ⟨http://www.ncbi.nlm.nih.gov/pubmed/19031037⟩, accessed25.06.16.
Osorio, F., Carvalho, A., Fracalossi, T., Crippa, J., Loureiro, E., 2012. Are two itemssufficient to screen for depression within the hospital context. Int. J. PsychiatryMed. 44, 141–148.
Phelan, E., Williams, B., Meeker, K., Bonn, K., Frederick, J., et al., 2010a. A study ofthe diagnostic accuracy of the PHQ-9 in primary care elderly. BMC Fam. Pract.,11.
Phelan, E., Williams, B., Meeker, K., Bonn, K., Frederick, J., et al., 2010b. A study ofthe diagnostic accuracy of the PHQ-9 in primary care elderly. BMC Fam. Pract.11, 1–9.
Pibernik-Okanović, M. et al., 2009. Screening performance of a short versus longversion of the Patient Health Questionnaire-Depression in outpatients withdiabetes.
Richardson, L.P., McCauley, E., Grossman, D.C., McCarty, C.A., Richards, J., et al., 2010.Evaluation of the patient health questionnaire-9 item for detecting major de-pression among adolescents. Pediatrics 126, 1117–1123.
Richardson, T.M., He, H., Podgorski, C., Tu, X., Conwell, Y., 2010. Screening depres-sion aging services clients. Am. J. Geriatr. Psychiatry 18, 1116–1123.
Rickels, M.R., et al., 2009. Assessment of anxiety and depression in primary care:value of a four-item questionnaire. J. Am. Osteopath. Assoc. 109 (4) 798–219.
Robison, J., et al., 2002. Screening for depression in middle-aged and older puertorican primary care patients. J. Gerontol. Ser A, Biol. Sci. Med. Sci. 57 (5),M308–M314 ⟨http://www.ncbi.nlm.nih.gov/pubmed/11983725⟩, accessed25.06.16.
Rollman, B.L., et al., 2012. A positive 2-item Patient Health Questionnaire depres-sion screen among hospitalized heart failure patients is associated with ele-vated 12-month mortality. J. Card. Fail. 18 (3), 238–245 ⟨http://www.ncbi.nlm.nih.gov/pubmed/22385945⟩, accessed 25.06.16.
Ryan, D.A., et al., 2012. Sensitivity and specificity of the Distress Thermometer and atwo-item depression screen (Patient Health Questionnaire-2) with a “help”question for psychological distress and psychiatric morbidity in patients withadvanced cancer. Psycho-oncology 21 (12), 1275–1284 ⟨http://www.ncbi.nlm.nih.gov/pubmed/21919118⟩, accessed 25.06.16.
Smith, M.V., Gotman, N., Lin, H., Yonkers, K.A., 2010. Do the PHQ-8 and the PHQ-2accurately screen for depressive disorders in a sample of pregnant women?Gen. Hosp. Psychiatry 32, 544–548.
Smolderen, K.G., et al., 2011. Real-World Lessons From the Implementation of aDepression Screening Protocol in Acute Myocardial Infarction Patients: Im-plications for the American Heart Association Depression Screening Advisory.Circ.: Cardiovas. Qual. Outcomes 4 (3), 283–292. http://dx.doi.org/10.1161/CIR-COUTCOMES.110.960013, accessed 25.06.16.
Thapar, A., et al., 2014. Detecting recurrent major depressive disorder within pri-mary care rapidly and reliably using short questionnaire measures. The BritishJ. Gen. Pract.: J. R. Coll. Gen. Pract. 64 (618), e31–e37 ⟨http://www.ncbi.nlm.nih.gov/pubmed/24567580⟩, accessed 25.06.16.
Thombs, B.D., Ziegelstein, R.C., Whooley, M.A., 2008a. Optimizing detection ofmajor depression among patients with coronary artery disease using the pa-tient health questionnaire: data from the heart and soul study. J. Gen. Intern.Med. 23, 2014–2017.
Thombs, B.D., Ziegelstein, R.C., Whooley, M.A., 2008b. Optimizing detection ofmajor depression among patients with coronary artery disease using the pa-tient health questionnaire: data from the heart and soul study. J. Gen. Intern.Med. 23, 2014–2017.
Thombs, B.D., Arthurs, E., El-Baalbaki, G., Meijer, A., Ziegelstein, R.C., et al., 2011.Risk of bias from inclusion of patients who already have diagnosis of or areundergoing treatment for depression in diagnostic accuracy studies ofscreening tools for depression: systematic review. Br. Med. J., 343.
Thombs, B.D., Coyne, J.C., Cuijpers, P., de Jonge, P., Gilbody, S., et al., 2012. Rethinkingrecommendations for screening for depression in primary care. Can. Med. As-soc. J. 184, 413–418.
Tiffin, P.A., 2011. The Patient Health Questionnaire 2-item is a rapid, sensitive andspecific screening tool for identifying adolescents with major depression. Evid.-Based Ment. Health 13 (4). http://dx.doi.org/10.1136/ebmh1110, accessed25.06.16.
Tsai, F.J., Huang, Y.H., Liu, H.C., Huang, K.Y., Liu, S.I., 2014. Patient health ques-tionnaire for school-based depression screening among Chinese adolescents.

L. Manea et al. / Journal of Affective Disorders 203 (2016) 382–395 395
Pediatrics, 133.U.S. Preventive Services Task Force, 2009. Screening for depression in adults: US
preventive services task force recommendation statement. Ann. Intern. Med.151, 784–792.
Wagner, L.I., et al., 2013. Screening for depression in community-based radiationoncology settings: Results from RTOG 0841. ASCO Meeting Abstracts 31(15_suppl), 9527.
Watson, L.C., et al., 2009. Practical depression screening in residential care/assistedliving: five methods compared with gold standard diagnoses. Am. J. GeriatricPsychiatry: Off. J. Am. Assoc. Geriatr. Psychiatry 17 (7), 556–564 ⟨http://www.ncbi.nlm.nih.gov/pubmed/19554670⟩, accessed 25.06.16.
Whiting, P.F., Rutjes, A.W.S., Westwood, M.E., Mallett, S., Deeks, J.J., et al., 2011.QUADAS-2: a revised tool for the quality assessment of diagnostic accuracystudies. Ann. Intern. Med. 155, 529–536.
Williams, L.S., Brizendine, E.J., Plue, L., Bakas, T., Tu, W., et al., 2005. Performance of
the PHQ-9 as a screening tool for depression after stroke. Stroke 36, 635–638.Wittkampf, K.A., Naeije, L., Schene, A.H., Husyer, J., van Weert, H.C., 2007. Diag-
nostic accuracy of the mood module of the patient health questionnaire: asystematic review. Gen. Hosp. Psychiatry 29, 388–395.
Zhang, Y., Ting, R., Lam, M., Lam, J., Nan, H., et al., 2013. Measuring depressivesymptoms using the patient health questionnaire-9 in Hong Kong Chinesesubjects with type 2 diabetes. J. Affect. Disord. 151, 660–666.
Zuithoff, N.P., Vergouwe, Y., King, M., Nazareth, I., van Wezep, M.J., et al., 2010a. Thepatient health questionnaire-9 for detection of major depressive disorder inprimary care: consequences of current thresholds in a crosssectional study.BMC Fam. Pract., 11.
Zuithoff, N.P., Vergouwe, Y., King, M., Nazareth, I., van Wezep, M.J., et al., 2010b. Thepatient health questionnaire-9 for detection of major depressive disorder inprimary care: consequences of current thresholds in a crosssectional study.BMC Fam. Pract. 11, 1–7.