Embed Size (px)
Citation preview

JOURNAL O F
AGRICULTURAL and
FOOD CHEMISTRY
J. Agric. Food Chem. 2003. 57, 6521-6529 6521
Soil Amino Acid Composition Quantified by Acid Hydrolysis
and Anion Chromatography-Pulsed Amperometry
Dean A. Martens* and Kevin L. Loeffelmann
Southwest Watershed Research Center, Agricultural Research Service, U.S. Department of Agriculture,
2000 East Allen Road, Tucson, Arizona 8S719
Soil organic N accounts for 95-98% of the total soil N content with amino acids (AAs) and amino
sugars (ASs) identified as the major soil organic N compounds, but traditional 6 M HCI with reflux or
sealed digestions for 24 h and various detection systems have accounted for only 30-40% of soil
total N content as AA-N. This study compared traditional HCI extraction methodology with
methanesulfonic acid (MSA) hydrolysis and nonderivatized AA and AS quantification by ion
chromatography with pulsed amperometric detection for determination of the AA composition of plant
litter and soils. MSA (4 M) gave AA-N recovery comparable to or better than 6 M HCI for plant AA
digestions (16 h, 121 °C, 104 kPa). Use of 4 M MSA (0.5-1.5 h, 136 °C, 112 kPa) increased the
total recovery of organic N as AAs, ASs, and NH4+ by 46% from soils (n = 22) compared with 6 M
HCI (12 h, 110 °C, reflux) with a MSA recovery rate of 85.6% of the total N content (n = 22 soils).
The shorter MSA soil digestions (0.5-1.5 h) suggested that the majority of soil organic N was not
present as protein forms found in plant litter analysis (16 h of digestion). MSA ion chromatographic
analysis for soil AA/AS composition is a robust nonderivatization method requiring little sample
preparation that can distinguish between small changes in soil AA composition during one growing
season due to vegetation and tillage managements.
KEYWORDS: Soil organic nitrogen; amperometric detection; soybeans; determination; analysis; com;
methanesulfonic acid; ion chromatography
INTRODUCTION
Organic nitrogen (N) is the most important pool of soil N
composing 95—98% of the total N content and is the source of
plant-available mineralized N as NH.»+ and NO3" (/). Consider
able research has been conducted for identification of the
different soil N pools by means of wet-chemical hydrolysis (2).
Identified in soil organic N hydrolysates are amino acids (AAs)
(33-42% of total N content), amino sugars (ASs) (5-7% of
total N content), and NH3 released by hydrolysis (18-32%)
with the remainder as nonhydrolyzed or unidentified N (5).
Fifty-five years after the first published report on soil AA
composition (4), on average, only 50% of the soil organic N
has been identified by current hydrolysis methodology (2).
Recent work reported that AAs are a major component of the
unaccounted pool of soil N (5), confirming that soil AAs are
even more important to the total N content than previously
considered.
Although nearly all of the soil total N content is present as
organic N compounds and the importance of the organic N pool
to the formation of plant-available N has always been assumed,
few studies have been presented to confirm the role of organic
N, specifically the relationship of total soil AA content and
* Author to whom correspondence should be addressed [telephone (520)
670-6380, ext 156; fax (520) 670-5550; e-mail [email protected]].
composition to crop yields. In fact, Schulten and Schnitzer (2)
found little variability in soil AA composition and thus dismissed
the usefulness of soil AA concentration as an indicator of any
biological property. Other authors, Beavis and Mott (6, 7),
reported that small statistical changes were evident in old
Rothamsted experiment soils (1880s) when compared with
recent samples (1980s). Recent research by Mulvaney et al. (8)
and Khan et al. (9) has found that the concentration of the soil
AS fraction was an indicator of soil N responsiveness by
agricultural crops.
One of the major problems for analyzing soil organic N
composition is the lack of standardized hydrolysis procedures
(10). Variables in hydrolytic conditions include (i) type and
concentration of acid, (ii) time and temperature of hydrolysis,
and (iii) ratio of acid to soil and possible soil or hydrolysate
prctreatment. Soil AAs have been identified in water, ether,
alcohol, dilute Ba(OH)2, and HF-HC1 extractions (10,11), but
a total AA-N accounting requires rigorous acid hydrolysis to
break the AA bonds present in polymeric AA compounds such
as peptides or proteins.
The large number of hydrolytic variables also matches the
large number of potential quantification methodologies, each
with their own limitations. The quantification of AAs can
employ manometer methodology for ninhydrin-CO2 work (70),
different steam distillation or microdiffusion techniques for
10.1021/j(034422e This article not subject to U.S. Copyright. Published 2003 by the American Chemical SocietyPublished on Web 09/18/2003

6522 J. Agric. Food Chem., Vol. 51, No. 22. 2003 Martens and Loeffelmann
Table 1. Properties of Plant Biomass Used in This Study
material organic C (g kg"') total N (g kg"1) C/N ratio
Table 2. Properties of Soils Used in This Study1
clover
prairie'
corn
oat
canola
canola protein
soybean
alfalfa
alfalfa protein
464
453
445
433
410
362
397
350
226
44.9
3.70
4.30
17.0
12.8
51.2
10.7
36.0
59.5
10.0
122
103
25.0
32.0
7.08
37.0
10.0
3.80
'Unidentified native grass species.
different N fractions (10,12), colorimetic analysis for total AA
content (10) and total AS content (75), and reverse phase HPLC,
gas chromatography (GC), or ion exchange chromatography (IC)
with pre- or postcolumn derivation for compositional analysis.
Only the HPLC, GC, or IC methodologies can determine the
composition of soil AAs as well as a total AA-N content, but
soil acid hydrolysis extracts also result in dissolution of organic
matter and mineral matter. In addition to organic contamination,
considerable amounts of Si4+, Al3+, and Fe3* are the main cause
of quantification interferences (14), which results in a laborious
cleanup procedure before sample derivation for previously
published HPLC or GC methods (14).
Martens and Frankenberger (15) reported that the use of ion
chromatography coupled with a new method of amperometric
detection (16) showed great potential for the determination of
AAs from plant exudates present in high salt content plant
nutrient solutions. The method was as fast and more sensitive
and robust compared with a ninhydrin derivation method and
involved acid digestion with a nonoxidizing acid, 4 M meth-
anesulfonic acid (MSA), neutralization of excess acidity, and
dilution as the only sample preparation. The use of amperometry
as a detection methodology gave the added advantage of
detecting the ASs as well as the AAs in a single chromatographic
analysis (15). The use of MSA has several advantages over 6
M HC1. First, MSA is nonvolatile and thermally stable at
elevated temperatures; second, it does not oxidize the S-
containing AAs or destroy tryptophan, serine, and threonine;
and, third, the use of MSA results in quantitative recovery of
AA composition found in purified proteins (75,17).
The goals of this work were to compare the use of MSA and
HCI for accounting of biological organic N, to standardize the
conditions for hydrolysis of soil organic N content, and to
identify the composition of soil organic N. The standardized
conditions were then applied to analyzing the importance of
soil organic N composition in a Midwest com (Zea mays)—
soybean (Gfycine max) rotation to soil N cycling.
MATERIALS AND METHODS
Plant and Soil Samples. Properties of the com. soybean, an
unidentified prairie grass, alfalfa (Medicago saliva), oat (Avena saliva),
clover (Trifoium pratense), and canola (Brassica napus), harvested from
overwintered field sites or from glasshouse pots, are listed in Table 1.
The plant samples analyzed were a mix of above-ground leaf and stem
portions (ground through a 1 mm sieve). Selected properties of the 22
soils used are reported in Table 2. Experiments chosen were the long-
term (36 years) continuous com tillage (0—5 cm depth) comparison
(no-tillage, NT; chisel tillage, CT; and plow tillage, PT) plots at Wooster
and Hoytville, OH (18, 19), the long-term (67 years) Baker corn-
soybean (0-15 cm depth) management site. Ames, IA (20), and a
privately managed Clarion—Webster—Nicollet com—soybean (0—15
cm depth) field (Walnut Creek soils) with experiments conducted by
the USDA-ARS National Soil Tilth Laboratory. Ames. IA. The soils
soil
Wooster NT'
Wooster CT
Wooster PT
Hoytville NT
Hoytville CT
Hoytville PT
Walnut Creek'
Clarion 1
Clarion 2
Webster
Harps 1
Harps 2
Canesteo
Baker"
Webster 1
Webster 2
Webster 3
Okoboji
Harps 1
Harps 2
Clarion 1
Clarion 2
Zencori
Zencor2
organic C
(gkg-1)
24.6
14.6
9.78
35.2
21.9
19.4
12.1
20.1
37.2
32.1
33.4
33.6
32.2
19.9
18.7
40.3
42.1
33.4
12.1
20.1
14.2
12.1
total N
(gkg-1)
2.42
1.56
1.12
3.31
2.36
2.16
1.29
1.50
2.40
2.61
2.32
2.50
2.52
1.31
1.43
3.37
3.11
2.32
1.29
1.50
1.10
1.29
C/N
ratio
10.2
9.36
8.73
10.6
9.27
8.98
9.36
13.4
15.6
13.8
14.3
13.4
12.8
15.1
13.1
12.0
13.5
14.4
9.38
13.4
12.9
9.38
PH
6.03
5.63
6.13
6.76
7.05
6.17
4.76
5.33
7.59
7.16
7.61
5.60
6.81
5.42
6.21
6.18
6.47
7.46
7.88
4.99
5.21
7.35
sand
(9 kg"1)
239
248
250
205
205
210
542
440
390
350
320
276
398
513
531
104
186
103
604
579
683
765
day
180
162
150
410
411
400
203
220
270
280
300
351
254
199
161
351
360
433
145
206
147
76.0
'See Materials and Methods for description of analyses used. "Wooster and
HoytvSe continuous com tillage management, no-tilage. NT; chisel tillage, CT;
and plow tfflage, PT.' Cbrion-Ntajflet-Websler Stage management for com was
fal chisel with spring field cultivation and for soybean was spring field cultivation.
'Baker tfflage management for com was fal chisel with spring field cultivation andfor soybean was spring field cultivation.
were composites of three to five samples collected within aim1 area
and stored moist at 4 °C until quickly air-dried and sieved to pass a
1.0 mm screen. The pH was measured in 0.01 M CaCI2 and soil texture
by a pipet method described by Gee and Bauder (27). Total organic C
and total N were determined by dry combustion with a Perkin-Elmer
2400 C/H/N analyzer (Perkin-Elmer, Inc., Fullerton. CA) (Table 1).
Plant Protein Extraction, Total protein N extraction efficiency was
measured by extracting plant tissue with MSA at different time intervals
coupled with ion chromatography with pulsed amperometric detection
of individual AAs (IS). Briefly, 20 mg of plant tissue in screw-top test
tubes (15 x 125 mm) was treated with 2 mL of 4 M MSA, and the
samples were autoclaved for 30,60, or 90 min at 136 °C (112 kPa) or
for 16 h at 121 °C (104 kPa). The HCI-treated (2 mL of 6 M HCI) 20
mg of plant tissue was flame sealed in ampules before digestion for 16
h at 121 °C (104 kPa). Following digestion, the samples were titrated
to pH 4-5 with 5 M KOH and centrifuged to remove precipitate, and
then an aliquot was diluted for analysis. Alfalfa and canola plant residue
proteins were extracted by maceration with a 0.10 M Tris-HCl buffer
(pH 8.0) with reducing agents and protease inhibitors as described by
Gegenheimer (22), precipitated in an ice bath with acetone, and
recovered by centrifugalion.
Soil Organic N Extraction Standardization. To optimize conditions
for soil organic N extraction, soils (100 mg) were treated with 2 mL
of 4 M MSA, and the samples were autoclaved for 30, 60. or 90 min
at 136 °C or for 16 h at 121 "C (104 kPa). After sample cooling,
centrifugation, and collection ofthe supernatant, the residue was washed
with two aliquots of 1 mL of deionized (DI) water and centrifuged
between each addition, and the three supernatanls were combined for
AA analysis. In addition, soil samples (100 mg) were also digested
with 2 mL of 6 M HCI hydrolyzed under reflux at 110 °C for 12 h as
modified from ref 8. All combined supernatant were titrated to pH
4-5 with 5 M KOH and centrifuged to remove precipitate, and then
an aliquot was diluted for analysis. Total organic N recovered from
the plant and soil digestions was calculated as AA-N, AS-N. and NH,*
released by acid digestion. The NH*+ concentration in the digest
supernatant was determined b> steam distillation (23).

Soil Ammo Acid Composition J. Agric. Food Chem.. Vol. 51. No. 22, 2003 GS23
20
35i
Tlmo (mlnutn)
Figure 1. Chromatographic traces of (A) 500 pM amino acid and amino sugar standards and (B) amino adds and amino sugars extracted from oat
tissue. Amino acid and sugar identification: 1 = Arg; 2 = ornithine; 3 = Lys; 4 = galactosanine; 5 = glucosamine; 6 = Ala; 7 = Thn 8 = Gly; 9 =
Val; 10 = Hpro; 11 = Sec 12 = Pro; 13 = tie; 14 = Leu; 15 = Met 16 = His; 17 = Phe; 18 = Glu; 19 = Asp; 20 = Cys?; 21 = Tyr.
Identification of Amino Adds and Amino Sugars. The AAs and
ASs released as hydrolysis products of add digestion were separated
on a Dionex DX-500 (Dionex Corp., Sunnyvale, CA) ion chromato-
graph equipped with a 25 ftL injection loop and an AminoPac PA10
guard and analytical column (250 mm x 2 mm i.d.). Separation was
achieved with a tertiary water. NaOH (5—80 raM), and sodium acetate
(125-200 mM) gradient for AAs and ASs (75). Pulsed amperometric
detection was by a Dionex ED-40 electrochemical detector set in the
integrated pulsed mode with a disposable gold working electrode. Jandik
et al. (24) presented a detailed chapter on the IC gradients and integrated
amperometry detection methods employed here for AA and AS
separation and detection. The AA standards [AA kit (catalog no. LAA-
10) and standard solutions (catalog no. AA-S-18)] were obtained from
Sigma Chemical Co., St. Louis, MO, and were used to map retention
times and detector response. The chromatographic parameters for the
AminoPac column including AA and AS retention times, column
capacity factor, and precision and limits of amperometric detection for
the method described here were given by Martens and Frankenberger
(75).
RESULTS AND DISCUSSION
The plant material chosen represents agricultural crops with
a range in C/N ratios (Table 1). The soils represent long-term
tillage experiments based on two Ohio soils (Wooster and
Hoytville) and two locations in central Iowa that have been
monitored by the USDA-ARS National Soil Tilth Laboratory,
Ames IA, each with typical soils of the area. The combination
of management and landscape position has resulted in a wide
range of soil properties (Table 2).
An advantage to the use of ion chromatography with pulsed
amperometric detection is that the nonderivatized samples can
be selectively analyzed simultaneously for both ASs and AAs
(Figure IA). To acquire the same information would require
two analysis steps with derivatization methodologies. The two
overwintered plant residues, corn and soybean, showed higher
concentrations of the ASs galatosamine and glucosamine
compared to the fresh plant samples and suggested a high level
of microbial activity on plant residue exposed to a soil
environment (Table 3). Comparison between the traditional 6
M HC1 and 4 M MSA found that MSA gave better AA recovery
due to the lack of AA degradation and conversion to non-AA
compounds such as cysteine to cysteic acid. The chromato-
Table 3. Amino Acid (AA) and Amino Sugar (AS) Composition of
Plant Residue Extracted with Methanesulfonic Add (MSA) or HCI*
AA-AS
Arg
Gak
GIux
Ala
Thr
Gly
Val
Hpro
Ser
Pro
He
Leu
His
Phe
Gtu
Asp
Cys,
Tyr
ctover
(mgg-1)
MSA
6.94
100
aoo
044
1.83
3.39
0.33
1.49
1.48
1.18
1.05
1.32
106
1.83
5.03
10.5
10.9
1.08
7.52
HO
5.23
2.85
0.00
0.14
1.53
1.23
0.20
1.23
1.35
0.55
0.86
1.12
1.23
1.65
4.23
9.86
8.65
0.00
5.23
pra
(ing
MSA
3.76
1.02
0.39
0.98
1.13
1.32
0.66
1.00
0.12
0.70
026
0.68
1.44
0.34
079
1.96
1.48
0.18
0.74
He
g-1)
ho
3.56
0.94
012
0.56
0.86
0.87
0.56
0.98
0.12
0.33
0.24
0.45
1.23
024
059
1.78
1.35
0.00
0.34
com
(mgg-1)
MSA
6.51
0.55
0.33
1.54
0.81
0.72
0.26
0.45
0.35
0.29
0.11
0.47
0.79
0.68
084
1.71
1.84
0.15
074
HO
5.56
046
O23
1.23
0.62
0.42
0.16
0.43
0.34
0.12
0.09
0.26
0.46
0.560.82
1.23
1.65
0.00
0.53
oat
(mgg-')
MSA
26.2
2.72
017
0.53
3.83
2.37
2.73
3.62
0.31
2.13
3.01
2.54
4.83
1.52
2.20
152
2.38
0.20
1.34
HCI
23.2
2.45
016
0.51
3.23
1.05
2.54
3.23
0.23
0.79
2.95
2.33
4.23
1.23
2.03
3.24
2.18
0.00
1.12
soybean
(nigg-1)
MSA
4.32
4.28
1.23
2.91
3.80
146
6.70
6.01
1.75
2.40
3.47
4.07
7.75
1.88
2.25
4.49
4.14
0.44
3.72
HO
4.12
3.89
097
2.56
156
1.36
6.43
5.56
1.23
0.98
3.45
3.56
7.23
1.56
2.13
4.23
4.13
0.00
2.98
total AA 62.4 47.1 19.1 15.1 19.3 15.2 67.5 56.7 70.6 59.9
SD 2.31 1.55 3.64 1.66 1.31 0.37 321 1.56 2.12 1.23
% total N» 218 19A S3.3 67.5 93.2 65.3 93.2 81.2 101 78.5
•Methanesulfonic acid (4 M) and HO (6 M) were used to digest the ptam
tissue (16 h, 121 °Q. Gabt, galactosamine; Gtux, glucosamine. * Percentage total
N recovered was determined by summation of AA-, AS-, and NHV-N measured in
the digests (Striding the total N content determined by dry combustion.
graphic method showed that MSA digestions quantitatively
accounted for the total content and composition of the AA-N
(plus NR»+ released) from the different plant materials tested
(Table 3; Figure IB). Several noticeable trends in composition
were the high concentrations of Arg present in the oat material
and the expected high levels of Glu and Asp in the legumes,
clover and soybean. Only the digestion of clover did not result
in quantitative recovery of plant total N as AA-N. The clover
had been grown in the glasshouse and harvested at an early
growth stage, whereas the other legume species, soybean, had
been collected from a farm field following overwintering.

6524 J. Agric. Food Chem., Vol. 51. No. 22, 2003 Martens and Loeffelmann
Table 4. Amino Acid (AA) and Amino Sugar (AS) Composition of
Plant Residue and Plant Proteins Extracted with Melhanesutfonic Acid
(MSA) with Two Digestion Times"
MAS
Arg
LyiGab
Glux
Ala
Thr
GlyVal
Hpto
Ser
Pro
Re
Leu
His
Phe
Glu
Asp
Cys,
Ty>
total AA
SO
% total NJ
canola
(mgg-1)
MSA1
21.5
2.76
0.00
0.00
2.96
1.95
0.90
2.89
1.120.73
0.20
1.54
2.91
1.15
2.S6
4.86
3.E5
0.60
2.61
54.9
2.91
911
MSA2
2.20
0.43
0.00
0.00
0.62
0.33
0.83
0.40
0.130.32
0.30
0.35
0.98
0.22
0.551.06
0.72
0.100.41
9.951.65
14.6
canola •
protein
(mgg-')
MSA1
45.2
15.1
0.00
0.00
9.64
10.5
20.7
22.9
3.22
4.65
4.04
14.3
28.6
6.11
8.61
22.8
15.3
2.52
17.2
251
5.64
66.3
MSA2
4.54
1.95
0.00
0.00
2.16
1.46
3.14
1.70
0.66
0.89
0.71
1.71
4.43
0.99
2.31
4.46
2.76
0.20
1.70
36.1
3.56
11.9
alfalfa(mgg-1)
MSA1
20.4
14.1
0.00
0.73
16.1
9.25
4.32
7.11
1.20
4.23
2.28
6.82
9.50
2.57
7.50
14.1
17.3
0.76
6.50
145
4.3171.7
MSA2
3.14
1.46
0.00
0.00
1.80
0.98
2.76
1.34
0.12
1.05
0.80
1.08
2.53
0.66
1.23
2.80
2.10
0.18
1.00
25.1
3.37
13.5
alfalfaprotein
(mgg-1)
MSA1
32.9
30.0
0.00
0.00
17.3
23.9
31.3
32.3
3.44
a45
7.50
18.4
43.313.6
15.3
35.9
38.8
3.16
25.8
381
a21
94.1
MSA2
5.34
0.95
0.00
0.00
1.96
1.23
1.83
1.23
0.23
0.99
1.36
1.23
3.360.78
1.56
3.75
9.78
0.54
3.52
36.6
4.16
11.2
'Plant material was treated with 2 mL of 4 M MSA and autoclaved for 16 h
(MSA1) at 121 °C (104 kPa) or for 90 nth (MSA2) at 136 °C (112 kPa). Galx,
galactosamine; Glux, glucosamine. * Percentage total N recovered was determined
by summation of AA-, AS-, and NIV-N measured in the digests dividing the total
N content determined by dry combustion.
Crawford et al. (25) reported two different fixed N transport
mechanisms in legume species. The first pathway includes
species such as soybean and clover and involves the export of
fixed N from the nodules as ureides before conversion to
asparagine (Asn) and glutamine (Gin), and the second pathway,
found in alfalfa and peas, involves the transport of Asn and
Gin from the nodules. The lack of clover AA recovery suggests
that the majority of the N content at the early growth stage of
the harvested clover was present as the non-AA ureide
compounds allantoic acid and allantoin (25), whereas in the
mature vegetation (soybean), the total N content was present
as AAs. During acid digestion, Asn and Gin are degraded and
recovered as Asp and Glu.
Proteins have been found to require at least 16-20 h of
autoclave digestion to account for the different strengths of the
N linkages (26). Comparison of a shorter digestion time (l.S
h) with an elevated temperature (136 °C) was made to the
standard 16 h digestion with the 4 M MSA (Table 4) to
determine if the extraction process could be shortened. The
results show that the shorter time was not adequate for release
of the individual amino compounds from plant tissue. The 16 h
MSA hydrolysis conditions were effective for releasing the AA
composition from the plant and the extracted plant proteins. The
failure to completely hydrolyze polymeric AAs with the shorter
digestion time will limit the AA methodology for plant protein
analysis to laboratories equipped with programmable autoclaves
capable of doing the extended digestion times.
No studies have been published that determine optimum
conditions for release of AAs from soil organic matter. The
failure to develop optimum conditions is no doubt due to the
rather poor recovery of only 30—40% of the total soil N as
AAs with wet chemical methods. Until recently, all soil AA
digestions in our laboratory were conducted with a standard 16
h hydrolysis method as employed for the previously described
plant tissue analysis with AA recovery comparable (Table 5;
36.5% recovery, n = 3) to the published HC1 soil AA recovery
(2). Due to an extensive downtime of our laboratory's program
mable autoclave, we investigated the use of shorter times with
higher temperatures for recovery of soil AA-N in a small
tabletop autoclave. Unexpectedly, we found much higher
recoveries of soil AA-N with the shorter times (Table 5) that
were not found with the same experiments with the plant
Table 5. Amino Acid (AA) and Amino Sugar (AS) Composition of Wooster Soils Extracted with Methanestilfonic Acid (MSA) at Different Times andTemperatures (n = 2)*
AA-AS
Arg
LysGatx
Glux
Ala
Thr
Gly
Val
Hpro
Ser
Pro
He
Leu
His
Phe
Glu
Asp
Cys2
Tyr
total AA
SO
% total N*
16 h
0.57
0.24
0.28
0.52
0.17
0.15
0.18
0.18
0.02
0.09
0.06
0.09
0.20
0.08
0.09
0.15
0.07
0.08
0.07
3.20
0.96
31.9
Wooster NT (mg g~')
0.5 h
0.59
0.51
0.79
1.09
0.37
0.27
0.36
1.09
0.09
0.12
0.22
0.08
0.15
0.02
0.05
0.52
0.62
0.08
0.16
7.35
0.65
63.8
1.0 h
0.72
0.55
0.84
1.23
0.51
0.37
0.56
1.72
0.14
0.24
0.20
0.15
0.30
0.02
0.04
0.58
0.62
0.08
0.16
9.10
0.61
78.2
1.5 h
0.75
0.53
0.77
1.19
0.57
0.44
0.63
1.88
0.13
0.23
0.21
0.17
0.33
0.04
0.04
0.52
0.59
0.08
0.15
9.39
2.24
84.6
16 h
0.24
0.11
0.07
0.22
0.17
0.07
0.12
0.10
0.01
0.08
0.05
0.05
an
0.10
0.03
0.14
0.14
0.00
0.01
1.78
0.33
34.0
Wooster CT (mgg-1)
0.5 h
0.39
0.30
0.38
0.65
0.22
0.13
0.21
0.91
0.07
0.14
0.03
0.03
0.06
0.13
0.02
0.29
0.35
0.04
0.08
4.38
0.37
66.5
1.0 h
0.51
0.34
0.41
0.77
0.30
0.22
0.35
1.68
0.07
0.15
0.12
0.08
0.14
0.13
0.03
0.37
0.39
0.04
0.08
6.11
0.70
89.4
1.5 h
0.61
0.36
0.40
0.84
0.34
0.26
0.39
1.99
0.11
0.19
0.20
0.09
0.16
0.13
0.03
0.37
0.42
0.04
0.08
6.85
0.14
92.6
16 h
0.31
0.18
0.12
0.29
0.11
0.07
0.11
0.09
0.01
0.02
0.04
0.05
0.08
0.09
0.01
0.11
0.07
0.01
0.03
1.80
0.18
43.5
Wooster PT (mgg-1)
0.5 h
0.29
0.21
0.25
0.42
0.15
0.08
. 0.14
0.80
0.05
0.05
0.07
0.02
0.03
0.10
0.02
0.23
.027
0.02
0.05
3.21
0.06
69.3
1.0 h
0.33
0.21
0.25
0.46
0.18
0.13
0.23
1.37
0.05
0.06
0.08
0.03
0.05
0.10
0.03
0.26
0.29
0.02
0.05
4.18
0.87
91.6
1.5 h
0.40
0.24
0.25
0.50
0.19
0.15
0.26
0.77
0.01
0.07
0.07
0.05
0.07
0.10
0.02
0.30
0.35
0.03
0.06
3.83
0.09
87.6
• Sote (100 mg) were treated with 2 mL of 4 M MSA and autoclaved for 30. 60. or 90 min at 136 °C or for 16 h at 121 °C (104 kPa). NT. no-tillage; MT, chisel; PT,
plow ullage management. Galx, galactosamine; Glux, glucosamine. * Percentage total N recovered was determined by summation of AA-, AS-, and NrV-N measured inthe digests dividing the total N content determined by dry combustion.

Soil Amino Acid Composition J. Agric. Food Chem., Vol. 51, No. 22, 2003 6525
50O
400
30O
I21
SjO 10J) 25J) 30J) 3B2MJ> 20.0
Tlm» (ralnuttt)
Figure 2. Chromatographic trace of amino acids and sugars extracted from a Wooster soil under no-tillage management with 2 mL of methanesulfonic
acid (1.5 h, 136 °C, 112 kPa). Peak identities are listed in Figure 1.
material (Table 4). The chromatographic result for the 1.5 h/136
°C MSA digestion of a silty loam Wooster soil with IC
separation and amperometric detection is shown in Figure 2.
The AA-N concentration combined with the recovered NH4*
released from the AAs and soils by the shorter acid digestions
accounted for nearly 90% (n = 3) of the total soil N content in
the 1.5 h digestions of the Wooster soils from different tillage
management (Table 5). In comparison, a HC1 digestion from
the Wooster soils averaged 42.3% AA-N (/1 = 3) or a 2-fold
MSA extraction efficiency increase (data not shown).
The decreased digestion time resulted in an increased soil
AA release that was nearly the same for the majority of AA
concentrations recovered, when compared as a ratio of individual
AA to the total AA release, except for Val, which showed nearly
a 5-fold increase with increased digestion time (Figure 3A).
Beavis and Mott (6~) reported using the relative soil AA
concentration (individual AA concentration/total AA concentra
tion) as a "fingerprint" to determine differences in the pattern
of AA distribution relative to a specific soil management. A
similar AA fingerprint pattern was obtained for the majority of
AAs when the AA ratio from the Wooster soil under different
tillage management were compared, even with a 3-fold differ
ence in organic C content (Figure 3B), suggesting that the
sequestration or mineralization of AA concentration in the soils
was uniform for all of the AAs. The work is consistent with
the results of Keeney and Bremner (27), who utilized acid
digestion and steam distillation techniques to first report the
pattern of uniform sequestration or mineralization of soil AAs
in response to soil management pressure.
When AA hydrolysis experiments were expanded to a similar
set of tillage treatments for Hoytville clay loam soils, the results
were different from the results of the silty loam Wooster soil.
The Hoytville soil released the maximum AA-N with the 30
min autoclave hydrolysis (Table 7) compared with maximum
AA-N release from the 1.5 h Wooster digestions (Table 6). The
optimum hydrolysis time of 0.5 h gave an average 81% AA-N
recovery (AA-N + NH4+) versus the average 1.5 h autoclave
hydrolysis time recovery of 64% for the Hoytville soils. The
Hoytville results suggest that reactions of released AAs during
digestion with the soil clay minerals may be partly responsible
for reduced recovery of AAs from soil hydrolysis. The results
from the two soils suggest that a soil standardization test would
be required for maximum recovery of AA-N from soils
11S % 31 § i I 5B1151 § I 5 IAmino add
Rgure 3. Relative amino acid concentrations of (A) the Wooster soil under
no-tillage digested with 4 M methanesulfonic acid at 16 h (121 °C, 104
kPa) or at 0.5.1.0, and 1.5 h (136 °C, 112 kPa) and (B) the different
Wooster tillage managements in comparison with the Hoytville no-tillage.
Galx, galactosamine; Glux, glucosamine.
originating from different parent materials. Application of the
AA fingerprint pattern for the alluvial Hoytville clay loam soil
found similarities to several of the AA concentrations in the
silty loam Wooster soil AA fingerprint pattern (Figure 3B),
but the majority of the Hoytville AA ratios were different from
the ratios from the Wooster soil. The data suggest that the
fingerprint application as proposed (6) may be useful for
6526 J. Agric. Food Chem., Vol. 51, No. 22, 2003 Martens and Loeffelmann
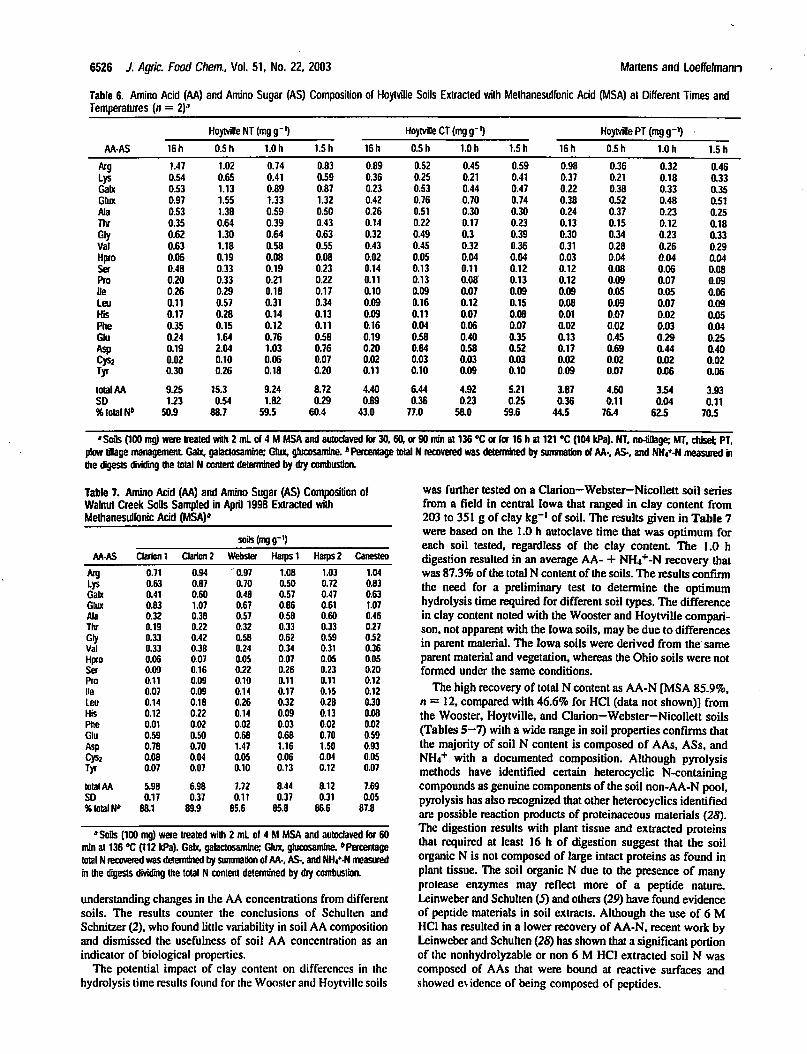
Table 6. Amino Acid (AA) and Amino Sugar (AS) Composition of Hoytville Soils Extracted with Methanesulfonic Acid (MSA) at Different Times and
Temperatures [n = 2)3
Hoytville NT (mg g"1) Hoytville CT(mgg-') Hoytville PT(mgg-')
AA-AS
Arg
Lys
Galx
Glux
Ala
Thr
Gry
Val
Hpro
Ser
Pro
tie
Leu
His
Phe
Gtu
Asp
Cys2
Tvr
total AA
SO
% total N»
16 h
1.47
0.54
0.S3
0.97
0.S3
0.35
0.62
0.63
0.06
0.48
0.20
0.26
0.11
0.17
0.35
0.24
0.19
0.02
0.30
9.25
1.23
50.9
0.5 h
1.02
0.65
1.13
1.55
1.38
0.64
1.30
1.18
0.19
0.33
0.33
0.29
0.57
0.28
0.15
1.64
2.04
0.10
0.26
15.3
0.54
88.7
1.0 h
0.74
0.41
0.89
1.33
0.59
0.39
0.64
0.58
0.08
0.19
0.21
0.18
0.31
0.14
0.12
0.76
1.03
0.06
0.18
9.24
1.82
59.5
1.5 h
0.83
0.59
0.87
1.32
0.50
0.43
0.63
0.55
0.08
0.23
0.22
0.17
0.34
0.13
0.11
0.58
0.76
0.07
0.20
8.72
0.29
60.4
16 h
0.89
0.36
0.23
0.42
0.26
0.14
0.32
0.43
0.02
0.14
0.11
0.10
0.09
0.09
0.16
0.19
0.20
0.02
0.11
4.40
0.89
43.0
0.5 h
0.52
0.25
0.53
0.76
0.51
0.22
0.49
0.45
0.05
0.13
0.13
0.09
0.16
0.11
0.04
0.58
0.84
0.03
0.10
6.44
0.36
77.0
1.0 h
0.45
0.21
0.44
0.70
0.30
0.17
0.3
0.32
0.04
0.11
0.08
0.07
0.12
0.07
0.06
0.40
0.58
0.03
0.09
4.92
0.23
58.0
1.5 h
0.59
0.41
0.47
0.74
0.30
0.23
0.39
0.36
0.04
0.12
0.13
0.09
0.15
0.08
0.07
0.35
0.52
0.03
0.10
5.21
0.25
59.6
16 h
0.98
0.37
0.22
0.38
0.24
0.13
0.30
0.31
0.03
0.12
0.12
0.09
0.08
0.01
0.02
0.13
0.17
0.02
0.09
3.87
0.36
44.5
0.5 h
0.36
0.21
0.38
0.52
0.37
0.15
0.34
0.28
0.04
0.08
0.09
0.05
0.09
0.07
0.02
0.45
0.69
0.02
0.07
4.60
0.11
76.4
1.0 h
0.32
0.18
0.33
0.48
0.23
0.12
0.23
0.26
0.04
0.06
0.07
0.05
0.07
0.02
0.03
0.29
0.44
0.02
0.06
3.54
0.04
62.5
1.5 h
0.46
0.33
0.35
0.51
0.25
0.18
0.33
0.29
0.04
0.08
0.09
0.06
0.09
0.05
0.04
0.25
0.40
0.02
0.06
3.93
0.11
70.5
'SoOs (100 mg) were treated with 2 mL of 4 M MSA and autodaved for 30, 6a or 90 mfn at 136 °C or to 16 h at 121 "C (104 kPa). NT, no-tillage; MT, chisel: PT,
plow tfllage managemaiL Galx, galactosamine; Gtux, gtucosamine. * Percentage total N recovered was determined by summation of AA-, AS-, and NH4+-N measured in
die digests dividing die total N content determined by dry combustion.
Table 7. Amino Acid (AA) and Amino Sugar (AS) Composition of
Walnut Creek Soils Sampled in April 1998 Extracted with
Methanesulfonic Acid (MSA)'
AA-AS
Arg
Lys
Gate
Glux
Ala
Thr
Gly
Val
Hpro
Ser
Pro
He
Leu
His
Phe
Glu
Asp
Cysz
Tvr
total AA
SD
% total N*
Clarion 1
0.71
0.63
0.41
0.83
0.32
0.19
0.33
0.33
0.06
0.09
0.11
0.07
0.14
0.12
0.01
0.59
0.78
0.08
0.07
5.98
0.17
88.1
Clarion 2
0.94
0.87
0.60
1.07
0.38
0.22
0.42
0.38
0.07
0.16
0.09
0.09
0.18
0.22
0.02
0.50
0.70
0.04
0.07
6.98
0.37
89.9
soils (mgg-1)
Webster
0.97
0.70
0.48
0.67
0.57
0.32
0.58
0.24
0.05
0.22
0.10
0.14
0.26
0.14
0.02
0.68
1.47
0.05
0.10
7.72
0.11
85.6
Harps 1
1.08
0.50
0.57
0.66
0.58
0.33
0.62
0.34
0.07
0.26
0.11
0.17
0.32
0.09
0.03
0.68
1.16
0.06
0.13
8.44
0.37
65.8
Harps 2
1.03
0.72
0.47
0.61
0.60
0.33
0.59
0.31
0.0S
0.23
0.11
0.15
0.28
0.13
0.02
0.70
1.50
0.04
0.12
8.12
0.31
86.6
Canesteo
1.04
0.83
0.63
1.07
0.46
0.27
0.52
0.36
0.05
0.20
0.12
0.12
0.30
0.08
0.02
0.59
0.93
0.05
0.07
7.69
0.05
87.8
•Soils (100 mg) were treated with 2 mL of 4 M MSA and autodaved for 60
min at 136 °C (112 kPa). Galx, galactosamine; Glux, glucosamlnc. "Percentage
total N recovered was determined by summation of AA-, AS-, and NH^-N measured
in the digests dividing the total N content determined by dry combustion.
understanding changes in the AA concentrations from different
soils. The results counter the conclusions of Schulten and
Schnitzer (2), who found little variability in soil AA composition
and dismissed the usefulness of soil AA concentration as an
indicator of biological properties.
The potential impact of clay content on differences in the
hydrolysis time results found for the Wooster and Hoytville soils
was further tested on a Clarion—Webster-Nicollett soil series
from a field in central Iowa that ranged in clay content from
203 to 351 g of clay kg"1 of soil. The results given in Table 7
were based on the 1.0 h autoclave time that was optimum for
each soil tested, regardless of the clay content. The 1.0 h
digestion resulted in an average AA- + NH4+-N recovery that
was 87.3% of the total N content of the soils. The results confirm
the need for a preliminary test to determine the optimum
hydrolysis time required for different soil types. The difference
in clay content noted with the Wooster and Hoytville compari
son, not apparent with the Iowa soils, may be due to differences
in parent material. The Iowa soils were derived from the same
parent material and vegetation, whereas the Ohio soils were not
formed under the same conditions.
The high recovery of total N content as AA-N [MSA 85.9%,
n = 12, compared with 46.6% for HC1 (data not shown)] from
the Wooster, Hoytville, and Clarion-Webster-Nicollett soils
(Tables 5-7) with a wide range in soil properties confirms that
the majority of soil N content is composed of AAs, ASs, and
NH4"1" with a documented composition. Although pyrolysis
methods have identified certain heterocyclic N-containing
compounds as genuine components of the soil non-AA-N pool,
pyrolysis has also recognized that other heterocyclics identified
are possible reaction products of proteinaceous materials (28).
The digestion results with plant tissue and extracted proteins
that required at least 16 h of digestion suggest that the soil
organic N is not composed of large intact proteins as found in
plant tissue. The soil organic N due to the presence of many
protease enzymes may reflect more of a peptide nature.
Leinweber and Schulten (5) and others (29) have found evidence
of peptide materials in soil extracts. Although the use of 6 M
HC1 has resulted in a lower recovery of AA-N, recent work by
Leinweber and Schulten (28) has shown that a significant portion
of the nonhydrolyzable or non 6 M HC1 extracted soil N was
composed of AAs that were bound at reactive surfaces and
showed ev idence of being composed of peptides.

Soil Amino Acid Composition J. Agric. Food Chem.. Vol. 51, No. 22, 2003 6527
Table 8. Amino Acid (AA) and Amino Sugar (AS) Composition of Baker Soils Sampled in April 1997 Extracted with Methanesulfontc Acid (MSA)
soils (mg g-')
AA-AS Webster 1 Webster 2 Webster 3 Okoboji Harps 1 Harps 2 Clarion 1 Clarion 2 Zencof 1 Zencor 2
Arg
Lys
Galx
Glux
Ala
Thr
Gry
Val
Hpro
Ser
Pro
lie
Leu
His
Phe
Gtu
Asp
Cysj
T
total AA
% total N»
0.94
0.66
0.65
0.S6
1.09
0.37
0.67
0.26
0.28
0.19
0.10
0.13
0.22
0.16
0.24
0.82
1.45
0.08
0.10
9.66
91.8
0.84
0.61
0.57
0.98
0.85
0.27
0.52
0.21
0.23
0.09
0.07
0.09
0.16
0.09
0.13
0.55
0.82
0.05
0.07
7.48
92.9
0.70
0.65
0.60
0.91
0.96
0.31
0.61
0.23
0.25
0.09
0.10
0.10
0.19
0.14
0.14
0.68
0.79
0.04
0.09
754
86.4
0.97
0.73
0.72
1.17
1.11
0.35
0.65
0.30
0.27
0.12
0.10
0.12
0.22
0.08
0.23
0.85
1.02
0.06
0.10
9.62
78.5
0.83
0.60
0.70
1.02
1.06
0.39
0.53
0.30
0.28
0.13
0.09
0.15
0.26
0.12
0.20
0.57
0.69
0.03
0.10
8.47
78.3
0.78
0.57
0.67
1.03
1.17
0.43
0.60
0.34
0.33
0.15
0.10
0.15
0.28
0.08
0.06
0.78
0.72
0.04
0.11
8.30
63.8
0.32
0.26
0.26
0.43
0.42
0.15
0.28
0.13
0.15
0.04
0.05
0.04
0.09
0.07
0.10
0.48
0.56
0.03
0.06
4.04
87.9
0.35
0.31
0.31
0.61
0.42
0.14
0.26
0.12
0.13
0.06
0.04
0.05
0.08
0.08
0.10
0.41
0.42
0.03
0.04
4.12
96.2
0.64
0.44
0.51
0.85
0.96
0.25
0.37
0.15
0.06
0.12
0.10
0.08
0.14
0.13
0.17
0.58
0.65
0.04
0.07
6.56
87.0
0.30
0.17
0.17
0.27
0.23
0.07
0.15
0.07
0.07
0.03
0.02
0.03
0.06
0.06
0.09
0.25
0.31
0.02
0.03
147
89.3
Spring07 Fall 97 SpHngSS Fall 98 Spring M
Figure 4. Cycling of the total amino acid-N and sugar-N content in the
Baker soils from May 1997 through May 1999. Soybean was grown in
1996 and 1998, and com was grown in 1997.
'Soils (100 mg) were treated with 2 mL of 4 M MSA and atitodaved for 60 min at 136 °C (112 kPa). Gatx, galactosamine; Glux, gkicosamine. * Percentage total N
recovered was determined by summation of AA-, AS-, and NhV-N measured in the digests dividing the total N content determined by dry combustion.
To determine if the proposed methodology was sufficiently
sensitive to determine seasonal changes in soil AA content, a
com—soybean rotation management with the Baker soils was
analyzed in the spring and fall of the 1997 and 1998 growing
seasons (soybean grown in 1996 and 1998, com grown in 1997)
to determine AA- and AS-N before planting and following
harvest. The AA and AS composition and total AA-N as AA,
AS, and NHi+ content from the Baker soils following the
soybean crop (1996 season) sampled in May 1997 are given in
Table 8. The results showed an average N recovery of 90.2%
of total N content from the soils except for the Okoboji and
two Harps soils, which showed an AA-N recovery average of
73.5%. The decrease in AA-N extraction effectiveness by MSA
from the three soils compared with the remaining seven soils
from the field may be due to the periodic flooding of these three
topographically low soils. The three soils are present at the
lowest elevation in the field (30), and the two Harps soils did
not yield a soybean crop in 1996 or 1998 due to spring flooding.
The Okoboji soil also had reduced 1998 soybean yields due to
late spring water ponding. A longer digestion time (16 h) did
not result in additional AA recovery, so the presence of
protein-N did not account for the failure to recover the AA-N
(data not presented). At present few data are available docu
menting the forms of organic N in soils that are subjected to
periodic seasonal flooding, but a hypothesis has been discussed
for abiotic nitrate immobilization (31). For the abiotic N
immobilization to occur, three factors need to be active: first,
Fe or Mn minerals to provide the reduction of NOj"; second,
anaerobic microsites to promote favorable redox conditions; and,
third, abundant DOC for immobilization of N. In the Harps and
Okoboji soils subject to periodic water ponding, all three
conditions would be present for abiotic N immobilization.
The Baker soils were analyzed for the 1997 and 1998 growing
seasons that covered a full cycle in a corn-soybean rotation,
and analyses found an average (n = 6 soils) decrease in AA-N
of 315 kg of N ha"' (±264 kg) during the corn-growing season
(Figure 4). Although the change in soil AA concentration is
graphically masked by the high AA concentration, the 1997 N
decrease was countered with an average (n = 6 soils) N increase
3 ? 5 i | 3 a § SAminoAeM
Figure 5. Relative amino add concentrations of the Baker Webster 1
soil measured from May 1997 through May 1999. Galx, galactosamine;
Glux, glucosamine.
during the soybean-growth year of 340 kg of N ha"1 (±214
kg). Application of the AA fingerprint interpretation suggests
that the majority of the individual AAs from the Baker soils
increase and decrease in the same ratio with the total AA content
as shown for the Wooster soils and first documented by ref 27.
The fingerprint application is shown in Figure 5 for the Webster
1 soil analyzed in May and September of 1997 until May 1999
6528 J. Agric. Food Chem., Vol. 51. No. 22. 2003 Martens and Loeffelmann
4r3.5
f 3
I
i 2
! 1.5i
! 1
0.5
y = -5.0491X2 * 11.124*-2.5016f = 0.69
0.5Amino Acid-N(g kg')
1.5
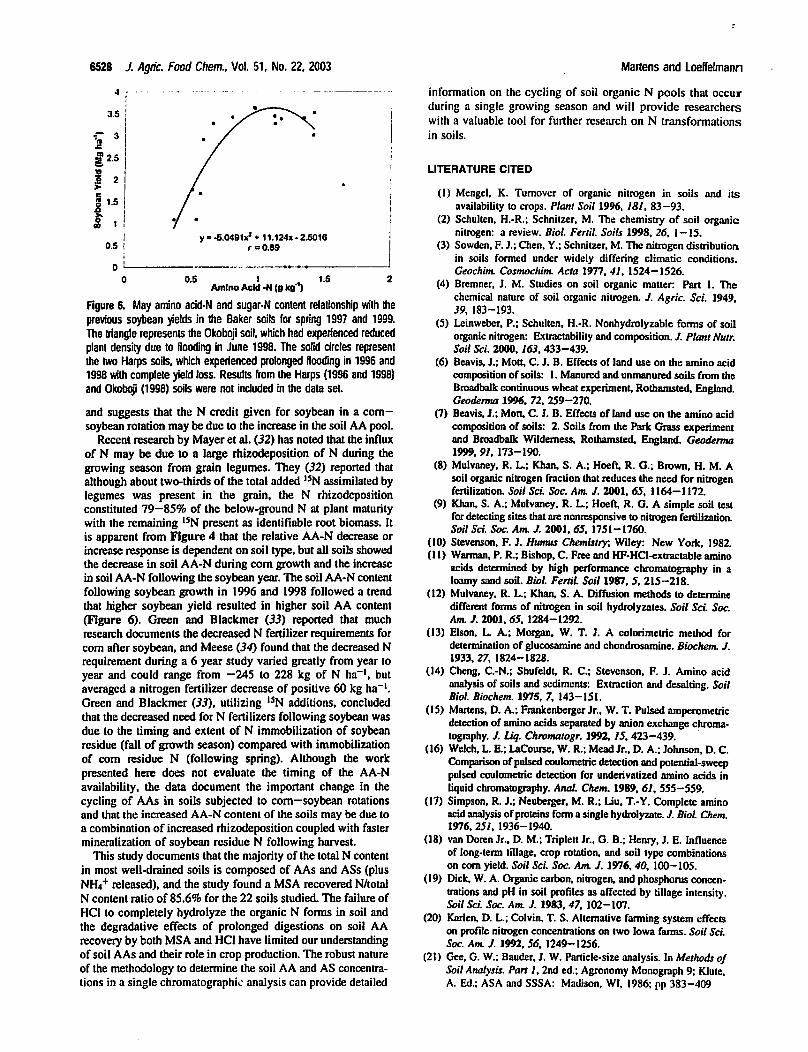
Figure 6. May ammo acid-N and sugar-N content relationship with the
previous soybean yields in the Baker soils for spring 1997 and 1999.
The triangle represents the Okobpji soil, which had experienced reduced
plant density due to flooding in June 1998. The solid circles represent
the two Harps soils, which experienced prolonged flooding in 1996 and
1998 with complete yield loss. Results from the Harps (1996 and 1998)
and Okoboji (1998) soils were not included in the data set.
and suggests that the N credit given for soybean in a corn-
soybean rotation may be due to the increase in the soil AA pool.
Recent research by Mayer et al. (32) has noted that the influx
of N may be due to a large rhizodeposition of N during the
growing season from grain legumes. They (32) reported that
although about two-thirds of the total added 15N assimilated by
legumes was present in the grain, the N rhizodeposition
constituted 79-85% of the below-ground N at plant maturity
with the remaining I5N present as identifiable root biomass. It
is apparent from Figure 4 that the relative AA-N decrease or
increase response is dependent on soil type, but all soils showed
the decrease in soil AA-N during corn growth and the increase
in soil AA-N following the soybean year. The soil AA-N content
following soybean growth in 1996 and 1998 followed a trend
that higher soybean yield resulted in higher soil AA content
(Figure 6). Green and Blackmer (35) reported that much
research documents the decreased N fertilizer requirements for
com after soybean, and Meese (34) found that the decreased N
requirement during a 6 year study varied greatly from year to
year and could range from -245 to 228 kg of N ha"1, but
averaged a nitrogen fertilizer decrease of positive 60 kg ha"1.
Green and Blackmer (33), utilizing I5N additions, concluded
that the decreased need for N fertilizers following soybean was
due to the timing and extent of N immobilization of soybean
residue (fall of growth season) compared with immobilization
of corn residue N (following spring). Although the work
presented here does not evaluate the timing of the AA-N
availability, the data document the important change in the
cycling of AAs in soils subjected to corn-soybean rotations
and that the increased AA-N content of the soils may be due to
a combination of increased rhizodeposition coupled with faster
mineralization of soybean residue N following harvest.
This study documents that the majority of the total N content
in most well-drained soils is composed of AAs and ASs (plus
NH4+ released), and the study found a MSA recovered N/total
N content ratio of 85.6% for the 22 soils studied. The failure of
HC1 to completely hydrolyze the organic N forms in soil and
the degradative effects of prolonged digestions on soil AA
recovery by both MSA and HCI have limited our understanding
of soil AAs and their role in crop production. The robust nature
of the methodology to determine the soil AA and AS concentra
tions in a single chromatographic analysis can provide detailed
information on the cycling of soil organic N pools that occur
during a single growing season and will provide researchers
with a valuable tool for further research on N transformations
in soils.
LITERATURE CITED
(1) Mengel, K. Turnover of organic nitrogen in soils and its
availability to crops. Plant Soil 1996, 181, 83-93.
(2) Schulten, H.-R.; Schnitzer, M. The chemistry of soil organic
nitrogen: a review. Biol. Fertil. Soils 1998, 26, 1-15.
(3) Sowden, F. J.; Chen. Y.; Schnitzer, M. The nitrogen distribution
in soils formed under widely differing climatic conditions.
Geochim. Cosmochim. Ada 1977, 41, 1524-1526.
(4) Bremner, J. M. Studies on soil organic matter Part 1. The
chemical nature of soil organic nitrogen. J. Agric. Set. 1949,
39, 183-193.
(5) Leinweber, P.; Schulten, H.-R. Nonhydrolyzable forms of soil
organic nitrogen: Extractability and composition. /. Plant Nutr.
Soil Sci. 2000.163, 433-439.
(6) Beavis, J.; Mott, C. J. B. Effects of land use on the amino acid
composition of soils: 1. Manured and unmanured soils from the
Broadbalk continuous wheat experiment, Rothamsted, England.
Geoderma 1996, 72. 259-270.
(7) Beavis, J.; Mott. C. J. B. Effects of land use on the amino acid
composition of soils: 2. Soils from the Park Grass experiment
and Broadbalk Wilderness, Rothamsted, England. Geoderma
1999. 91, 173-190.
(8) Mulvaney, R. L.; Khan. S. A.; Hoeft, R. G.; Brown, H. M. A
soil organic nitrogen fraction that reduces the need for nitrogen
fertilization. Soil Sci. Soc. Am. J. 2001, 65, 1164-1172.
(9) Khan, S. A.: Mulvaney. R. L.; Hoeft, R. G. A simple soil test
for detecting sites that are nonresponsive to nitrogen fertilization.
Soil Sci. Soc. Am. J. 2001, 65, 1751-1760.
(10) Stevenson. F. J. Humus Chemistry, Wiley: New York, 1982.
(11) Warman, P. R.; Bishop, C. Free and HF-HCl-extractable amino
acids determined by high performance chromatography in a
loamy sand soil. Biol. Fertil. Soil 1987, 5, 215-218.
(12) Mulvaney. R. L.; Khan, S. A. Diffusion methods to determine
different forms of nitrogen in soil hydrolyzates. Soil Set. Soc.
Am. J. 2001, 65, 1284-1292.
(13) Ebon, L. A.; Morgan, W. T. J. A colorimetric method for
determination of glucosamine and chondrosamine. Biochem. J.
1933,27, 1824-1828.
(14) Cheng, C.-N.; Shufeldt, R. C; Stevenson, F. J. Amino acid
analysis of soils and sediments: Extraction and desalting. Soil
Biol. Biochem. 1975, 7, 143-151.
(15) Martens, D. A.; Frankenberger Jr., W. T. Pulsed amperometric
detection of amino acids separated by anion exchange chroma
tography. J. Uq. Chromatogr. 1992, 75, 423-439.
(16) Welch, L. E.; LaCourse. W. R.; Mead Jr.. D. A.; Johnson. D. C.
Comparison ofpulsed coulometric detection and potential-sweep
pulsed coulometric detection for underivatized amino acids in
liquid chromatography. Anal. Chem. 1989. 61, 555—559.
(17) Simpson, R. J.; Neuberger, M. R.; Liu, T.-Y. Complete amino
acid analysis ofproteins form a single hydrolyzate. J. Biol. Chem.
1976. 25/. 1936-1940.
(18) van Doren Jr., D. M.; Triplett Jr., G. B.; Henry, J. E. Influence
of long-term tillage, crop rotation, and soil type combinations
on com yield. Soil ScL Soc. Am. J. 1976, 40, 100-105.
(19) Dick, W. A. Organic carbon, nitrogen, and phosphorus concen
trations and pH in soil profiles as affected by tillage intensity.
Soil Set. Soc. Am. J. 1983, 47, 102-107.
(20) Karlen, D. L.; Colvin, T. S. Alternative fanning system effects
on profile nitrogen concentrations on two Iowa farms. Soil Sci.
Soc. Am. J. 1992, 56. 1249-1256.
(21) Gee, G. W.; Bauder, J. W. Particle-size analysis. In Methods of
Soil Analysis. Part 1,2nd ed.: Agronomy Monograph 9; Klute,
A. Ed.; ASA and SSSA: Madison, Wl, 1986; pp 383-409

Soil Amino Acid Composition J. Agric. Food Chem., Vol. 51, No. 22. 2003 6529
(22) Cegenheimer, P. Preparation of extracts from plants. In Guide
to Protein Purification; Deutscher, M. P., Ed.; Academic Press:
New York, 1990; Methods in Enzymology Vol. 182, pp 174-
306.
(23) Keeney, D. R.; Nelson, D. W. Nitrogen—Inorganic forms. In
Methods ofSoil Analysis, Part 2, Chemical and Microbiological
Properties; Agronomy Monograph 9; Page, A. L., Miller, R. H.,
Keeney, D. R., Eds.; ASA and SSSA: Madison, WI, 1982; pp
643-698.
(24) Jandik, P.; Pohl, C; Barreto, V.; Avdalovic. N. Anion exchange
chromatography and integrated amperometric detection of amino
acids. In Amino Acid Analysis Protocols; Cooper, C, Packer,
N., Williams, K., Eds.; Humana Press: Totowa, NJ, 2001; pp
63-85.
(25) Crawford, N. M.; Kahn. M. L.; Leustek, T.; Long, S. R. Nitrogen
and sulfur. In Biochemistry and Molecular Biology of Plants;
Buchanan, B. B., et al., Eds.; American Society of Plant
Physiologists: Rockville. MO. 2000; pp 786-815.
(26) Ozols, J. Amino acid analysis. In Guide to Protein Purification;
Deutscher, M. P., Ed.; Academic Press: New York, 1990;
Methods in Enzymology Vol. 182. pp 587-601.
(27) Keeney, D. R.; Bremner, J. M. Effects of cultivation on the
nitrogen distribution in soils. Soil Sci. Soc. Am. Proc. 1964, 28,
653-656.
(28) Leinweber, P.; Schulten, H.-R. Nonhydrolyzable organic nitrogen
in soil size separates from long-term agricultural experiments.
Soil Sci. Soc. Am. J. 1998, 62, 383-393.
(29) Warnian, P. R.; Isnor, R. A. Hydrolysis of low-molecular-weight
soil peptides by immobilized proteases in column and batch
reaction systems. Biol. Fertil. Soils 1990, 9, 335-340.
(30) Colvin, T. S.; Jaynes, D. B.; Karlen, D. L.; Laird, D. A.; Ambuel,
J. R. Yield variability within a central Iowa field. Trans. Am.
Soc. Agric. Big. 1997. 40, 883-889.
(31) Davidson, E. A.; Chorover, J.; Dail. D. B. A mechanism of
abiotic immobilization of nitrate in forest ecosystems: (he ferrous
wheel hypothesis. Global Change Biol. 2003, 9, 228-236,
(32) Mayer, J.; Buegger, F.; Jensen, E. S.; Schloler, M.; Hess, J.
Estimating N rhizodeposition of grain legumes using a I3N in
situ stem labeling method. Soil Biol. Biochem. 2003, 35, 21—
28.
(33) Green, C. J.; Blackmer, A. M. Residue decomposition effects
on nitrogen availability to com following com or soybean. Soil
Sci. Soc. Am. J. 1995. 59, 1065-1070.
(34) Meese, B. G. Nitrogen management for com after com and com
after soybean. Ph.D. dissertation, Iowa State University, Ames,
IA, 1993; Diss. Abstr. 93-2196.
Received for review April 24,2003. Revised manuscript received Angust
6,2003. Accepted August 12,2003. The use of product or trade names
in this publication Is for descriptive purposes only and does not Imply
a guarantee or endorsement by the VS. Department of Agriculture or
the VS. government
JFO34422E