Embed Size (px)
Citation preview
SHOCK TRAIN LENGTH MEASUREMENTS AND IMPROVED CORRELATIONS FOR RECTANGULARDUCTS
ISABE-2015-20231
Jonathan S. Geerts∗, Kenneth H. Yu†
University of Maryland, College Park, MD 20740
AbstractWidely accepted empirical relations for shock train lengths
in constant-area isolators are based on centerline pressuremeasurements. They also do not account for the effect ofaspect ratio or boundary layer asymmetry in non-circular iso-lators. In this paper, new shock train length measurements arereported for rectangular isolators with incoming Mach numbersof up to 2.5 and duct aspect ratios of 3 and 6. Simultaneousvisualization of the shock trains from both the minor- andmajor-axis perspectives revealed the boundary flow separationinitiating from the corners, at a location approximately oneduct height ahead of the ensuing shock trains in the core flow.Incorporating the effects of aspect ratio on boundary layerflow as well as corner flow separation on shock train length,a modified relation for shock train length for rectangularisolators is proposed. The results improved the agreementwith the present data, by reducing the root-mean-squared er-ror of the correlation results by 50% in the case of aspect ratio 6.
Nomenclature
AR aspect ratioD isolator diameterDH hydraulic diameterH isolator height (minor axis)M Mach numberP pressureW isolator width (major axis)Reθ momentum thick. Reynolds numberRMS E root mean square errorS total (psuedo) shock train lengthS t centerline (pseudo) shock train lengthS c corner flow separation lengthT temperatureU flow velocityδ 99% velocity thicknessδ∗ displacement thicknessθ momentum thickness
Subscripts
i current static pressure tapw wall0 stagnation flow parameter1 lower/upper wall parameter2 isolator inlet plane station & side wall parameter3 isolator exit plane station∞ freestream flow parameter
Introduction
A. Background & MotivationDual mode scramjet engines are a prime candidate in the
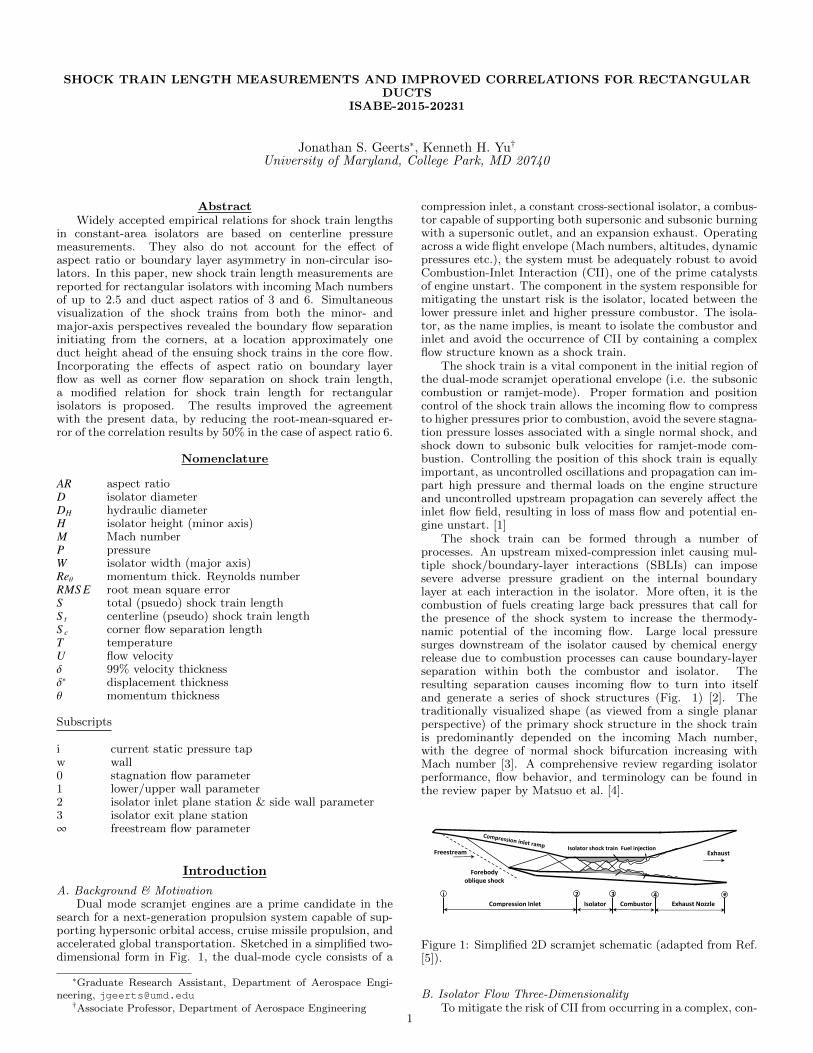
search for a next-generation propulsion system capable of sup-porting hypersonic orbital access, cruise missile propulsion, andaccelerated global transportation. Sketched in a simplified two-dimensional form in Fig. 1, the dual-mode cycle consists of a
∗Graduate Research Assistant, Department of Aerospace Engi-neering, [email protected]
†Associate Professor, Department of Aerospace Engineering
compression inlet, a constant cross-sectional isolator, a combus-tor capable of supporting both supersonic and subsonic burningwith a supersonic outlet, and an expansion exhaust. Operatingacross a wide flight envelope (Mach numbers, altitudes, dynamicpressures etc.), the system must be adequately robust to avoidCombustion-Inlet Interaction (CII), one of the prime catalystsof engine unstart. The component in the system responsible formitigating the unstart risk is the isolator, located between thelower pressure inlet and higher pressure combustor. The isola-tor, as the name implies, is meant to isolate the combustor andinlet and avoid the occurrence of CII by containing a complexflow structure known as a shock train.
The shock train is a vital component in the initial region ofthe dual-mode scramjet operational envelope (i.e. the subsoniccombustion or ramjet-mode). Proper formation and positioncontrol of the shock train allows the incoming flow to compressto higher pressures prior to combustion, avoid the severe stagna-tion pressure losses associated with a single normal shock, andshock down to subsonic bulk velocities for ramjet-mode com-bustion. Controlling the position of this shock train is equallyimportant, as uncontrolled oscillations and propagation can im-part high pressure and thermal loads on the engine structureand uncontrolled upstream propagation can severely affect theinlet flow field, resulting in loss of mass flow and potential en-gine unstart. [1]
The shock train can be formed through a number ofprocesses. An upstream mixed-compression inlet causing mul-tiple shock/boundary-layer interactions (SBLIs) can imposesevere adverse pressure gradient on the internal boundarylayer at each interaction in the isolator. More often, it is thecombustion of fuels creating large back pressures that call forthe presence of the shock system to increase the thermody-namic potential of the incoming flow. Large local pressuresurges downstream of the isolator caused by chemical energyrelease due to combustion processes can cause boundary-layerseparation within both the combustor and isolator. Theresulting separation causes incoming flow to turn into itselfand generate a series of shock structures (Fig. 1) [2]. Thetraditionally visualized shape (as viewed from a single planarperspective) of the primary shock structure in the shock trainis predominantly depended on the incoming Mach number,with the degree of normal shock bifurcation increasing withMach number [3]. A comprehensive review regarding isolatorperformance, flow behavior, and terminology can be found inthe review paper by Matsuo et al. [4].
Isolator Combustor Exhaust Nozzle Compression Inlet
Forebody oblique shock
Isolator shock train Fuel injection Freestream Exhaust
2 3 4 e i
Figure 1: Simplified 2D scramjet schematic (adapted from Ref.[5]).
B. Isolator Flow Three-DimensionalityTo mitigate the risk of CII from occurring in a complex, con-
1

2
fined three-dimensional flowfield, the shock train leading edgestructure must be accurately located. Prior to the implementa-tion of such a shock train control scheme, the isolator must bedesigned long enough to contain the shock train but not exces-sively long in order to avoid excess weight and supersonic dragpenalty. Empirical relations for shock train length are oftenused to initialize the isolator design for certain target incomingflow parameters. To more accurately predict the total lengthof the shock train, as well as improve reliability of shock trainlocation control schemes, the shock train leading edge structurein duct with rectangular cross-section and potentially complexcorner flows must be thoroughly understood.
Traditional analyses use the terms ‘normal’ and ‘oblique’shock trains based on observations of the primary shock trainstructure from a single planar perspective. To further reducethe sense of flow three-dimensionality, conventional visualiza-tion techniques such as schlieren and shadowgraphy integratedisturbances across the entire optical path length. Techniquesoffering the capability to visualize the flowfield at a single ‘plane’ along the optical axis, such as Focusing Schlieren [6, 7] andPlanar Mie- and Rayleigh-Scattering [8, 9], have been success-fully used in compressible flow applications, yet they do notoffer a simultaneous global field of view in three-dimensions asonly one plane (perpendicular to the traditional optical axis) isvisualized at a time.
To address this shortcoming, a novel multiplane shadow-graph technique was employed by the author to visualize theshock train structure simultaneously along the major and mi-nor axis of rectangular isolator ducts with inflow Mach numberof 2.4 and aspect ratios 3 and 6. Detailed discussion of thestructures visualized and accompanying quantitative dynamicpressure measurements along the duct minor axis can be foundin Ref. [10]. This work is referenced often throughout the dis-cussions to follow. A result of the flow visualization technique isshown in Fig. 2 for the aspect ratio 3 case and briefly discussedto introduce the motivation behind thoroughly understandingthe shock train leading edge front. The two perspectives in Fig.2 were acquired simultaneously using the same beam of light,with the XY-plane (top) representing the traditional side-viewperspective of the duct vertical and longitudinal axis, and theXZ-plane (bottom) representing the top-view perspective of theduct lateral and longitudinal axis. Since it is a shadowgraph,the second derivative of density gradient is visualized, charac-terized by the dark and light streaks accompanying each shockstructure (resembling the maximum and minimum bounds ofsecond derivative across the shock front).
The XY-plane shows what appears to be a primary obliqueshock train structure, with upper and lower boundary layer sep-aration (1u, 1l) resulting in a right- and left-running obliqueshock (2u, 2l) intersection (3), which in turn spawns upper andlower refracted shock features (4u, 4l). Interaction of these re-fracted features with the separated boundary layer reflect into acoalesced normal structure (5). The re-acceleration mechanismleading to the secondary normal shock is explained in Ref. [10].The three-dimensionality of the flow features are recognized inthe XZ-plane image which represents the starboard half of thechannel width. Boundary layer separation points (1u, 1l) occurwell before the establishment of shock structure near the center-region (5), as the upper and lower walls oblique shocks originateat X=540mm and 560mm respectively, and the center featureterminates at X=595mm. The opposing family oblique shocks(2u, 2l) are seen traveling inboard, joining at the intersectionpoint (3) at [X,Z]=[580,35]mm. The coalesced refracted struc-ture then makes a second transition (5) at [X,Z]=[595,20]mm.The secondary normal shock is clearly visible (6), with thermo-dynamic differences between the flow behind the primary nor-mal component (5, 5’, 5”) and the primary oblique component(2, 3) causing the secondary normal shock to deflect (6’).
From the snapshot described in Fig. 2 and the detailedflow analysis presented described in Ref. [10], it is clear thatthe Mach 2.4 shock train leading edge front can no longer beidentified as a system of pure oblique shocks or highly bifur-
Centerline
Window
Figure 2: AR 3.0 multiplane shadowgraph. XZ-plane represent-ing the starboard half of the isolator duct. Flow is left to right,dimensions in mm. Detailed description of visualization setupand results analysis can be found in Ref. [10]
cated normal shocks. It is instead a hybrid oblique/normalshock front, one in which corner flow separation precedescenter-flow separation. Accurately predicting the full lengthof the isolator shock train, including the upstream cornerflow separation, is critical in designing an isolator robust andreliable enough to mitigate CII across a wide flight regime.This in turns means that wall-mounted pressure sensors usedto derive empirical relations of shock train length must beoriented along more than just the longitudinal centerline,as the single axis orientation would not capture the preced-ing corner flow separation. The work presented below isa look at introducing a modification to existing empiricalrelations for shock train length that accounts for the stateof the corner boundary layer in a rectangular cross-section duct.
C. Previous WorkFrom early work on ramjet (diffuser) terminal shock posi-
tion sensors for the YF-12 family of aircraft [11, 12] to morerecent development efforts of the Propulsion System Controller(PSC) logic for the X-43A scramjet engine controller [13, 14],pressure measurements inside the internally confined compress-ible inlet/isolator flowfield are used to keep the isolator from op-erating above a certain threshold (i.e. shock train leading edgenot exceeding a certain longitudinal position). This is achievedby either controlling the inlet flowfield (as in the former), or thedownstream combustion dynamics (as in the latter).
Prior to the implementation of such techniques, estimatesof shock train lengths at and off design conditions allow thedesigner to construct an isolator that is long enough to containthe entire shock train (in addition to safety margin), but notexcessively long to avoid unnecessary weight and drag penal-ties. This becomes especially important as the cycle transitionsto scramjet-mode and the shock structure is not a predominantfeature inside the isolator since the entire flow path is super-sonic. The isolator could then be designed as a constant areacombustor with injectors upstream of the isolator inlet planeaccompanied with a step for flame holding [15].
The classic empirical relation for shock train length in axi-symmetric (circular) ducts, presented in Eq. 1 as introduced byWaltrup & Billig in 1973 [16], with the exception of Mach andpressure subscripts matching the station designations in Fig. 1,is widely considered to be the fore-most empirical relation forshock train length estimation.
S t(M22 − 1)Re1/4
Θ
D1/2θ1/2 = 50(P3
P2− 1) + 170(
P3
P2− 1)2 (1)
Through varying the flow parameters including inflow Mach

3
number (M), momentum thickness boundary layer (Reθ), ductdiameter (D), and momentum thickness of the upstream bound-ary layer (θ), it was found that the shock train length for a givenpressure ratio (P3/P2) varies directly with θ1/2D1/2 and inversely
with (M2 − 1)Re1/4θ to form the quadratic expression in Eq. 1. It
is worth noting that the term ‘shock train length’ as used byWaltrup & Billig corresponds to the entire region of pressurerise, which includes the visible shock structure region of theshock train as well as the subsequent mixing region in whichpressure rise continues, albeit at a reduced rate as comparedto the visible shock structure region. This combined region isreferred to as the ‘psuedo shock region’ as summarized in thereview paper by Matsuo et al. [4], wherein the ‘shock train re-gion’ represents the visible shock portion of the pseudo region,and the ‘mixing region’ represents the subsequent region of con-tinued pressure rise. This nomenclature choice is visualized inFig. 3 (adapted from Ref [4]) and subsequently used in thiswork. Thus, pseudo shock train length derived from the classicrelations is referred to as S t, whereas the additional upstreamcorner flow separation length discussed in Fig. 2 is labeled S c.Together, the total shock train length, S, is calculated.
Figure 3: Illustration of pseudo shock train nomenclature(adapted from Ref. [4]). Flow is left to right.
First explicitly written (and referenced) by Sullins & McLaf-ferty [15] through the work of Billig [17], a modification of theoriginal empirical relation for pseudo shock train lengths in ax-isymmetric ducts was put forth for rectangular ducts, and isexpressed in Eq. 2. Of similar form to the original (Eq. 1), therectangular modification included the minor axis duct height(H), as well as a 1/5th power Reθ dependence. Experimentaldata for shock train length in an aspect ratio 2.5 duct with in-flow Mach numbers of 2 and 2.85 and a 1.3 and 2.5mm step (toaccount for the aforementioned scramjet-mode flame holdingcapability) were in good agreement with the modified empiricalrelation set forth in Eq. 2.
S t(M22 − 1)Re1/5
Θ
H1/2θ1/2 = 50(P3
P2− 1) + 170(
P3
P2− 1)2 (2)
The motivation behind proposing an additional modifica-tion for rectangular ducts lies in the fact that Eq. 2 does notaccount for both the minor- and major-axis duct and boundarylayer parameters. Due to the complex three-dimensional cornerflow, it was observed that both entities play a significant role inthe location of the upstream corner separation, which in turn
affects the total pseudo shock train length. To develop suchmodification, experimental data obtained in a Mach 2.4 aspectratio 3 and 6 isolator was compared to both empirical relations(Eq. 1-2), with a modification proposed to account for the ef-fects of both the minor- and major-duct axis boundary layeradding to the total shock train length purely derived from tra-ditional centerline pressure measurements. Furthermore, theeffect of aspect ratio is included through the use of the hy-draulic diameter as the physical duct variable, rather than theminor-axis length scale (duct height) alone.
Length scales of upstream corner separation (with respectto centerline separation) observed from the multiplane shad-owgraph visualization efforts (Fig. 2) are used in lieu of out-board wall static pressure measurements, which are plannedfor upcoming tests. Likewise, boundary layer pitot-probe sur-veys are performed along the centerline representing the minor-axis values of θ and Reθ used in the relations discussed. Out-board and side-wall boundary layer surveys are planned to pro-vide experimentally derived values of duct major-axis boundarylayer parameters. A preliminary parametric study varying theand major-axis boundary layer parameters is presented and dis-cussed.
Technical Approach & Experimental Setup
A. Wind Tunnel Facility & Isolator ModelsThe experimental study was performed in a cold flow, at-
mospheric indraft wind tunnel (volumetric capacity of 53m3)whose test section is shown in Fig. 4a-b. The Method Of Char-acteristics was used to design a Mach 2.5 nozzle contour ofminimum length, producing a supersonic, sharp corner nozzledesign with a flow straightening throat region. This model thuspresents a type of direct-connect facility in that the accelerationto supersonic conditions is achieved by a converging-divergingnozzle, and not by the typical oblique shock compression rampinlet geometry found in flight-worthy vehicles and certain ex-perimental ground test facilities. For reference purposes, thepositive longitudinal x-axis, vertical y-axis, and lateral z-axisare designated in the facility schematic. The origin is locatedat the cross-sectional center of the isolator inlet plane, markedby the location of nozzle wall zero slope change.
Figure 4: Simulated AR 3.0 (a) and 6.0 (b) isolator test model,dimensions normalized with duct height. Flow is left to right.
Two isolator models were tested, with aspect ratios (ARs)of (width/height) 3.0 (Fig. 4a) and 6.0 (Fig. 4b), duct heightsof 50.8 and 25.4mm, length-to-height ratios (L/H) of 13.75 and27.5 to allow proper shock train formation, and tunnel unstarttimes of 33 and 56 seconds respectively. The AR 6.0 is a lowerwall half nozzle extension of the AR 3.0 configuration main-taining the appropriate Mach-Area relationship nozzle throatheight. Principle isolator duct dimensions are also shown foreach aspect ratio. The upper wall is equipped with 16, 0.5mmdiameter centerline static pressure ports spaced 38mm apart,connected to a 16 channel piezoelectric static pressure module(Scanivalve DSA3217) through the means of 1.6mm diameter
4
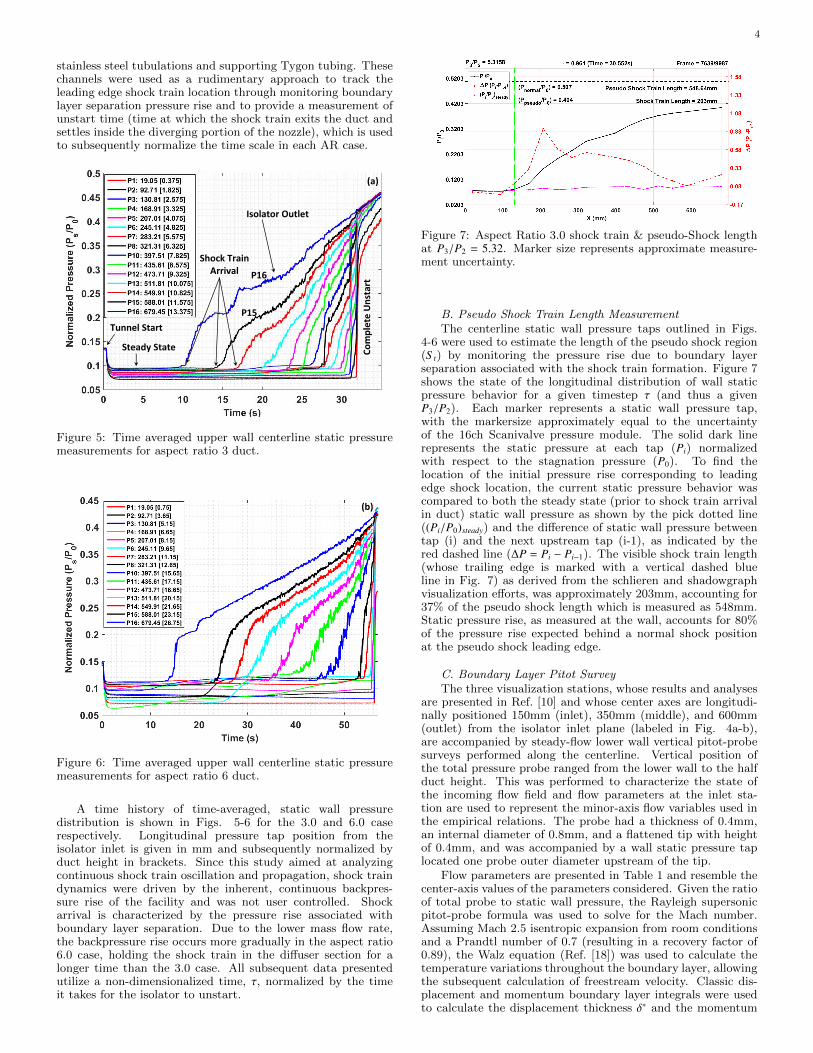
stainless steel tubulations and supporting Tygon tubing. Thesechannels were used as a rudimentary approach to track theleading edge shock train location through monitoring boundarylayer separation pressure rise and to provide a measurement ofunstart time (time at which the shock train exits the duct andsettles inside the diverging portion of the nozzle), which is usedto subsequently normalize the time scale in each AR case.
Tunnel Start
Steady State
Isolator Outlet
Co
mp
lete
Un
star
t
Shock Train Arrival P16
P15
(a)
Figure 5: Time averaged upper wall centerline static pressuremeasurements for aspect ratio 3 duct.
(b)
Figure 6: Time averaged upper wall centerline static pressuremeasurements for aspect ratio 6 duct.
A time history of time-averaged, static wall pressuredistribution is shown in Figs. 5-6 for the 3.0 and 6.0 caserespectively. Longitudinal pressure tap position from theisolator inlet is given in mm and subsequently normalized byduct height in brackets. Since this study aimed at analyzingcontinuous shock train oscillation and propagation, shock traindynamics were driven by the inherent, continuous backpres-sure rise of the facility and was not user controlled. Shockarrival is characterized by the pressure rise associated withboundary layer separation. Due to the lower mass flow rate,the backpressure rise occurs more gradually in the aspect ratio6.0 case, holding the shock train in the diffuser section for alonger time than the 3.0 case. All subsequent data presentedutilize a non-dimensionalized time, τ, normalized by the timeit takes for the isolator to unstart.
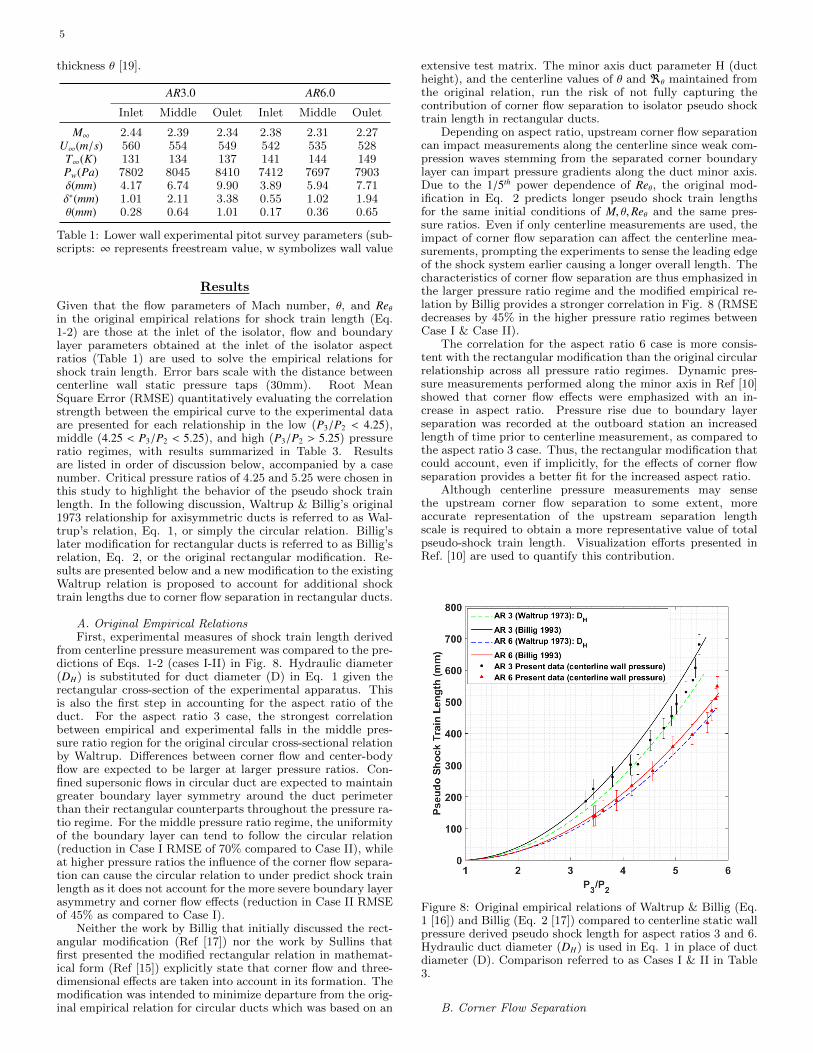
Figure 7: Aspect Ratio 3.0 shock train & pseudo-Shock lengthat P3/P2 = 5.32. Marker size represents approximate measure-ment uncertainty.
B. Pseudo Shock Train Length MeasurementThe centerline static wall pressure taps outlined in Figs.
4-6 were used to estimate the length of the pseudo shock region(S t) by monitoring the pressure rise due to boundary layerseparation associated with the shock train formation. Figure 7shows the state of the longitudinal distribution of wall staticpressure behavior for a given timestep τ (and thus a givenP3/P2). Each marker represents a static wall pressure tap,with the markersize approximately equal to the uncertaintyof the 16ch Scanivalve pressure module. The solid dark linerepresents the static pressure at each tap (Pi) normalizedwith respect to the stagnation pressure (P0). To find thelocation of the initial pressure rise corresponding to leadingedge shock location, the current static pressure behavior wascompared to both the steady state (prior to shock train arrivalin duct) static wall pressure as shown by the pick dotted line((Pi/P0)steady) and the difference of static wall pressure betweentap (i) and the next upstream tap (i-1), as indicated by thered dashed line (∆P = Pi − Pi−1). The visible shock train length(whose trailing edge is marked with a vertical dashed blueline in Fig. 7) as derived from the schlieren and shadowgraphvisualization efforts, was approximately 203mm, accounting for37% of the pseudo shock length which is measured as 548mm.Static pressure rise, as measured at the wall, accounts for 80%of the pressure rise expected behind a normal shock positionat the pseudo shock leading edge.
C. Boundary Layer Pitot SurveyThe three visualization stations, whose results and analyses
are presented in Ref. [10] and whose center axes are longitudi-nally positioned 150mm (inlet), 350mm (middle), and 600mm(outlet) from the isolator inlet plane (labeled in Fig. 4a-b),are accompanied by steady-flow lower wall vertical pitot-probesurveys performed along the centerline. Vertical position ofthe total pressure probe ranged from the lower wall to the halfduct height. This was performed to characterize the state ofthe incoming flow field and flow parameters at the inlet sta-tion are used to represent the minor-axis flow variables used inthe empirical relations. The probe had a thickness of 0.4mm,an internal diameter of 0.8mm, and a flattened tip with heightof 0.4mm, and was accompanied by a wall static pressure taplocated one probe outer diameter upstream of the tip.
Flow parameters are presented in Table 1 and resemble thecenter-axis values of the parameters considered. Given the ratioof total probe to static wall pressure, the Rayleigh supersonicpitot-probe formula was used to solve for the Mach number.Assuming Mach 2.5 isentropic expansion from room conditionsand a Prandtl number of 0.7 (resulting in a recovery factor of0.89), the Walz equation (Ref. [18]) was used to calculate thetemperature variations throughout the boundary layer, allowingthe subsequent calculation of freestream velocity. Classic dis-placement and momentum boundary layer integrals were usedto calculate the displacement thickness δ∗ and the momentum
5
thickness θ [19].
AR3.0 AR6.0
Inlet Middle Oulet Inlet Middle Oulet
M∞ 2.44 2.39 2.34 2.38 2.31 2.27U∞(m/s) 560 554 549 542 535 528
T∞(K) 131 134 137 141 144 149Pw(Pa) 7802 8045 8410 7412 7697 7903δ(mm) 4.17 6.74 9.90 3.89 5.94 7.71δ∗(mm) 1.01 2.11 3.38 0.55 1.02 1.94θ(mm) 0.28 0.64 1.01 0.17 0.36 0.65
Table 1: Lower wall experimental pitot survey parameters (sub-scripts: ∞ represents freestream value, w symbolizes wall value
Results
Given that the flow parameters of Mach number, θ, and Reθin the original empirical relations for shock train length (Eq.1-2) are those at the inlet of the isolator, flow and boundarylayer parameters obtained at the inlet of the isolator aspectratios (Table 1) are used to solve the empirical relations forshock train length. Error bars scale with the distance betweencenterline wall static pressure taps (30mm). Root MeanSquare Error (RMSE) quantitatively evaluating the correlationstrength between the empirical curve to the experimental dataare presented for each relationship in the low (P3/P2 < 4.25),middle (4.25 < P3/P2 < 5.25), and high (P3/P2 > 5.25) pressureratio regimes, with results summarized in Table 3. Resultsare listed in order of discussion below, accompanied by a casenumber. Critical pressure ratios of 4.25 and 5.25 were chosen inthis study to highlight the behavior of the pseudo shock trainlength. In the following discussion, Waltrup & Billig’s original1973 relationship for axisymmetric ducts is referred to as Wal-trup’s relation, Eq. 1, or simply the circular relation. Billig’slater modification for rectangular ducts is referred to as Billig’srelation, Eq. 2, or the original rectangular modification. Re-sults are presented below and a new modification to the existingWaltrup relation is proposed to account for additional shocktrain lengths due to corner flow separation in rectangular ducts.
A. Original Empirical RelationsFirst, experimental measures of shock train length derived
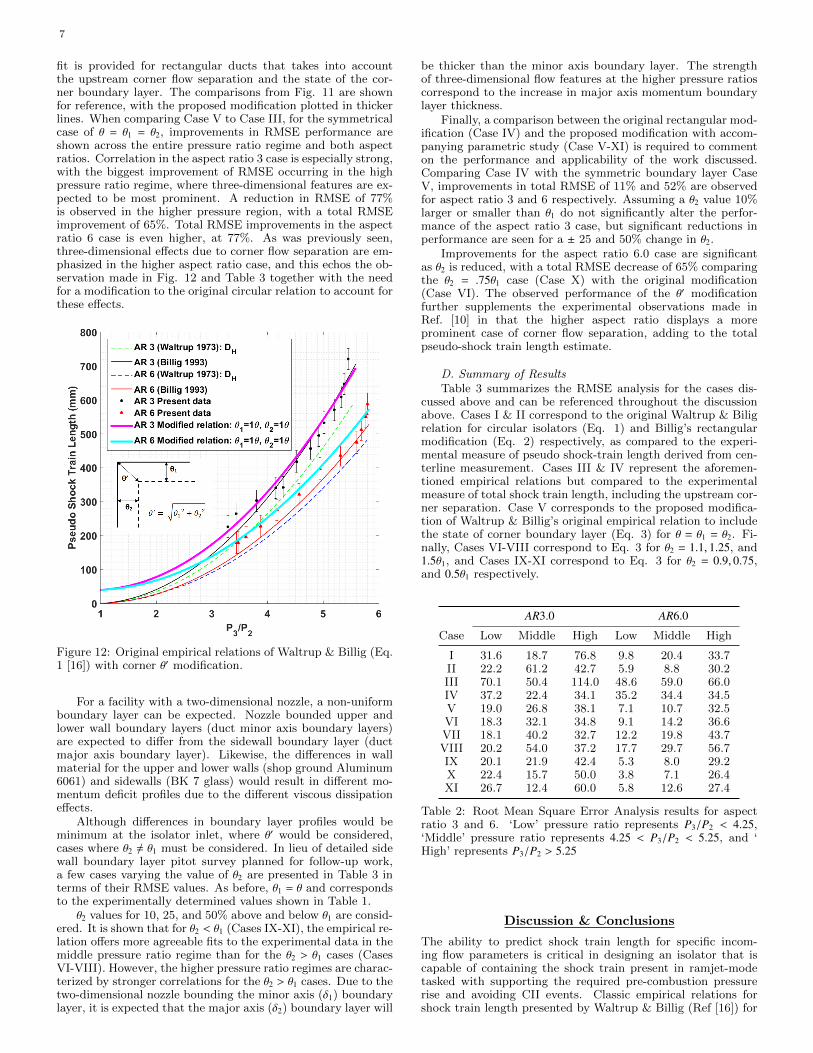
from centerline pressure measurement was compared to the pre-dictions of Eqs. 1-2 (cases I-II) in Fig. 8. Hydraulic diameter(DH) is substituted for duct diameter (D) in Eq. 1 given therectangular cross-section of the experimental apparatus. Thisis also the first step in accounting for the aspect ratio of theduct. For the aspect ratio 3 case, the strongest correlationbetween empirical and experimental falls in the middle pres-sure ratio region for the original circular cross-sectional relationby Waltrup. Differences between corner flow and center-bodyflow are expected to be larger at larger pressure ratios. Con-fined supersonic flows in circular duct are expected to maintaingreater boundary layer symmetry around the duct perimeterthan their rectangular counterparts throughout the pressure ra-tio regime. For the middle pressure ratio regime, the uniformityof the boundary layer can tend to follow the circular relation(reduction in Case I RMSE of 70% compared to Case II), whileat higher pressure ratios the influence of the corner flow separa-tion can cause the circular relation to under predict shock trainlength as it does not account for the more severe boundary layerasymmetry and corner flow effects (reduction in Case II RMSEof 45% as compared to Case I).
Neither the work by Billig that initially discussed the rect-angular modification (Ref [17]) nor the work by Sullins thatfirst presented the modified rectangular relation in mathemat-ical form (Ref [15]) explicitly state that corner flow and three-dimensional effects are taken into account in its formation. Themodification was intended to minimize departure from the orig-inal empirical relation for circular ducts which was based on an
extensive test matrix. The minor axis duct parameter H (ductheight), and the centerline values of θ and <θ maintained fromthe original relation, run the risk of not fully capturing thecontribution of corner flow separation to isolator pseudo shocktrain length in rectangular ducts.
Depending on aspect ratio, upstream corner flow separationcan impact measurements along the centerline since weak com-pression waves stemming from the separated corner boundarylayer can impart pressure gradients along the duct minor axis.Due to the 1/5th power dependence of Reθ, the original mod-ification in Eq. 2 predicts longer pseudo shock train lengthsfor the same initial conditions of M, θ,Reθ and the same pres-sure ratios. Even if only centerline measurements are used, theimpact of corner flow separation can affect the centerline mea-surements, prompting the experiments to sense the leading edgeof the shock system earlier causing a longer overall length. Thecharacteristics of corner flow separation are thus emphasized inthe larger pressure ratio regime and the modified empirical re-lation by Billig provides a stronger correlation in Fig. 8 (RMSEdecreases by 45% in the higher pressure ratio regimes betweenCase I & Case II).
The correlation for the aspect ratio 6 case is more consis-tent with the rectangular modification than the original circularrelationship across all pressure ratio regimes. Dynamic pres-sure measurements performed along the minor axis in Ref [10]showed that corner flow effects were emphasized with an in-crease in aspect ratio. Pressure rise due to boundary layerseparation was recorded at the outboard station an increasedlength of time prior to centerline measurement, as compared tothe aspect ratio 3 case. Thus, the rectangular modification thatcould account, even if implicitly, for the effects of corner flowseparation provides a better fit for the increased aspect ratio.
Although centerline pressure measurements may sensethe upstream corner flow separation to some extent, moreaccurate representation of the upstream separation lengthscale is required to obtain a more representative value of totalpseudo-shock train length. Visualization efforts presented inRef. [10] are used to quantify this contribution.
Figure 8: Original empirical relations of Waltrup & Billig (Eq.1 [16]) and Billig (Eq. 2 [17]) compared to centerline static wallpressure derived pseudo shock length for aspect ratios 3 and 6.Hydraulic duct diameter (DH) is used in Eq. 1 in place of ductdiameter (D). Comparison referred to as Cases I & II in Table3.
B. Corner Flow Separation

6
Visualization of the corner flow separation at the upstreamstation (station 1 in Fig. 4) was used to derive an additional‘corner flow separation’ length (S c). Examples of corner flowseparation in both aspect ratios are shown in Figs. 9-10. It isshown that corner flow separation occurs approximately 40mmahead of the center flow separation, meaning that shock trainlength derived from centerline pressure measurement (S t) wouldbe approximately 40mm less than the full shock train length S(S = S t + S c).
Sc = 188-146mm Sc = 42mm = 0.82H Sc = 42mm = 16.8AR
SC
ST
Figure 9: Upstream visualization of corner flow separation inaspect ratio 3.0 isolator. Flow left to right, dimensions in mm.[10]
Sc = 134-90mm Sc = 44mm = 1.73H Sc = 44mm = 7.3AR
SC
ST
Figure 10: Upstream visualization of corner flow separation inaspect ratio 6.0 isolator. Flow left to right, dimensions in mm.[10]
Full shock train length is plotted against the originalempirical relations in Fig. 11. With the additional cornerlength separation added, Billig’s rectangular modification(Case IV) shows a stronger correlation for the aspect ratio3 case, with an RMSE reduction of 24% across the entirepressure ratio regime compared to the modification withoutS c added (Case II). The largest improvements lies in themiddle pressure area, where RMSE is reduced by 64%. Theaspect ratio 6 case does not respond to the addition of S c asfavorably, with correlation weakening and RMSE increasingby over 200%. The original modified rectangular relation inEq. 2, relying solely on centerline flow parameters, underpredicts the experimental data across the entire pressure ratioregime. This under prediction prompts the introduction of amodification to the existing relations that can account for bothlower and higher aspect ratio behavior and associated flowthree-dimensionality. This modification needs to account forthe aspect ratio of the rectangular duct, as well as the state
of the corner flow boundary layer to account for the upstreamseparation component.
Figure 11: Original empirical relations of Waltrup & Billig (Eq.1 [16]) and Billig (Eq. 2 [17]) compared to total shock trainlength (S t + S c). Hydraulic duct diameter (DH) is used in Eq. 1in place of duct diameter (D). Comparison referred to as CasesIII & IV in Table 3.
C. Corner θ′ ModificationWaltrup’s original empirical relation was derived from cir-
cular cross-section isolator experimental data taken across awide range of conditions. Uniformity of the boundary layeraround the duct inner perimeter (relatively to the expectednon-uniformity in a rectangular duct) reduces the presence ofthree-dimensional features such as those observed in Figs. 9-10. If Waltrup’s original relation is to be used for rectangularisolator work, a modification factor accounting for the state ofthe corner flow must be included. This is accomplished by theinclusion of the minor- and major-axis momentum boundarylayer. The necessity of including the aspect ratio dependencecan be accomplished through the introduction of the hydraulicdiameter (DH) calculated as the ratio of twice the duct perime-ter over the sum of the minor and major axis. Finally, theproven 1/4th power dependence of Reθ is maintained.
The proposed modification is presented in Eq. 3, solved forS (total shock train length). The traditional centerline bound-ary layer θ is replaced by a ‘corner’ θ′, calculated as the diagonalbetween the minor-axis θ (θ1) and the major-axis θ (θ2). Theminor-axis θ1 remains the experimentally obtained θ used inprevious comparisons and listed in Table 1. The nomenclatureis visualized in the insert to Fig. 12 and calculated by taking
the square root of the sum of squares [θ′ =
√θ2
1 + θ22]. The ad-
ditional corner separation length (S c) is added to the relation,resulting in a non-zero shock train length for zero pressure ra-tio. The momentum thickness Reynolds number, Reθ′ is likewisecalculated with respect to θ′.
S =
[50(
P3
P2− 1) + 170(
P3
P2− 1)2
](
√θ′
DH)
DH
(M22 − 1))Re1/4
θ′
+ S c (3)
Fig. 12 represents the case of a symmetrical boundary
layer, where θ1 = θ2 and, since θ = θ1, θ′ =√
2θ (Case V inTable 3). Using an empirical relation for shock train lengthoriginally derived from data obtained in cylindrical ducts, a
7
fit is provided for rectangular ducts that takes into accountthe upstream corner flow separation and the state of the cor-ner boundary layer. The comparisons from Fig. 11 are shownfor reference, with the proposed modification plotted in thickerlines. When comparing Case V to Case III, for the symmetricalcase of θ = θ1 = θ2, improvements in RMSE performance areshown across the entire pressure ratio regime and both aspectratios. Correlation in the aspect ratio 3 case is especially strong,with the biggest improvement of RMSE occurring in the highpressure ratio regime, where three-dimensional features are ex-pected to be most prominent. A reduction in RMSE of 77%is observed in the higher pressure region, with a total RMSEimprovement of 65%. Total RMSE improvements in the aspectratio 6 case is even higher, at 77%. As was previously seen,three-dimensional effects due to corner flow separation are em-phasized in the higher aspect ratio case, and this echos the ob-servation made in Fig. 12 and Table 3 together with the needfor a modification to the original circular relation to account forthese effects.
Figure 12: Original empirical relations of Waltrup & Billig (Eq.1 [16]) with corner θ′ modification.
For a facility with a two-dimensional nozzle, a non-uniformboundary layer can be expected. Nozzle bounded upper andlower wall boundary layers (duct minor axis boundary layers)are expected to differ from the sidewall boundary layer (ductmajor axis boundary layer). Likewise, the differences in wallmaterial for the upper and lower walls (shop ground Aluminum6061) and sidewalls (BK 7 glass) would result in different mo-mentum deficit profiles due to the different viscous dissipationeffects.
Although differences in boundary layer profiles would beminimum at the isolator inlet, where θ′ would be considered,cases where θ2 6= θ1 must be considered. In lieu of detailed sidewall boundary layer pitot survey planned for follow-up work,a few cases varying the value of θ2 are presented in Table 3 interms of their RMSE values. As before, θ1 = θ and correspondsto the experimentally determined values shown in Table 1.
θ2 values for 10, 25, and 50% above and below θ1 are consid-ered. It is shown that for θ2 < θ1 (Cases IX-XI), the empirical re-lation offers more agreeable fits to the experimental data in themiddle pressure ratio regime than for the θ2 > θ1 cases (CasesVI-VIII). However, the higher pressure ratio regimes are charac-terized by stronger correlations for the θ2 > θ1 cases. Due to thetwo-dimensional nozzle bounding the minor axis (δ1) boundarylayer, it is expected that the major axis (δ2) boundary layer will
be thicker than the minor axis boundary layer. The strengthof three-dimensional flow features at the higher pressure ratioscorrespond to the increase in major axis momentum boundarylayer thickness.
Finally, a comparison between the original rectangular mod-ification (Case IV) and the proposed modification with accom-panying parametric study (Case V-XI) is required to commenton the performance and applicability of the work discussed.Comparing Case IV with the symmetric boundary layer CaseV, improvements in total RMSE of 11% and 52% are observedfor aspect ratio 3 and 6 respectively. Assuming a θ2 value 10%larger or smaller than θ1 do not significantly alter the perfor-mance of the aspect ratio 3 case, but significant reductions inperformance are seen for a ± 25 and 50% change in θ2.
Improvements for the aspect ratio 6.0 case are significantas θ2 is reduced, with a total RMSE decrease of 65% comparingthe θ2 = .75θ1 case (Case X) with the original modification(Case VI). The observed performance of the θ′ modificationfurther supplements the experimental observations made inRef. [10] in that the higher aspect ratio displays a moreprominent case of corner flow separation, adding to the totalpseudo-shock train length estimate.
D. Summary of ResultsTable 3 summarizes the RMSE analysis for the cases dis-
cussed above and can be referenced throughout the discussionabove. Cases I & II correspond to the original Waltrup & Biligrelation for circular isolators (Eq. 1) and Billig’s rectangularmodification (Eq. 2) respectively, as compared to the experi-mental measure of pseudo shock-train length derived from cen-terline measurement. Cases III & IV represent the aforemen-tioned empirical relations but compared to the experimentalmeasure of total shock train length, including the upstream cor-ner separation. Case V corresponds to the proposed modifica-tion of Waltrup & Billig’s original empirical relation to includethe state of corner boundary layer (Eq. 3) for θ = θ1 = θ2. Fi-nally, Cases VI-VIII correspond to Eq. 3 for θ2 = 1.1, 1.25, and1.5θ1, and Cases IX-XI correspond to Eq. 3 for θ2 = 0.9, 0.75,and 0.5θ1 respectively.
AR3.0 AR6.0
Case Low Middle High Low Middle High
I 31.6 18.7 76.8 9.8 20.4 33.7II 22.2 61.2 42.7 5.9 8.8 30.2III 70.1 50.4 114.0 48.6 59.0 66.0IV 37.2 22.4 34.1 35.2 34.4 34.5V 19.0 26.8 38.1 7.1 10.7 32.5VI 18.3 32.1 34.8 9.1 14.2 36.6VII 18.1 40.2 32.7 12.2 19.8 43.7VIII 20.2 54.0 37.2 17.7 29.7 56.7IX 20.1 21.9 42.4 5.3 8.0 29.2X 22.4 15.7 50.0 3.8 7.1 26.4XI 26.7 12.4 60.0 5.8 12.6 27.4
Table 2: Root Mean Square Error Analysis results for aspectratio 3 and 6. ‘Low’ pressure ratio represents P3/P2 < 4.25,‘Middle’ pressure ratio represents 4.25 < P3/P2 < 5.25, and ‘High’ represents P3/P2 > 5.25
Discussion & Conclusions
The ability to predict shock train length for specific incom-ing flow parameters is critical in designing an isolator that iscapable of containing the shock train present in ramjet-modetasked with supporting the required pre-combustion pressurerise and avoiding CII events. Classic empirical relations forshock train length presented by Waltrup & Billig (Ref [16]) for
8
AR3.0 AR6.0
Case Low Middle High Low Middle High
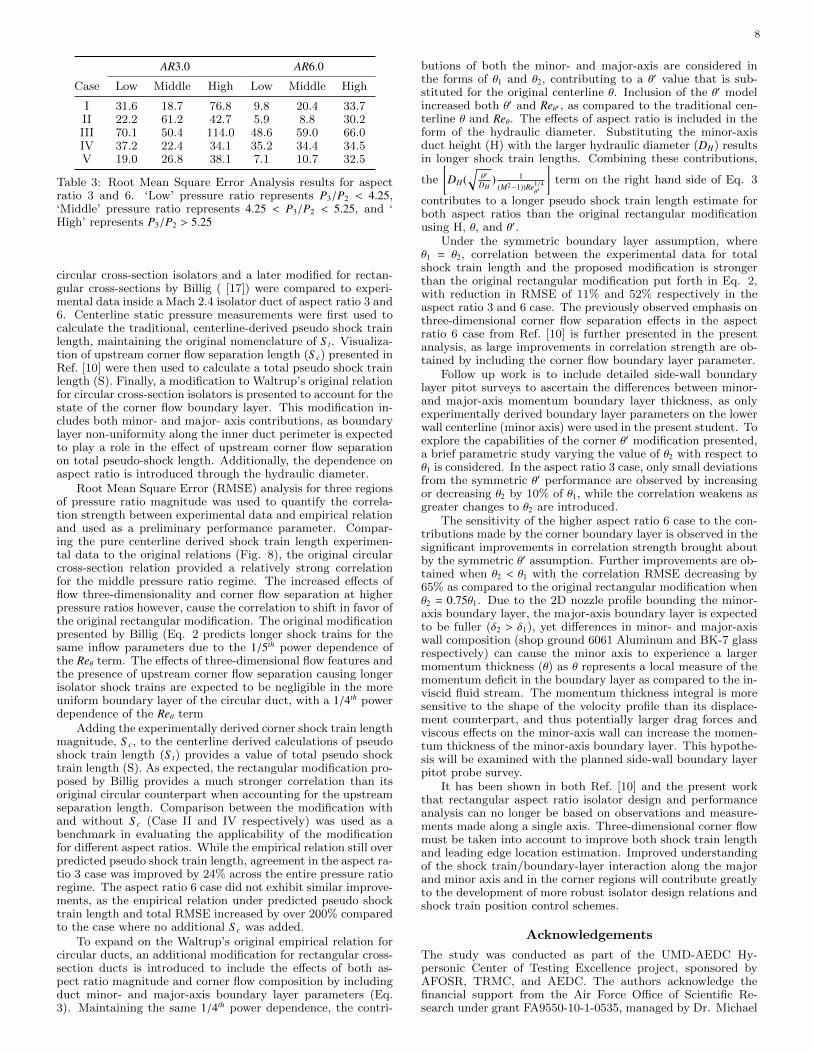
I 31.6 18.7 76.8 9.8 20.4 33.7II 22.2 61.2 42.7 5.9 8.8 30.2III 70.1 50.4 114.0 48.6 59.0 66.0IV 37.2 22.4 34.1 35.2 34.4 34.5V 19.0 26.8 38.1 7.1 10.7 32.5
Table 3: Root Mean Square Error Analysis results for aspectratio 3 and 6. ‘Low’ pressure ratio represents P3/P2 < 4.25,‘Middle’ pressure ratio represents 4.25 < P3/P2 < 5.25, and ‘High’ represents P3/P2 > 5.25
circular cross-section isolators and a later modified for rectan-gular cross-sections by Billig ( [17]) were compared to experi-mental data inside a Mach 2.4 isolator duct of aspect ratio 3 and6. Centerline static pressure measurements were first used tocalculate the traditional, centerline-derived pseudo shock trainlength, maintaining the original nomenclature of S t. Visualiza-tion of upstream corner flow separation length (S c) presented inRef. [10] were then used to calculate a total pseudo shock trainlength (S). Finally, a modification to Waltrup’s original relationfor circular cross-section isolators is presented to account for thestate of the corner flow boundary layer. This modification in-cludes both minor- and major- axis contributions, as boundarylayer non-uniformity along the inner duct perimeter is expectedto play a role in the effect of upstream corner flow separationon total pseudo-shock length. Additionally, the dependence onaspect ratio is introduced through the hydraulic diameter.
Root Mean Square Error (RMSE) analysis for three regionsof pressure ratio magnitude was used to quantify the correla-tion strength between experimental data and empirical relationand used as a preliminary performance parameter. Compar-ing the pure centerline derived shock train length experimen-tal data to the original relations (Fig. 8), the original circularcross-section relation provided a relatively strong correlationfor the middle pressure ratio regime. The increased effects offlow three-dimensionality and corner flow separation at higherpressure ratios however, cause the correlation to shift in favor ofthe original rectangular modification. The original modificationpresented by Billig (Eq. 2 predicts longer shock trains for thesame inflow parameters due to the 1/5th power dependence ofthe Reθ term. The effects of three-dimensional flow features andthe presence of upstream corner flow separation causing longerisolator shock trains are expected to be negligible in the moreuniform boundary layer of the circular duct, with a 1/4th powerdependence of the Reθ term
Adding the experimentally derived corner shock train lengthmagnitude, S c, to the centerline derived calculations of pseudoshock train length (S t) provides a value of total pseudo shocktrain length (S). As expected, the rectangular modification pro-posed by Billig provides a much stronger correlation than itsoriginal circular counterpart when accounting for the upstreamseparation length. Comparison between the modification withand without S c (Case II and IV respectively) was used as abenchmark in evaluating the applicability of the modificationfor different aspect ratios. While the empirical relation still overpredicted pseudo shock train length, agreement in the aspect ra-tio 3 case was improved by 24% across the entire pressure ratioregime. The aspect ratio 6 case did not exhibit similar improve-ments, as the empirical relation under predicted pseudo shocktrain length and total RMSE increased by over 200% comparedto the case where no additional S c was added.
To expand on the Waltrup’s original empirical relation forcircular ducts, an additional modification for rectangular cross-section ducts is introduced to include the effects of both as-pect ratio magnitude and corner flow composition by includingduct minor- and major-axis boundary layer parameters (Eq.3). Maintaining the same 1/4th power dependence, the contri-
butions of both the minor- and major-axis are considered inthe forms of θ1 and θ2, contributing to a θ′ value that is sub-stituted for the original centerline θ. Inclusion of the θ′ modelincreased both θ′ and Reθ′ , as compared to the traditional cen-terline θ and Reθ. The effects of aspect ratio is included in theform of the hydraulic diameter. Substituting the minor-axisduct height (H) with the larger hydraulic diameter (DH) resultsin longer shock train lengths. Combining these contributions,
the
[DH(√
θ′
DH) 1
(M2−1))Re1/4θ′
]term on the right hand side of Eq. 3
contributes to a longer pseudo shock train length estimate forboth aspect ratios than the original rectangular modificationusing H, θ, and θ′.
Under the symmetric boundary layer assumption, whereθ1 = θ2, correlation between the experimental data for totalshock train length and the proposed modification is strongerthan the original rectangular modification put forth in Eq. 2,with reduction in RMSE of 11% and 52% respectively in theaspect ratio 3 and 6 case. The previously observed emphasis onthree-dimensional corner flow separation effects in the aspectratio 6 case from Ref. [10] is further presented in the presentanalysis, as large improvements in correlation strength are ob-tained by including the corner flow boundary layer parameter.
Follow up work is to include detailed side-wall boundarylayer pitot surveys to ascertain the differences between minor-and major-axis momentum boundary layer thickness, as onlyexperimentally derived boundary layer parameters on the lowerwall centerline (minor axis) were used in the present student. Toexplore the capabilities of the corner θ′ modification presented,a brief parametric study varying the value of θ2 with respect toθ1 is considered. In the aspect ratio 3 case, only small deviationsfrom the symmetric θ′ performance are observed by increasingor decreasing θ2 by 10% of θ1, while the correlation weakens asgreater changes to θ2 are introduced.
The sensitivity of the higher aspect ratio 6 case to the con-tributions made by the corner boundary layer is observed in thesignificant improvements in correlation strength brought aboutby the symmetric θ′ assumption. Further improvements are ob-tained when θ2 < θ1 with the correlation RMSE decreasing by65% as compared to the original rectangular modification whenθ2 = 0.75θ1. Due to the 2D nozzle profile bounding the minor-axis boundary layer, the major-axis boundary layer is expectedto be fuller (δ2 > δ1), yet differences in minor- and major-axiswall composition (shop ground 6061 Aluminum and BK-7 glassrespectively) can cause the minor axis to experience a largermomentum thickness (θ) as θ represents a local measure of themomentum deficit in the boundary layer as compared to the in-viscid fluid stream. The momentum thickness integral is moresensitive to the shape of the velocity profile than its displace-ment counterpart, and thus potentially larger drag forces andviscous effects on the minor-axis wall can increase the momen-tum thickness of the minor-axis boundary layer. This hypothe-sis will be examined with the planned side-wall boundary layerpitot probe survey.
It has been shown in both Ref. [10] and the present workthat rectangular aspect ratio isolator design and performanceanalysis can no longer be based on observations and measure-ments made along a single axis. Three-dimensional corner flowmust be taken into account to improve both shock train lengthand leading edge location estimation. Improved understandingof the shock train/boundary-layer interaction along the majorand minor axis and in the corner regions will contribute greatlyto the development of more robust isolator design relations andshock train position control schemes.
Acknowledgements
The study was conducted as part of the UMD-AEDC Hy-personic Center of Testing Excellence project, sponsored byAFOSR, TRMC, and AEDC. The authors acknowledge thefinancial support from the Air Force Office of Scientific Re-search under grant FA9550-10-1-0535, managed by Dr. Michael

9
Kendra. The authors also acknowledge the valuable technicalsupport received from Dr. Allen Winkelmann of the Universityof Maryland and Mike Smith and Dr. Eric Marineau of theAEDC Hypervelocity Wind Tunnel 9.
References
[1] Heiser, W. H. and Pratt, D. T., Hypersonic airbreathing propul-sion, Aiaa, 1994.
[2] WALTRUP, P. and BILLIG, F., “Precombustion shock struc-ture in scramjet engines,” 8th Joint Propulsion Specialist Con-ference, 1972, p. 1181.
[3] Carroll, B. F. and Dutton, J. C., “Characteristics of multipleshock wave/turbulent boundary-layer interactions in rectangularducts,” Journal of Propulsion and Power , Vol. 6, No. 2, 1990,pp. 186–193.
[4] Matsuo, K., Miyazato, Y., and Kim, H.-D., “Shock train andpseudo-shock phenomena in internal gas flows,” Progress inAerospace Sciences, Vol. 35, No. 1, 1999, pp. 33–100.
[5] Smart, M. K., “Scramjet isolators,” Tech. rep., DTIC Document,2010.
[6] Weinstein, L. M., “Large-field high-brightness focusing schlierensystem,” AIAA journal , Vol. 31, No. 7, 1993, pp. 1250–1255.
[7] VanDercreek, C. P., Smith, M. S., and Yu, K. H., “Focusedschlieren and deflectometry at AEDC hypervelocity wind tunnelNo. 9,” AIAA Paper , Vol. 4209, 2010.
[8] Clemens, N. and Mungal, M., “A planar Mie scattering tech-nique for visualizing supersonic mixing flows,” Experiments influids, Vol. 11, No. 2-3, 1991, pp. 175–185.
[9] Ma, M., “The influence of boundary layers on supersonic inletunstart,” 2011.
[10] Geerts, J. and Yu, K., “Corner Flow Separation from ShockTrain/Turbulent Boundary-Layer Interactions in RectangularIsolators,” 20th AIAA International Space Planes and Hyper-sonics Systems and Technologies Conference, 2015.
[11] Dustin, M. O., Cole, G. L., and Wallhagen, R. E., “Determina-tion of normal-shock position in a mixed compression supersonicinlet,” 1971.
[12] Dustin, M. O., Cole, G. L., and Neiner, G. H., “Continuous-output terminal-shock-position sensor for mixed-compression in-lets evaluated in wind tunnel tests of YF-12 aircraft inlet,” 1974.
[13] Jones, T. P. and Baumann, E., “Evaluation of the X-43A scram-jet engine controller performance by Monte Carlo technique,”EVALUATION , Vol. 20, 2003, pp. 23.
[14] Huebner, L. D., Rock, K. E., Ruf, E. G., Witte, D. W., andAndrews, E. H., “Hyper-X flight engine ground testing for flightrisk reduction,” Journal of spacecraft and rockets, Vol. 38, No. 6,2001, pp. 844–852.
[15] Sullins, G. and McLafferty, G., “Experimental results of shocktrains in rectangular ducts,” AIAA paper , Vol. 5103, 1992.
[16] Waltrup, P. and Billig, F., “Structure of shock waves in cylindri-cal ducts,” AIAA journal , Vol. 11, No. 10, 1973, pp. 1404–1408.
[17] Billig, F. S., “Research on supersonic combustion,” Journal ofPropulsion and Power , Vol. 9, No. 4, 1993, pp. 499–514.
[18] Smits, A. J. and Dussauge, J.-P., Turbulent shear layers in su-personic flow , Springer Science & Business Media, 2006.
[19] Schetz, J. A. and Bowersox, R. D., Boundary layer analysis,American Institute of Aeronautics and Aeronautics, 2010.