Embed Size (px)
Citation preview

Jonathan G. WYNN University of South Florida Geology
USGS-St. Petersburg, FL: Lisa Robbins, Paul Knorr, John Lisle, Kim Yates USF College of Marine Science: Bob Byrne, Xuewe Liu USF-Geology: Bogdan Onac, Paul Knorr LDEO, Columbia Univ.: Taro Takahashi Bedford Inst. Ocean.: Kumiko Azetsu-Scott

§ Establish baseline for pH, pCO2, carbon flux rate and carbonate mineral saturation state ΩCaCO3-min =([Ca2+][CO3
2-]) / ksp-min
§ Compare chemical data (pH and saturation state) to previous work (very sparse prior to 2000’s; Yamamoto-Kawai et al., 2009 documented low Ωaragonite values during 2007 sea ice minimum)
§ Explore mechanisms for change in pH, saturation state
§ Provide basis for mechanistic predictive capability

§ Equilbration with atmospheric CO2
§ Warming/cooling § Reduction of ice cover
- Dissolution additional of CO2 § River run-off or direct
snow/rainfall § Multi-year Ice melt-
§ Dilution of alkalinity

• Previously 19,000 carbon records/ stations above the Arctic Circle
• In the last 3 yrs HLY ECS cruises provided over 31,000 more surface records in Canada and Makarov Basins
• + 25 vertical casts

National Snow and Ice Data Center, Boulder, CO.
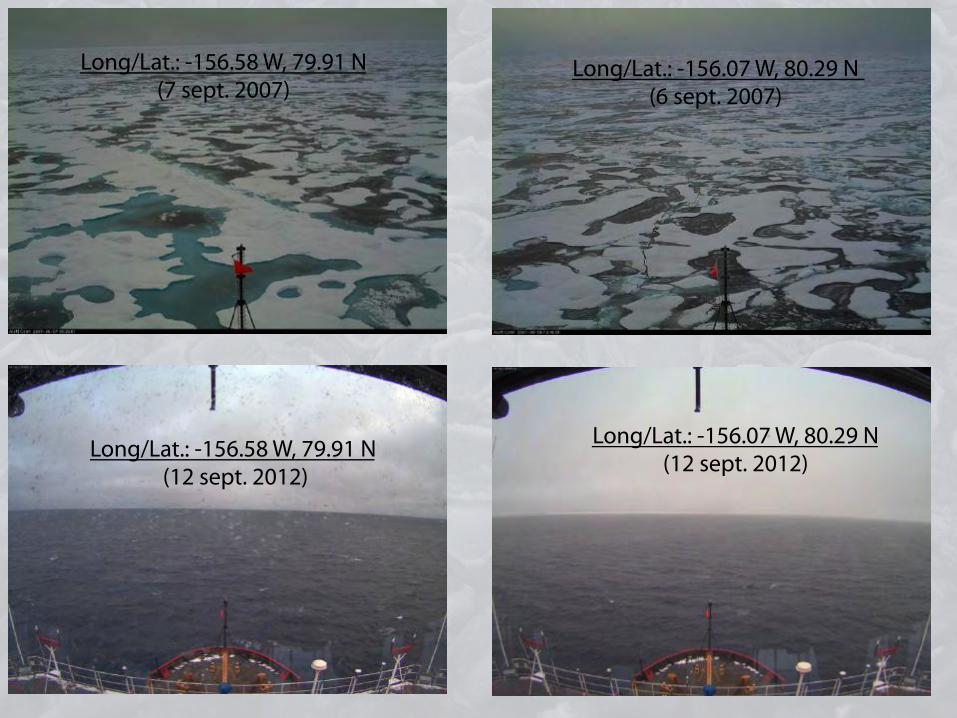
Long/Lat.: -156.58 W, 79.91 N (7 sept. 2007)
Long/Lat.: -156.58 W, 79.91 N (12 sept. 2012)
Long/Lat.: -156.07 W, 80.29 N (6 sept. 2007)
Long/Lat.: -156.07 W, 80.29 N (12 sept. 2012)
2012 Nov 30 08:24:49
180˚
!160˚ !140˚
!120˚
70˚ 70˚
80˚ 80˚
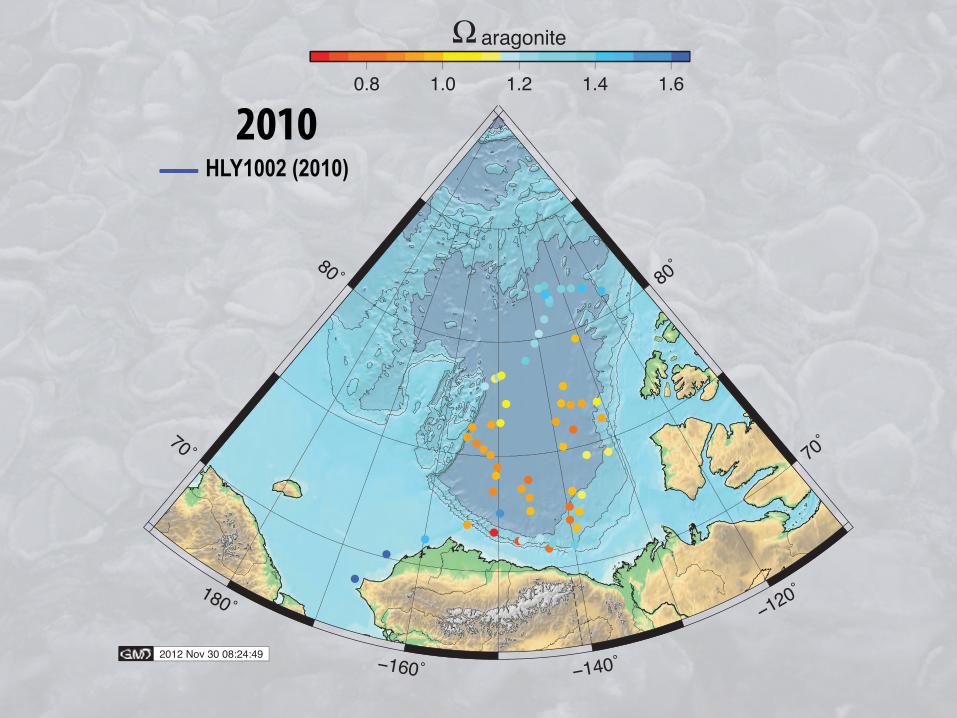
0.8 1.0 1.2 1.4 1.6
aragonite!
HLY1002 (2010)2010

2012 Nov 30 08:24:49
180˚
!160˚ !140˚
!120˚
70˚ 70˚
80˚ 80˚
0.8 1.0 1.2 1.4 1.6
aragonite!
HLY1002 (2010)2010

2012 Nov 30 08:24:49
180˚
!160˚ !140˚
!120˚
70˚ 70˚
80˚ 80˚
0.8 1.0 1.2 1.4 1.6
aragonite!
HLY1002 (2010)HLY1102 (2011)
2011

2012 Nov 30 08:24:49
180˚
!160˚ !140˚
!120˚
70˚ 70˚
80˚ 80˚
0.8 1.0 1.2 1.4 1.6
aragonite!
HLY1002 (2010)HLY1102 (2011)HLY1202 (2012)
2012

2010

2011

2012

Underlay shows mean ice coverage during month of cruise
2011
2010
2012

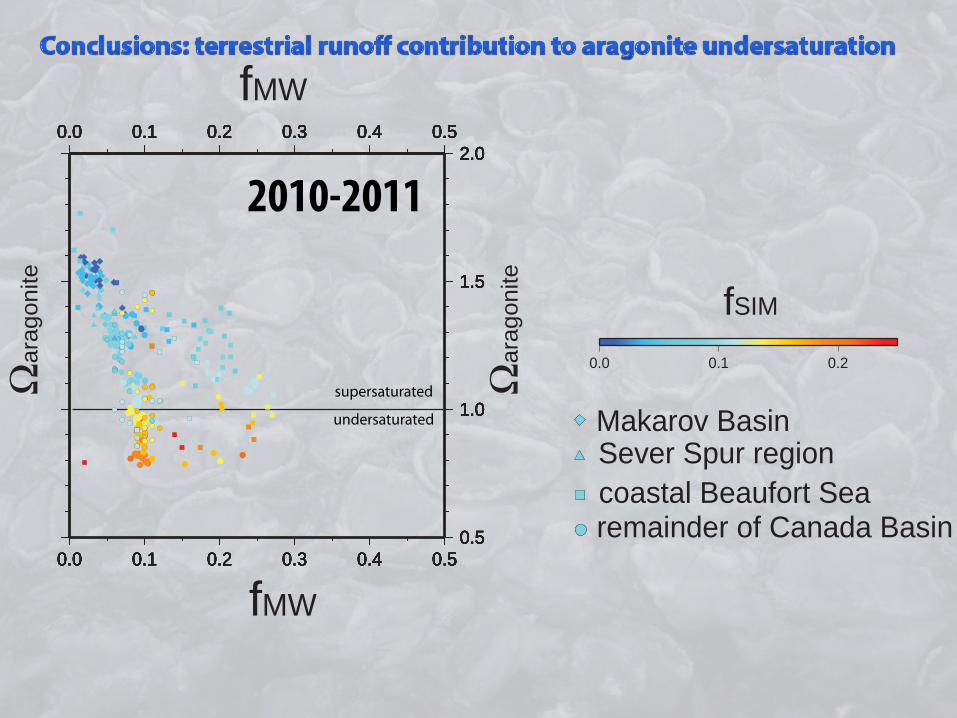
• Over 20% of Canadian Basin is undersaturated wrt aragonite • Saturation state is largely due to ice melt (with biological activity and overprint of pCO2)
• 2012 data show migration northward of the changes in carbonate chemistry • Data can be used to refine global models of ocean acidification and timing when surface
water will become undersaturated
Underlay shows mean ice coverage during month of cruise
2010 2011 2012
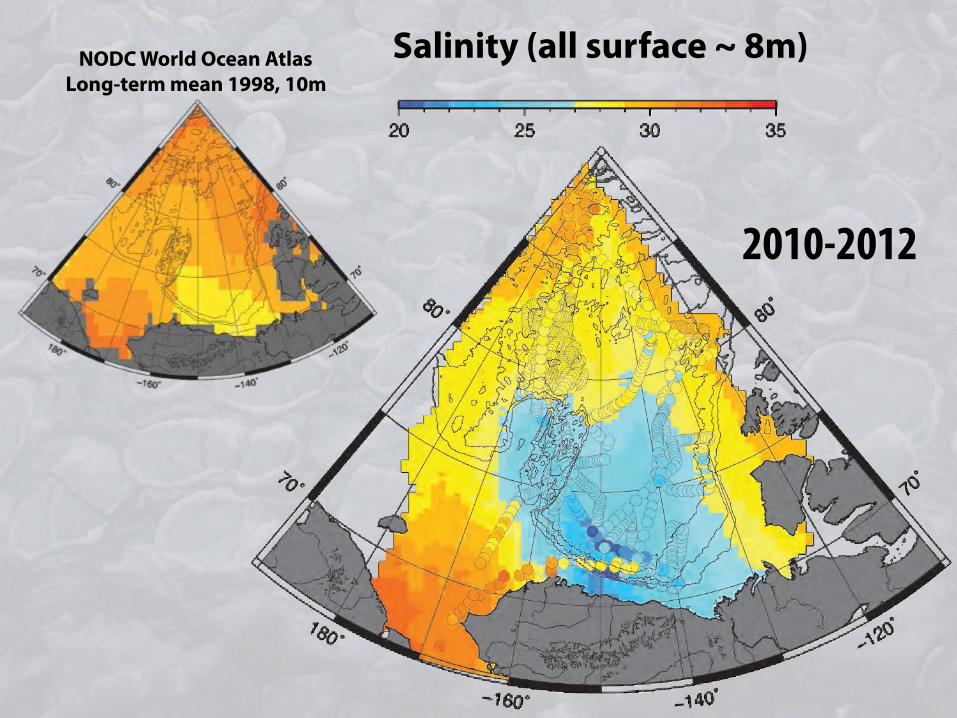
Salinity (all surface ~ 8m) NODC World Ocean Atlas Long-term mean 1998, 10m
2010-2012

Giles et al., Nature Geoscience, 2012
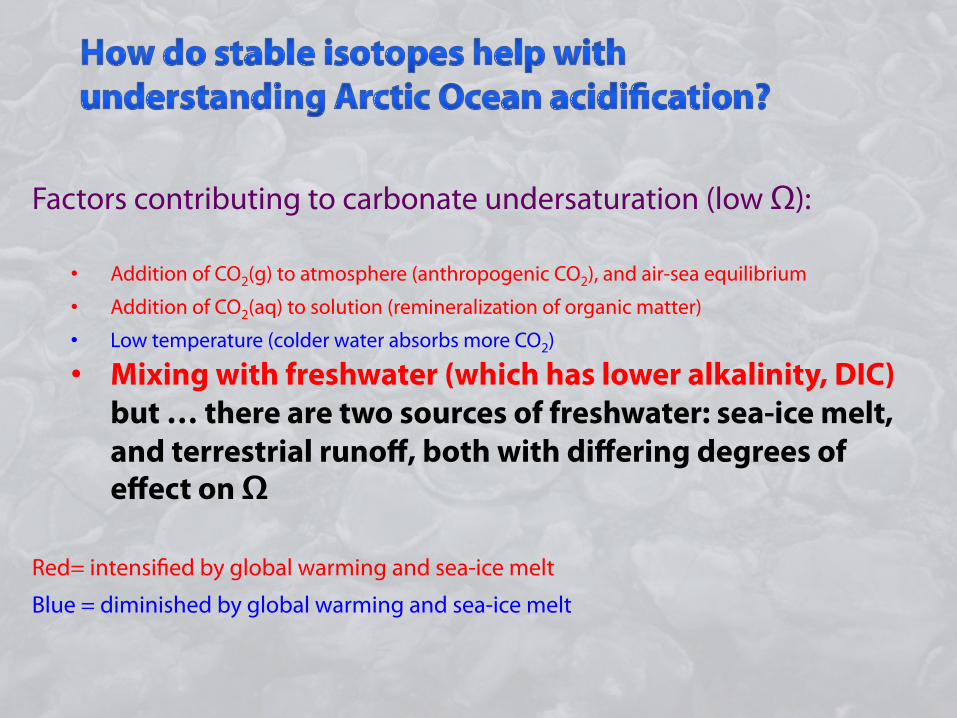
Factors contributing to carbonate undersaturation (low Ω):
• Addition of CO2(g) to atmosphere (anthropogenic CO2), and air-sea equilibrium • Addition of CO2(aq) to solution (remineralization of organic matter) • Low temperature (colder water absorbs more CO2)
• Mixing with freshwater (which has lower alkalinity, DIC) but … there are two sources of freshwater: sea-ice melt, and terrestrial runoff, both with differing degrees of effect on Ω
Red= intensified by global warming and sea-ice melt Blue = diminished by global warming and sea-ice melt

H216O: where 16O is ~99.8% of all oxygen on Earth
H218O: where 18O is ~0.2% of all oxygen on Earth
Natural abundance of the two isotopologues is expressed as a delta value, which describes small deviation in the ratio of 18O/16O from a standard:
16O H H
18O H H
δ 18O =
18O16O( )
SAMPLE18O
16O( )STANDARD(e.g.,SMOW )
−1⎡
⎣
⎢⎢⎢
⎤
⎦
⎥⎥⎥×1000‰
A difference of 20 delta-units ( between δ18O of 0 and –20‰) is: δ18O 18O/16O atomic mass 0‰ 0.0019651 15.99884 –20‰ 0.0020052 15.99892
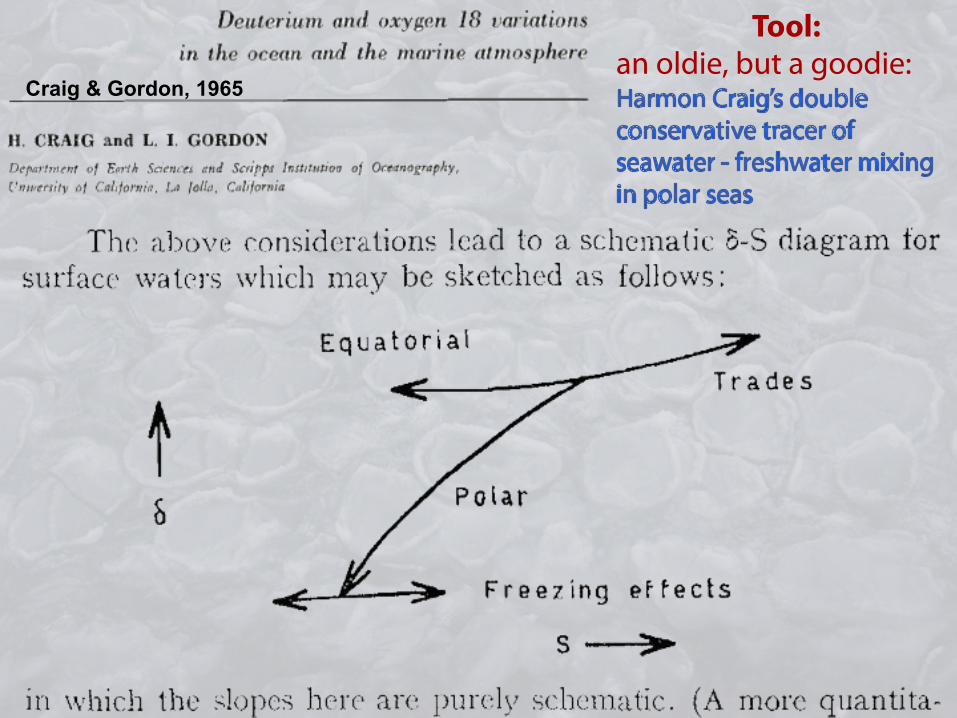
Tool: an oldie, but a goodie:
Craig & Gordon, 1965

-160
-140
-120
-100
-80
-60
-40
-20
0
-22 -18 -14 -10 -2 2!18O
!D
-26
-200
-180
-220
Spaten Optimator, Munich, Germany
FDO Scratch Amber Lager, Frederick, MD
Home Brew, Tampa, FL
DogFish Head Palo Santo Marron, Milton, DEFosters Premium Ale, Albany, GA
Welch's Sparkling Grape
Yuengling Lager, Tampa, FL?
Steelhead Extra Stout, Blue Lake, CA
Newcastle Brown Ale, Tadcaster, England
Moose Druel Brown Ale,Missoula, MT
Okocim Premium Lager, Warszawa, Poland
Great Divide Fresh Hops, Denver, CO
Great Divide Hibernation Ale, Denver, CO
Grand Teton Bitch Creek, Victor, ID
Great Divide Samurai, Denver, CO
Heinekin Dark Lager,Zoeterwoude, Netherlands
Paulaner Lager, Munich, Germany
Samuel Smiths Nut Brown AleTadcaster, England
Zywiec Lager, Zywiec, Poland
North Coast Brewery Dry StoutFort Bragg, CA
Golden Pheasant Lager, Burbanovo, Slovakia
Ambo, Ethiopia
Italy
Covasna, Romania
Izvor Tosorog, Romania Poiana Vinullui, Romania
Parma, Italy
Eifel, Germany
Harghita, Romania
Denmark
Lipova, Romania
Parma, Italy
Vergeze, France
Poiana Negri, Romania
Covasna, Romania
San Pellegrino, Italy Piacenza, Italy
Tusnad, Romania
Italy
Minunilor, Romania
Antiche Terme dei Gracchi, Italy
-6
Dead Sea, Israel
Eklutna Glacier Lake, AK
Hyder, AK Lindon, UT
PeruCusco, Peru
Mt Shasta, CA Denver, CO
Icebergs, Atlantic Aspen, CO
Konisääjo, Finland Rääveli Lake, Finland
Arequipa, Peru Las Vegas, NV
Carlsbad, CA
Ulvik, Norway Austrian Alps
Borsec, Romania
Saratoga, NY Blue River, OR
Minami Alps, Japan Evian les Bains, France
RomaniaHokuto, Japan Jalisco, Mexico
Munti Dognicei, Romania
Kilauea, HI Rosewell Ck, BC
Bizusa, Romania Tosrog, Romania
Iveland, Norway Connecticut
Mexico Poland Spring, ME Speyside, Scotland
Pittston, PA Botthel, WA
The Maltings, Scotland Denmark
Iceland Volvic, France Auvergne, France
Perthshire, Scotland Ayolo Hills, Italy
Vosges, France New York
Florence, Italy Hampshire, England Fiuggi Italy
Florence, Italy Borrisoleigh, Ireland Fiji India
Bethania, Wales
Umbria, Italy
Cape Grim, Australia
Piney Spring, TX
Ethiopia
Oconee, SC
Knoxville, TN
Addis Ababa, Ethiopia
Dominican RepublicFlorida
Bahamas Puerto Rico Ethiopia
Honolulu, HI Dominican Republic
Addis Ababa, Ethiopia
Puerto Rico
Alemgena, Ethiopia
Tampa Tapwater
Trinidad
Vancouver, BC
Dead Sea, Israel
Snowfall, hoar frost on decks
Sea-ice core
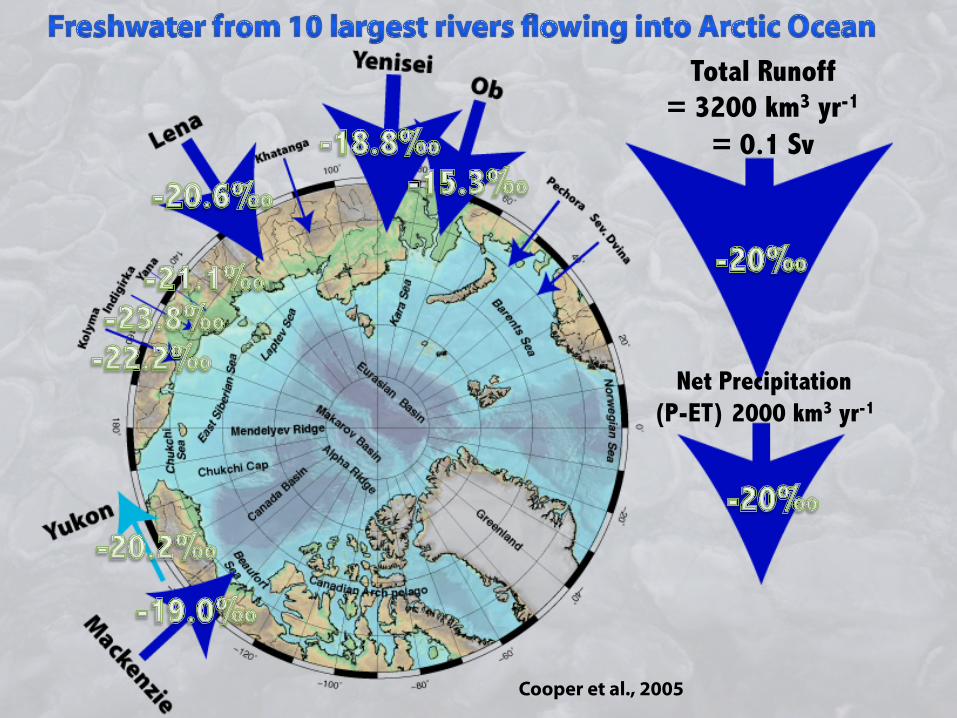
Total Runoff = 3200 km3 yr-1
= 0.1 Sv
Net Precipitation (P-ET) 2000 km3 yr-1
Cooper et al., 2005

!20
!16
!12
!8
!4
0
0 4 8 12 16 20 24 28 32!20
!16
!12
!8
!4
0
0 4 8 12 16 20 24 28 32
SWSIM
MW
! O
[‰]
18
Salinity [psu]
Atlantic-derived seawater
(i.e., like SMOW) Sea-ice meltwater
meteoric water (Arctic rivers, also
precipitation)
Net sea-ice melting
Net sea-ice formation
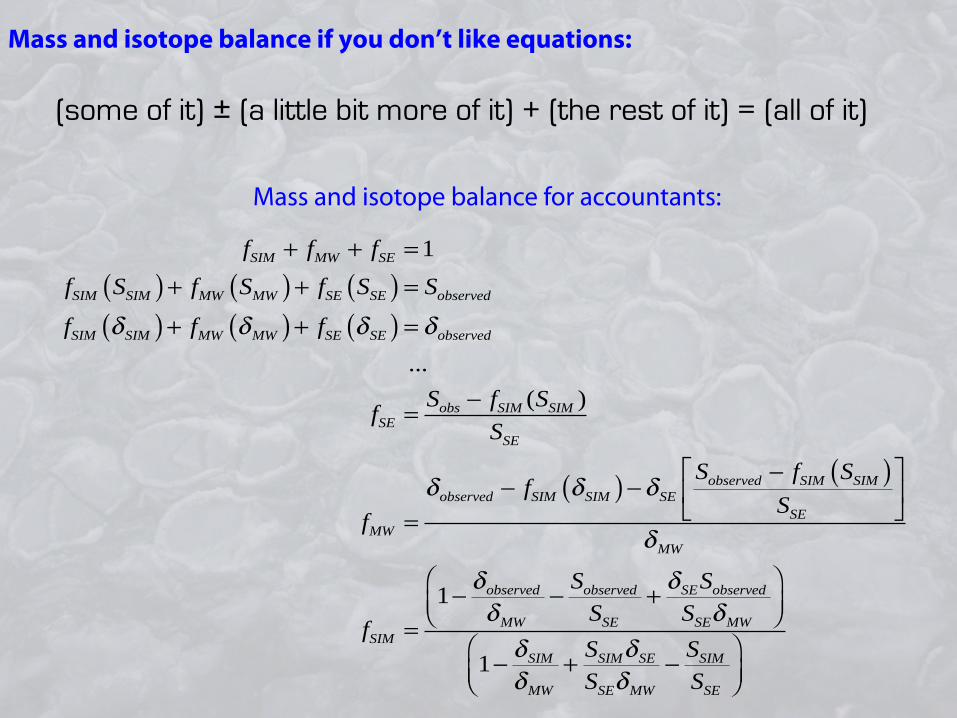
Mass and isotope balance if you don’t like equations:
(some of it) ± (a little bit more of it) + (the rest of it) = (all of it)
Mass and isotope balance for accountants:
fSIM + fMW + fSE =1fSIM SSIM( )+ fMW SMW( )+ fSE SSE( ) = Sobserved
fSIM δSIM( )+ fMW δMW( )+ fSE δSE( ) = δobserved
...
fSE = Sobs − fSIM (SSIM )SSE
fMW =δobserved − fSIM δSIM( )−δSE
Sobserved − fSIM SSIM( )SSE
⎡
⎣⎢
⎤
⎦⎥
δMW
fSIM =1− δobserved
δMW
− Sobserved
SSE
+ δSESobserved
SSEδMW
⎛⎝⎜
⎞⎠⎟
1− δSIM
δMW
+ SSIMδSE
SSEδMW
− SSIM
SSE
⎛⎝⎜
⎞⎠⎟

!20
!16
!12
!8
!4
0
0 4 8 12 16 20 24 28 32!20
!16
!12
!8
!4
0
0 4 8 12 16 20 24 28 32
SWSIM
MW
! O
[‰]
18
Salinity [psu]
Meteoric
-seaw
ater m
ixing
0.0 0.1 0.2
f(SIM)
Deep Atlantic-derived seawater (i.e., like
SMOW) Sea-ice
meltwater
meteoric water (Arctic rivers, also
precipitation)
Net sea-ice melting
Net sea-ice formation
! O
[‰]
18
Salinity [psu]
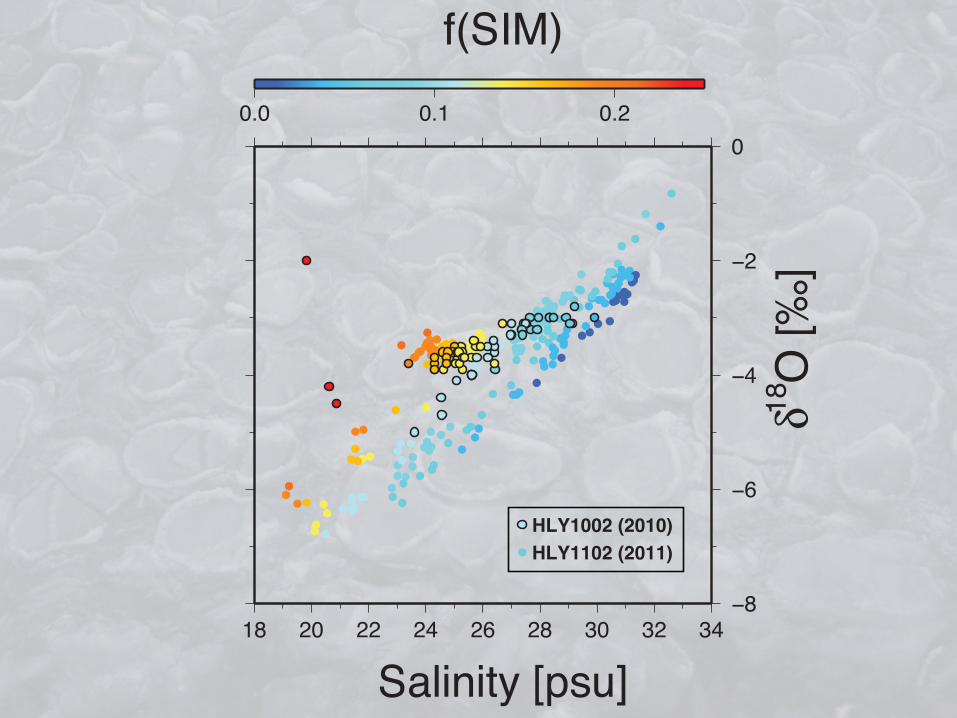
0.0 0.1 0.2
f(SIM)
!8
!6
!4
!2
0
18 20 22 24 26 28 30 32 34
HLY1002 (2010)HLY1102 (2011)

180˚
−160˚ −140˚
−120˚
70˚ 70˚
80˚ 80˚
0.0 0.1 0.2f(MW)
… fMW 2003-5
Yamamoto-Kawai et al., 2008
2006
2008
2010-2011

180˚
−160˚ −140˚
−120˚
70˚ 70˚
80˚ 80˚
0.0 0.1 0.2f(SIM)
… fSIM 2003-5
Yamamoto-Kawai et al., 2008
2006
2008
2010-2011

fSIM fSIM
Underlay shows mean ice coverage during month of cruise
0.2 0.2 0 0
2010 2011

0.0 0.1 0.2arag
onite
fSIM
remainder of Canada Basin
Makarov BasinSever Spur region
undersaturated
supersaturated
fMW
0.5
1.0
1.5
2.0
0.0 0.1 0.2 0.3 0.4 0.5
0.0 0.1 0.2 0.3 0.4 0.5
0.5
1.0
1.5
2.0
0.0 0.1 0.2 0.3 0.4 0.5
0.0 0.1 0.2 0.3 0.4 0.5
0.5
1.0
1.5
2.0
0.0 0.1 0.2 0.3 0.4 0.5
0.0 0.1 0.2 0.3 0.4 0.5
0.5
1.0
1.5
2.0
0.0 0.1 0.2 0.3 0.4 0.5
0.0 0.1 0.2 0.3 0.4 0.5
0.5
1.0
1.5
2.0
0.0 0.1 0.2 0.3 0.4 0.5
0.0 0.1 0.2 0.3 0.4 0.5
0.5
1.0
1.5
2.0
0.0 0.1 0.2 0.3 0.4 0.5
0.1 0.2 0.3 0.4 0.5
0.5
1.0
1.5
2.0
0.0 0.1 0.2 0.3 0.4 0.5
0.1 0.2 0.3 0.4 0.5
fSIM
arag
onite
coastal Beaufort Sea
2010-2011
0.0 0.1 0.2arag
onite
fMW
remainder of Canada Basin
Makarov BasinSever Spur region
fSIM
fMW
arag
onite
coastal Beaufort Sea
undersaturated
supersaturated
0.5
1.0
1.5
2.0
0.0 0.1 0.2 0.3 0.4 0.5
0.0 0.1 0.2 0.3 0.4 0.5
0.5
1.0
1.5
2.0
0.0 0.1 0.2 0.3 0.4 0.5
0.0 0.1 0.2 0.3 0.4 0.5
0.5
1.0
1.5
2.0
0.0 0.1 0.2 0.3 0.4 0.5
0.0 0.1 0.2 0.3 0.4 0.5
0.5
1.0
1.5
2.0
0.0 0.1 0.2 0.3 0.4 0.5
0.0 0.1 0.2 0.3 0.4 0.5
0.5
1.0
1.5
2.0
0.0 0.1 0.2 0.3 0.4 0.5
0.0 0.1 0.2 0.3 0.4 0.5
0.5
1.0
1.5
2.0
0.0 0.1 0.2 0.3 0.4 0.5
0.0 0.1 0.2 0.3 0.4 0.5
0.5
1.0
1.5
2.0
0.0 0.1 0.2 0.3 0.4 0.5
0.0 0.1 0.2 0.3 0.4 0.5
2010-2011
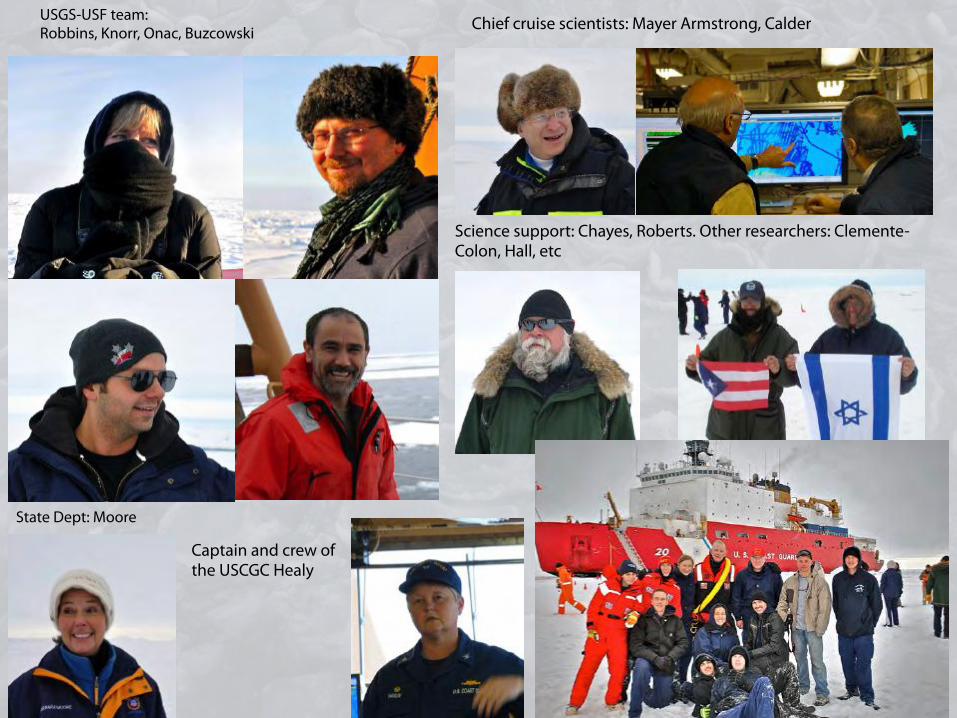
USGS-USF team: Robbins, Knorr, Onac, Buzcowski Chief cruise scientists: Mayer Armstrong, Calder
State Dept: Moore
Science support: Chayes, Roberts. Other researchers: Clemente-Colon, Hall, etc
Captain and crew of the USCGC Healy
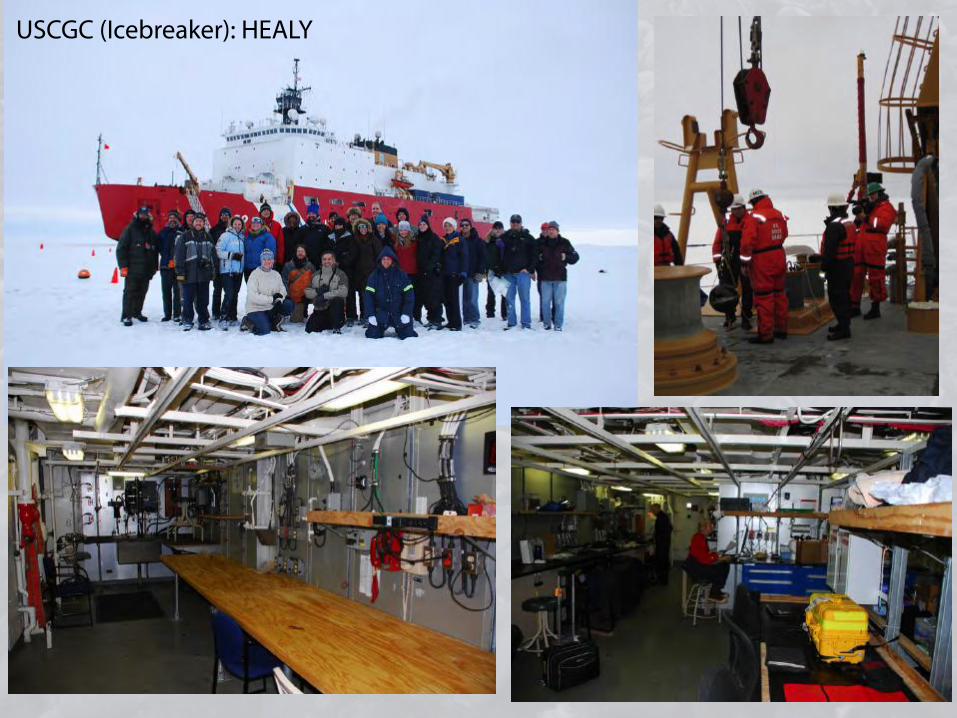
USCGC (Icebreaker): HEALY


![Wynn Macau [1128.HK] · Wynn Resorts of the US owns 72.29% of the Company, ... Wynn Macau Encore Wynn Cotai Opening September 2006 April 2010 2015 or 2016 (planned)](https://img.dokumen.tips/doc/110x75/5b16bcbe7f8b9a5e6d8d7055/wynn-macau-1128hk-wynn-resorts-of-the-us-owns-7229-of-the-company-.jpg)