Embed Size (px)
Citation preview
Understanding Margins
Frequently asked questions on margins as applicable for transactions on Cash and Derivatives segments of NSE and BSE
Jointly published by
National Stock Exchange of India Limited
Bombay Stock Exchange Limited
Page 2 of 16
Introduction ............................................................................................. 3 Frequently Asked Questions on Risk Management.................................... 3 1. Why should there be margins? .......................................................................3 2. What is volatility?.........................................................................................4 3. How is volatility computed? Can you give an example? ......................................4 4. What is the difference between price movements and volatility? .........................5 5. Is volatility linked to the direction of price movements? .....................................6 6. How does change in volatility affect margins?...................................................6 7. Are margins same across cash and derivatives markets?....................................6 8. What are the types of margins levied in the cash market segment? .....................7 9. What is Value at Risk (VaR) margin? ...............................................................7 10. How is VaR margin calculated?.......................................................................8 11. How is the Extreme Loss Margin computed?.....................................................9 12. How is Mark-to-Market (MTM) margin computed? ........................................... 10 13. Where can I find information of applicable VaR margins? ................................. 10 14. What are the types of margins levied in the Futures & Options (F&O) Segment?.. 10 15. How is Initial Margin Computed? .................................................................. 10 16. How is exposure margin computed?.............................................................. 11 17. How are Premium and Assignment margins computed?.................................... 11 18. Do I get margin benefit if I have positions on different underlyings? .................. 11 19. Do I get margin benefit if I have positions in both futures and options on same
underlying? ............................................................................................... 11 20. Do I get margin benefit if I have counter positions in different months on same
underlying? ............................................................................................... 12 Annexure 1............................................................................................. 13 Volatility ................................................................................................... 13 Standard deviation ..................................................................................... 13 Annexure 2............................................................................................. 14 Impact Cost .............................................................................................. 14 Definition .................................................................................................. 16
Page 3 of 16
Introduction Pursuant to their commitment towards enhancing investor protection and providing greater transparency, NSE and BSE have jointly endeavored to bring out this information brochure regarding the margins. The information which is provided in this brochure is in the format of Frequently Asked Questions so that the same is easily understandable by the investors. However, investors may kindly note that the said publication is not a substitute for the relevant regulations and requirements which are specified by the Exchanges from time to time. Therefore investors are advised to refer to the relevant provisions of the stock exchanges regarding the margins before transacting business with the trading members.
Frequently Asked Questions on Risk Management
1. Why should there be margins?
Just as we are faced with day to day uncertainties pertaining to weather, health, traffic etc and take steps to minimize the uncertainties, so also in the stock markets, there is uncertainty in the movement of share prices. This uncertainty leading to risk is sought to be addressed by margining systems of stock markets. Suppose an investor, purchases 1000 shares of ‘xyz’ company at Rs.100/- on January 1, 2008. Investor has to give the purchase amount of Rs.1,00,000/- (1000 x 100) to his broker on or before January 2, 2008. Broker, in turn, has to give this money to stock exchange on January 3, 2008. There is always a small chance that the investor may not be able to bring the required money by required date. As an advance for buying the shares, investor is required to pay a portion of the total amount of Rs.1,00,000/- to the broker at the time of placing the buy order. Stock exchange in turn collects similar amount from the broker upon execution of the order. This initial token payment is called margin. Remember, for every buyer there is a seller and if the buyer does not bring the money, seller may not get his / her money and vice versa. Therefore, margin is levied on the seller also to ensure that he / she gives the 100 shares sold to the broker who in turn gives it to the stock exchange. Margin payments ensure that each investor is serious about buying or selling shares. In the above example, assume that margin was 15%. That is investor has to give Rs.15,000/-(15% of Rs.1,00,000/) to the broker before buying. Now suppose that investor bought the shares at 11 am on January 1, 2008. Assume that by the end
Page 4 of 16
of the day price of the share falls by Rs.25/-. That is total value of the shares has come down to Rs.75,000/-. That is buyer has suffered a notional loss of Rs.25,000/-. In our example buyer has paid Rs.15,000/- as margin but the notional loss, because of fall in price, is Rs.25,000/-. That is notional loss is more than the margin given. In such a situation, the buyer may not want to pay Rs.1,00,000/- for the shares whose value has come down to Rs.75,000/-. Similarly, if the price has gone up by Rs.25/-, the seller may not want to give the shares at Rs.1,00,000/-. To ensure that both buyers and sellers fulfill their obligations irrespective of price movements, notional losses are also need to be collected. Prices of shares keep on moving every day. Margins ensure that buyers bring money and sellers bring shares to complete their obligations even though the prices have moved down or up. 2. What is volatility?
Different people have different definitions for volatility. For our purpose, we can say that volatility essentially refers to uncertainty arising out of price changes of shares. It is important to understand the meaning of volatility a little more closely because it has a major bearing on how margins are computed.
3. How is volatility computed? Can you give an example?
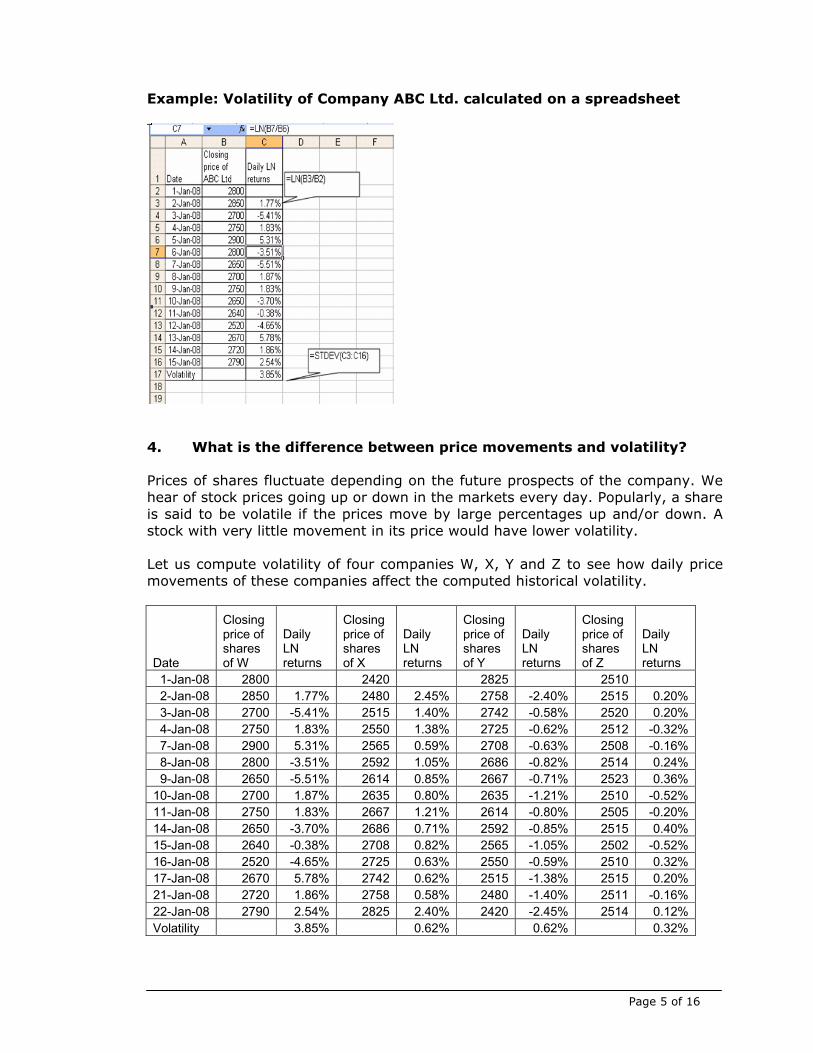
As mentioned earlier, volatility has different definitions and therefore different people compute it differently. For our understanding purpose, let us compute volatility based on close prices of a share over last 6 months. Since it is based on historical data, let us call it ‘historical volatility’. You can easily calculate historical volatility using an excel sheet. All you need to do is to put down close prices of a share for the last six months in a column of the excel sheet. Calculate the daily returns by using ‘LN’ (natural log) function in excel. Use the formula LN(today’s close price / yesterday’s close price) in the next column for calculating daily returns for all the days. Go to the end of the second column (after the last value) and use the excel function ‘STDEV’ (available under statistical formulas) to calculate the Standard Deviation of returns computed as above. The calculated standard deviation expressed as percentage is the ‘historical volatility’ of the share for the six months period. For those interested in the statistical formulae of volatility, the same is illustrated at Annexure 1.
Page 5 of 16
Example: Volatility of Company ABC Ltd. calculated on a spreadsheet
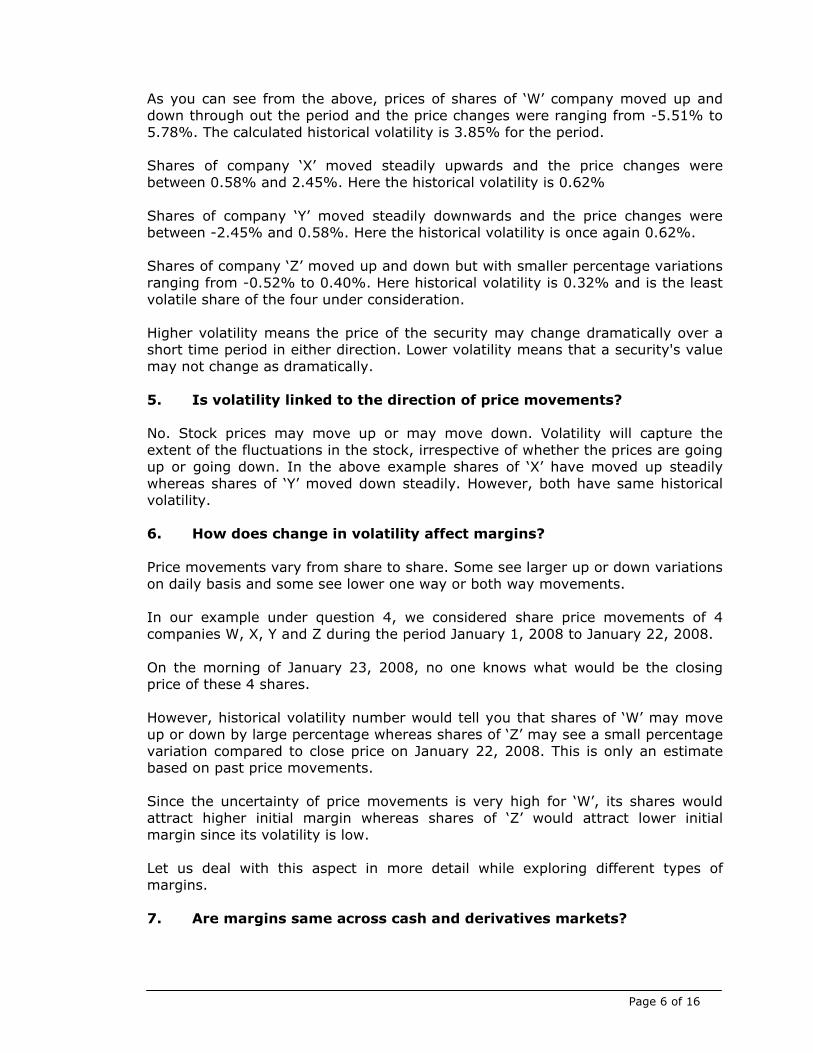
4. What is the difference between price movements and volatility? Prices of shares fluctuate depending on the future prospects of the company. We hear of stock prices going up or down in the markets every day. Popularly, a share is said to be volatile if the prices move by large percentages up and/or down. A stock with very little movement in its price would have lower volatility. Let us compute volatility of four companies W, X, Y and Z to see how daily price movements of these companies affect the computed historical volatility.
Date
Closing price of shares of W
Daily LN returns
Closing price of shares of X
Daily LN returns
Closing price of shares of Y
Daily LN returns
Closing price of shares of Z
Daily LN returns
1-Jan-08 2800 2420 2825 2510 2-Jan-08 2850 1.77% 2480 2.45% 2758 -2.40% 2515 0.20%3-Jan-08 2700 -5.41% 2515 1.40% 2742 -0.58% 2520 0.20%4-Jan-08 2750 1.83% 2550 1.38% 2725 -0.62% 2512 -0.32%7-Jan-08 2900 5.31% 2565 0.59% 2708 -0.63% 2508 -0.16%8-Jan-08 2800 -3.51% 2592 1.05% 2686 -0.82% 2514 0.24%9-Jan-08 2650 -5.51% 2614 0.85% 2667 -0.71% 2523 0.36%
10-Jan-08 2700 1.87% 2635 0.80% 2635 -1.21% 2510 -0.52%11-Jan-08 2750 1.83% 2667 1.21% 2614 -0.80% 2505 -0.20%14-Jan-08 2650 -3.70% 2686 0.71% 2592 -0.85% 2515 0.40%15-Jan-08 2640 -0.38% 2708 0.82% 2565 -1.05% 2502 -0.52%16-Jan-08 2520 -4.65% 2725 0.63% 2550 -0.59% 2510 0.32%17-Jan-08 2670 5.78% 2742 0.62% 2515 -1.38% 2515 0.20%21-Jan-08 2720 1.86% 2758 0.58% 2480 -1.40% 2511 -0.16%22-Jan-08 2790 2.54% 2825 2.40% 2420 -2.45% 2514 0.12%Volatility 3.85% 0.62% 0.62% 0.32%
Page 6 of 16
As you can see from the above, prices of shares of ‘W’ company moved up and down through out the period and the price changes were ranging from -5.51% to 5.78%. The calculated historical volatility is 3.85% for the period. Shares of company ‘X’ moved steadily upwards and the price changes were between 0.58% and 2.45%. Here the historical volatility is 0.62% Shares of company ‘Y’ moved steadily downwards and the price changes were between -2.45% and 0.58%. Here the historical volatility is once again 0.62%. Shares of company ‘Z’ moved up and down but with smaller percentage variations ranging from -0.52% to 0.40%. Here historical volatility is 0.32% and is the least volatile share of the four under consideration. Higher volatility means the price of the security may change dramatically over a short time period in either direction. Lower volatility means that a security's value may not change as dramatically. 5. Is volatility linked to the direction of price movements? No. Stock prices may move up or may move down. Volatility will capture the extent of the fluctuations in the stock, irrespective of whether the prices are going up or going down. In the above example shares of ‘X’ have moved up steadily whereas shares of ‘Y’ moved down steadily. However, both have same historical volatility. 6. How does change in volatility affect margins? Price movements vary from share to share. Some see larger up or down variations on daily basis and some see lower one way or both way movements. In our example under question 4, we considered share price movements of 4 companies W, X, Y and Z during the period January 1, 2008 to January 22, 2008. On the morning of January 23, 2008, no one knows what would be the closing price of these 4 shares. However, historical volatility number would tell you that shares of ‘W’ may move up or down by large percentage whereas shares of ‘Z’ may see a small percentage variation compared to close price on January 22, 2008. This is only an estimate based on past price movements. Since the uncertainty of price movements is very high for ‘W’, its shares would attract higher initial margin whereas shares of ‘Z’ would attract lower initial margin since its volatility is low. Let us deal with this aspect in more detail while exploring different types of margins. 7. Are margins same across cash and derivatives markets?
Page 7 of 16
Stock market is a complex place with variety of instruments traded on it. As shown above, one single margin for all shares may not be able to handle price uncertainty / risk. In our simple example under question 1, even within cash market, we have seen two types of margins, one at the time of placing the order and another to cover the notional loss. Shares traded on cash market are settled in two days whereas derivative contracts may have longer time to expiry. That is, derivative market margins have to address the uncertainty over a longer period. Therefore, SEBI has prescribed different ways to margin cash and derivatives trades taking into consideration unique features of instruments traded on these segments. 8. What are the types of margins levied in the cash market segment? Margins in the cash market segment comprise of the following three types:
1) Value at Risk (VaR) margin 2) Extreme loss margin 3) Mark to market Margin
9. What is Value at Risk (VaR) margin? VaR Margin is at the heart of margining system for the cash market segment. VaR margin is collected on upfront basis. In that respect, it is similar to the margin we have seen in our example under question 1 while placing the order. Let us try and understand briefly what we mean by ‘VaR’. The most popular and traditional measure of uncertainty / risk is Volatility, which we have understood earlier. While historical volatility tells us how the security price moved in the past, VaR answers the question, “How much is it likely to move over next one day?" VaR is a technique used to estimate the probability of loss of value of an asset orgroup of assets (for example a share or a portfolio of a few shares), based on thestatistical analysis of historical price trends and volatilities. A VaR statistic has three components: a time period, a confidence level and a lossamount (or loss percentage). Keep these three parts in mind and identify them inthe following example:
• With 99% confidence, what is the maximum value that an asset or portfoliomay loose over the next day?
You can see how the "VaR question" has three elements: a relatively high level of confidence (99%), a time period (a day) and an estimate of loss (expressed either in rupees or percentage terms). The actual calculation of VaR is beyond the scope of this booklet. However, those who are interested in understanding the calculation methodology may refer any statistical reference material.
Page 8 of 16
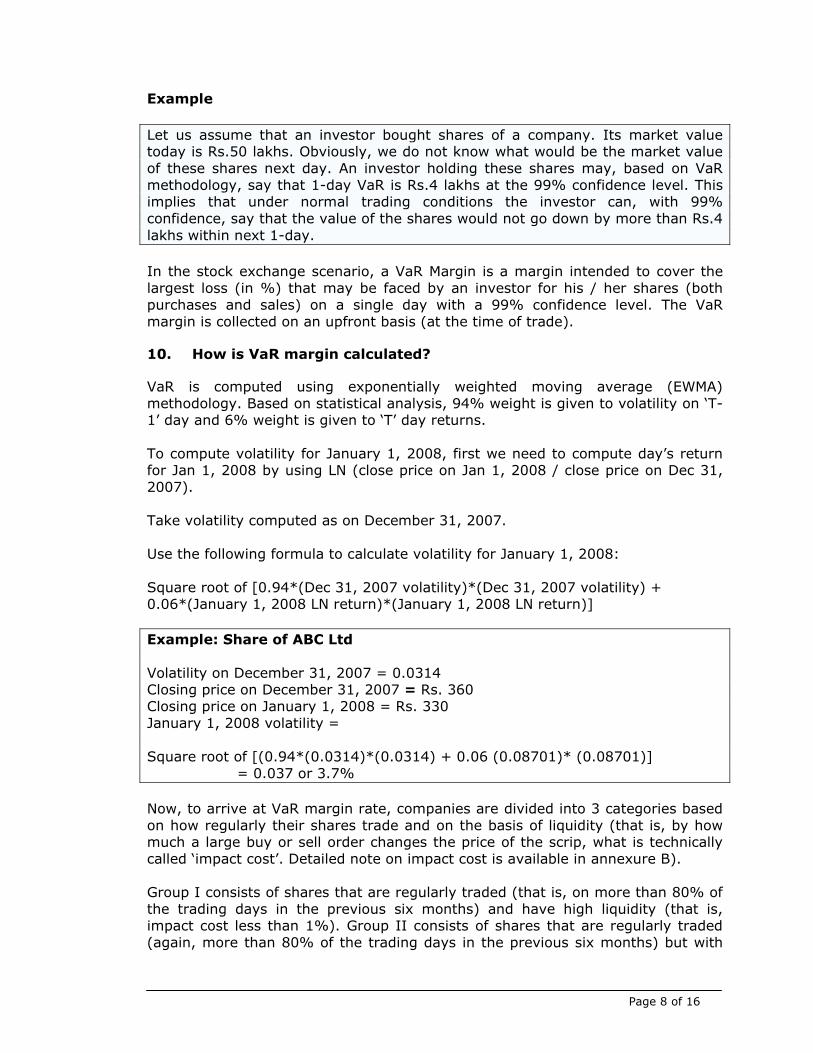
Example
Let us assume that an investor bought shares of a company. Its market value today is Rs.50 lakhs. Obviously, we do not know what would be the market value of these shares next day. An investor holding these shares may, based on VaR methodology, say that 1-day VaR is Rs.4 lakhs at the 99% confidence level. This implies that under normal trading conditions the investor can, with 99% confidence, say that the value of the shares would not go down by more than Rs.4 lakhs within next 1-day.
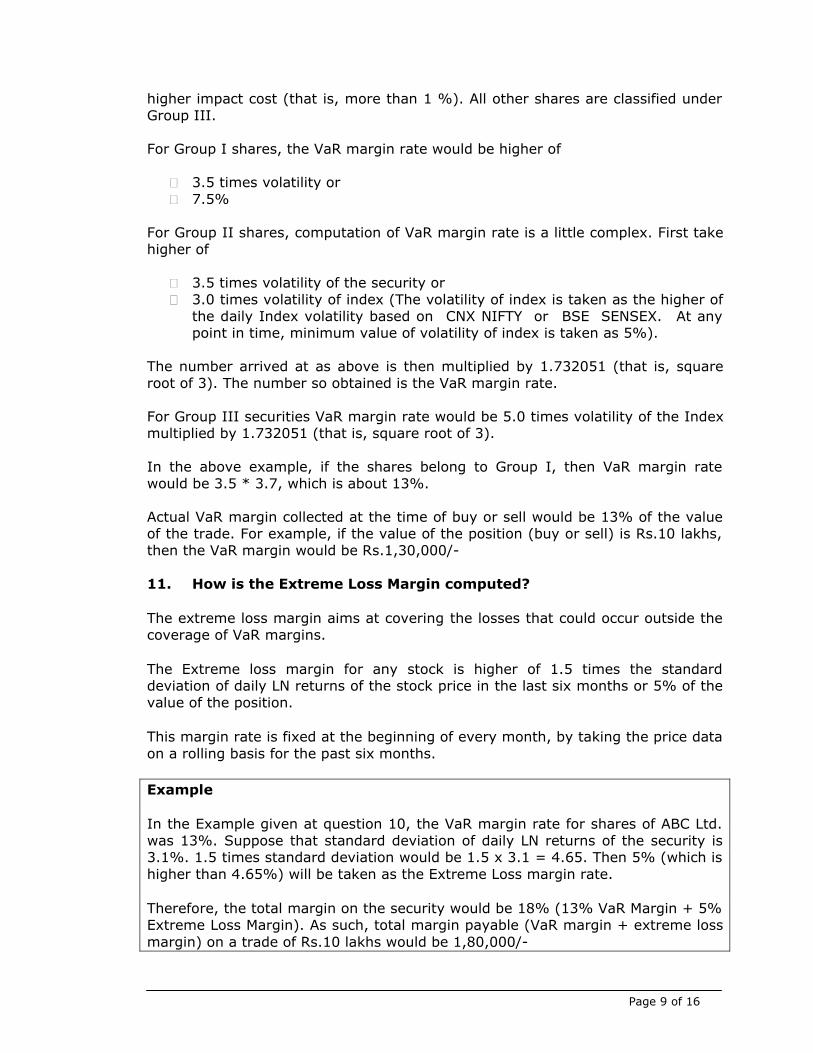
In the stock exchange scenario, a VaR Margin is a margin intended to cover the largest loss (in %) that may be faced by an investor for his / her shares (both purchases and sales) on a single day with a 99% confidence level. The VaR margin is collected on an upfront basis (at the time of trade). 10. How is VaR margin calculated? VaR is computed using exponentially weighted moving average (EWMA) methodology. Based on statistical analysis, 94% weight is given to volatility on ‘T-1’ day and 6% weight is given to ‘T’ day returns. To compute volatility for January 1, 2008, first we need to compute day’s return for Jan 1, 2008 by using LN (close price on Jan 1, 2008 / close price on Dec 31, 2007). Take volatility computed as on December 31, 2007. Use the following formula to calculate volatility for January 1, 2008: Square root of [0.94*(Dec 31, 2007 volatility)*(Dec 31, 2007 volatility) + 0.06*(January 1, 2008 LN return)*(January 1, 2008 LN return)] Example: Share of ABC Ltd Volatility on December 31, 2007 = 0.0314 Closing price on December 31, 2007 = Rs. 360 Closing price on January 1, 2008 = Rs. 330 January 1, 2008 volatility = Square root of [(0.94*(0.0314)*(0.0314) + 0.06 (0.08701)* (0.08701)] = 0.037 or 3.7% Now, to arrive at VaR margin rate, companies are divided into 3 categories based on how regularly their shares trade and on the basis of liquidity (that is, by how much a large buy or sell order changes the price of the scrip, what is technically called ‘impact cost’. Detailed note on impact cost is available in annexure B). Group I consists of shares that are regularly traded (that is, on more than 80% of the trading days in the previous six months) and have high liquidity (that is, impact cost less than 1%). Group II consists of shares that are regularly traded (again, more than 80% of the trading days in the previous six months) but with
Page 10 of 16
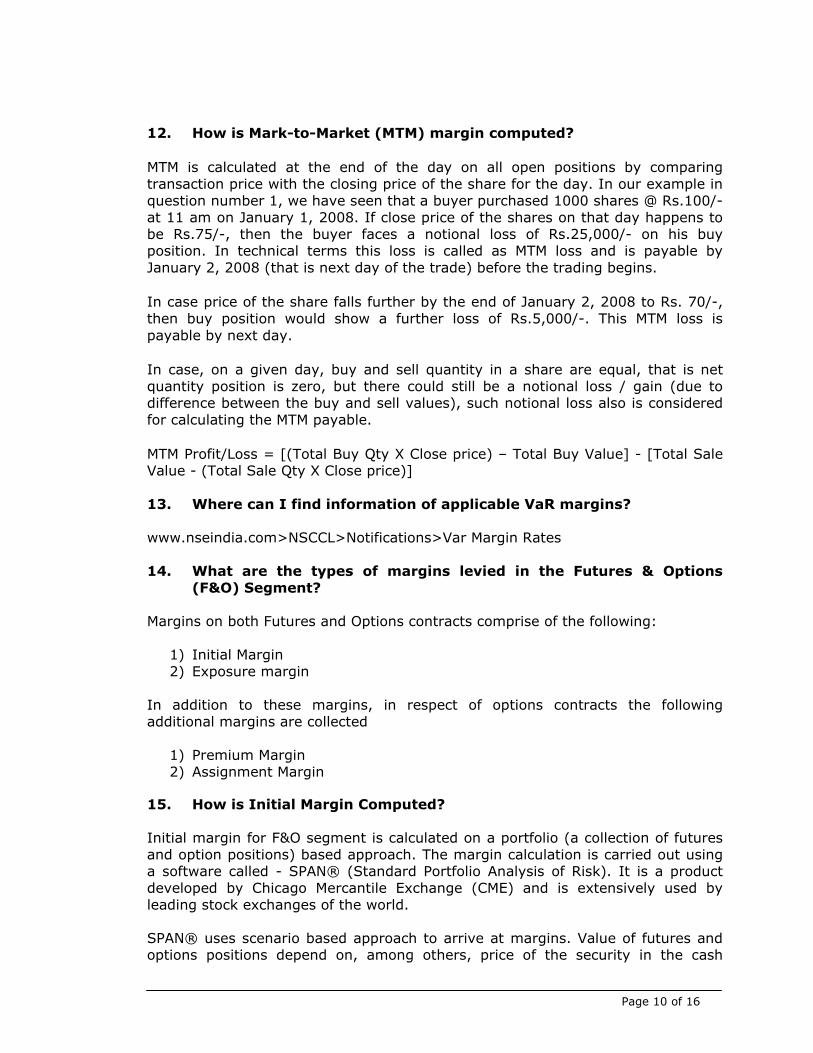
12. How is Mark-to-Market (MTM) margin computed?
MTM is calculated at the end of the day on all open positions by comparing transaction price with the closing price of the share for the day. In our example in question number 1, we have seen that a buyer purchased 1000 shares @ Rs.100/- at 11 am on January 1, 2008. If close price of the shares on that day happens to be Rs.75/-, then the buyer faces a notional loss of Rs.25,000/- on his buy position. In technical terms this loss is called as MTM loss and is payable by January 2, 2008 (that is next day of the trade) before the trading begins.
In case price of the share falls further by the end of January 2, 2008 to Rs. 70/-, then buy position would show a further loss of Rs.5,000/-. This MTM loss is payable by next day.
In case, on a given day, buy and sell quantity in a share are equal, that is net quantity position is zero, but there could still be a notional loss / gain (due to difference between the buy and sell values), such notional loss also is considered for calculating the MTM payable.
MTM Profit/Loss = [(Total Buy Qty X Close price) – Total Buy Value] - [Total Sale Value - (Total Sale Qty X Close price)] 13. Where can I find information of applicable VaR margins? www.nseindia.com>NSCCL>Notifications>Var Margin Rates 14. What are the types of margins levied in the Futures & Options
(F&O) Segment? Margins on both Futures and Options contracts comprise of the following:
1) Initial Margin 2) Exposure margin
In addition to these margins, in respect of options contracts the following additional margins are collected
1) Premium Margin 2) Assignment Margin
15. How is Initial Margin Computed? Initial margin for F&O segment is calculated on a portfolio (a collection of futures and option positions) based approach. The margin calculation is carried out using a software called - SPAN® (Standard Portfolio Analysis of Risk). It is a product developed by Chicago Mercantile Exchange (CME) and is extensively used by leading stock exchanges of the world. SPAN® uses scenario based approach to arrive at margins. Value of futures and options positions depend on, among others, price of the security in the cash
Page 11 of 16
market and volatility of the security in cash market. As you would agree, both price and volatility keep changing. To put it simply, SPAN® generates about 16 different scenarios by assuming different values to the price and volatility. For each of these scenarios, possible loss that the portfolio would suffer is calculated. The initial margin required to be paid by the investor would be equal to the highest loss the portfolio would suffer in any of the scenarios considered. The margin is monitored and collected at the time of placing the buy / sell order. The SPAN® margins are revised 6 times in a day - once at the beginning of the day, 4 times during market hours and finally at the end of the day. Obviously, higher the volatility, higher the margins. 16. How is exposure margin computed?
In addition to initial / SPAN® margin, exposure margin is also collected. Exposure margins in respect of index futures and index option sell positions is 3% of the notional value. For futures on individual securities and sell positions in options on individual securities, the exposure margin is higher of 5% or 1.5 standard deviation of the LN returns of the security (in the underlying cash market) over the last 6 months period and is applied on the notional value of position. 17. How are Premium and Assignment margins computed? In addition to Initial Margin, a premium margin is charged to buyers of option contracts. The premium margin is paid by the buyers of the options contracts and is equal to the value of the options premium multiplied by the quantity of options purchased. For example, if 1000 call options on ABC Ltd are purchased at Rs. 20/-, and the investor has no other positions, then the premium margin is Rs. 20,000. The margin is to be paid at the time trade. Assignment Margin is collected on assignment from the sellers of the contracts. 18. Do I get margin benefit if I have positions on different underlyings? No. Margin benefit is not provided for positions on different underlyings in F&O segment.
19. Do I get margin benefit if I have positions in both futures and
options on same underlying? Yes. Margin benefit is provided for positions in futures and options contracts on the same underlying.
Page 12 of 16
20. Do I get margin benefit if I have counter positions in different months on same underlying?
Yes. In case of calendar spread positions margin benefit is provided. However, the benefit is removed three days prior to expiry of the near month contract.
Page 13 of 16
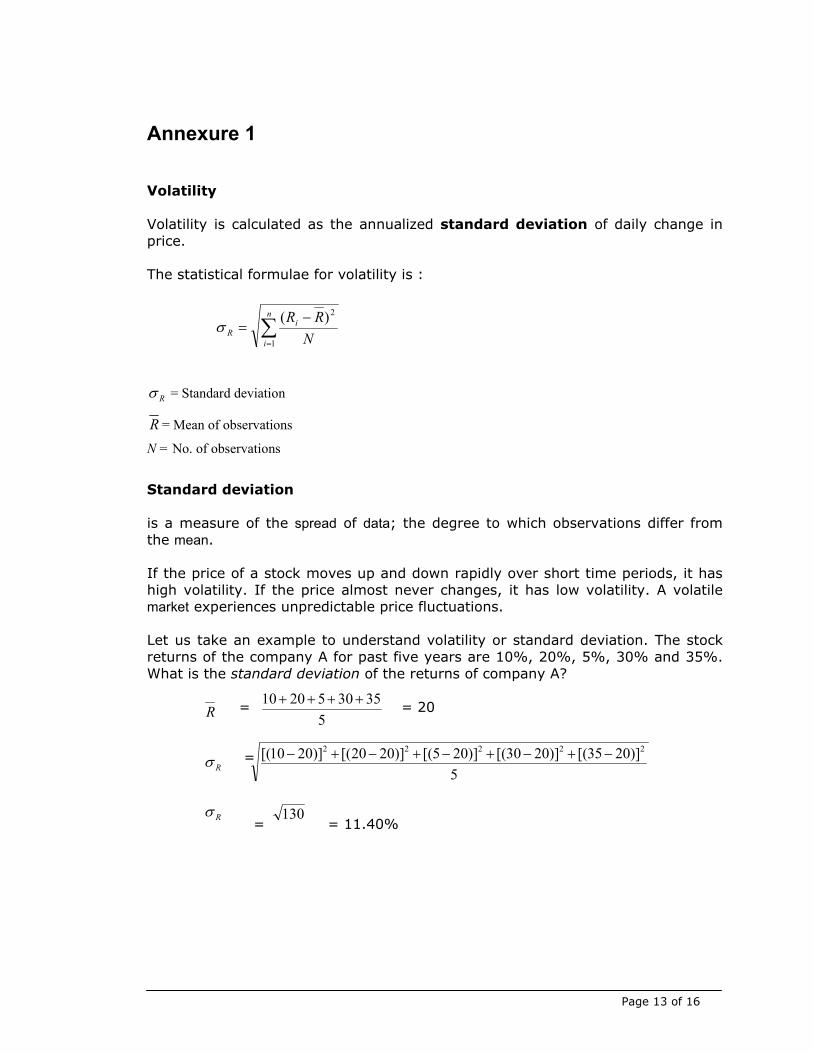
Annexure 1 Volatility Volatility is calculated as the annualized standard deviation of daily change in price. The statistical formulae for volatility is :
Rσ = Standard deviation
R = Mean of observations
N = No. of observations
Standard deviation is a measure of the spread of data; the degree to which observations differ from the mean. If the price of a stock moves up and down rapidly over short time periods, it has high volatility. If the price almost never changes, it has low volatility. A volatile market experiences unpredictable price fluctuations. Let us take an example to understand volatility or standard deviation. The stock returns of the company A for past five years are 10%, 20%, 5%, 30% and 35%. What is the standard deviation of the returns of company A? = = 20 = = = 11.40%
∑=
−=
n
i
iR N
RR1
2)(σ
R 5353052010 ++++
Rσ5
)]2035[()]2030[()]205[()]2020[()]2010[( 22222 −+−+−+−+−
Rσ 130
Page 14 of 16
Annexure 2 Impact Cost
Introduction Liquidity in the context of stock markets means a market where large orders can be executed without incurring a high transaction cost. The transaction cost referred here is not the fixed costs typically incurred like brokerage, transaction charges, depository charges etc. but is the cost attributable to lack of market liquidity as explained subsequently. Liquidity comes from the buyers and sellers in the market, who are constantly on the look out for buying and selling opportunities. Lack of liquidity translates into a high cost for buyers and sellers.
The electronic limit order book (ELOB) as available on NSE is an ideal provider of market liquidity. This style of market dispenses with market makers, and allows anyone in the market to execute orders against the best available counter orders. The market may thus be thought of as possessing liquidity in terms of outstanding orders lying on the buy and sell side of the order book, which represent the intention to buy or sell.
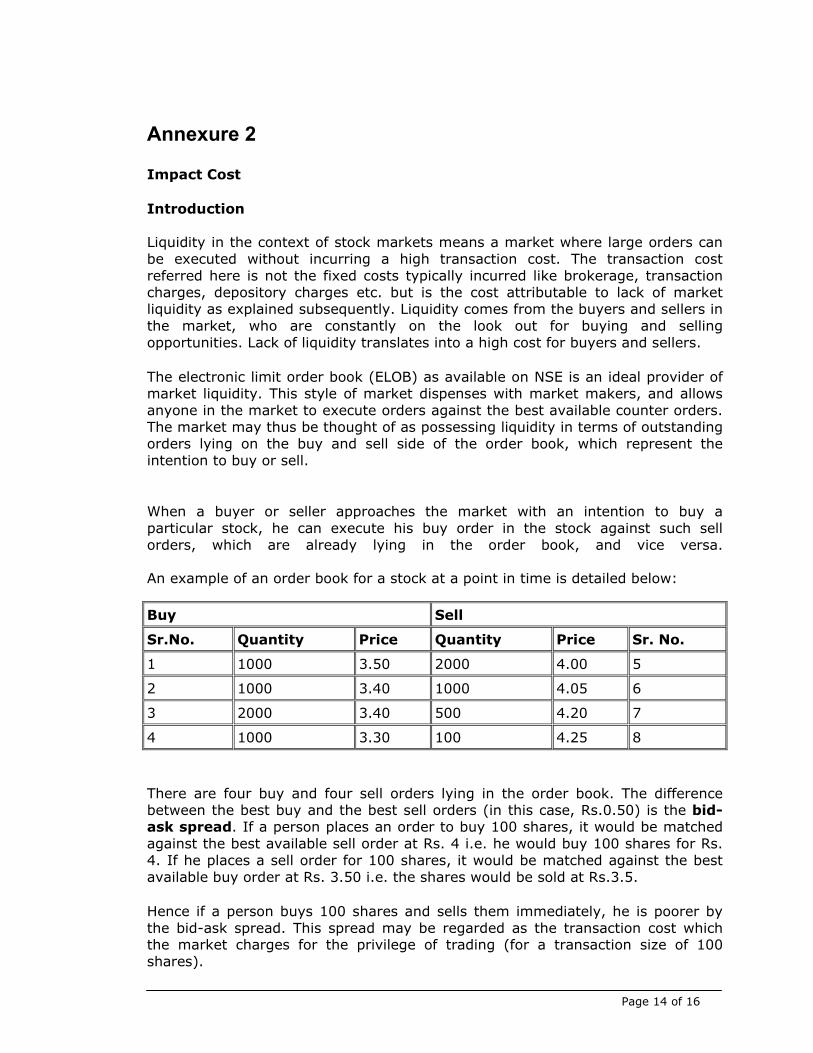
When a buyer or seller approaches the market with an intention to buy a particular stock, he can execute his buy order in the stock against such sell orders, which are already lying in the order book, and vice versa. An example of an order book for a stock at a point in time is detailed below:
Buy Sell
Sr.No. Quantity Price Quantity Price Sr. No.
1 1000 3.50 2000 4.00 5
2 1000 3.40 1000 4.05 6
3 2000 3.40 500 4.20 7
4 1000 3.30 100 4.25 8
There are four buy and four sell orders lying in the order book. The difference between the best buy and the best sell orders (in this case, Rs.0.50) is the bid-ask spread. If a person places an order to buy 100 shares, it would be matched against the best available sell order at Rs. 4 i.e. he would buy 100 shares for Rs. 4. If he places a sell order for 100 shares, it would be matched against the best available buy order at Rs. 3.50 i.e. the shares would be sold at Rs.3.5.
Hence if a person buys 100 shares and sells them immediately, he is poorer by the bid-ask spread. This spread may be regarded as the transaction cost which the market charges for the privilege of trading (for a transaction size of 100 shares).
Page 15 of 16
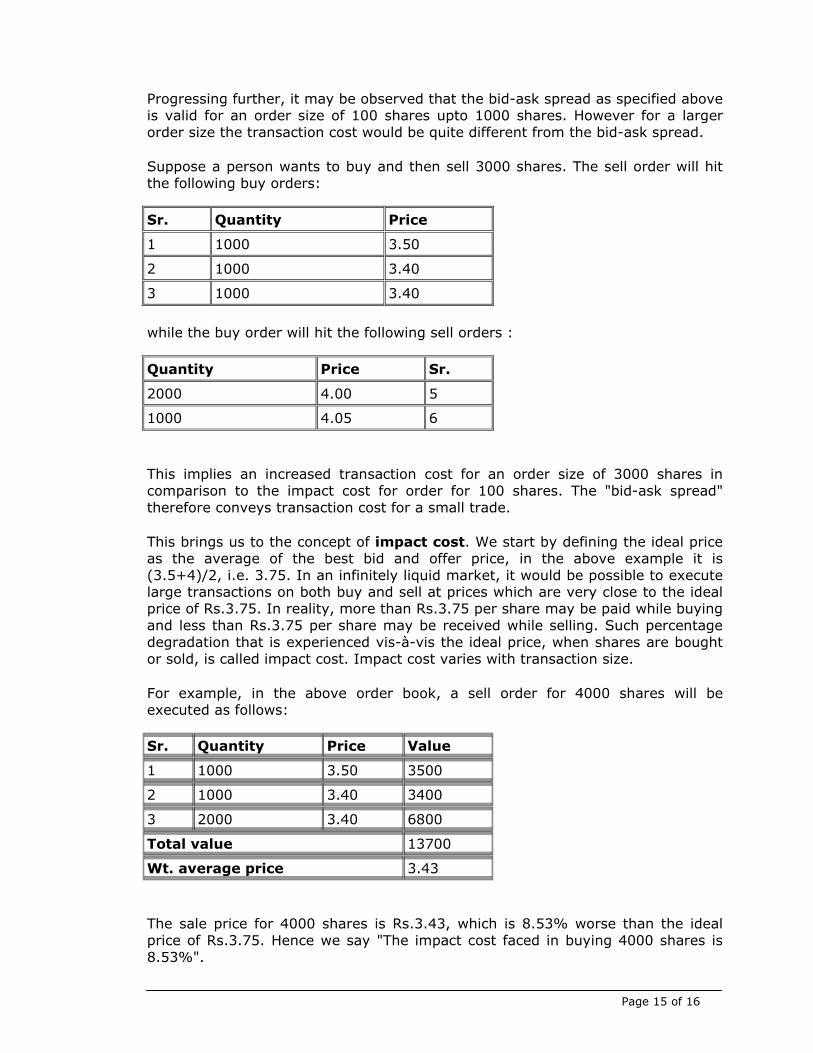
Progressing further, it may be observed that the bid-ask spread as specified above is valid for an order size of 100 shares upto 1000 shares. However for a larger order size the transaction cost would be quite different from the bid-ask spread.
Suppose a person wants to buy and then sell 3000 shares. The sell order will hit the following buy orders:
Sr. Quantity Price
1 1000 3.50
2 1000 3.40
3 1000 3.40
while the buy order will hit the following sell orders :
Quantity Price Sr.
2000 4.00 5
1000 4.05 6
This implies an increased transaction cost for an order size of 3000 shares in comparison to the impact cost for order for 100 shares. The "bid-ask spread" therefore conveys transaction cost for a small trade.
This brings us to the concept of impact cost. We start by defining the ideal price as the average of the best bid and offer price, in the above example it is (3.5+4)/2, i.e. 3.75. In an infinitely liquid market, it would be possible to execute large transactions on both buy and sell at prices which are very close to the ideal price of Rs.3.75. In reality, more than Rs.3.75 per share may be paid while buying and less than Rs.3.75 per share may be received while selling. Such percentage degradation that is experienced vis-à-vis the ideal price, when shares are bought or sold, is called impact cost. Impact cost varies with transaction size.
For example, in the above order book, a sell order for 4000 shares will be executed as follows:
Sr. Quantity Price Value
1 1000 3.50 3500
2 1000 3.40 3400
3 2000 3.40 6800
Total value 13700
Wt. average price 3.43
The sale price for 4000 shares is Rs.3.43, which is 8.53% worse than the ideal price of Rs.3.75. Hence we say "The impact cost faced in buying 4000 shares is 8.53%".
Page 16 of 16
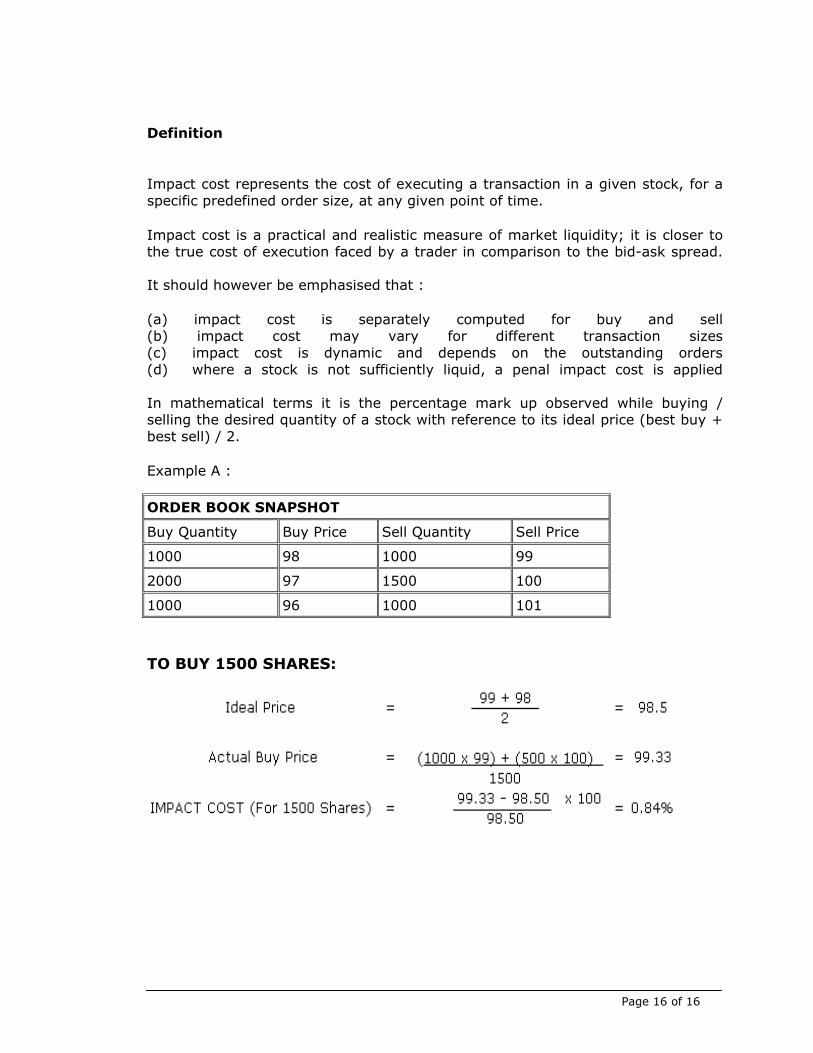
Definition
Impact cost represents the cost of executing a transaction in a given stock, for a specific predefined order size, at any given point of time.
Impact cost is a practical and realistic measure of market liquidity; it is closer to the true cost of execution faced by a trader in comparison to the bid-ask spread. It should however be emphasised that :
(a) impact cost is separately computed for buy and sell (b) impact cost may vary for different transaction sizes (c) impact cost is dynamic and depends on the outstanding orders (d) where a stock is not sufficiently liquid, a penal impact cost is applied In mathematical terms it is the percentage mark up observed while buying / selling the desired quantity of a stock with reference to its ideal price (best buy + best sell) / 2.
Example A :
ORDER BOOK SNAPSHOT
Buy Quantity Buy Price Sell Quantity Sell Price
1000 98 1000 99
2000 97 1500 100
1000 96 1000 101
TO BUY 1500 SHARES: