Embed Size (px)
Citation preview
© Copyright 2007 National Association of Real Estate Investment Trusts ®
Joint Ventures as REIT Funds
Thursday, March 29 10:00 - 11:00 a.m.
Moderator: Michael Pappagallo, EVP & CFO, Kimco Realty Corporation
Panelists:
Michael Brennan, President & CEO, First Industrial Realty Trust, Inc. Merrie Frankel, VP & Senior Credit Officer, Moody’s Investors Service
James Sullivan, Principal, Green Street Advisors Inc.
Special CommentApril 2006
New YorkPhilip Kibel CPA 1.212.553.1653Craig Emrick CPAGriselda BisonóJohn J. KrizManaging Director – Real Estate Finance
Contact Phone
REIT Joint Ventures and Funds:Weighing the Pluses and Minuses
Summary Opinion
KEY TAKE-AWAYS• Real estate investment trusts (REITs) are increasing their use of joint ventures and funds to finance real
estate purchases and development pipelines, and diversify their revenues with additional advisory andmanagement fees. All things being equal, Moody's views diversification as a positive credit characteristic.
• These joint ventures and funds may be more leveraged than a REIT's wholly owned assets, but off-balancesheet, achieving a reported (if not actual) balance sheet condition, and complicating an analysis of the truecredit implications.
• A select group of REITs have been successfully using these structures for some time, which has providedthem with revenue and funding diversification. However, as these structures are a rising trend among moreREIT's, on a broad basis the related fees show a degree of historical variability, some of which may be dueto the current high growth rate and early stage development for most firms. This variability is higher foracquisition, disposition and promote/success fees, but less so for property management and leasing fees.
• This Special Comment provides background on REITs' JV and fund structures, and outlines Moody's viewsof their credit implications. In addition, Moody's has historically taken a significant haircut on JV/fundincome in our analysis. In this comment we expand on our quantitative and qualitative approach to thesestructures as first presented in "Rating Methodology for REITs and Other Commercial Property Firms,”January 2006 available at www.moodys.com.

JOINT VENTURES AND FUNDS ARE HERE TO STAY…WITH POSITIVE AND NEGATIVE IMPLICATIONSREITs have been increasing their use of joint ventures and funds to finance real estate purchases, diversify theirrevenues through advisory and management fees, and lever their businesses. We expect the rate of increase toaccelerate, driven by managements' needs to drive earnings growth in a low cap rate/easy-mortgage-financeenvironment. We also believe the growth in these structures would continue with a reversal in cap rates, albeit at aslower rate. They are here to stay.
Moody's sees the negative aspects of the rise of JVs/funds creating a rating counterweight to REITs' positive trackrecord and momentum in building greater diversity, depth and leadership. JVs and funds will likely be one of thedriving business and creditworthiness factors for REITs for the rest of the decade. Some specific comments Moody'shas about these structures are the following:
• A few REITs have been successfully using these structures for some time, building a skill base and marketposition, which has helped provide them with revenue and funding diversification. However, as these JVand fund structures are a rising trend among a larger number and range of REITs, on a broad basis theassociated fees show a lack of track record and potentially high degree of variability. This variability ishigher for acquisition, disposition and promote/success fees, but less so for the core property managementand leasing fees. Also, if and when JV/fund fees zero out due to the winding up of the transaction, they cantake time to replace – often longer than a lease expiration. In addition, unlike cash flows from rentalproperties, the JV/fund fee stream is not "collateralized" by an asset.
• REITs use JV and fund structures to enhance their nominal investment returns through fees and promotestructures, and to achieve a reported (if not actual) balance sheet condition, such as leverage and relative useof secured debt.
• These JVs and funds can be highly leveraged with secured debt which is off-balance sheet, weakeningREITs' financial and strategic flexibility, and making an analysis of the REIT's true financial profile moredifficult. However, there are varieties of leverage approaches, so each REIT's situation needs to beexamined individually.
• Security holders and REITs alike struggle with transparency; GAAP permits, and often requires, JVs to betreated as unconsolidated entities (i.e., off-balance sheet). A complete, accurate credit picture can only beobtained by looking through the JV and fund structures to determine REITs' true debt exposures andfinancial interests in their JV and fund properties. REIT disclosures in this area could be improved,although here, too, there is variance in disclosure breadth and depth among firms.
• Issues of control are important – what control does the REIT retain over the management of the propertiesto ensure that its strategic objectives will be realized? Likewise, partners' exit or other strategies may not beconsistent with the REIT's – and exit strategies can create contingent calls on a REIT's resources. Theseconcerns are exacerbated for development ventures, where the REIT is often committed to purchase thecompleted property, and thus remains exposed to lease-up risks.
• Conflict-of-interest concerns, and attendant fiduciary liability, may arise over how opportunities areallocated among REIT-owned properties and JV/fund properties — for example, the way tenants areincentivized to a property in the REIT or in the JV.
• With the availability of debt financing, and cap-rates at low levels REITs are still incented to access "cheap"JV/fund equity vs. issuing their own common stock or other more expensive forms of capital.
2 Moody’s Special Comment

WHAT HAPPENS NEXT?We believe the following trends are likely to occur over the short term in regards to REITs' use of JV and fundstructures:
• The percentage stakes retained by REITs are likely to fall, in an effort to create further operating leverage.However, when REIT's co-invest in the funds (as they usually do) there is an alignment of interests with theinstitutional partner, which tends to increase the longevity of the venture and related fees.
• Some REITs could become preponderantly real estate investment management firms, rather than directinvestors.
• There will be a greater stratification between the REITs that are really adept at the JV/fund business andthose that are not. Those that are not may find themselves stuck with some awkward deals.
• Because JV/fund arrangements limit a REIT's cash outlay, they are particularly attractive when theinvestment does not yield an immediate or attractive return. Some REITs employ JVs/funds to fund theirdevelopment activities for this reason.
MOODY'S APPROACH TO JV/FUNDS ANALYSISReflecting the matters discussed above, Moody's has historically applied up to a 50% haircut to JV/fund income if weconsider it to be "one -off" in nature (i.e., acquisition and disposition fees, development fees, promotes etc.), or applieda smaller haircut if it is related to management fees on what are deemed to be longer term ventures. (See additionaldiscussion of Moody's analytical approach to JV/funds on page 8). Actions that would cause Moody's to providegreater weight to JV/fund cash flows are 1) growth in size and diversity of the JVs/funds, 2) laddering of dealmaturities, 3) a consistently demonstrated ability to create new funds or refinance existing ones, 4) preference formanagement fees over promote and success fees, 5) consistent financial success of the JVs/funds, 6) structures withlong lives, and 7) sound management infrastructures to operate a JV/funds business.
JVs and Funds: Basics and Trends
JVs and funds are similar in that they are both multi-investor vehicles used to divide and share in the ownership ordevelopment of real estate. As displayed in the chart below for a sample of REITs, income related to these vehiclescontinues to grow in total amount as well as a percentage of revenue. Moody's expects this growth to continue.Recent activity includes Liberty Property Trust's formation of a £124 million UK joint venture with Doughty Hansonin December 2005, and ProLogis' announcement in February 2006 that it has formed a $4 billion North Americanindustrial property fund. Both REITs will retain a 20% interest in their respective structures.
JV and Property Fund Fee Income - 2001 through 2005
Notes: 1. Based on data from AMB, BRE, CNT, CPT, DDR, DRE, FR, GGP, KIM, LRY, PLD, REG, SPG. VNO, WRI2. Many REIT's do not disclose fees from JV and Property Funds, in certain instances analysis based on total "management fees" or similar caption.3. CNT 2005 results based on annualized 9 months ended 9/30/054. GGP 2005 adjusted for Rouse acquisition
$0
$50,000
$100,000
$150,000
$200,000
$250,000
$300,000
$350,000
$400,000
2001 2002 2003 2004 2005
$ of
reve
nue
0.0%
0.5%
1.0%
1.5%
2.0%
2.5%
3.0%
3.5%
% of total revenue
JV and Property Fund Fee Income JV and Property Fund Fee Income % of total revenue
Moody’s Special Comment 3

JOINT VENTURE BASICSREIT JVs are typically two-party partnerships established to divide and share in the ownership or development of realestate. In one type of JV, the REIT partners with an entity such as an insurance company, private owner or pensionfund that seeks to own a long-term interest in a property. The partner contributes capital, expertise and/or theproperty itself, and the REIT brings its capital and expertise, and typically manages the property. These JVs usuallyterminate after a predetermined period of years, often with one partner buying out the other's interest. Sometimessuch JVs are entered into to dilute an individually large asset (uncommon), or by a private owner interested in partiallyliquidating its investment (also uncommon), or to tap into the expertise of a partner (uncommon for institutional orprivate owners, though some find it useful to benefit from, say, a large mall REIT's expertise and footprint; REITsexpanding into new, perhaps international, markets can and do find partners helpful). In the past, the ownership splitwas often 50/50, though there is more interest from REITs in taking smaller stakes to achieve greater operatingleverage. The REIT will typically manage the JV, and receive various fees for doing so.
JVs are also formed to facilitate development. These JVs involve a REIT partnering with a real estate developerand are of relatively short duration (though there may be serial deals), with the REIT not only managing thecompleted property, but also taking responsibility to buy the developer's interest when construction is complete. Ineffect, such transactions are off-balance sheet development financing for the REIT. For example, AMB PropertyCorporation had development and renovation projects with an estimated total investment of $1.1 billion in progress atYE05. AMB's ownership of these projects ranged from 20% to 100%.
REAL ESTATE FUNDSSimilar to JVs, real estate funds are typically multi-investor vehicles, which include some level of co-investment andsometimes merchant building by the REIT, which manages the fund and the fund's properties, and sources and sellsinvestments. The partners usually contribute capital only and the REIT brings its expertise in development, assetmanagement, leasing and property management, which generate fee income for the REIT. These funds usuallyterminate after a predetermined period of years, generally with the funds dissolved through sale of the assets amongthe partners and/or to third parties or replacement of partners. However, fund extensions and infinite life funds aregrowing in number. More so than JVs, funds can best be seen as a new and distinct line of business – third-partyproperty investment for institutional investors – with all the attendant risks and opportunities.
Q: WHY DO REITS USE JV/FUND STRUCTURES?
A: ENHANCED NOMINAL RETURNSWhy do REITs continue to use these structures? Both JVs and Funds allow REITs to reduce their real estate capitalinvestment, yet enhance revenues through fee income, and operational scope by increasing the number of propertiesunder management — effectively "leveraging" management income relative to contributed capital, and thus boostingequity returns. In theory and practice, JVs and funds diversify and augment REITs' income streams bysupplementing capital appreciation and direct rental revenue with fees from activities such as property managementand leasing. However, the JV business model retains a sizable real estate capital investment, and therefore has a heftycomponent of capital appreciation and lease revenue relative to management fees to achieve a total return. Evenfunds involve at least some (often ~20%) capital investment by the REIT, and therefore represent a purchase of amanagement contract with a material equity "kicker." The fee revenue is typically supplemented with variousacquisition, sale and performance fees. The number of properties is also more than in JVs.
In today's low cap rate property environment, and with mortgage finance often viewed as being cheap,plentiful and on easy terms, often one way REITs can make performance from acquisitions pencil out at abovetheir own costs of capital, and to grow, is to use JVs or funds, and more leverage.
4 Moody’s Special Comment

The enhanced nominal return that can be achieved through JV/Fund structures is demonstrated in thefollowing example. Assume a REIT just starting out has $15 million of cash to invest and a leverage tolerance of50% for wholly owned properties, but its JVs can be levered with mortgages to 60% at the property level. TheREIT can earn the following fees:• For properties owned outright, it earns operating income through rents equal to 10% of property fair value
(purchase price in this example). Therefore, if the REIT invests its original $15 million and an additionalborrowed $15 million in property valued at $30 million, annual operating income would be $3 million.
• If the REIT invests via a JV and manages the JV's properties, the REIT would earn a management fee of5% of the JV's operating income from rents (calculated at 10% of property value, as above for propertieswholly owned and before the management fee). In addition, the REIT would earn its share of directoperating income (less the pro rata management fee). For example, if the REIT invests its $15 million in a25% interest in a property-owning JV, the total JV equity value would be $60 million, which can beleveraged at 60% for total property investment of $150 million. Here, the REIT would earn $4.4 million,broken into the following components:■ $750,000 from its management fee ($150 million x 10% operating income margin x 5% management fee)■ $3.6 million from its direct ownership ($150 million x 10% operating income margin x (1 – .05) to
reflect management fee x 25% ownership percentage). Highly aggressive scenario — The following example illustrates how a REIT's reported return on assets, return onequity and leverage can be enhanced through the use of JV's. The assumptions used in this example (the same as thoseabove) are that a REIT begins with $15 million in cash and equity, has a leverage tolerance of 50% at the property levelfor wholly owned properties and a leverage tolerance of 60% at the property level for properties owned by a JV. Thefees the REIT can earn from its property and JV investments are the same as those outlined above. Using theseassumptions under three scenarios - no JV investments, one-third of investable cash in a 25% ownership in a JV, andtwo-thirds of investable cash in a 25% ownership in a JV - are reviewed below. As shown, JV structures can helpREITs enhance reported returns, but when the REIT's pro rata share of the JV assets and debt is grossed-up on itsGAAP balance sheet, one can see the leverage effects, too.
$ in thousands No JVs 1/3 JVs 2/3 JVs
Wholly Owned Properties $30,000 $20,000 $10,000JV Value (Equity Method Accounting) 0 5,000 10,000Total GAAP Assets 30,000 25,000 20,000Debt 15,000 10,000 5,000Equity 15,000 15,000 15,000
Total JV Assets 0 50,000 100,000Total JV Mortgage Debt 0 30,000 60,000
Pro rata share of JV Assets 0 12,500 25,000Pro rata share of JV Debt 0 7,500 15,000
Operating income related to 100%-owned properties 3,000 2,000 1,000Operating income related to share of property in JVs 0 1,188 2,375Fee income from JVs 0 250 500Total Operating Income 3,000 3,438 3,875
Key Ratios Excluding Pro Rata Share of JV
Return on assets 10.0% 13.8% 19.4%Return on Equity 20.0% 22.9% 25.8%Debt/Equity 1x 0.67x 0.33x
Key Ratios Including Pro Rata Share of JV
Return on assets 10.0% 10.6% 11.1%Return on Equity 20.0% 22.9% 25.8%Debt/Equity 1x 1.17x 1.33x
Moody’s Special Comment 5

As illustrated in the table below, the return on a REIT's capital invested through a JV or Fund, according to thescenarios outlined above, combined with fees the REIT typically earns for management and leasing, inter alia, result inhigher GAAP asset returns and lower GAAP leverage than from direct property investment alone. However, when theREIT's pro rata share of the JV balance sheet is considered, the returns can decrease and leverage increase.
In general, due to the limited disclosures many REITs provide on an individual JV or fund basis, the exact effectsof these structures on returns and leverage can be difficult to quantify or to adjust for in order to determine alternate,risk-adjusted returns and gearing.
WHAT OTHER BENEFITS ARE THERE FROM JVs/FUNDS?Although revenue growth and ROE enhancement have been important drivers behind the increase in JV/fund volume,JV/funds can provide additional benefits to REITs, including the following:Perceived to be Cheaper and Additional Sources of Capital — Investments through JV/fund arrangements are analternative source of capital for REITs. Not only do they tap into other, usually institutional, capital pools, but the defacto "letter stock" issued to partners is perceived to be cheaper capital. In addition, the JVs/funds can be levered withnon-recourse debt secured by the JV/fund properties – perhaps at higher levels than the REIT itself.Relationship Benefits — REITs can benefit from JV/funds through sharing the partner's expertise and businessrelationships. A construction partner, for example, might have local market or technical expertise, relationships withsubcontractors, good materials sources or special familiarity with governmental approval processes. The REIT mightalso leverage a JV/fund experience with a partner into a longer term relationship, with preferred status on newtransactions. Repeated transactions can increase the familiarity between REITs and institutional partners in regards toinvestment requirements and processes, reducing their transaction costs and increasing transaction volume.Relationships with partners can be of particular value in new markets, especially overseas. Simon Property/Chelsea inJapan, ProLogis in Europe and Asia, and AMB in Mexico are examples.Greater Size and Scope of Control — Through JVs/funds, a given amount of REIT capital can control more assets,and thus help strengthen a REIT's leadership in a property sector or geographic area. This leadership can also benefitthe REIT in its relationships with tenants and vendors.
Return on Assets and Debt to Equity Ratios
0%
5%
10%
15%
20%
25%
30%
No JVs 1/3 JVs 2/3 JVs
Retu
rn o
n As
sets
/Equ
ity
0
0.2
0.4
0.6
0.8
1
1.2
1.4
Debt to Equity
Return on assets - Excluding prorata share of JVReturn on assets - Including prorata share of JVReturn on Equity - Including/excluding prorata share of JVDebt/Equity - Excluding prorata share of JVDebt/Equity - Including prorata share of JV
6 Moody’s Special Comment

WHAT ARE THE COSTS OF JVs/FUNDS?Strategic and Financial Burdens — JVs/funds constrain REITs' strategic flexibility. Although JV/fund arrangementstypically provide for the REIT to retain control over the day-to-day operations of the properties, as a practical matterthe REIT does have to answer to its partners in management of the properties. Furthermore, material decisions suchas sale, financing, reconstruction and expansion typically require at least consultations with partners, if not formalapproval, though such burdens tend to be less onerous with funds. Such circumstances can impair a REIT's controlover assets, and strategic flexibility. Such costs are complex, are often opportunity costs, and tend to be back-ended.Liquidity — In general, equity stakes in JVs/funds have limited liquidity – more so than for wholly owned properties.The use of pro rata accounting for analytic purposes, useful though it is, masks the fact that in the credit world, youneed to deal with the unconsolidated company, and in this case a REIT's claim is on equity in a JV or fund, not a deedon a property.Increase in Earnings Volatility — In theory, JV/fund business models could provide more diverse and stable incomestreams than the traditional REIT long-term, wholly owned property investment model. However, as displayed in thechart below for a sample of REITs (using REITs that disclose sufficient public data to perform the analysis), JV andfund income can display more volatility than REIT revenue as a whole, some of which may be due to the current highgrowth rate and early stage development for most firms. The chart displays the coefficient of variation for totalrevenues versus JV and fund fee income for 2001 through annualized 2005. The coefficient of variation, calculated bydividing the standard deviation of a data set by its mean, expresses how much dispersion exists relative to the mean, andpermits direct comparison of different data sets. In essence, this represents how much volatility (risk) you are assumingin comparison to the expected return (mean) – simply put, the lower the coefficient of variation, the better the risk/return trade-off. Although some REITs show a coefficient of variation for JV/fund revenues that is similar to theirtotal revenues, for the majority of our sample, the JV and fund income volatility represents a higher risk for theexpected return in comparison to the REIT as a whole. This volatility may decrease as REITs become more familiarwith JVs/funds, and grow their funds businesses with more transaction layering. It should be noted that there tends tobe more stability in the core property management and leasing fees that a REIT earns. However, the management feein a fund can be the highest priority flow — it comes ahead of debt service and the net cash flow distributed to thepartners. Also, when REIT's co-invest in the funds (as they usually do) there is an alignment of interests with theinstitutional partner, which tends to increase the longevity of the venture and related fees.
Coefficient of variation - Total revenues vs. JV and Property Fund Fee Income - 2001 through 2005
Notes: 1. Based on data from AMB, BRE, CNT, CPT, DDR, DRE, FR, GGP, KIM, LRY, PLD, REG, SPG. VNO, WRI2. Many REIT's do not disclose fees from JV and Property Funds, in certain instances analysis based on total "management fees" or similar caption.3. CNT 2005 results based on annualized 9 months ended 9/30/054. GGP 2005 adjusted for Rouse acquisition
0%
20%
40%
60%
80%
100%
120%
AMB BRE CNT CPT DDR DRE FR GGP KIM LRY PLD REG SPG VNO WRI
%
Coefficient of variation of total revenues Coefficient of variation of JV and Property Fund Fee income
Moody’s Special Comment 7

The Matter of Nonrecourse JV/Fund Mortgages — An additional credit issue is the degree to which the REIT limitsits exposure on JV/fund non-recourse mortgages. Another potential back-ended cost, one should consider thepressures that might exist to induce a REIT to contribute towards satisfaction of even non-recourse mortgages. REITsare dependent on access to the capital markets, and walking away from even a non-recourse JV/fund-related debtcould send a negative signal, especially if the property has become a strategic holding of the REIT. In mostcircumstances, Moody's accords limited benefit for the non-recourse feature.Exit Strategy — Though it varies from case to case, JVs/funds can have structures in place to govern when assets are tobe sold, and how. In some such cases, the REIT is de facto, if not de jure, obligated to take the asset on to its own balancesheet. This creates funding, liquidity and asset risk. Also, breaking up can be hard to do, even with a clear contract.Conflicts of Interest — In regards especially to funds, there are potential conflict issues to consider between the REIT,which has its own assets and business, and those of its fellow investors. While good structures, such as rules on whogets first priority for an asset or tenant, or requiring all transactions in a specified sector to be fund-exclusive, it isdifficult to achieve complete comfort here. This back-ended cost may not only be experienced in relationship disputes,but in legal liability, too, given, e.g., fiduciary duties.Adverse Asset Selection — The quality of assets "shared" through a JV/fund should also be considered. If the REIT'sbetter properties are held through such structures, its bondholders end up with weaker assets supporting them. Thiscould become the case should the REIT find itself in difficulty, and need to liquidate assets to generate cash. Use of Management Time — JVs/funds can utilize substantial management time, and can become a distraction from aREIT's core business. This cost is real and can be high. There is also a need to build a separate operational structure.Weakened Transparency — Investors' ability to track JV/fund performance, understand the fee, financing and otherstructures, and determine the REIT's earned income from JVs/funds can be limited. Best practice would be for a REITto provide sufficient information to determine whether a JV/fund should be fully consolidated, pro rata consolidated orresult in equity/cost accounting and, if a full or pro rata consolidation is deemed warranted, the performance of such. Forexample, Moody's would consider the following disclosures useful to complete these objectives:1. Purpose/strategy of JV/fund (merchant building, property acquisition, etc.)2. Level and scope of REIT's management activity, including how REIT's fees, including performance fees, are
determined, and what the fees are3. Ownership percentages4. Key financial information: gross property assets, total debt, third-party debt, other intercompany balances, total
liabilities or equity5. Identity of partners
JV/fund assets and debt are almost always reported off-balance sheet, allowing REITs to achieve an improvementin reported (albeit normally not actual) financial condition. (See example on beginning page 5.) This reflects the factthat JVs/funds are often more highly levered than the REIT itself, and levered with mortgage debt. As a result, thefollowing benefits appear to occur:
• Makes debt appear lower than it really is• Higher ROA than actual• Creates a perception of decreased sensitivity to property value declinesMoody's believes that the financial reporting of JV/funds as required by GAAP falls short of providing investors a
full picture. Therefore, Moody's looks through each JV/fund structure to determine the REIT's true debt exposuresand financial flexibility. This generally means considering either attributing the REIT's pro rata share of the JV/fund'sassets and liabilities to the REIT, or fully consolidating the JV/fund into the REIT. Reporting a REIT's JV/fund"equity" as a partnership interest rather than as its constituent asset and funding parts masks the underlying leverage ofthe property, though it helps highlight the liquidity and subordinated cashflow characteristics of these structures.Funds Are an Untested Business – Although some REITs have been successfully using these structures for some time,the Fund business is, at its heart, a new, distinct business line, and it is not yet clear that REITs will be successful in itlong term. And do the costs – all of the costs – generate a competitive risk-adjusted return vis-à-vis wholly ownedassets? We also note that the surge in fund activity has been occurring in a positive environment for institutionalproperty investing. Establishing new funds can be a challenge.
8 Moody’s Special Comment

Lack of Collateral – Revenues from rents on properties are more predictable and easier to replace, and there is theproperty itself "collateralizing" the cash flows that can also be sold in well established markets. Management fees, bycontrast, tend to terminate at some point, are not as liquid as deeds on properties, and do not have the "collateral"characteristic. Unsecured debt of a REIT with cash flows from rents on properties are, in effect, quasi-collateralized bythe properties, especially for REITs with standard bond covenants.
WHAT'S THE EARNINGS MULTIPLE?A large issue continues shaping up over what multiple investors should use to value JV/fund cash flows, especially fees.The multiple currently appears to be below REITs' traditional businesses. Should this multiple not rise on its ownaccord to what is deemed an appropriate level, some REITs might undertake actions to help achieve such a result – andit is unclear how, if at all, such actions would affect creditworthiness.
MOODY'S TREATMENT OF REIT JVs AND FUNDS
Quantitative and Qualitative Considerations for Balance Sheet TreatmentMoody's recently discussed its analytical approach to these structures in "Rating Methodology for REITs and OtherCommercial Property Firms," January 2006 available at www.moodys.com. Moody's has expanded and deepened thatgeneral framework, as described below.
Although Moody's considers a significant number of qualitative factors in determining the analytical treatment forREITs' JVs/funds, our analysis begins by applying the following quantitative factors to an individual JV/fund todetermine if it will be fully consolidated, pro rata consolidated, or treated as a cost/equity method investment in aREIT's financial statements. After this initial quantitative assessment, qualitative factors are considered to determineif a treatment different from the quantitative outcome is appropriate.
1. The following characteristics result in full consolidation:i. an equity stake of greater than 50%, and ii. involvement in managing the properties in the JV/fund
2. The following characteristics result in pro rata consolidation:i. an equity stake greater than 50%, and ii. no participation in managing properties in the JV/fund
Oriii. an equity stake of 20% to 50%, and iv. involvement in managing the properties in the JV/fund
3. The following characteristics result in equity, or cost method, accounting (primarily equity method except forinstances of very low ownership):i. an equity stake of 20% to 50%, and ii. no participation in managing properties in the JV/fund
Oriii. an equity stake less than 20%
If the properties are deemed to be "mission-critical" for the REIT, we would tend to do a full consolidation,regardless of REIT ownership level.
Moody’s Special Comment 9

The qualitative factors that Moody's considers to determine the analytical treatment of individual JVs/funds include:• Nature and purpose of structure: Merchant building, JVs, Funds
■ Merchant building – Normally these are short-term arrangements in which the REIT is committed to buythe property when developed. These are often fully consolidated as Moody's considers these to be off-balance sheet development financing due to the REIT's residual risk to purchase property.
■ JV – Property acquisition/investment vehicles. Often pro rata consolidated as risk/rewards are sharedbetween REIT and partner under many structures.
■ Funds – Normally institutional investment vehicles in which the REIT takes a small stake to demonstrateparallelism of interest, and is normally focused on management and other fees, such as promotes.
• Timing and process to liquidate (buy-out provisions)• Any guarantees/funding agreements among investors in the JV/fund• Rights of JV/fund partners (kick outs, participations) and any history of using these rights• Types of management activities performed• Amount (if any) of financing provided to JV/fund by owners• Likelihood of REIT providing non-contractual support to the JV/fund• REIT's "normal" timeframe for holding JV/fund investments• Character of properties• Size of JV/fund in comparison to overall REIT operations• Strength of partners• Management strategy, and how fees might affect REIT's decision-making
Income Statement Treatment of EarningsAs previously discussed, Moody's has concerns regarding the sustainability and volatility of JV/fund fee revenue.Therefore, in most situations when analyzing a REIT's income statement, Moody's will reduce JV/fund fees (be theyasset and property management and leasing fees, promotes, success fees for exceeding agreed-upon rates of return,etc.) in each period to the REIT's four or five year historical average. This is a downside adjustment only – Moody'swill not adjust these fees upward in periods with weak fee results.
However, this adjustment is normally not performed when a REIT exhibits fees that are a low percentage of totalrevenues and have a low standard deviation. In these situations, as fee income from JV/funds are not a significantportion of overall revenue and there is not significant variability in these revenues, Moody's would be unlikely to makeadjustments to these amounts.
Consolidation Decision Tree
Determineequity
ownership
>50% equity ownership20% to 50% equity ownership
Determineinvolvement
inmanagingJV/fund
None AllShare None Share All
Equity/Cost
FullFullPro rataEquity/Cost
Equity/Cost
AnalyticalTreatment
<20% equity ownership
None Share All
Pro rataPro rataEquity/Cost
10 Moody’s Special Comment
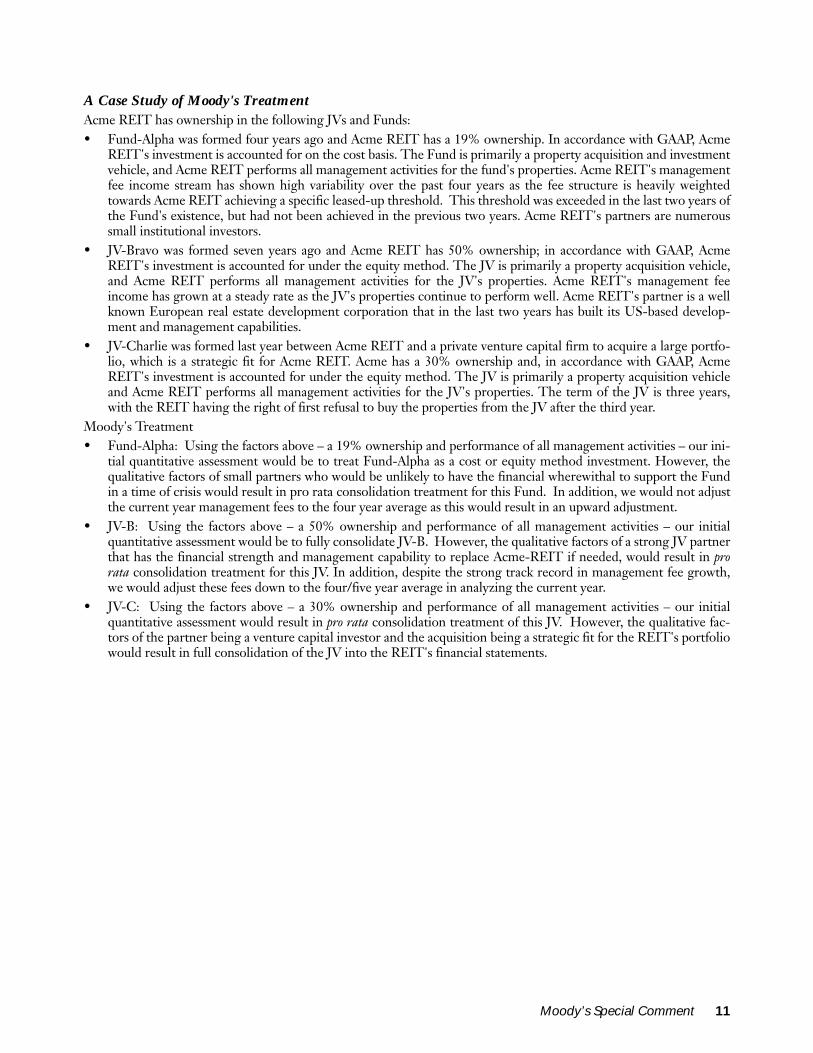
A Case Study of Moody's TreatmentAcme REIT has ownership in the following JVs and Funds:• Fund-Alpha was formed four years ago and Acme REIT has a 19% ownership. In accordance with GAAP, Acme
REIT's investment is accounted for on the cost basis. The Fund is primarily a property acquisition and investmentvehicle, and Acme REIT performs all management activities for the fund's properties. Acme REIT's managementfee income stream has shown high variability over the past four years as the fee structure is heavily weightedtowards Acme REIT achieving a specific leased-up threshold. This threshold was exceeded in the last two years ofthe Fund's existence, but had not been achieved in the previous two years. Acme REIT's partners are numeroussmall institutional investors.
• JV-Bravo was formed seven years ago and Acme REIT has 50% ownership; in accordance with GAAP, AcmeREIT's investment is accounted for under the equity method. The JV is primarily a property acquisition vehicle,and Acme REIT performs all management activities for the JV's properties. Acme REIT's management feeincome has grown at a steady rate as the JV's properties continue to perform well. Acme REIT's partner is a wellknown European real estate development corporation that in the last two years has built its US-based develop-ment and management capabilities.
• JV-Charlie was formed last year between Acme REIT and a private venture capital firm to acquire a large portfo-lio, which is a strategic fit for Acme REIT. Acme has a 30% ownership and, in accordance with GAAP, AcmeREIT's investment is accounted for under the equity method. The JV is primarily a property acquisition vehicleand Acme REIT performs all management activities for the JV's properties. The term of the JV is three years,with the REIT having the right of first refusal to buy the properties from the JV after the third year.
Moody's Treatment• Fund-Alpha: Using the factors above – a 19% ownership and performance of all management activities – our ini-
tial quantitative assessment would be to treat Fund-Alpha as a cost or equity method investment. However, thequalitative factors of small partners who would be unlikely to have the financial wherewithal to support the Fundin a time of crisis would result in pro rata consolidation treatment for this Fund. In addition, we would not adjustthe current year management fees to the four year average as this would result in an upward adjustment.
• JV-B: Using the factors above – a 50% ownership and performance of all management activities – our initialquantitative assessment would be to fully consolidate JV-B. However, the qualitative factors of a strong JV partnerthat has the financial strength and management capability to replace Acme-REIT if needed, would result in prorata consolidation treatment for this JV. In addition, despite the strong track record in management fee growth,we would adjust these fees down to the four/five year average in analyzing the current year.
• JV-C: Using the factors above – a 30% ownership and performance of all management activities – our initialquantitative assessment would result in pro rata consolidation treatment of this JV. However, the qualitative fac-tors of the partner being a venture capital investor and the acquisition being a strategic fit for the REIT's portfoliowould result in full consolidation of the JV into the REIT's financial statements.
Moody’s Special Comment 11

Appendix I
A PRIMER ON JV ACCOUNTINGCurrent Accounting GuidanceTo determine the appropriate accounting for joint ventures, most REITs have looked to AICPA Statement of Position78-9, Accounting for Investments in Real Estate Ventures ("SOP 78-9"), presuming the ventures do not qualify as variableinterest entities under FASB Interpretation No. 46 Consolidation of Variable Interest Entities. SOP 78-9 providesguidance on the following legal structures (this approach is being replaced as discussed below):• Corporate joint ventures or general partnerships – Corporate joint ventures and general partnerships, where no
single investor owns greater than half of the voting stock or otherwise controls the venture, are accounted forunder the equity method by all owners. The equity method results in single line item recognition of the investors'proportionate share of the ventures' net book value and net income on its balance sheet and income statement,respectively. Situations where a single investor owns greater than 50% or otherwise controls an entity are consid-ered to be corporate subsidiaries and would be consolidated by the controlling owner. Pro rata consolidation isnot permitted.
• Limited Partnerships – General partners are considered to control, and therefore consolidate, limited partner-ships, unless the limited partners have "important rights," for example the ability to replace the general partner orapprove principal asset sales or purchases. In this case the limited partnership could be under control of a limitedpartner, in which case the limited partner would consolidate. Non-consolidating partners would use the equity orcost method of accounting.
• Undivided Interests – If real property is subject to joint control, investors should use the equity or cost method ofaccounting. If joint control is not present, and each investor is entitled to only its pro rata share of income, respon-sible for its pro rata share of expenses, and is severally liable only for indebtedness it incurs in connection with itsinterest in the property, the interest may be presented on a pro rata basis.
New Guidance for 2005 Financial StatementsHowever, the guidance for limited partnerships in SOP 78-9 as discussed above is being replaced by Emerging Issues TaskForce Issue 04-05, Determining Whether a General Partner, or the General Partners as a Group, Controls a Limited Partnershipor Similar Entity When the Limited Partners Have Certain Rights ("EITF 04-05"). EITF 04-05 requires:
1. A presumption that the general partner(s) controls a limited partnership and therefore must consolidateregardless of the general partner's level of ownership interest in the limited partnership.
2. This presumption can be overcome (and the general partner uses the equity method of accounting) if thelimited partners have either:a) "Substantive Kick-out Rights" — which is the substantive ability to dissolve the limited partnership or
remove the general partners without cause. The rights are considered substantive if they:1) Can be exercised by a simple majority, and 2) There are no substantive barriers to exercise (such as financial penalties, etc.)
b) "Substantive Participating Rights" — which are the rights to participate in significant business decisionsthat would be expected to be made in the ordinary course of the partnership's business.
The former "important rights" model is considered to be more "protective" in nature versus the more stringent"participating" nature of EITF 04-05, similar to the methodology presented in Emerging Issue Task Force Issue 96-16, Investor's Accounting for an Investee When the Investor Has a Majority of the Voting Interest but the Minority Shareholderor Shareholders Have Certain Approval or Veto Rights, as amended on June 29, 2005 ("EITF 96-16"). For example, theability of a limited partner to block the sale of a factory by a partnership whose business is manufacturing would beconsidered protective and would qualify as an important right, but not as a substantive participating right. To beconsidered a substantive participating right the limited partner would need to have the right to block asset sales in theordinary course of business — the sale of a factory would not usually occur in the normal course of business for amanufacturing entity.
NB: The FASB specifically considered REITs, and worded EITF 04-05 and amended EITF 96-16 so that a sale ofassets representing a significant percent of the partnership's total assets (for example, REIT property sales) would notbe precluded from being considered in the ordinary course of business, and therefore the ability to block theseactivities could be considered a substantive participating right versus a protective right.
EITF 04-05 is effective as of June 29, 2005 for new or modified joint ventures and for existing joint ventures for allreporting periods after December 15, 2005.
12 Moody’s Special Comment

Appendix II
JV/FUND FINANCIAL STATEMENT DISCLOSURESREITs' public financial statement disclosures regarding JV/Fund activities run the gamut from clear andcomprehensive to thin and vague. Comprehensive and clear disclosure would provide sufficient information to allowfor the determination if a JV/fund should be fully consolidated, pro rata consolidated, or result in equity/costaccounting, and if a full or pro rata consolidation is considered warranted, the ability to do so.
Disclosures that would help to achieve these objectives would include:• Purpose/strategy of JV/fund (e.g., merchant building, property acquisition, redevelopment)• Current level and scope of REIT management activity, and character of fee streams• Ownership percentages• Key financial information: total assets, gross property assets, total debt, third-party debt, total liabilities,
equity• Identity of partners• Wind-up provisions• JV/fund encumbered assets and restrictions on sales• Rights of partners• Guarantees and funding agreements from REIT and partners• Timing and process to liquidate (buy out provisions, etc.)Certain REITs disclose either pro forma financial statements that consolidate each JV/fund on a pro rata basis, or a
supplemental set of financial statements that aggregate the REIT's portion of the JV/fund's assets and liabilities intotal. Although these disclosures are helpful, they do not allow an analysis that is a mix of full or pro rata consolidationbased on the circumstances of each JV/fund. In addition, some REITs only provide certain information on their JV/fund activities at the time of the JV/fund's inception. Carrying this disclosure forward would improve transparency.
Moody’s Special Comment 13

Related Research
Special Comment:Observations Of Governance In U.S. REITs: Some Weaknesses, Getting Better, September 2005 (94031)Rating Methodologies:Rating Methodology for REITs and Other Commercial Property Firms, January 2006 (96211)Key Ratios For Rating REITs And Other Property Firms, December 2004 (91014)
To access any of these reports, click on the entry above. Note that these references are current as of the date of publication of this reportand that more recent reports may be available. All research may not be available to all clients.
14 Moody’s Special Comment

PAGE INTENTIONALLY LEFT BLANK

© Copyright 2006, Moody’s Investors Service, Inc. and/or its licensors and affiliates including Moody’s Assurance Company, Inc. (together, “MOODY’S”). All rights reserved. ALLINFORMATION CONTAINED HEREIN IS PROTECTED BY COPYRIGHT LAW AND NONE OF SUCH INFORMATION MAY BE COPIED OR OTHERWISE REPRODUCED, REPACKAGED,FURTHER TRANSMITTED, TRANSFERRED, DISSEMINATED, REDISTRIBUTED OR RESOLD, OR STORED FOR SUBSEQUENT USE FOR ANY SUCH PURPOSE, IN WHOLE OR IN PART, INANY FORM OR MANNER OR BY ANY MEANS WHATSOEVER, BY ANY PERSON WITHOUT MOODY’S PRIOR WRITTEN CONSENT. All information contained herein is obtained byMOODY’S from sources believed by it to be accurate and reliable. Because of the possibility of human or mechanical error as well as other factors, however, such information is provided “asis” without warranty of any kind and MOODY’S, in particular, makes no representation or warranty, express or implied, as to the accuracy, timeliness, completeness, merchantability or fitnessfor any particular purpose of any such information. Under no circumstances shall MOODY’S have any liability to any person or entity for (a) any loss or damage in whole or in part caused by,resulting from, or relating to, any error (negligent or otherwise) or other circumstance or contingency within or outside the control of MOODY’S or any of its directors, officers, employees oragents in connection with the procurement, collection, compilation, analysis, interpretation, communication, publication or delivery of any such information, or (b) any direct, indirect,special, consequential, compensatory or incidental damages whatsoever (including without limitation, lost profits), even if MOODY’S is advised in advance of the possibility of suchdamages, resulting from the use of or inability to use, any such information. The credit ratings and financial reporting analysis observations, if any, constituting part of the informationcontained herein are, and must be construed solely as, statements of opinion and not statements of fact or recommendations to purchase, sell or hold any securities. NO WARRANTY,EXPRESS OR IMPLIED, AS TO THE ACCURACY, TIMELINESS, COMPLETENESS, MERCHANTABILITY OR FITNESS FOR ANY PARTICULAR PURPOSE OF ANY SUCH RATING OR OTHEROPINION OR INFORMATION IS GIVEN OR MADE BY MOODY’S IN ANY FORM OR MANNER WHATSOEVER. Each rating or other opinion must be weighed solely as one factor in anyinvestment decision made by or on behalf of any user of the information contained herein, and each such user must accordingly make its own study and evaluation of each security and ofeach issuer and guarantor of, and each provider of credit support for, each security that it may consider purchasing, holding or selling. MOODY’S hereby discloses that most issuers of debt securities (including corporate and municipal bonds, debentures, notes and commercial paper) and preferred stock rated byMOODY’S have, prior to assignment of any rating, agreed to pay to MOODY’S for appraisal and rating services rendered by it fees ranging from $1,500 to $2,400,000. Moody’s Corporation(MCO) and its wholly-owned credit rating agency subsidiary, Moody’s Investors Service (MIS), also maintain policies and procedures to address the independence of MIS’s ratings and ratingprocesses. Information regarding certain affiliations that may exist between directors of MCO and rated entities, and between entities who hold ratings from MIS and have also publiclyreported to the SEC an ownership interest in MCO of more than 5%, is posted annually on Moody’s website at www.moodys.com under the heading “Shareholder Relations — CorporateGovernance — Director and Shareholder Affiliation Policy.” Moody’s Investors Service Pty Limited does not hold an Australian financial services licence under the Corporations Act. This credit rating opinion has been prepared without taking intoaccount any of your objectives, financial situation or needs. You should, before acting on the opinion, consider the appropriateness of the opinion having regard to your own objectives,financial situation and needs.
16 Moody’s Special Comment
To order reprints of this report (100 copies minimum), please call 1.212.553.1658.Report Number: 97276
Authors Senior Associate Production Associate
Philip Kibel Griselda Bisono Wing ChanCraig Emrick
Industry Outlook
New YorkPhilip Kibel, CPA 1.212.553.1653Christopher Wimmer, CFAMerrie Frankel, Esq.Brian Harris, CPAKaren Nickerson, CPACraig Emrick, CPALori MarksMaria MaslovskyAngela BurriesciDaniel MichlesGriselda BisonoElaina KozyrLin Zheng
John J. KrizManaging DirectorReal Estate Finance
Contact Phone
October 2006
US REIT and REOC Industry Study
Stable Rating Outlook
Summary Opinion
Moody’s maintains a stable rating outlook for US REITs and REOCs. REITs have continued to prudently manage theirbalance sheets, with leverage and secured debt levels flat to up modestly in 2006, with increasing fixed charge coverageand operating margins. This is reflected by the mostly positive trend in Moody’s rating actions that have occurred sincethe beginning of 2005, as well as the increased number of companies on the cusp of moving from the “Baa” category tothe “A” category, and the percentage of companies with positive outlooks versus negative, 16% to 2%.
Despite mostly positive US REIT and REOC rating movement by Moody’s, this has not been the case withM&A-related transactions, where increased leverage and secured debt often figure prominently. This activity may bewaning as institutional investors’ money is more fully put to work. Development has also been picking up in an effortto generate some earnings momentum in an environment where positive cash-on-cash acquisitions are difficult tosource, though not (yet) to a level and of a character to create rating concern. Moody’s remains cautious with respect tojoint ventures and funds. These pursuits have enabled companies to enhance book earnings, build relationships andreduce concentrations, among other benefits. On the flip side, Moody’s takes a cautious view here due to controlissues, lower transparency, management diversion and cash flow uncertainty.

REIT Financial Ratios
Source: Moody'sIncludes firms in Industrial, Office, Mutlifamily, Retail, Healthcare and Lodging sectors
US REIT & REOC Ratings History
Includes all Rated REITs & REOCs by Moody's through 8/31/06
0%
10%
20%
30%
40%
50%
60%
2003 2004 2005 2006H1
Leve
rage
2.00
2.20
2.40
2.60
2.80
3.00Coverage
Debt + Pfd Equity / Gross Assets Secured Debt/ Gross Assets
Variable Debt/ Total Debt EBITDA / (Int Exp + Prf Div)
2000 2001 2002 2003 2004 2005 2006
Baa3
Ba1
Baa2
Baa1
A3
Ba2
Ba3
B1
2 Moody’s Industry Outlook

Moody’s Rating Distribution for US REITs & REOCs
Includes all U.S. REITs & REOCs with rated senior unsecured debt as of 8/31/06
REIT Rating ActionsUpgrades vs. Downgrades
As of 8/31/06
0
5
10
15
20
25
≥A3 Baa1 Baa2 Baa3 Ba1 Ba2 Ba3 B1 ≤B2
# of
Com
pani
es
0
4
8
12
16
2002 2003 2004 2005 2006
# of
Rat
ing
Actio
ns
Upgrade Downgrade
Moody’s Industry Outlook 3
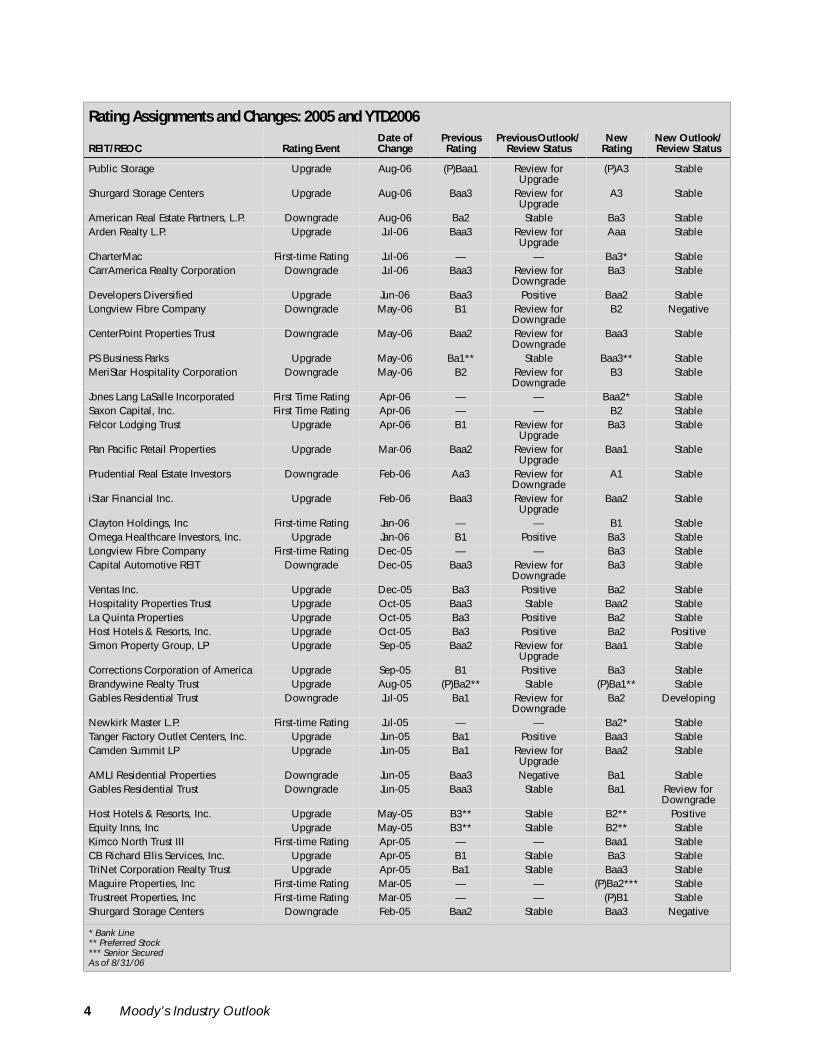
Rating Assignments and Changes: 2005 and YTD2006
REIT/REOC Rating EventDate of Change
Previous Rating
Previous Outlook/ Review Status
New Rating
New Outlook/ Review Status
Public Storage Upgrade Aug-06 (P)Baa1 Review for Upgrade
(P)A3 Stable
Shurgard Storage Centers Upgrade Aug-06 Baa3 Review for Upgrade
A3 Stable
American Real Estate Partners, L.P. Downgrade Aug-06 Ba2 Stable Ba3 StableArden Realty L.P. Upgrade Jul-06 Baa3 Review for
UpgradeAaa Stable
CharterMac First-time Rating Jul-06 — — Ba3* StableCarrAmerica Realty Corporation Downgrade Jul-06 Baa3 Review for
DowngradeBa3 Stable
Developers Diversified Upgrade Jun-06 Baa3 Positive Baa2 StableLongview Fibre Company Downgrade May-06 B1 Review for
DowngradeB2 Negative
CenterPoint Properties Trust Downgrade May-06 Baa2 Review for Downgrade
Baa3 Stable
PS Business Parks Upgrade May-06 Ba1** Stable Baa3** StableMeriStar Hospitality Corporation Downgrade May-06 B2 Review for
DowngradeB3 Stable
Jones Lang LaSalle Incorporated First Time Rating Apr-06 — — Baa2* StableSaxon Capital, Inc. First Time Rating Apr-06 — — B2 StableFelcor Lodging Trust Upgrade Apr-06 B1 Review for
UpgradeBa3 Stable
Pan Pacific Retail Properties Upgrade Mar-06 Baa2 Review for Upgrade
Baa1 Stable
Prudential Real Estate Investors Downgrade Feb-06 Aa3 Review for Downgrade
A1 Stable
iStar Financial Inc. Upgrade Feb-06 Baa3 Review for Upgrade
Baa2 Stable
Clayton Holdings, Inc First-time Rating Jan-06 — — B1 StableOmega Healthcare Investors, Inc. Upgrade Jan-06 B1 Positive Ba3 StableLongview Fibre Company First-time Rating Dec-05 — — Ba3 StableCapital Automotive REIT Downgrade Dec-05 Baa3 Review for
DowngradeBa3 Stable
Ventas Inc. Upgrade Dec-05 Ba3 Positive Ba2 StableHospitality Properties Trust Upgrade Oct-05 Baa3 Stable Baa2 StableLa Quinta Properties Upgrade Oct-05 Ba3 Positive Ba2 StableHost Hotels & Resorts, Inc. Upgrade Oct-05 Ba3 Positive Ba2 PositiveSimon Property Group, LP Upgrade Sep-05 Baa2 Review for
UpgradeBaa1 Stable
Corrections Corporation of America Upgrade Sep-05 B1 Positive Ba3 StableBrandywine Realty Trust Upgrade Aug-05 (P)Ba2** Stable (P)Ba1** StableGables Residential Trust Downgrade Jul-05 Ba1 Review for
DowngradeBa2 Developing
Newkirk Master L.P. First-time Rating Jul-05 — — Ba2* StableTanger Factory Outlet Centers, Inc. Upgrade Jun-05 Ba1 Positive Baa3 StableCamden Summit LP Upgrade Jun-05 Ba1 Review for
UpgradeBaa2 Stable
AMLI Residential Properties Downgrade Jun-05 Baa3 Negative Ba1 StableGables Residential Trust Downgrade Jun-05 Baa3 Stable Ba1 Review for
DowngradeHost Hotels & Resorts, Inc. Upgrade May-05 B3** Stable B2** PositiveEquity Inns, Inc Upgrade May-05 B3** Stable B2** StableKimco North Trust III First-time Rating Apr-05 — — Baa1 StableCB Richard Ellis Services, Inc. Upgrade Apr-05 B1 Stable Ba3 StableTriNet Corporation Realty Trust Upgrade Apr-05 Ba1 Stable Baa3 StableMaguire Properties, Inc First-time Rating Mar-05 — — (P)Ba2*** StableTrustreet Properties, Inc First-time Rating Mar-05 — — (P)B1 StableShurgard Storage Centers Downgrade Feb-05 Baa2 Stable Baa3 Negative
* Bank Line ** Preferred Stock *** Senior SecuredAs of 8/31/06
4 Moody’s Industry Outlook

REIT and REOC Industry Profile
STRENGTHS/OPPORTUNITIES• Greater size, diversity and scope• Moderate leverage, manageable debt maturities and sound liquidity• Key financial measures stable• Asset type (real property) supports liquidity in distress, and should boost bondholder recoveries• REITs are culling their underperforming or non-core assets, and replacing them with higher quality assets, even at
the expense of lower yields
WEAKNESSES/CHALLENGES• Little capacity for cash retention, especially after accounting for capital expenditures• Potential trend of weakening covenants, perhaps followed by higher leverage and secured debt tolerances• Leveraged joint ventures and fee-generation platforms such as funds can create complexity, new-business risks,
volatile cash flows, and weakened liquidity and transparency• Dependant on capital market access• Ample capital flows to real estate make accretive acquisitions challenging• Higher development pipelines and more focus on purchasing vacancies
FACTORS THAT WILL LIKELY DRIVE US REIT/REOC RATINGS• Achievement of strong sector leadership• Portfolio diversification by tenant, industry and geography• Increase in JVs and funds or other fee generating structures, which can reduce transparency and increase manage-
ment complexity and earnings volatility• Maintenance of moderate financial leverage and a large, diverse unencumbered asset pools, which may be affected
by bond covenant shifts• Adverse capital structure effects of M&A
Some Key Questions
WHAT DOES MOODY’S RATING METHODOLOGY GRID TELL US?By using Moody’s REIT Rating Methodology Grid1, which encompasses the key factors that drive our ratings, you cannot only determine where a REIT or REOC would likely be rated, but also the characteristics most likely to drive anupgrade or downgrade. Moody’s Real Estate Finance Team uses this grid as a starting point to evaluate the creditwor-thiness of a REIT or REOC. Additional analysis using rolling averages for grid inputs, as well as the historical trend ofindividual rating drivers, is performed to generate sharper insight into performance. Furthermore, pro forma informa-tion and alternate outcomes from different stress scenarios generate insight into the likely credit path of a firm.
The table below summarizes the key rating drivers and sub-factors that comprise Moody’s Rating Grid. Moody’shas applied this rating grid to all of its rated REITs. The results have been within one to two rating notches of theexisting ratings except for some REITs in the lodging and healthcare sectors. For companies in these sectors, volatilityof earnings tends to influence the rating more than a strong balance sheet. Healthcare REITs, for example, are acutelyexposed to operator business volatility and government funding shifts, the two being linked, and often-high levels oftenant concentration and performance correlation. Lodging REITs experience often-sharp cash flow volatility due todaily movements in occupancy and room rates, with particular sensitivity to economic conditions.
1. “Rating Methodology for REITs and Other Commercial Property Firms,” January 2006.
Moody’s Industry Outlook 5

Moody’s Methodology for REITs and Commercial Property FirmsRating Driver Sub-Factors Metric
Liquidity & Funding Available bank line capacityDebt maturity profileDividend payout ratioSize of unencumbered asset pool
Total Line - OutstandingMaximum Annual MaturityDividend / FFOUnencumbered Assets / Gross Assets
Leverage & Capital Structure Amount of effective leverageDebt relative to operating incomeAmount of secured leverageAbility to access capital
Debt + Preferred / Gross AssetsNet Debt / EBITDASecured Debt / Gross AssetsQualitative (“Excellent” to “Sporadic”)
Market Position & Asset Quality Degree of franchise and brand recognitionSize and market penetrationLevel of diversitySize of development businessQuality of assets
Qualitative (“Excellent” to “Low”)Gross AssetsQualitative (“Excellent” to “Poor”)Development / Gross AssetsQualitative (“Excellent” to “Low”)
Cash Flow & Earnings Operating marginsEarning powerVolatility of earningsAbility to service debt
EBITDA / RevenuesNet Income / Average AssetsStandard Deviation of ROAAEBITDA / Interest + Preferred Dividends
Internal & External Factors Assessment of managementJoint venture and fund activity
Qualitative (“Excellent” to “Modest”)JV or Fund Revenues / Total Revenues
Avg. Std. Deviation of REIT Return on Average Assets
Source: Moody's; based on data from 1998 to 2005
Operating Margin (%)
Source: Moody's
0.0
0.5
1.0
1.5
2.0
2.5
3.0
3.5
Industrial Multifamily Retail Office Healthcare Lodging
0.00
10.00
20.00
30.00
40.00
50.00
60.00
70.00
80.00
90.00
Diversi
fied
Health
care
Lodg
ing
Indus
trial
Multifa
milyOffic
e
Retail
Self-
Storag
e
Timbe
r
Indus
try
2003 2004 2005 2006H1
6 Moody’s Industry Outlook

HOW DOES MOODY’S LOOK AT BOND COVENANTS IN RATING REITs?Moody’s REIT Rating Methodology has no explicit criterion for bond covenants — their evaluation is implicitlyincorporated into other financial and qualitative factors, including our assessment of management. The existence andtightness of covenants suggests the level of management’s risk appetite, and covenant changes likely signal new think-ing surrounding capital strategy that could drive ratings.
Covenant changes thus far have been limited to a handful of the largest REITs, and the changes focus on the defi-nition of leverage. Some REITs have labeled the covenants anachronistic, given the sector’s lack of widespread, seriousstress, and further maturation. The rebuttal cites the covenants as a primary factor in the companies’ lack of stress.Moody’s expects the trend of covenant changes to continue as long as the property market remains robust. For eachREIT that seeks to weaken the terms of its covenants, Moody’s will examine its tendency to increase secured or unse-cured leverage, to diminish coverage, and to maintain unencumbered assets. Weaker covenants are not necessarily inand of themselves rating drivers. Nonetheless, investors are reexamining the importance of covenants in other indus-tries particularly where LBO activity has been heavy, perhaps with an eye to the mostly favorable results for REITbondholders in such situations.
Significant changes — either substantial weakening or elimination — in a REIT covenant package are likely toresult in a rating downgrade. This reflects not only the greater capacity of a REIT to, say, boost leverage or to structur-ally subordinate its unsecured creditors, but also the attitude of management to these matters. Of the four commoncovenants, ratings are most sensitive to the secured debt test. Increased utilization of secured debt in the capital struc-ture beyond the 40% threshold can mean a de facto, if not de jure, recapitalization, leaving little support for unsecuredbondholders. There is also the likely commensurate increase in aggregate leverage to consider.
Issuers and investors need to be aware of another important aspect of covenants, which entails preferred equityratings. Moody’s has assigned preferred ratings two notches below senior unsecured debt for non-REIT corporateissuers. REITs, on the other hand, have enjoyed tighter notching between preferred stock and senior bonds. Three ele-ments drive this policy. The first two have to do with the high marketability of real estate assets and the lack of subor-dinated debt in the capital structure, which translate to higher likely levels of recovery in default. The third elementreflects the protection availed by the standard REIT covenants. Absent covenants, or the presence of a deflated variety,Moody’s is likely to increase the notching of an issuer’s preferred rating relative to senior debt2.
General Growth Properties, a leading owner of US regional malls, and Capital Automotive REIT, which special-izes in auto dealership properties, are examples of the relative rating effects altered covenants can produce. Withrespect to General Growth, it traditionally funded itself with secured debt and did not have any bond covenants until itacquired The Rouse Company, another mall owner and an unsecured bond issuer, in 2004. Given the presence ofbond covenants at Rouse and lack thereof at General Growth, Rouse’s senior unsecured rating is one notch higherthan that of General Growth. The covenants at Rouse have prevented General Growth from substantially raisingsecured debt and total leverage at the Rouse level. Thus, on a stand-alone basis, Rouse’s credit metrics are measurablystronger than its parent’s on a consolidated basis. Capital Automotive was a Baa3 senior unsecured issuer prior to itsLBO by institutional investors. The transaction entailed tendering for the firm’s outstanding bonds with proceedsfrom a secured credit facility which was collateralized by virtually the entire portfolio of dealership properties. Onceover half of the bonds had been tendered, the covenants were eliminated on the remaining bonds. Given this, and theabsence of unencumbered assets, the senior unsecured bond rating was lowered to Ba3 — two notches below thesenior secured rating and three notches below the pre-transaction senior unsecured rating.
“Standard” REIT Senior Unsecured Bond CovenantsTypically, violation of these negative covenants (without remediation within 30 to 90 days) can constitute adefault and trigger acceleration of payment of principal and accrued interest. The denominator in the leveragecalculations is often defined as the undepreciated book value of real estate assets or total assets:• 60% Total Leverage• 1.5X Cash Flow to Debt Service• 40% Secured Leverage• 150% Unencumbered Assets relative to Unencumbered Debt
2. “REIT Rating Methodology: Notching for Differences in Priority of Claims and Integration of the Preferred Stock Rating Scale,” August 2001.
Moody’s Industry Outlook 7
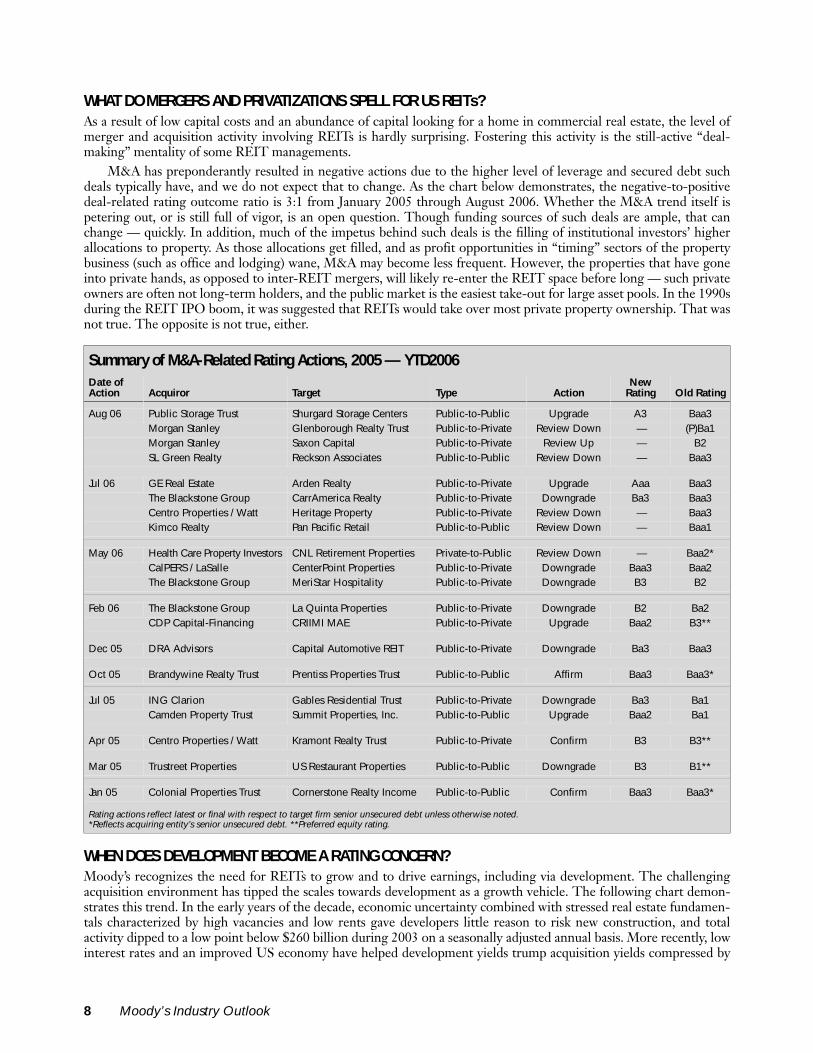
WHAT DO MERGERS AND PRIVATIZATIONS SPELL FOR US REITs?As a result of low capital costs and an abundance of capital looking for a home in commercial real estate, the level ofmerger and acquisition activity involving REITs is hardly surprising. Fostering this activity is the still-active “deal-making” mentality of some REIT managements.
M&A has preponderantly resulted in negative actions due to the higher level of leverage and secured debt suchdeals typically have, and we do not expect that to change. As the chart below demonstrates, the negative-to-positivedeal-related rating outcome ratio is 3:1 from January 2005 through August 2006. Whether the M&A trend itself ispetering out, or is still full of vigor, is an open question. Though funding sources of such deals are ample, that canchange — quickly. In addition, much of the impetus behind such deals is the filling of institutional investors’ higherallocations to property. As those allocations get filled, and as profit opportunities in “timing” sectors of the propertybusiness (such as office and lodging) wane, M&A may become less frequent. However, the properties that have goneinto private hands, as opposed to inter-REIT mergers, will likely re-enter the REIT space before long — such privateowners are often not long-term holders, and the public market is the easiest take-out for large asset pools. In the 1990sduring the REIT IPO boom, it was suggested that REITs would take over most private property ownership. That wasnot true. The opposite is not true, either.
WHEN DOES DEVELOPMENT BECOME A RATING CONCERN?Moody’s recognizes the need for REITs to grow and to drive earnings, including via development. The challengingacquisition environment has tipped the scales towards development as a growth vehicle. The following chart demon-strates this trend. In the early years of the decade, economic uncertainty combined with stressed real estate fundamen-tals characterized by high vacancies and low rents gave developers little reason to risk new construction, and totalactivity dipped to a low point below $260 billion during 2003 on a seasonally adjusted annual basis. More recently, lowinterest rates and an improved US economy have helped development yields trump acquisition yields compressed by
Summary of M&A-Related Rating Actions, 2005 — YTD2006Date ofAction Acquiror Target Type Action
New Rating Old Rating
Aug 06 Public Storage Trust Shurgard Storage Centers Public-to-Public Upgrade A3 Baa3Morgan Stanley Glenborough Realty Trust Public-to-Private Review Down — (P)Ba1Morgan Stanley Saxon Capital Public-to-Private Review Up — B2SL Green Realty Reckson Associates Public-to-Public Review Down — Baa3
Jul 06 GE Real Estate Arden Realty Public-to-Private Upgrade Aaa Baa3The Blackstone Group CarrAmerica Realty Public-to-Private Downgrade Ba3 Baa3Centro Properties / Watt Heritage Property Public-to-Private Review Down — Baa3Kimco Realty Pan Pacific Retail Public-to-Public Review Down — Baa1
May 06 Health Care Property Investors CNL Retirement Properties Private-to-Public Review Down — Baa2*CalPERS / LaSalle CenterPoint Properties Public-to-Private Downgrade Baa3 Baa2The Blackstone Group MeriStar Hospitality Public-to-Private Downgrade B3 B2
Feb 06 The Blackstone Group La Quinta Properties Public-to-Private Downgrade B2 Ba2CDP Capital-Financing CRIIMI MAE Public-to-Private Upgrade Baa2 B3**
Dec 05 DRA Advisors Capital Automotive REIT Public-to-Private Downgrade Ba3 Baa3
Oct 05 Brandywine Realty Trust Prentiss Properties Trust Public-to-Public Affirm Baa3 Baa3*
Jul 05 ING Clarion Gables Residential Trust Public-to-Private Downgrade Ba3 Ba1Camden Property Trust Summit Properties, Inc. Public-to-Public Upgrade Baa2 Ba1
Apr 05 Centro Properties / Watt Kramont Realty Trust Public-to-Private Confirm B3 B3**
Mar 05 Trustreet Properties US Restaurant Properties Public-to-Public Downgrade B3 B1**
Jan 05 Colonial Properties Trust Cornerstone Realty Income Public-to-Public Confirm Baa3 Baa3*
Rating actions reflect latest or final with respect to target firm senior unsecured debt unless otherwise noted.*Reflects acquiring entity’s senior unsecured debt. **Preferred equity rating.
8 Moody’s Industry Outlook
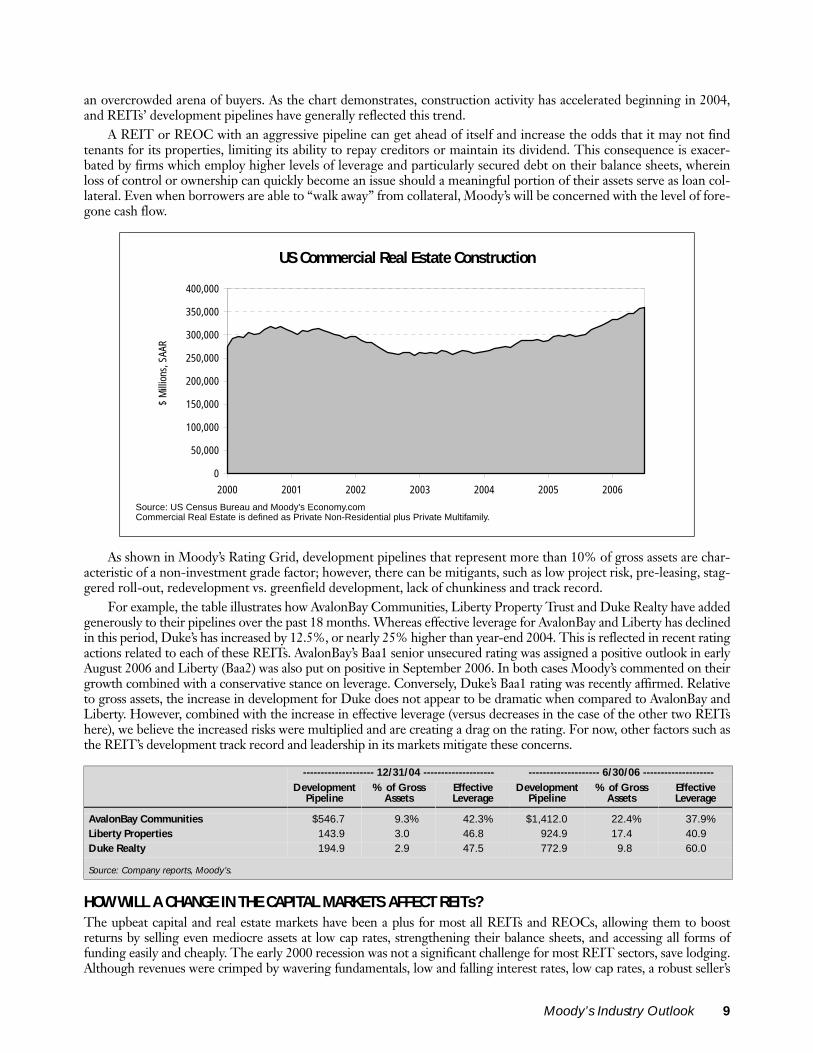
an overcrowded arena of buyers. As the chart demonstrates, construction activity has accelerated beginning in 2004,and REITs’ development pipelines have generally reflected this trend.
A REIT or REOC with an aggressive pipeline can get ahead of itself and increase the odds that it may not findtenants for its properties, limiting its ability to repay creditors or maintain its dividend. This consequence is exacer-bated by firms which employ higher levels of leverage and particularly secured debt on their balance sheets, whereinloss of control or ownership can quickly become an issue should a meaningful portion of their assets serve as loan col-lateral. Even when borrowers are able to “walk away” from collateral, Moody’s will be concerned with the level of fore-gone cash flow.
As shown in Moody’s Rating Grid, development pipelines that represent more than 10% of gross assets are char-acteristic of a non-investment grade factor; however, there can be mitigants, such as low project risk, pre-leasing, stag-gered roll-out, redevelopment vs. greenfield development, lack of chunkiness and track record.
For example, the table illustrates how AvalonBay Communities, Liberty Property Trust and Duke Realty have addedgenerously to their pipelines over the past 18 months. Whereas effective leverage for AvalonBay and Liberty has declinedin this period, Duke’s has increased by 12.5%, or nearly 25% higher than year-end 2004. This is reflected in recent ratingactions related to each of these REITs. AvalonBay’s Baa1 senior unsecured rating was assigned a positive outlook in earlyAugust 2006 and Liberty (Baa2) was also put on positive in September 2006. In both cases Moody’s commented on theirgrowth combined with a conservative stance on leverage. Conversely, Duke’s Baa1 rating was recently affirmed. Relativeto gross assets, the increase in development for Duke does not appear to be dramatic when compared to AvalonBay andLiberty. However, combined with the increase in effective leverage (versus decreases in the case of the other two REITshere), we believe the increased risks were multiplied and are creating a drag on the rating. For now, other factors such asthe REIT’s development track record and leadership in its markets mitigate these concerns.
HOW WILL A CHANGE IN THE CAPITAL MARKETS AFFECT REITs?The upbeat capital and real estate markets have been a plus for most all REITs and REOCs, allowing them to boostreturns by selling even mediocre assets at low cap rates, strengthening their balance sheets, and accessing all forms offunding easily and cheaply. The early 2000 recession was not a significant challenge for most REIT sectors, save lodging.Although revenues were crimped by wavering fundamentals, low and falling interest rates, low cap rates, a robust seller’s
US Commercial Real Estate Construction
Source: US Census Bureau and Moody's Economy.comCommercial Real Estate is defined as Private Non-Residential plus Private Multifamily.
-------------------- 12/31/04 -------------------- -------------------- 6/30/06 --------------------Development
Pipeline% of Gross
AssetsEffectiveLeverage
DevelopmentPipeline
% of GrossAssets
EffectiveLeverage
AvalonBay Communities $546.7 9.3% 42.3% $1,412.0 22.4% 37.9%Liberty Properties 143.9 3.0% 46.8% 924.9 17.4% 40.9%Duke Realty 194.9 2.9% 47.5% 772.9 9.8% 60.0%
Source: Company reports, Moody’s.
0
50,000
100,000
150,000
200,000
250,000
300,000
350,000
400,000
2000 2001 2002 2003 2004 2005 2006
$ M
illio
ns, S
AAR
Moody’s Industry Outlook 9

environment, high equity values and ready access to funding (including a large influx of foreign capital) were key sup-ports. If one or more of these factors had been removed, the fortunes of at least some REITs would have likely reversed.
It is often overlooked that REITs depend on regular capital market access. We have not seen access diminishrecently, but we do expect changes will take place, as some REITs have looked at shortening the maturity structure oftheir debt and we have also seen substantial increase in convertible debt issuance. With respect to the former, Moody’sviews its use as a credit negative. For an industry with almost no cash retention capacity, funding a substantial part of itsbusiness with short-term debt reflects a high risk appetite.
REIT Equity Performance12/31/04 through 8/31/06
Source: Bloomberg LP
-20%
0%
20%
40%
60%Office Index
-20%
0%
20%
40%
60%Industrial Index
-20%
0%
20%
40%
60%Multifamily Index
-20%
0%
20%
40%
60%Retail Index
-20%
0%
20%
40%
60%Healthcare Index
-20%
0%
20%
40%
60%Hotel Index
-20%
0%
20%
40%
60%Self-Storage Index
-20%
0%
20%
40%
60%Diversified Index
10 Moody’s Industry Outlook

Convertible debt, a current fad, is considered debt, given the structures used. Recent issues provide the REITswith another source of inexpensive fixed-rate long-term financing. Yet the issuance of these instruments indicates thatmanagement believes it should be able to issue these instruments without much future dilution to its equity base orFFO per share (they are not incented otherwise to issue these securities), which begs the question whether the REITs’growth in stock prices, based on management’s expectations, have hit a plateau.
HOW MUCH SECURED DEBT IS TOO MUCH?We focus on several ratios to evaluate the effects of secured debt on REITs’ rated unsecured debt, financial flexibilityand effective subordination. Moody’s primary metric considers secured debt relative to gross assets, and levels below20% are a “Baa” rating characteristic; less than 10% or lower is an “A” characteristic. Other ratios include the ratio ofunencumbered assets to unsecured debt; interest coverages for unsecured debt generated by unencumbered assets; themix and quality of the unencumbered asset pool; and the loan-to-value ratio of the secured assets. When rating unse-cured debt, Moody’s is cognizant of the ratio of unencumbered assets to total debt and, in particular, total unsecureddebt. The larger the ratio, the more financial flexibility a REIT generally has (although high levels of mortgaged assetscan render the unencumbered leverage ratio less relevant, so it is important to examine overall leverage as well).Another key factor in Moody’s evaluation of the debt mix and refinancing risks is the REIT’s or REOC’s debt maturityschedule. The bunching of debt maturities presents financing risks: the more debt maturities are spread over time, themore flexibility the REIT or REOC will have — one of the plusses of mortgages, with their amortization schedules.
Examples of REITs that have levels of secured debt which constrain their rating (in these instances, below invest-ment grade) include General Growth Properties and Apartment & Investment Management Company (AIMCO).Secured debt relative to gross assets at June 30, 2006 was 50% and 47%, respectively, with little in terms of unencum-bered assets in either case. Conversely, Vornado Realty Trust, 52%, Boston Properties, 31%, and Archstone-SmithTrust, 20%, represent three issuers where relatively high levels of secured debt have been mitigated by other, positivefactors which support investment-grade ratings, chief of which are a sizable unencumbered asset base marked by supe-rior asset quality.
Equity and Debt Issuance
Source: NAREIT as of 7/31/06
$0
$5,000
$10,000
$15,000
$20,000
2001 2002 2003 2004 2005 2006
Capi
tal R
aise
d ($
Mil.
)
Unsecured Debt Common Equity Preferred Equity
Moody’s Industry Outlook 11

WHICH ACCOUNTING ISSUES WILL HAVE THE GREATEST EFFECT ON REITS?The Financial Accounting Standards Board (FASB) recently completed several projects related to fair value, and it ispossible fair value accounting treatment for investment properties under US GAAP will be introduced in 2008. Inter-national Financial Reporting Standards (IFRS) already require investment properties to be recorded at fair value onthe balance sheet with changes in unrealized gains and losses in the income statement, or disclosure of fair value in thefootnotes if preparers choose to continue to use historical cost in their financial statements (with no income statementimpact for unrealized gains and losses). In the “Roadmap” for convergence between US GAAP and IFRS, releasedjointly by the respective standard setters in February 2006, investment property accounting was placed in the “short-term” convergence category. The FASB will evaluate the accounting for investment property as part of Phase II of itsFair Value Option project; an exposure draft for this project is expected in the fourth quarter of 2006 or the first quar-ter of 2007. It is unclear at this time if the US standard will mirror the international standard or contain differences.
There are diverse opinions on the positives and negatives of fair value accounting for investment property. Thosein favor say depreciation has little meaning for investment property, and it reduces the relevance of both the incomestatement and the balance sheet. Fair value treatment is more representative of the economics of many REITs’ busi-ness models. Those on the negative side fear a reduction in comparability, especially if fair value treatment is optional,and reliability, as a fair value number is more subjective than historical cost; fair value is also volatile.
Moody’s believes there is validity in both sides of this argument. We agree that neither depreciated, nor undepre-ciated, cost is usually representative of the fair value of real estate assets, especially for those REITs with low asset turn-over. However, fair value treatment can create distortions, the level of which depends on how often a company revaluesits assets and the dependability of the revaluations. Moody’s analysis incorporates both measurement bases. As it iswidely available, undepreciated cost underlies many of our metrics, but in most instances fair value information is alsoincorporated. For example, leverage ratios are calculated using assets on both an undepreciated cost as well as a fairvalue basis, and the stability of asset values is reviewed as we consider stable asset values an enhancement of a REITsability to sell or refinance properties in times of cash flow need. For those non-US REITs revaluing their real estateassets with a resulting income statement impact, Moody’s eliminates any unrealized gains. This treatment is similar tothat for realized gains and losses in the calculation of FFO.
A corollary issue is how a fair value accounting regime could change how the “total assets” component of REITbond covenants is defined. The most common definition is currently undepreciated cost. A change to fair valueaccounting could make definitions with fair value aspects more common and accelerate the diversification of REITcovenant definitions that is already underway. Although we do not believe pure fair value will become the new “stan-dard” definition of total assets in covenants over the short term, over the long term, with more acceptance of fair valueaccounting, it possibly will.3
We do not expect a move to fair value accounting to impact outstanding bonds unless management proactivelychanges covenant definitions. Most definitions of total assets are clearly defined as undepreciated cost and this wouldnot change in a move to fair value accounting. In addition, many indenture agreements contain language that permits“old” accounting to be used to calculate covenant compliance if “new” accounting would result in non-compliance.
Secured Debt Ratio (%)
Source: Moody's; as of 6/30/06
3. “Fair Value Accounting for Investment Properties Is on the Horizon: How Will It Affect REIT Bond Covenants?” June 2006.
0
20
40
60
80
100
≥A3 Baa Ba ≤B1
Secured Debt % Gross Assets Secured Debt % Total Debt
12 Moody’s Industry Outlook
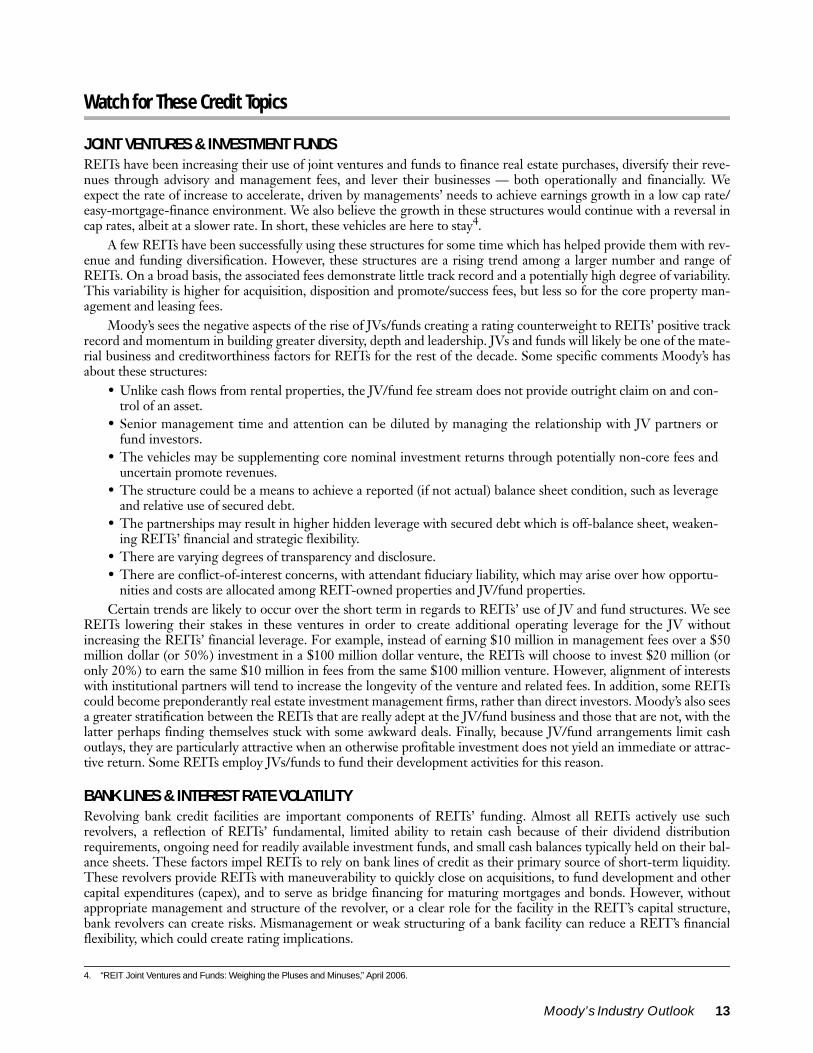
Watch for These Credit Topics
JOINT VENTURES & INVESTMENT FUNDSREITs have been increasing their use of joint ventures and funds to finance real estate purchases, diversify their reve-nues through advisory and management fees, and lever their businesses — both operationally and financially. Weexpect the rate of increase to accelerate, driven by managements’ needs to achieve earnings growth in a low cap rate/easy-mortgage-finance environment. We also believe the growth in these structures would continue with a reversal incap rates, albeit at a slower rate. In short, these vehicles are here to stay4.
A few REITs have been successfully using these structures for some time which has helped provide them with rev-enue and funding diversification. However, these structures are a rising trend among a larger number and range ofREITs. On a broad basis, the associated fees demonstrate little track record and a potentially high degree of variability.This variability is higher for acquisition, disposition and promote/success fees, but less so for the core property man-agement and leasing fees.
Moody’s sees the negative aspects of the rise of JVs/funds creating a rating counterweight to REITs’ positive trackrecord and momentum in building greater diversity, depth and leadership. JVs and funds will likely be one of the mate-rial business and creditworthiness factors for REITs for the rest of the decade. Some specific comments Moody’s hasabout these structures:
• Unlike cash flows from rental properties, the JV/fund fee stream does not provide outright claim on and con-trol of an asset.
• Senior management time and attention can be diluted by managing the relationship with JV partners orfund investors.
• The vehicles may be supplementing core nominal investment returns through potentially non-core fees anduncertain promote revenues.
• The structure could be a means to achieve a reported (if not actual) balance sheet condition, such as leverageand relative use of secured debt.
• The partnerships may result in higher hidden leverage with secured debt which is off-balance sheet, weaken-ing REITs’ financial and strategic flexibility.
• There are varying degrees of transparency and disclosure.• There are conflict-of-interest concerns, with attendant fiduciary liability, which may arise over how opportu-
nities and costs are allocated among REIT-owned properties and JV/fund properties.Certain trends are likely to occur over the short term in regards to REITs’ use of JV and fund structures. We see
REITs lowering their stakes in these ventures in order to create additional operating leverage for the JV withoutincreasing the REITs’ financial leverage. For example, instead of earning $10 million in management fees over a $50million dollar (or 50%) investment in a $100 million dollar venture, the REITs will choose to invest $20 million (oronly 20%) to earn the same $10 million in fees from the same $100 million venture. However, alignment of interestswith institutional partners will tend to increase the longevity of the venture and related fees. In addition, some REITscould become preponderantly real estate investment management firms, rather than direct investors. Moody’s also seesa greater stratification between the REITs that are really adept at the JV/fund business and those that are not, with thelatter perhaps finding themselves stuck with some awkward deals. Finally, because JV/fund arrangements limit cashoutlays, they are particularly attractive when an otherwise profitable investment does not yield an immediate or attrac-tive return. Some REITs employ JVs/funds to fund their development activities for this reason.
BANK LINES & INTEREST RATE VOLATILITYRevolving bank credit facilities are important components of REITs’ funding. Almost all REITs actively use suchrevolvers, a reflection of REITs’ fundamental, limited ability to retain cash because of their dividend distributionrequirements, ongoing need for readily available investment funds, and small cash balances typically held on their bal-ance sheets. These factors impel REITs to rely on bank lines of credit as their primary source of short-term liquidity.These revolvers provide REITs with maneuverability to quickly close on acquisitions, to fund development and othercapital expenditures (capex), and to serve as bridge financing for maturing mortgages and bonds. However, withoutappropriate management and structure of the revolver, or a clear role for the facility in the REIT’s capital structure,bank revolvers can create risks. Mismanagement or weak structuring of a bank facility can reduce a REIT’s financialflexibility, which could create rating implications.
4. “REIT Joint Ventures and Funds: Weighing the Pluses and Minuses,” April 2006.
Moody’s Industry Outlook 13

If the bank credit facility balance outstanding is significantly over 50% for a sustained period of time, Moody’swould likely see this as aggressive. Increasing percentages drawn imply increasingly aggressive funding postures. Totalline availability above 50% on a regular basis is characteristic of companies rated “Baa” or higher. A persistently ele-vated outstanding balance may also indicate that the REIT is using its line of credit, which is by definition a short- tomedium-term facility, as permanent financing, which Moody’s would see as aggressive. High draw levels also weakenthe REIT’s liquidity resources. Other issues that would affect this analysis include large impending debt maturities,capital expenditures and acquisitions, cash retention, asset sales and likely issuances of term debt or equity.
Lines of credit are the primary source of variable rate debt for most REITs, though some REITs swap fixed-ratedebt into floating-rate debt, and have variable-rate mortgages or construction loans. Variable rate debt can be risky fora REIT because of the potential for a rise in interest rates, counterbalanced by the typical fixed level of rent cash flows;the result can become a profit squeeze. Moody’s has observed that there has not been a consistent, significant differ-ence between investment grade REITs’ and speculative grade REITs’ variable-rate debt exposures. That said, Moody’swould see as a negative rating factor a high level of variable rate debt — levels above 20% tend to equate to a below-Baa characteristic. In its analysis, Moody’s adjusts down high levels of variable-rate debt to more normalized levels,with the difference being assigned a long-term cost of funds. This helps to highlight how much coverages are beingsupported by variable-rate debt, and assists in comparing REITs’ performance. Moody’s also stresses interest rates inits pro forma analyses. Many REITs hedge their lines of credit (such as via caps) to manage interest rate volatility andthis can result in a higher tolerance for variable-rate debt.
We also recognize that a higher tolerance exists for sectors in which leases reset relatively more frequently. Thelodging and multifamily sectors, with respective average lease durations of one day and less than one year, are moresuited to carrying variable rate debt than the retail or office sectors, which typically have multi-year leases.
“A” RATED REITsWhile Moody’s has a handful of REITs and REOCs rated “A”, and more rated Baa1, a larger A-rated populationwould mean material progress on diversity and sector leadership, assisted by better balance sheet metrics, and a trackrecord of consistent and sound performance in more challenging capital and property markets. These factors havebeen critical in the movement towards a larger group of A-rated REITs in 2006. The following are recent positiveactions relating to senior unsecured on the Baa-A divide. These factors — especially diversity and leadership — willalso be the key drivers for ratings into the upper end of the “Baa” category. These movements, over time, should resultin a wider dispersion of ratings as some REITs pull away from the pack.
THE INTERNATIONAL ANGLEInternational investing means different things to different investors, including: (1) property investments outside theUSA by US REITs, (2) non-US property investors buying in the USA, (3) tapping overseas capital by US REITs, and(4) the establishment of more public property companies overseas, usually via a REIT vehicle.
Overseas Investment by US REITsMore overseas investment by US REITs is occuring, and Moody’s expects still more to come. Why? To drive growth inwhat is seen as a more constrained domestic market, and especially to leverage specialized skill bases and tenant rela-tionships. However, most of the activity above nominal levels is concentrated in a few REITs, such as ProLogis, AMB,Simon, Kimco and Archstone — and even here the international numbers are not significant (yet).
Moody’s sees overseas investments as a plus — a means of diversifying assets and cash flows, of strengthening thedomestic franchise, and of extending that franchise globally. These efforts will take time to accomplish, however. Also,rapid growth, particularly in new markets, is often a precursor to problems, and there are a number of external, non-operating risks to consider, including foreign exchange, tax and regulatory risks. In addition, many such overseasinvestments utilize joint venture partners, with all of the usual complexity and leverage issues. That said, Moody’s doesrecognize the prudence of enlisting local expertise, which helps REITs navigate unfamiliar territory. Furthermore,there is a particular tendency to employ significant leverage on non-US assets as a means of hedging FX risk andaddressing tax issues. For the moment, for most all REITs, international investing is a minor analytical issue, and weexpect it to remain so for the intermediate term.
REIT Old Rating/Outlook New Rating/Outlook
Equity Residential Baa1/Stable Baa1/PositiveAvalonBay Baa1/Stable Baa1/PostiveSimon Property Baa1/Positive Baa1/Under review upPublic Storage Baa1/Under review up A3/Stable
14 Moody’s Industry Outlook

Foreign Buyers in the USAForeign investors continue to be active buyers of US commercial property — including the purchase of REITs. Recentdeals include Kramont and Heritage. Moody’s view is that this trend is attenuating as cap rates have dropped (partly dueto these investors, making acquisitions less appealing) and as allocations get put to work. It’s unclear how sticky this recentwave of foreign money will be, so there may be a partial return of assets to the US public space in due course, providingrenewed growth opportunities for REITs over the intermediate term. The ratings effects of these purchases of US REITshave been similar to those of other M&A events, with rating downgrades or withdrawals predominating.
Tapping Overseas Capital by US REITsWe are still in the early stages of what should be a positive long-term process for US REITs, as they build investor fol-lowings overseas to draw upon a wider range of capital sources — including common stock and unsecured bonds. Wehave also seen REITs utilize non-US investors via joint ventures and funds (such as ProLogis, a successful leader), aswell as US REITs entering into joint venture-type structures, such as certain Australian property trusts, to access for-eign capital. How long some of these more recent structures will last — including JV-like Australian property trusts —is an open question, and such restructurings could create challenges for REITs, but it does not appear at this stage thatsuch challenges would be particularly disruptive. More important is how a waning of enthusiasm by foreign investorscould affect REITs’ capital access and costs — always a credit worry in a non-cash-retention business.
The Growth of REITs in Other NationsThis trend continues, with the United Kingdom most recently joining the fold, and Germany a likely candidate. Whilethe growth of REITs in new markets will steal some of the spotlight from US REITs, overall the globalization ofREIT-like structures is a positive event for REIT credit. As REITs and public real estate firms grow in size, numberand geographic reach, they reinforce the success and robustness of the public company concept, and the capital accessthat follows, and strengthen the long-term outlook for the industry.
Moody’s Rating Distribution for Non-US REITs and REOCs
Includes all non-U.S. REITs & REOCs with rated senior unsecured debt as of 8/31/06
0
5
10
15
20
25
≥A3 Baa1 Baa2 Baa3 Ba1 Ba2 Ba3 B1 ≤B2
# of
Com
pani
es
Moody’s Industry Outlook 15

Moody’s Rating Outlooks for Specific REIT Property Sectors
OFFICE SECTORMoody’s rating outlook for the US Office REITs is stable5. Office REITs have been active participants in M&A activityduring 2006, comprising almost 50% of the total transaction volume. This activity, driven by the goal to invest early inthe recovering office sector, and some large institutional investors’ desire to reach their allocation targets sooner ratherthan later, has resulted in both positive and negative rating actions, determined primarily by prospective capital structures.
With the exception of other potential strategic transactions, Moody’s does not anticipate any material shifts in theoffice REITs’ ratings over the coming 18 months. This outlook reflects: 1) stabilizing office market fundamentals, and 2)limited delivery of supply scheduled in 2006 and 2007. The US national vacancy rate continues its decline year-over-yearfrom 14.4% in 2Q05 to 13.1% in 2Q066, but local fundamentals vary widely by market. Moody’s notes that the rate ofemployment growth is expected to slow over the next few years7, which should attenuate the pace of improvement inmany local office markets. Positively, high construction costs should continue to constrain new supply and to steady over-all market fundamentals in the near term. Moody’s expects that office cap rates will slowly begin to increase with risinginterest rates, adding pressure on leveraged buyers and thus opening buying opportunities for REITs.
Moody’s does not foresee any ratings upgrades for office REITs in the near term. Although many office REITshave achieved greater size and diversity, office REITs have yet to solidify their franchises — which are difficult to solid-ify in the first place. Franchise value will be a key driver in upward ratings, as most office REITs have achieved theirtarget capital structures. Downward ratings will be largely balance sheet-driven.
Property Sector Rating Outlook U.S. REIT & REOC Outlooks as of 8/31/06Office StableIndustrial StableMultifamily StableRetail StableHealthcare StableLodging Positive
5. “U.S. Office REITs Sector Commentary,” September 2006.6. Torto Wheaton Research — TWR FLASH Office Vacancy Index, July 12, 2006.7. Moody’s Economy.com Industry Outlook.
Office Sector Strengths Office Sector Challenges
• Access to capital is plentiful and diverse (for now)• Current strength in balance sheets• Improving market fundamentals: declining vacancy rates, pricing
power shifting to landlords, supply growth limited for most markets• Some REITs are becoming more diverse
• Capital-intensive asset class with vulnerability to economic cycles• Competitive acquisition environment fostering more complex
legal structures• AFFO payout ratios remain high
Stable74%
Positive 16%
Negative2%
Review for Downgrade
6%
Review for Upgrade2%
16 Moody’s Industry Outlook

Office REIT Financial Ratios
Source: Moody'sSector Includes: BXP, BDN, CEI, DRE, EOP, GLB, HIW, HRP, CLI, MPG, PSB and RA as of 6/30/06; data for ARI as of 2005YE, for CRE as of 3/31/06
Office REIT Senior Debt Subordinate Preferred Stock Outlook/Review Status
Arden Realty Inc. — — Stable Arden Realty Limited Partnership Aaa — —Boston Properties, Inc. — — (P)Baa3 Stable Boston Properties Limited Partnership Baa2 — —Brandywine Realty Trust — — (P)Ba1 Stable Brandywine Operating, L.P. Baa3 (P)Ba1 —CarrAmerica Realty Corporation Ba3 — — Stable CarrAmerica Realty LP Ba3 — —Crescent Real Estate Equities — — B3 Stable Crescent Real Estate Equities L.P. B1 — —Duke Realty Corporation Baa1 — Baa2 Stable Duke Pass-Through Asset Trust Baa1 — — Duke Realty L.P. Baa1 — —Equity Office Properties Trust — — (P)Baa3 Stable EOP Operating, L.P. Baa2 — —Glenborough Realty Trust Inc. — — Ba3 Review for Downgrade Glenborough Properties, L.P. (P)Ba1 (P)Ba2 —Highwoods Properties, Inc. Ba1 — Ba2 Stable Highwoods Exercisable Put Opt. — — — Highwoods Realty, L.P. Ba1 — —HRPT Properties Trust Baa2 Baa3 (P)Baa3 Stable Mack-Cali Realty Corporation — — Baa3 Stable Mack-Cali Realty, L.P. Baa2 (P)Baa3 —Maguire Properties, Inc — — — Stable Maguire Properties, L.P. Ba2* — — Maguire Properties Holdings I, LLC Ba2* — —PS Business Parks, Inc. — — Baa3 StableReckson Associates Realty Corp — — (P)Ba1 Review for Downgrade Reckson Operating Partnership Baa3 — —
*Bank LineAs of 8/31/06
0%
15%
30%
45%
60%
2003 2004 2005 2006H1
Leve
rage
2.00
2.20
2.40
2.60
2.80
Coverage
Debt + Pref / Gross Assets Secured Debt/ Gross Assets
Variable Debt/ Total Debt EBITDA / (Int Exp + Prf Div)
Moody’s Industry Outlook 17

INDUSTRIAL PROPERTY SECTORMoody’s rating outlook for industrial REITs is stable, reflecting the sector’s improving economic fundamentals andoperating performance, combined with moderate leverage, ample unencumbered assets, few liquidity issues, aggressivetenant retention efforts and a sound global trade economy.
Moody’s believes that the industrial property cycle is on an upswing. This optimism partly stems from the healthyInstitute for Supply Management’s Purchasing Managers Index (PMI) reading over the past year. The PMI decreasedalmost 300 basis points to 52.9% in September 2006 from 55.6% in December 2005 and below August’s reading of54.5%. A PMI reading of above 50% indicates that the manufacturing economy is expanding, while a reading below50% suggests a contraction.8 Manufacturing output is a key leading indicator of absorption in the industrial propertymarkets, and the growth, albeit slower, still continues to positively affect industrial REITs, which continue to experi-ence positive absorption of supply. This net absorption should lead to some measure of pricing power for market rentsin the next 12 to 18 months. Global trade is also robust.
Key credit consideration for industrial REITs include driving NOI from core same-store portfolios (these are stillslightly negative to slightly positive) and the tendency to increase leverage as development pipelines and vacancy pur-chases grow. Moody’s sees the growing reliance by industrial REITs on fees and gains generated through joint ventureand real estate fund structures, merchant building, fee development businesses and international investments as animportant rating matter. Funds and joint ventures tend to involve complex structures that diminish transparency andrequire a substantial commitment of managerial resources; the same is true of international investments, which alsoexpose REITs to foreign exchange risks. Moreover, merchant building activities produce more volatile earning streamsthan those typically associated with pure rental income, diminishing industrial REITs’ earnings quality. As industrialREITs’ growth becomes more dependent on funds, joint ventures, international investments, merchant building andfee development businesses, the cushion that industrial REITs have in their ratings and outlooks is reduced.
The major threats to industrial REITs’ stable ratings are a significant decline in their core portfolio quality, result-ing in a material deterioration in earnings and cash flow contribution, and JV or fund structures coming off the rails.The industrial REIT sector is the highest rated sector in Moody’s US REIT universe. A positive shift in the sector’srating outlook would be predicated upon a stronger focus on asset and earnings growth from core portfolios, coupledwith continued growth in size, diversity and leadership. Having a more diverse JV/fund business, with a stronger trackrecord and structures would mitigate risks over the long term.
8. Institute for Supply Management — Report on Business, October 2006.
Industrial Sector Strengths Industrial Sector Challenges
• Low levels of secured debt• Tenant improvement costs are trending down• Tenant retention is solidifying• More positive absorption momentum• Rent roll downs are stabilizing
• Unabating reliance on fees and gains generated through joint ventures and real estate funds, international investments, and merchant building and fee development businesses
• Speculative building is growing• Competitive cap rates are leading industrial REITs to purchase vacancy• Lease terms have been getting shorter
Industrial REIT Financial Ratios
Source: Moody'sSector Includes: AMB, FR, LRY and PLD as of 6/30/06; data for CNT as of 12/31/05
0%
15%
30%
45%
60%
2003 2004 2005 2Q06
Leve
rage
2.00
2.25
2.50
2.75
3.00
Coverage
(Debt + Pref) / Gross Assets Secured Debt/ Gross Assets
Variable Debt/ Total Debt EBITDA / (Int Exp + Prf Div)
18 Moody’s Industry Outlook

MULTIFAMILY SECTORThe rating outlook for this sector is stable, with a positive bias. Moody’s currently maintains positive outlooks on fourof ten rated apartment owner-operators. The multifamily sector is enjoying its most successful period since 2001. Fun-damentals have reached levels near or better than their prior peak five years ago, which is translating to solid cash flowsand debt service coverage. Portfolio occupancies are in most cases at 95% or above, giving landlords meaningful pric-ing power and virtually eliminating concessions. Moody’s has also been encouraged by the improvement in operatingmargins and the maintenance of healthy balance sheets, which should provide better flexibility should markets becomemore challenging. Progress is also being made in growing and diversifying the REITs.
Much of this improvement can be attributed to higher job growth, a sound supply-demand relationship due to(until lately) little apartment development, reduction of the rental unit population by condominium conversions, andthe slowdown in home-buying fostered in part by historical discrepancies in the cost of homeownership relative toleasing. What is more, the REITs’ recent investments in various technology platforms related to leasing, revenue andprocurement management should reduce NOI volatility and improve pricing skills.
Similar to other sectors, the apartment sector has responded to the challenging acquisition environment with aug-mented construction pipelines. We are also concerned about the emerging condo bust, with those units competing forrenters’ attention. The weakening single-family housing market should help the apartment business by encouragingwould-be homeowners to wait for prices to fall further, but it can also have adverse economic effects, which would hurtthe apartment space.
Industrial REIT Senior Debt Subordinate Preferred Stock Outlook/Review Status
AMB Property Corporation — — Baa2 Stable AMB Property, L.P. Baa1 — —CenterPoint Properties Trust Baa3 — Ba1 StableFirst Industrial Realty Trust — — Baa3 Stable First Industrial, L.P. Baa2 — —Liberty Property Trust — — (P)Baa3 Positive Liberty Property L.P. Baa2 (P)Baa3 —ProLogis Baa1 — Baa2 Stable
As of 8/31/06
Multifamily REIT Development Pipelines
6/30/2006 12/31/2005 12/31/20046/30/2006 vs.12/31/2005
6/30/2006 vs.12/31/2004
Archstone $1,215.5 $1,295.0 $952.5 -6.1% 27.6%AvalonBay 1,412.0 1,025.5 546.7 37.7% 158.3%BRE Properties 316.4 355.1 276.9 -10.9% 14.3%Camden 520.0 357.0 135.6 45.7% 283.5%Equity Residential 964.7 464.4 326.7 107.7% 195.3%Post Properties 178.7 99.0 95.0 80.5% 88.1%United Dominion 352.8 145.2 125.6 142.9% 180.9%Total / Average $4,960.0 $3,741.2 $2,459.0 33.6% 101.7%
Source: Company reports, Moody’s
Generally includes joint venture activity and excludes redevelopment, condo conversion or TRS-related activity. Amounts represent total expected pipeline cost, and often reflect the use of projections and estimates by the companies. Properties not stabilized or in lease-up are excluded. Companies with little or no new development pipelines, or which focus on redevelopment, have been excluded. Camden 12/31/04 figures have not been adjusted to include Summit Properties, which it acquired in 2005.
Moody’s Industry Outlook 19
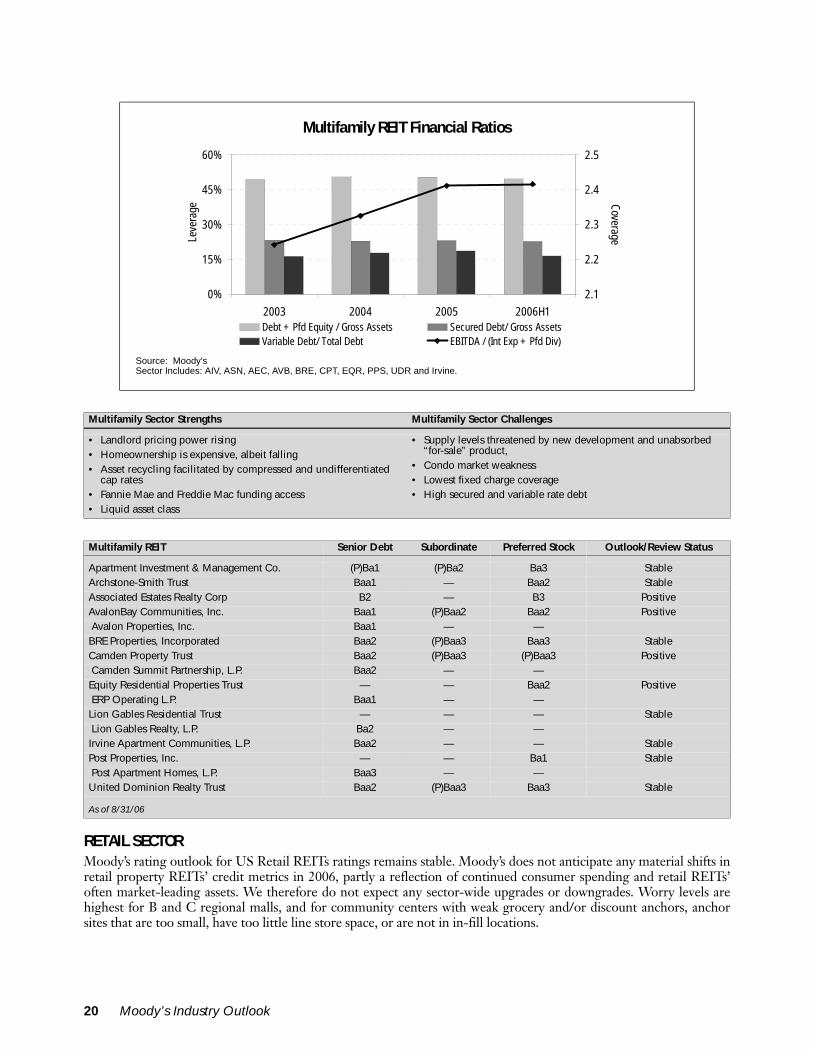
RETAIL SECTORMoody’s rating outlook for US Retail REITs ratings remains stable. Moody’s does not anticipate any material shifts inretail property REITs’ credit metrics in 2006, partly a reflection of continued consumer spending and retail REITs’often market-leading assets. We therefore do not expect any sector-wide upgrades or downgrades. Worry levels arehighest for B and C regional malls, and for community centers with weak grocery and/or discount anchors, anchorsites that are too small, have too little line store space, or are not in in-fill locations.
Multifamily REIT Financial Ratios
Source: Moody'sSector Includes: AIV, ASN, AEC, AVB, BRE, CPT, EQR, PPS, UDR and Irvine.
Multifamily Sector Strengths Multifamily Sector Challenges
• Landlord pricing power rising• Homeownership is expensive, albeit falling• Asset recycling facilitated by compressed and undifferentiated
cap rates• Fannie Mae and Freddie Mac funding access• Liquid asset class
• Supply levels threatened by new development and unabsorbed “for-sale” product,
• Condo market weakness• Lowest fixed charge coverage• High secured and variable rate debt
Multifamily REIT Senior Debt Subordinate Preferred Stock Outlook/Review Status
Apartment Investment & Management Co. (P)Ba1 (P)Ba2 Ba3 StableArchstone-Smith Trust Baa1 — Baa2 StableAssociated Estates Realty Corp B2 — B3 Positive AvalonBay Communities, Inc. Baa1 (P)Baa2 Baa2 Positive Avalon Properties, Inc. Baa1 — —BRE Properties, Incorporated Baa2 (P)Baa3 Baa3 Stable Camden Property Trust Baa2 (P)Baa3 (P)Baa3 Positive Camden Summit Partnership, L.P. Baa2 — —Equity Residential Properties Trust — — Baa2 Positive ERP Operating L.P. Baa1 — —Lion Gables Residential Trust — — — Stable Lion Gables Realty, L.P. Ba2 — —Irvine Apartment Communities, L.P. Baa2 — — StablePost Properties, Inc. — — Ba1 Stable Post Apartment Homes, L.P. Baa3 — —United Dominion Realty Trust Baa2 (P)Baa3 Baa3 Stable
As of 8/31/06
0%
15%
30%
45%
60%
2003 2004 2005 2006H1
Leve
rage
2.1
2.2
2.3
2.4
2.5
Coverage
Debt + Pfd Equity / Gross Assets Secured Debt/ Gross AssetsVariable Debt/ Total Debt EBITDA / (Int Exp + Pfd Div)
20 Moody’s Industry Outlook
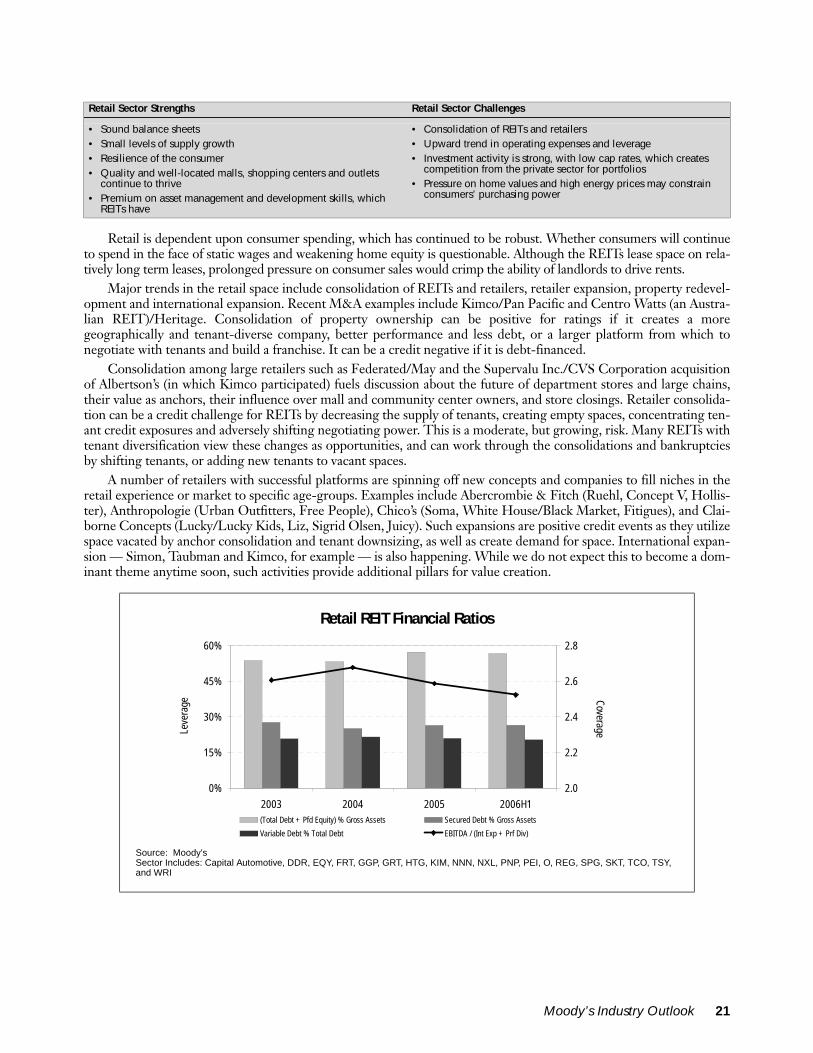
Retail is dependent upon consumer spending, which has continued to be robust. Whether consumers will continueto spend in the face of static wages and weakening home equity is questionable. Although the REITs lease space on rela-tively long term leases, prolonged pressure on consumer sales would crimp the ability of landlords to drive rents.
Major trends in the retail space include consolidation of REITs and retailers, retailer expansion, property redevel-opment and international expansion. Recent M&A examples include Kimco/Pan Pacific and Centro Watts (an Austra-lian REIT)/Heritage. Consolidation of property ownership can be positive for ratings if it creates a moregeographically and tenant-diverse company, better performance and less debt, or a larger platform from which tonegotiate with tenants and build a franchise. It can be a credit negative if it is debt-financed.
Consolidation among large retailers such as Federated/May and the Supervalu Inc./CVS Corporation acquisitionof Albertson’s (in which Kimco participated) fuels discussion about the future of department stores and large chains,their value as anchors, their influence over mall and community center owners, and store closings. Retailer consolida-tion can be a credit challenge for REITs by decreasing the supply of tenants, creating empty spaces, concentrating ten-ant credit exposures and adversely shifting negotiating power. This is a moderate, but growing, risk. Many REITs withtenant diversification view these changes as opportunities, and can work through the consolidations and bankruptciesby shifting tenants, or adding new tenants to vacant spaces.
A number of retailers with successful platforms are spinning off new concepts and companies to fill niches in theretail experience or market to specific age-groups. Examples include Abercrombie & Fitch (Ruehl, Concept V, Hollis-ter), Anthropologie (Urban Outfitters, Free People), Chico’s (Soma, White House/Black Market, Fitigues), and Clai-borne Concepts (Lucky/Lucky Kids, Liz, Sigrid Olsen, Juicy). Such expansions are positive credit events as they utilizespace vacated by anchor consolidation and tenant downsizing, as well as create demand for space. International expan-sion — Simon, Taubman and Kimco, for example — is also happening. While we do not expect this to become a dom-inant theme anytime soon, such activities provide additional pillars for value creation.
Retail Sector Strengths Retail Sector Challenges
• Sound balance sheets• Small levels of supply growth• Resilience of the consumer• Quality and well-located malls, shopping centers and outlets
continue to thrive• Premium on asset management and development skills, which
REITs have
• Consolidation of REITs and retailers• Upward trend in operating expenses and leverage• Investment activity is strong, with low cap rates, which creates
competition from the private sector for portfolios• Pressure on home values and high energy prices may constrain
consumers’ purchasing power
Retail REIT Financial Ratios
Source: Moody'sSector Includes: Capital Automotive, DDR, EQY, FRT, GGP, GRT, HTG, KIM, NNN, NXL, PNP, PEI, O, REG, SPG, SKT, TCO, TSY, and WRI
0%
15%
30%
45%
60%
2003 2004 2005 2006H1
Leve
rage
2.0
2.2
2.4
2.6
2.8
Coverage
(Total Debt + Pfd Equity) % Gross Assets Secured Debt % Gross Assets
Variable Debt % Total Debt EBITDA / (Int Exp + Prf Div)
Moody’s Industry Outlook 21

Mall and Outlet REIT Financial Ratios
Source: Moody'sSector Includes: GGP, GRT, PEI, SPG, SKT, and TCO
Shopping Center REIT Financial Ratios
Source: Moody'sSector Includes: DDR, EQY, FRT, HTG, KIM, NXL, PNP, REG and WRI
Triple Net Lease REIT Financial Ratios
Source: Moody'sSector Includes: Capital Automotive, NNN, O and TSY
0%
15%
30%
45%
60%
75%
2003 2004 2005 2006H1
Leve
rage
2.0
2.1
2.2
2.3
2.4
2.5
Coverage
(Total Debt + Pfd Equity) % Gross Assets Secured Debt % Gross Assets
Variable Debt % Total Debt EBITDA / (Int Exp + Prf Div)
0%
15%
30%
45%
60%
75%
2003 2004 2005 2006H1
Leve
rage
2.5
2.6
2.7
2.8
2.9
3.0
Coverage
(Total Debt + Pfd Equity) % Gross Assets Secured Debt % Gross Assets
Variable Debt % Total Debt EBITDA / (Int Exp + Prf Div)
0%
15%
30%
45%
60%
75%
2003 2004 2005 2006H1
Leve
rage
2.2
2.3
2.4
2.5
2.6
2.7
Coverage
(Total Debt + Pfd Equity) % Gross Assets Secured Debt % Gross Assets
Variable Debt % Total Debt EBITDA / (Int Exp + Prf Div)
22 Moody’s Industry Outlook

HEALTHCARE SECTORMoody’s has a stable rating outlook for healthcare REITs. Our sector outlook reflects strengthening fundamentalsacross the major healthcare property types, particularly the important skilled nursing facility (SNF) and assisted livingfacility (ALF) segments. The SNF sector’s health is highly reliant on government reimbursement via the Medicare andMedicaid programs. The Centers for Medicare & Medicaid Services (CMS) recently announced that SNFs willreceive a 3.1% market basket increase for 2007, so we expect continued steady performance from this sub-sector forthe next 12-18 months. Given federal and state budget deficits, skilled nursing could experience reimbursement cutsfor 2008, although we do not expect significant changes would occur in an election year. Furthermore, property-levelcoverages have been improving, and Moody’s believes operators generally have sufficient cushion to absorb whatwould likely be modest cuts. The assisted living facility sector — another leading investment category for REITs — isalso performing well. ALFs have largely recovered from the supply-demand imbalance that plagued the sector in thelate 1990s and early 2000s. The decrease in new supply has helped ALF operators begin to realize revenue growth viaboth higher rental rates and occupancy.
Retail Senior Debt Subordinate Preferred Stock Outlook/Review Status
Capital Automotive REIT Ba3 — B1 Stable Capital Automotive L.P. Ba1*Developers Diversified Realty Baa2 — Baa3 Stable JDN Realty Corporation Baa2 — —Equity One Baa3 — (P)Ba1 Positive Federal Realty Investment Trust Baa2 Baa3 Baa3 StableGeneral Growth Properties, Inc. (P)Ba2 — (P)B1 Stable GGP Properties Limited Partnership (P)Ba2 — — Price Development Company, L.P. Ba1 — — Rouse Company (the) Ba1 — —Glimcher Realty Trust (P)Ba2 (P)Ba3 B1 StableHeritage Property investment Trust, Inc. — — — Stable Heritage Property Investment L.P Baa3 — — Bradley Operating Limited Partnership Baa3 — —Kimco Realty Corporation Baa1 — Baa2 Stable Kimco North Trust III Baa1 — — Price REIT, Inc. (The) Baa1 — — Pan Pacific Retail Properties, Inc. Baa1 (P)Baa2 (P)Baa2 Review for Downgrade Western Properties Trust Baa1 — —National Retail Properties, Inc. Baa3 (P)Ba1 Ba1 Stable New Plan Excel Realty Trust Baa2 (P)Baa3 Baa3 Stable New Plan Realty Trust Baa2 — Baa3 Excel Realty Trust, Inc Baa2 — Baa3Pennsylvania Real Estate Investment Trust — — B1 StableRealty Income Corporation Baa2 (P)Baa3 Baa3 Positive Regency Centers Corporation — — (P)Baa3 Stable Regency Centers, L.P. Baa2 — —Simon Property Group, Inc. — — Baa2 Positive Chelsea Property Group, Inc. Baa1 — — CPG Partners, L.P. Baa1 — — Simon DeBartolo P.A.T. 1996-1 Baa1 — — Simon Property Group, L.P. Baa1 — — Corporate Property Investors Baa1 — —Tanger Factory Outlet Centers — — Ba1 Stable Tanger Properties, L.P. Baa3 (P)Ba1 —Taubman Centers, Inc. — — B1 StableTrustreet Properties, Inc B1 — B3 StableWeingarten Realty Investors A3 Baa1 Baa1 Negative
*Bank LineAs of 8/31/06
Moody’s Industry Outlook 23
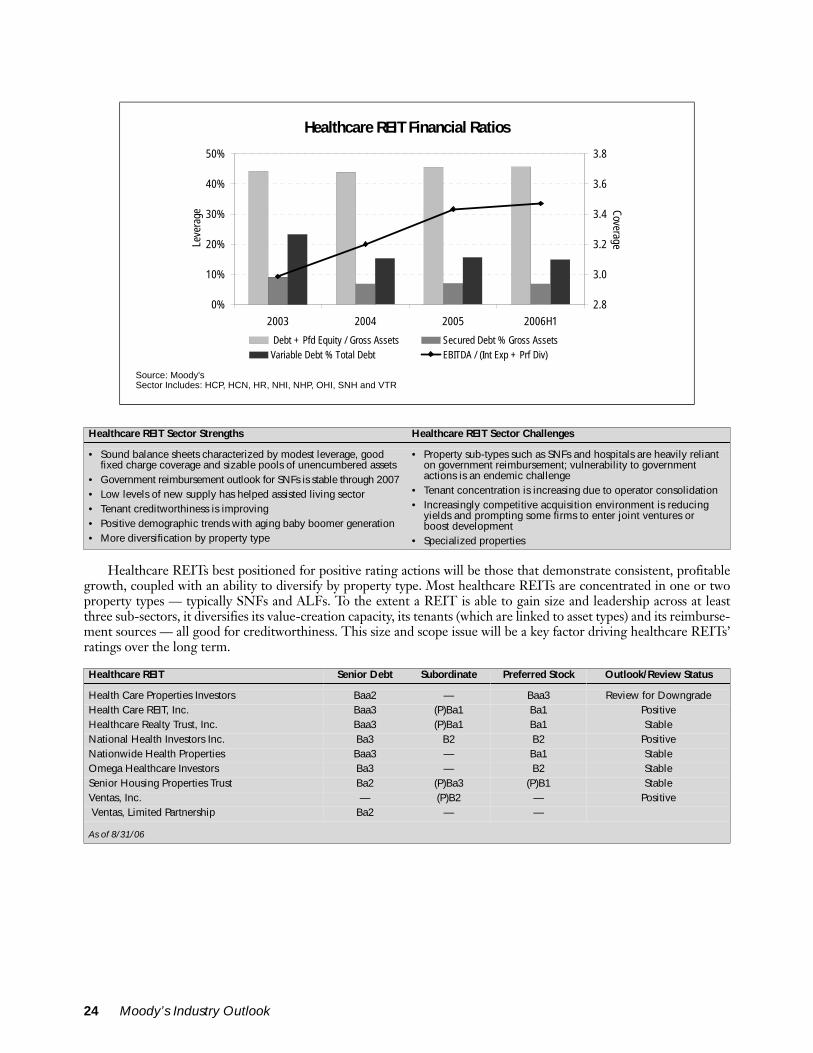
Healthcare REITs best positioned for positive rating actions will be those that demonstrate consistent, profitablegrowth, coupled with an ability to diversify by property type. Most healthcare REITs are concentrated in one or twoproperty types — typically SNFs and ALFs. To the extent a REIT is able to gain size and leadership across at leastthree sub-sectors, it diversifies its value-creation capacity, its tenants (which are linked to asset types) and its reimburse-ment sources — all good for creditworthiness. This size and scope issue will be a key factor driving healthcare REITs’ratings over the long term.
Healthcare REIT Financial Ratios
Source: Moody'sSector Includes: HCP, HCN, HR, NHI, NHP, OHI, SNH and VTR
Healthcare REIT Sector Strengths Healthcare REIT Sector Challenges
• Sound balance sheets characterized by modest leverage, good fixed charge coverage and sizable pools of unencumbered assets
• Government reimbursement outlook for SNFs is stable through 2007• Low levels of new supply has helped assisted living sector• Tenant creditworthiness is improving• Positive demographic trends with aging baby boomer generation• More diversification by property type
• Property sub-types such as SNFs and hospitals are heavily reliant on government reimbursement; vulnerability to government actions is an endemic challenge
• Tenant concentration is increasing due to operator consolidation• Increasingly competitive acquisition environment is reducing
yields and prompting some firms to enter joint ventures or boost development
• Specialized properties
Healthcare REIT Senior Debt Subordinate Preferred Stock Outlook/Review Status
Health Care Properties Investors Baa2 — Baa3 Review for DowngradeHealth Care REIT, Inc. Baa3 (P)Ba1 Ba1 Positive Healthcare Realty Trust, Inc. Baa3 (P)Ba1 Ba1 Stable National Health Investors Inc. Ba3 B2 B2 Positive Nationwide Health Properties Baa3 — Ba1 Stable Omega Healthcare Investors Ba3 — B2 StableSenior Housing Properties Trust Ba2 (P)Ba3 (P)B1 Stable Ventas, Inc. — (P)B2 — Positive Ventas, Limited Partnership Ba2 — —
As of 8/31/06
0%
10%
20%
30%
40%
50%
2003 2004 2005 2006H1
Leve
rage
2.8
3.0
3.2
3.4
3.6
3.8
Coverage
Debt + Pfd Equity / Gross Assets Secured Debt % Gross AssetsVariable Debt % Total Debt EBITDA / (Int Exp + Prf Div)
24 Moody’s Industry Outlook

LODGING SECTORMoody’s rating outlook for the lodging REITs remains positive, reflecting a rebound in the industry fundamentals,which has led to improvements in credit metrics. Since the beginning of 2005, Moody’s upgraded four lodging REITs,and maintains positive outlooks on two lodging REITs. During this period, Moody’s took only one negative ratingaction, which was related to a levered acquisition.
During the first six months of 2006, expansion in the hospitality industry, which began in the second half of 2004,forged ahead, and lodging REITs benefited from it with strong operating results, in addition to pursuit and growth ofa number of new markets and lines of business. In tandem with this strength in fundamentals, these REITs’ credit pro-files have been moving in the positive direction. The solid lodging fundamentals are evidenced by enduring growth inrevenue per available room (RevPAR), driven by both average daily rates (ADR), and occupancy increases. The major-ity of RevPAR growth came from rises in ADR; this is especially favorable for driving operating income.
Lodging REITs’ business growth and surging earnings have manifested themselves via improved credit metrics forthe sector. Coverages have been on a steady rise since 2004, reflecting increased cash flows. Both total and securedleverage have remained stable on a book basis, and we would not anticipate historical figures to be immediatelyaffected by the resurgence in the sector’s earnings (other than through debt repayment). Positively, floating rate debthas decreased, which is especially favorable in a rising interest rate environment.
Moody’s expects that strong hospitality fundamentals will persist into at least early 2007 (assuming no major exog-enous stresses, such as a terrorist attack). The supply-demand equilibrium of the lodging industry has been tilted inREITs’ favor for a number of quarters. This beneficial imbalance is supported by stable national economic growth (USGDP is forecasted to increase by a healthy 3.4% in 20069) and by limited new construction. Although a recession or aneconomic slowdown, along with expense pressures, could pose a risk to the lodging environment, near-term curtail-ment in business travel, one of the key demand drivers, is unlikely in light of the 21% growth in corporate profits fore-casted for 200610. While consumers, another vital source of lodging demand, have felt the pinch of high gasolineprices, this seems to be moderating. Still, lodging REITs are experiencing some cost pressures — particularly in laborand insurance. However, in this cycle the threat of overbuilding does not loom as large as it has often had in the pastdue to high construction costs that curtail new development, as well as improved market transparency.
Moody’s anticipates that lodging REITs will continue to reap the benefits of the upswing in the industry to strate-gically grow and improve the quality of their property portfolios without sacrificing balance sheet stability. Further rat-ing upgrades will primarily reflect performance improvements, and in particular, balance sheet strengthening, as wellas broadening of size, scope and diversity.
9. Source: Moody’s Economy.com, Precis Macro.10. Ibid.
Lodging REIT Sector Strengths Lodging REIT Sector Challenges
• Strong demand from both business and leisure segments• Limited new construction• Stable leverage• Improved profitability and coverages• Decreased variable debt
• Pressure on consumer spending from high gas prices, debt, weak housing market
• High gasoline prices affecting “drive-to” destinations• Increasing expenses (labor, insurance)
Moody’s Industry Outlook 25
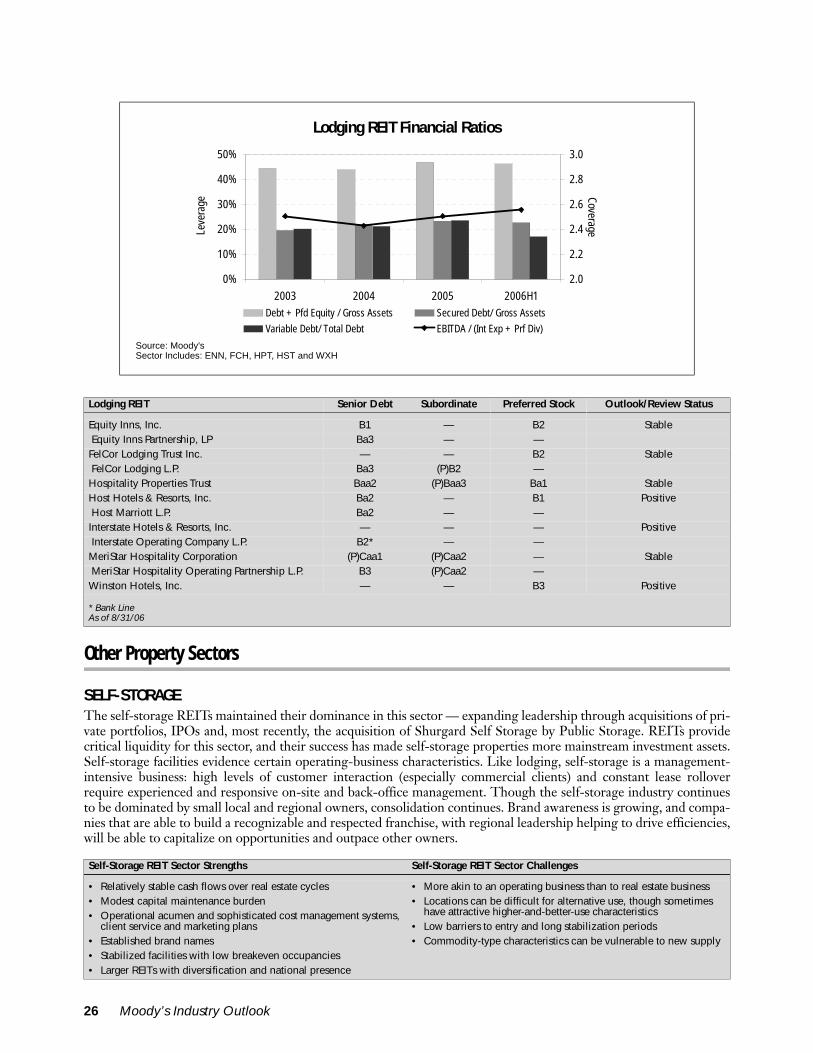
Other Property Sectors
SELF-STORAGEThe self-storage REITs maintained their dominance in this sector — expanding leadership through acquisitions of pri-vate portfolios, IPOs and, most recently, the acquisition of Shurgard Self Storage by Public Storage. REITs providecritical liquidity for this sector, and their success has made self-storage properties more mainstream investment assets.Self-storage facilities evidence certain operating-business characteristics. Like lodging, self-storage is a management-intensive business: high levels of customer interaction (especially commercial clients) and constant lease rolloverrequire experienced and responsive on-site and back-office management. Though the self-storage industry continuesto be dominated by small local and regional owners, consolidation continues. Brand awareness is growing, and compa-nies that are able to build a recognizable and respected franchise, with regional leadership helping to drive efficiencies,will be able to capitalize on opportunities and outpace other owners.
Lodging REIT Financial Ratios
Source: Moody'sSector Includes: ENN, FCH, HPT, HST and WXH
Lodging REIT Senior Debt Subordinate Preferred Stock Outlook/Review Status
Equity Inns, Inc. B1 — B2 Stable Equity Inns Partnership, LP Ba3 — —FelCor Lodging Trust Inc. — — B2 Stable FelCor Lodging L.P. Ba3 (P)B2 —Hospitality Properties Trust Baa2 (P)Baa3 Ba1 StableHost Hotels & Resorts, Inc. Ba2 — B1 Positive Host Marriott L.P. Ba2 — —Interstate Hotels & Resorts, Inc. — — — Positive Interstate Operating Company L.P. B2* — —MeriStar Hospitality Corporation (P)Caa1 (P)Caa2 — Stable MeriStar Hospitality Operating Partnership L.P. B3 (P)Caa2 —Winston Hotels, Inc. — — B3 Positive
* Bank LineAs of 8/31/06
Self-Storage REIT Sector Strengths Self-Storage REIT Sector Challenges
• Relatively stable cash flows over real estate cycles• Modest capital maintenance burden• Operational acumen and sophisticated cost management systems,
client service and marketing plans• Established brand names• Stabilized facilities with low breakeven occupancies• Larger REITs with diversification and national presence
• More akin to an operating business than to real estate business• Locations can be difficult for alternative use, though sometimes
have attractive higher-and-better-use characteristics• Low barriers to entry and long stabilization periods• Commodity-type characteristics can be vulnerable to new supply
0%
10%
20%
30%
40%
50%
2003 2004 2005 2006H1
Leve
rage
2.0
2.2
2.4
2.6
2.8
3.0
Coverage
Debt + Pfd Equity / Gross Assets Secured Debt/ Gross Assets
Variable Debt/ Total Debt EBITDA / (Int Exp + Prf Div)
26 Moody’s Industry Outlook
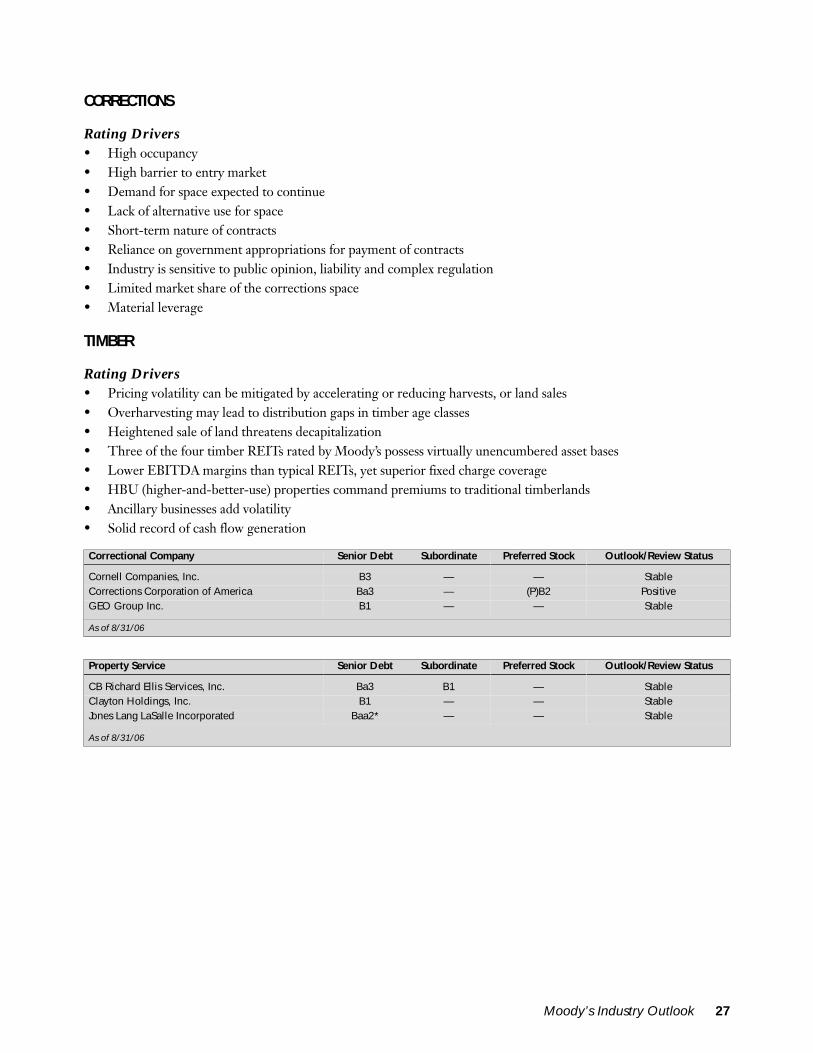
CORRECTIONS
Rating Drivers• High occupancy• High barrier to entry market• Demand for space expected to continue• Lack of alternative use for space• Short-term nature of contracts• Reliance on government appropriations for payment of contracts• Industry is sensitive to public opinion, liability and complex regulation• Limited market share of the corrections space• Material leverage
TIMBER
Rating Drivers• Pricing volatility can be mitigated by accelerating or reducing harvests, or land sales• Overharvesting may lead to distribution gaps in timber age classes• Heightened sale of land threatens decapitalization• Three of the four timber REITs rated by Moody’s possess virtually unencumbered asset bases• Lower EBITDA margins than typical REITs, yet superior fixed charge coverage• HBU (higher-and-better-use) properties command premiums to traditional timberlands• Ancillary businesses add volatility• Solid record of cash flow generation
Correctional Company Senior Debt Subordinate Preferred Stock Outlook/Review Status
Cornell Companies, Inc. B3 — — StableCorrections Corporation of America Ba3 — (P)B2 Positive GEO Group Inc. B1 — — Stable
As of 8/31/06
Property Service Senior Debt Subordinate Preferred Stock Outlook/Review Status
CB Richard Ellis Services, Inc. Ba3 B1 — StableClayton Holdings, Inc. B1 — — StableJones Lang LaSalle Incorporated Baa2* — — Stable
As of 8/31/06
Moody’s Industry Outlook 27
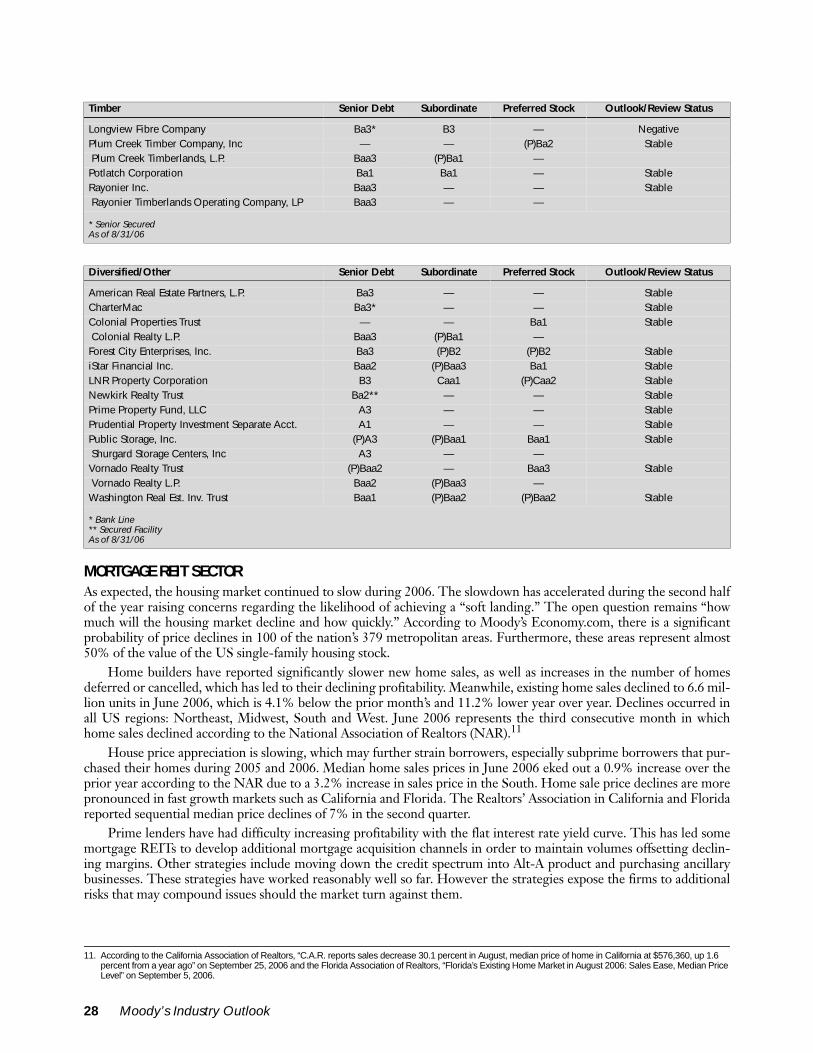
MORTGAGE REIT SECTORAs expected, the housing market continued to slow during 2006. The slowdown has accelerated during the second halfof the year raising concerns regarding the likelihood of achieving a “soft landing.” The open question remains “howmuch will the housing market decline and how quickly.” According to Moody’s Economy.com, there is a significantprobability of price declines in 100 of the nation’s 379 metropolitan areas. Furthermore, these areas represent almost50% of the value of the US single-family housing stock.
Home builders have reported significantly slower new home sales, as well as increases in the number of homesdeferred or cancelled, which has led to their declining profitability. Meanwhile, existing home sales declined to 6.6 mil-lion units in June 2006, which is 4.1% below the prior month’s and 11.2% lower year over year. Declines occurred inall US regions: Northeast, Midwest, South and West. June 2006 represents the third consecutive month in whichhome sales declined according to the National Association of Realtors (NAR).11
House price appreciation is slowing, which may further strain borrowers, especially subprime borrowers that pur-chased their homes during 2005 and 2006. Median home sales prices in June 2006 eked out a 0.9% increase over theprior year according to the NAR due to a 3.2% increase in sales price in the South. Home sale price declines are morepronounced in fast growth markets such as California and Florida. The Realtors’ Association in California and Floridareported sequential median price declines of 7% in the second quarter.
Prime lenders have had difficulty increasing profitability with the flat interest rate yield curve. This has led somemortgage REITs to develop additional mortgage acquisition channels in order to maintain volumes offsetting declin-ing margins. Other strategies include moving down the credit spectrum into Alt-A product and purchasing ancillarybusinesses. These strategies have worked reasonably well so far. However the strategies expose the firms to additionalrisks that may compound issues should the market turn against them.
Timber Senior Debt Subordinate Preferred Stock Outlook/Review Status
Longview Fibre Company Ba3* B3 — NegativePlum Creek Timber Company, Inc — — (P)Ba2 Stable Plum Creek Timberlands, L.P. Baa3 (P)Ba1 —Potlatch Corporation Ba1 Ba1 — StableRayonier Inc. Baa3 — — Stable Rayonier Timberlands Operating Company, LP Baa3 — —
* Senior SecuredAs of 8/31/06
Diversified/Other Senior Debt Subordinate Preferred Stock Outlook/Review Status
American Real Estate Partners, L.P. Ba3 — — StableCharterMac Ba3* — — StableColonial Properties Trust — — Ba1 Stable Colonial Realty L.P. Baa3 (P)Ba1 —Forest City Enterprises, Inc. Ba3 (P)B2 (P)B2 Stable iStar Financial Inc. Baa2 (P)Baa3 Ba1 StableLNR Property Corporation B3 Caa1 (P)Caa2 StableNewkirk Realty Trust Ba2** — — StablePrime Property Fund, LLC A3 — — StablePrudential Property Investment Separate Acct. A1 — — StablePublic Storage, Inc. (P)A3 (P)Baa1 Baa1 Stable Shurgard Storage Centers, Inc A3 — —Vornado Realty Trust (P)Baa2 — Baa3 Stable Vornado Realty L.P. Baa2 (P)Baa3 —Washington Real Est. Inv. Trust Baa1 (P)Baa2 (P)Baa2 Stable
* Bank Line ** Secured FacilityAs of 8/31/06
11. According to the California Association of Realtors, “C.A.R. reports sales decrease 30.1 percent in August, median price of home in California at $576,360, up 1.6 percent from a year ago” on September 25, 2006 and the Florida Association of Realtors, “Florida’s Existing Home Market in August 2006: Sales Ease, Median Price Level” on September 5, 2006.
28 Moody’s Industry Outlook

The interest rate environment is also affecting the subprime sector. Slowing origination volumes have pushedmortgage REITs, as well as others in the mortgage industry, to lower underwriting standards in order to maintain vol-umes. In Moody’s view this is the age old reaction to slowing volumes and it has never ended on a good note. Deterio-ration in underwriting standards coupled with risk stacking that has occurred over the last few years is a significantconcern. Over the past few years rising home values fueled by low interest rates and readily available capital has miti-gated concerns regarding risk stacking. However, higher interest rates coupled with price appreciation that is flat tonegative may create payment problems for adjustable rate borrowers, especially subprime borrowers. In the secondquarter of 2006, the delinquency rate on first mortgages posted its first substantial increase since mid-2002, accordingto CreditForecast.com.
Moody’s expects modest decline in home prices, as well as declines in origination volume to limit growth opportu-nities. The declines should be manageable as long as the economy remains healthy and unemployment does notincrease significantly. However, REITs with significant product (e.g., option arm, interest-only, etc.) or geographicconcentrations may not fare as well. As the housing economy moderates declines in mortgage related employment, asignificant contributor to employment growth over the last several years, is a significant unknown.
Related Research
Rating Methodologies:Rating Methodology for REITs and Other Commercial Property Firms, January 2006 (96211)Key Ratios For Rating REITs And Other Property Firms, December 2004 (91014)Special Comments:U.S. Office REITs Sector Commentary, September 2006 (99289)Lodging REIT Sector Strong - Performance Continues, September 2006 (98987)Healthcare REITs - Getting Better, August 2006 (98885)Rating Triggers in Real Estate Finance Companies – 2006 Update, August 2006 (98648)Fair Value Accounting for Investment Properties Is on the Horizon: How Will It Affect REIT Covenants?,June 2006 (97738)REIT Joint Ventures and Funds: Weighing the Pluses and Minuses, April 2006 (97276)
To access any of these reports, click on the entry above. Note that these references are current as of the date of publication of this reportand that more recent reports may be available. All research may not be available to all clients.
Mortgage REIT Senior Debt Subordinate Preferred Stock Outlook/Review Status
Saxon Capital, Inc. B2 — — Review for UpgradeThornburg Mortgage, Inc. Ba2 — B1 Stable
As of 8/31/06
Moody’s Industry Outlook 29

PAGE INTENTIONALLY LEFT BLANK

PAGE INTENTIONALLY LEFT BLANK

© Copyright 2006, Moody’s Investors Service, Inc. and/or its licensors and affiliates including Moody’s Assurance Company, Inc. (together, “MOODY’S”). All rights reserved. ALLINFORMATION CONTAINED HEREIN IS PROTECTED BY COPYRIGHT LAW AND NONE OF SUCH INFORMATION MAY BE COPIED OR OTHERWISE REPRODUCED, REPACKAGED,FURTHER TRANSMITTED, TRANSFERRED, DISSEMINATED, REDISTRIBUTED OR RESOLD, OR STORED FOR SUBSEQUENT USE FOR ANY SUCH PURPOSE, IN WHOLE OR IN PART, INANY FORM OR MANNER OR BY ANY MEANS WHATSOEVER, BY ANY PERSON WITHOUT MOODY’S PRIOR WRITTEN CONSENT. All information contained herein is obtained byMOODY’S from sources believed by it to be accurate and reliable. Because of the possibility of human or mechanical error as well as other factors, however, such information is provided “asis” without warranty of any kind and MOODY’S, in particular, makes no representation or warranty, express or implied, as to the accuracy, timeliness, completeness, merchantability or fitnessfor any particular purpose of any such information. Under no circumstances shall MOODY’S have any liability to any person or entity for (a) any loss or damage in whole or in part caused by,resulting from, or relating to, any error (negligent or otherwise) or other circumstance or contingency within or outside the control of MOODY’S or any of its directors, officers, employees oragents in connection with the procurement, collection, compilation, analysis, interpretation, communication, publication or delivery of any such information, or (b) any direct, indirect,special, consequential, compensatory or incidental damages whatsoever (including without limitation, lost profits), even if MOODY’S is advised in advance of the possibility of suchdamages, resulting from the use of or inability to use, any such information. The credit ratings and financial reporting analysis observations, if any, constituting part of the informationcontained herein are, and must be construed solely as, statements of opinion and not statements of fact or recommendations to purchase, sell or hold any securities. NO WARRANTY,EXPRESS OR IMPLIED, AS TO THE ACCURACY, TIMELINESS, COMPLETENESS, MERCHANTABILITY OR FITNESS FOR ANY PARTICULAR PURPOSE OF ANY SUCH RATING OR OTHEROPINION OR INFORMATION IS GIVEN OR MADE BY MOODY’S IN ANY FORM OR MANNER WHATSOEVER. Each rating or other opinion must be weighed solely as one factor in anyinvestment decision made by or on behalf of any user of the information contained herein, and each such user must accordingly make its own study and evaluation of each security and ofeach issuer and guarantor of, and each provider of credit support for, each security that it may consider purchasing, holding or selling. MOODY’S hereby discloses that most issuers of debt securities (including corporate and municipal bonds, debentures, notes and commercial paper) and preferred stock rated byMOODY’S have, prior to assignment of any rating, agreed to pay to MOODY’S for appraisal and rating services rendered by it fees ranging from $1,500 to $2,400,000. Moody’s Corporation(MCO) and its wholly-owned credit rating agency subsidiary, Moody’s Investors Service (MIS), also maintain policies and procedures to address the independence of MIS’s ratings and ratingprocesses. Information regarding certain affiliations that may exist between directors of MCO and rated entities, and between entities who hold ratings from MIS and have also publiclyreported to the SEC an ownership interest in MCO of more than 5%, is posted annually on Moody’s website at www.moodys.com under the heading “Shareholder Relations — CorporateGovernance — Director and Shareholder Affiliation Policy.” This credit rating opinion has been prepared without taking into account any of your objectives, financial situation or needs. You should, before acting on the opinion, consider theappropriateness of the opinion having regard to your own objectives, financial situation and needs.
32 Moody’s Industry Outlook
To order reprints of this report (100 copies minimum), please call 1.212.553.1658.Report Number: 100092
Authors Senior Associate Production Associate Production Specialist
Christopher Wimmer, CFA Lin Zheng Shubhra Bhatnagar Yung LouiePhilip Kibel, CPA

ProLogis (PLD) Is ProLogis’ Money Management Business Undervalued?
February 17, 2006 ! Recent Price $52.34 ! DJIA 11,115 ! RMZ 911
Important disclosure on the last page.
Exhibit 1 The average publicly traded money manager is valued at a price/earnings multiple of over 22. The finite-life nature of most existing PLD funds suggests a lower warranted multiple. However, the move toward infinite-life vehicles, plus the impressive growth potential of the REIT’s money management business, argues for a much higher multiple. Name Ticker Forward P/E (1) Alliance Capital AC 18.1 Amvescap AVZ 19.7 Blackrock Inc. BLK 29.0 Cohen & Steers CNS 25.2 Eaton Vance EV 21.5 Franklin Resources BEN 20.4 Janus Capital Group JNS 28.3 Nuveen Investments JNC 19.4 T. Rowe Price Group TROW 21.0
22.5
(1) Based on consensus analyst estimate and closing share price on 02/15/06.
I. Overview ProLogis (PLD) recently announced the creation of yet another huge co-investment fund. The $4 billion vehicle will serve as a dedicated take-out source for its growing North American development pipeline and will expand the REIT’s already sizable money management business by over 30% to $15 billion. PLD currently trades at the largest NAV premium of any company in our coverage universe in large part because of its extraordinarily successful merchant-building operating model that is supported by the company’s lucrative co-investment fund manage-ment business. Nevertheless, it is still fair to ques-tion whether the profitability and growth potential of the money management business is fully valued in PLD’s share price, especially in the context of the valuations ascribed to publicly-traded equity and fixed-income money managers. II. The New Fund PLD raised $1.5 billion in equity from third-party in-stitutional investors. With leverage, the vehicle will have $4 billion of total capacity. PLD intends to maintain a 20% interest in the fund, to be known as ProLogis North American Industrial Fund, which will serve as the primary take-out vehicle for PLD’s U.S. and Canadian development and redevelopment deals. By providing a pre-capitalized buyer for
PLD’s development, the fund mitigates an important source of risk in the merchant-building model. The fund has been seeded with $750 million of properties from PLD, leaving over $3 billion in additional capac-ity. At PLD’s current development pace, the fund could support the merchant-building business for approximately three years. Most of PLD’s existing $12 billion of co-investment funds are finite-life vehicles that have specific matur-ity dates ranging from 3-10 years. The new fund, by contrast, is an infinite-life vehicle. The infinite-life structure dissipates the risk that the lucrative fee stream that PLD enjoys expires upon maturity of the fund. As a result, the earnings multiple investors ascribe to an infinite-life fund should be materi-ally higher than for finite-life funds. From the in-vestors’ standpoint, the key benefit of the infinite-life vehicle is enhanced liquidity. Over time, PLD hopes to become a market maker in the shares of the fund. However, the company has established safe-guards in order to avoid “a run on the bank” such as those that recently afflicted several large real estate funds in Germany. PLD is required to make a “reasonable” effort to provide liquidity to the fund’s shareholders, but it can not be forced to liquidate assets if it deems the sales to be detrimental to the interest of the other investors in the fund. Equity commitments were received from new and returning investors from all continents, placing a stamp of approval on PLD’s track record and its abil-
A D V I S O R S GREEN STREET
567 San Nicolas Drive, Suite 200 ! Newport Beach, CA 92660 (949) 640-8780 ! Fax (949) 640-1773 ! www.greenstreetadvisors.com

Page 2
ProLogis © 2006, Green Street Advisors, Inc. - Use of this report is subject to the Terms of Use listed on last page.
ity to attract a diverse group of capital providers. This significant equity commitment comes on top of more than $1 billion raised in Japan in August ‘05. PLD’s track record and well-established relation-ships with institutional investors, along with an un-quenchable thirst for real estate among institutional players, suggests significant growth potential for PLD’s money management model in the coming years. III. Fee Structure PLD management suggested that property, asset management, leasing, and construction fees in the new fund could amount to 75-100 basis points on total asset value, which appears slightly higher than the current average across all of PLD’s existing co-investment funds. We estimate that the incremental net profit margin on these fees should approximate 75% since the money management business is highly scalable. In addition, PLD may receive incen-tive fees (a.k.a. a promoted interest) for exceeding a 9% IRR threshold every three years. Performance will be measured through distributed cash flows and an independent third-party appraisal. This approach is consistent with the current value net income met-ric used by Green Street as a component of the
Franchise Value ranking for companies in our cover-age universe. There is no “clawback” provision on the incentive fees. Clawbacks are sometimes used in private real estate funds in order for investors to recapture incentive fees that may have been paid in an up-market, but would not have been earned if the returns had been calculated over a longer time pe-riod. IV. Valuing the Money Management
Business PLD currently oversees $12 billion in co-investment assets, of which it owns $2.5 billion. With PLD’s de-velopment pace now exceeding $2 billion annually, assets under management could reach $20 billion by the end of the decade. While the current develop-ment pace is arguably above the sustainable level, PLD’s platform on three continents should help sta-bilize the development volume. In addition, the com-pany’s appetite for redevelopment-oriented acquisi-tions could further contribute to the money manage-ment platform over time. Valuing money management businesses has be-come a key focus in any valuation exercise for PLD
Exhibit 2 PLD now trades at the largest NAV premium of any company in our coverage universe. Premium to NAV
PLD REIT Average 43% 7%
The large premium is attributable to the extraordinarily successful international merchant-building busi-ness PLD has established, as well as the large, rapidly growing money management business the REIT has built. Other highly regarded developers that do not have a meaningful money management operation trade at NAV premiums of about 20-25%. Premium to NAV
Cousins Boston Properties Kilroy 25% 26% 20%
If we assume that PLD’s merchant building business accounts for 20-30 percentage points of its NAV pre-mium and that the balance of the premium is attributable to its money management business, then the implied multiple on the REIT’s existing money management fee stream is in the 40-60X range. The multi-ple is high relative to those ascribed to publicly traded money managers, but PLD's growth prospects ap-pear to be much better than most, supporting the higher level.
Developer’s Premium to NAV
Implied Money Manager Multiple
20% 60x
25% 52x 30% 43x

Page 3
ProLogis © 2006, Green Street Advisors, Inc. - Use of this report is subject to the Terms of Use listed on last page.
and several other REITs. In our analysis we directly value the existing fee income and in-the-money pro-moted interests in a company’s NAV estimate. Addi-tional value is ascribed in the Franchise Value rank-ing for companies that are likely to grow their money management business in the future. The existing fee income is typically valued via a multiple on cur-rent net income. The promoted interests are valued via a discounted cash flow analysis. In order to capture the enhanced durability of PLD’s fee stream as the result of its move to-wards infinite-life vehicles, we have increased the multiple used to value the existing fee in-come from 15X to 20X. The change results in a total value of $1 billion ($4.00/sh) for the business segment, and translates to a $1.00/sh (3%) increase in our NAV estimate to $36.50/sh. PLD’s money management operation is analogous to those of other equity and fixed-income asset managers, and publicly traded money manager valuations can be viewed as a good proxy for valuing PLD’s on-going management fees. Large publicly-traded investment managers currently change hands at an average P/E multiple in excess of 22X. Unlike PLD, mutual fund managers do not typically invest capital in their funds, which increases the operating leverage in the business. However, their income stream can be more volatile due to the easy redemption features of most mutual funds and institutional investment allo-cations.
The in-the-money promoted interests are valued at $300 million ($1.25/sh) using an average discount rate of 10%. The value is highly sensitive to as-sumptions regarding the pace of future same-property NOI growth and residual cap rates. PLD is also awarded an above-average Franchise Value compared to its industrial peers to reflect the future value expected to be created through its expanding merchant-building and money management opera-tions. An argument could be made for using a higher multiple (something like 40X or 50X) to value the money management business because of the enticing growth prospects. However, we choose to capture expected future value creation of all types (e.g. acquisitions, development, joint ventures, money management) through Franchise Value rank-ings. To award PLD a high Franchise Value rank-ing and also use a growth-anticipating earnings multiple to value the money management busi-ness would be double counting. V. Recommendation PLD has raised over $2.5 billion of equity for co-investment funds in Japan and North America over the past 6 months, swallowed a $5 billion competitor through stock and debt issuance, put in place a $2.6 billion multi-currency line of credit, and issued prop-erty debt at very low spreads to treasuries in Europe. PLD’s enviable success in the capital markets is turning into a tangible competitive advantage. While
A New Source of FFO? In early January, PLD purchased its 80% partner’s share in three co-investment funds. The properties were subsequently used to seed the newly-formed North American fund. In the process, PLD realized three one-time gains that it will include in its 1Q06 FFO: • A $14 million ($0.06/sh) deferred gain from marking to market the value of the properties contributed to
the old funds at the time they were contributed; • A $22 million ($0.09/sh) promoted interest (which is almost as high as the company’s profits from hold-
ing the real estate); • A $31 million ($0.13/sh) gain from property appreciation over the life of the old funds on PLD’s 20% in-
terest The $31 million gain marks the first time that PLD has included a gain on assets that had previously been depreciated. This practice is commonplace at industrial peers CenterPoint (CNT) and First Industrial (FR). However, including sales gains on depreciated properties is not sanctioned in NAREIT’s FFO definition, and it was a surprising addition to PLD’s ’06 FFO roster. The importance of sales gains in PLD’s FFO (45% of total ’05 FFO) makes the work of earnings-focused investors quite complicated. Multiple-based valuations need to be sensitive to the prominence of sales gains, particularly if PLD increasingly includes gains that most other REITs exclude from FFO.

Page 4
ProLogis © 2006, Green Street Advisors, Inc. - Use of this report is subject to the Terms of Use listed on last page.
the risks to a merchant-building business model could become acutely visible in a rising cap rate en-vironment, the near-term outlook for development and industrial fundamentals on a global basis is positive. Our NAV-based Pricing Model concludes that PLD should trade at a 46% premium to NAV compared to the 7% premium at which the average REIT cur-rently trades. When the premium is applied to our revised NAV estimate of $36.50/sh, a warranted price of $53.50/sh is indicated. At the current price, we maintain our BUY recommendation on the shares of PLD.
Jim Sullivan Cedrik Lachance

Green Street’s Disclosure Information Conflicts of interests can seriously impinge the ability of analysts to do their job, and investors should demand unbiased research. In that spirit, Green Street adheres to the following policies regarding conflicts of interest: • We do not engage in the underwriting of securities. • Our employees are prohibited from owning the shares of any company in our coverage universe. • Our trading desk does not commit capital. • We do not perform M&A advisory work for companies in our coverage universe. • Our employees do not serve as officers or directors of any company in our coverage universe. • Companies that we cover do not, in any manner, compensate us for inclusion in our coverage universe. • We do not accept consulting assignments, provide fairness opinions for, or otherwise accept any customized engagements from companies within our
coverage universe. • A number of companies we cover, including PLD, pay us an annual fee to receive our core research product. We do not solicit this business and, in
aggregate, it represents less than 2% of our revenue. • We serve as a sub-advisor to (but do not exercise control over) an entity that may own debt securities issued by companies in our coverage universe. Some
of our employees have ownership interests in that entity.
While minimization of potential conflicts will remain a very important priority for us, we reserve the right to change any of these policies at any time. We encourage a careful comparison of these policies with those of other research providers, and welcome the opportunity to discuss them. Investment advice proves to be wrong about as often as it is right. While we strive to do better than this, our recommendations will include bad calls and we are certain to make other mistakes as well. This document may well contain errors of fact. We have done our best to utilize data that we believe to be reliable, but no assumption should be made that the data has been verified, or is accurate and complete. This report should not be considered to represent an offer to buy or sell the securities discussed herein, and all opinions are subject to change without notice. Green Street Advisors is an accredited member of the Investorsidesm Research Association, whose mission is to increase investor and pensioner trust in the U.S. capital markets system through the promotion and use of investment research that is financially aligned with investor interests. Analyst Certification: I, Jim Sullivan, hereby certify that all of the views expressed in this research report accurately reflect my personal views about any and all of the subject companies or securities. I also certify that my specific recommendation(s) or view(s) in this report are in no way, directly or indirectly, influenced by the source or the structure of my compensation. I also certify that no part of my compensation was, is, or will be directly or indirectly related to the specific recommendation(s) or view(s) in this report.
At any given time, Green Street publishes roughly the same number of “BUY” recommendations that it does “SELL” recommendations.
Green Street’s “BUYs” have historically achieved far higher total returns than its ”HOLDs”, which, in turn, have outperformed its “SELLs”.1
The chart below shows PLD’s price performance over the last three years, along with Green Street’s recommendations during that time.
(1) Historical results through January 3, 2005 were independently verified by Ernst & Young, LLP. E&Y did not verify stated results subsequent to January 3, 2005. Past performance results cannot be used to predict future performance. For a complete explanation of study, see 5/9/03 report "How are We Doing?".
(2) Study uses recommendations given in Green Street's "Real Estate Securities Monthly" from January 29, 1993 through February 1, 2006. (3) Not directly comparable to Green Street performance indices because NAREIT includes more companies and uses market-cap weightings (Green Street applies
straight averages). (4) Green Street has only three recommendations: BUY (“B”), HOLD (“H”) and SELL (“S”).
Certified Provider
Terms of Use: This report is the proprietary and confidential information of Green Street Advisors, Inc., and is protected by copyright. This report is not sold, but is licensed for personal, limited, non-transferable use as follows: You may use this report solely for reference for internal business purposes. You may not use this report for any other purpose. You may not reproduce, distribute, sell, lend, license or otherwise transfer or provide this report or a copy of it or any of its contents for any purpose. You may not disclose this report or any of its contents to any person except to fellow employees working at your work location. Except for the rights expressly granted to you above, all rights with respect to this report are reserved by Green Street Advisors, Inc.
Green Street Recommendation Distribution(as of 2/1/06)
0
10
20
30
40
BUYs HOLDs SELLs
# of
com
pani
es u
nder
cov
erag
e
Year2006 YTD2
20052004200320022001200019991998199719961995199419932
455.6%Annualized 29.8% 12.7% 2.5% 14.1%
Total Return2 2860.4% 371.1% 37.1%29.4% 5.4% 6.7% 12.4%20.5% -0.7% -9.3% 3.2%23.6% 14.3% -0.4% 15.3%47.3% 30.2% 17.5% 35.3%37.1% 14.2% 5.8% 20.3%-0.6% -15.1% -16.4% -17.5%14.2% -9.2% -20.2% -4.6%53.6% 29.3% 4.4% 26.4%35.7% 19.1% 11.9% 13.9%
Total Return of Green Street's Recommendations
Y
ear E
nded
Dec
embe
r 31:
Buy Hold Sell NAREIT Eqty3
17.7% 2.6% 1.9% 3.8%42.7% 37.2% 20.9% 37.1%
26.3% 18.3% -1.9% 12.2%42.3% 28.4% 15.5% 31.6%
6.6% 4.5% 5.3% 7.3%
PLD Price Performance (w ith Green Street Recommendations4)
BHSHS
$0
$20
$40
$60
2-03
5-03
8-03
11-0
3
2-04
5-04
8-04
11-0
4
2-05
5-05
8-05
11-0
5
2-06