Embed Size (px)
Citation preview

Joint United Nations Regional Commissions
Trade Facilitation and
Paperless Trade
Implementation Survey 2015
Asia and the Pacific Report
Institutional
arrangement and
cooperation
Transparency
Formalities
Paperless
trade
Cross-border
paperless trade

ESCAP is the regional development arm of the United Nations and serves as the main
economic and social development centre for the United Nations in Asia and the Pacific. Its
mandate is to foster cooperation between its 53 members and 9 associate members. ESCAP
provides the strategic link between global and country-level programmes and issues. It
supports Governments of the region in consolidating regional positions and advocates regional
approaches to meeting the region’s unique and socio-economic challenges in a globalizing
world. The ESCAP office is located in Bangkok, Thailand. Please visit our website at
www.unescap.org for further information.
Copyright © ESCAP 2015 All rights reserved
The report is available at: http://unnext.unescap.org/UNTFsurvey2015.asp
Disclaimers:
The designation employed and the presentation of the material in the Report do not imply the
expression of any opinion whatsoever on the part of the Secretariat of the United Nations
concerning the legal status of any country, territory, city or area or of its authorities, or
concerning the delimitation of its frontiers or boundaries. The United Nations bears no
responsibility for the availability or functioning of URLs.
Opinions, figures and estimates set forth in this publication are the responsibility of the authors,
and should not necessarily be considered as reflecting the views or carrying the endorsement of
the United Nations. Any errors are the responsibility of the authors. Mention of firm names and
commercial products does not imply the endorsement of the United Nations.
The report has been issued without formal editing.

i
Preface
In September 2014, the United Nations Regional Commissions (UNRCs) including ECA, ECE, ECLAC,
ESCAP and ESCWA, initiated a global survey to collect data and information on trade facilitation and
paperless trade implementation from their respective member states. Conducted in collaboration with
UNCTAD, OECD, ITC, OCO and SELA, the results of the survey are expected to enable countries and their
development partners to better understand and monitor progress in trade facilitation, support
evidence-based policy-making, identify good practices and identify capacity building and technical
assistance needs.
The global survey represents a key initiative under the framework of the Joint UNRC Approach to Trade
Facilitation, which was agreed upon by the Executive Secretaries of the five UNRCs in Beirut (January
2010) to enable the UNRCs to present a joint (global) view on key trade facilitation issues. The
questionnaire for the global survey was jointly prepared and finalized by UNRCs and OECD to ensure
data could be shared and compared.
The global survey builds on an annual regional survey carried out by ESCAP since 2012. It covers not only
implementation of some important measures included in the WTO Trade Facilitation Agreement (TFA)
but also of measures aimed at enabling paperless trade, or the conduct of trade using electronic rather
than paper-based data and documentation. Indeed, a recent ESCAP study found that “next generation”
trade facilitation measures have just as much potential as more traditional measures to reduce trade
costs and increase intra- and extra-regional trade, with full implementation of cross-border paperless
trade expected to generate USD 257 billion of additional export potential annually for the Asia-Pacific
region alone.1
This regional report is part of this global survey effort. It was prepared by Yann Duval, Tengfei Wang and
Dimitra Tsoulou Malakoudi, Trade Facilitation Unit, Trade and Investment Division, ESCAP.
1 http://www.unescap.org/resources/estimating-benefits-cross-border-paperless-trade

ii
[This page has been intentionally left blank]
iii
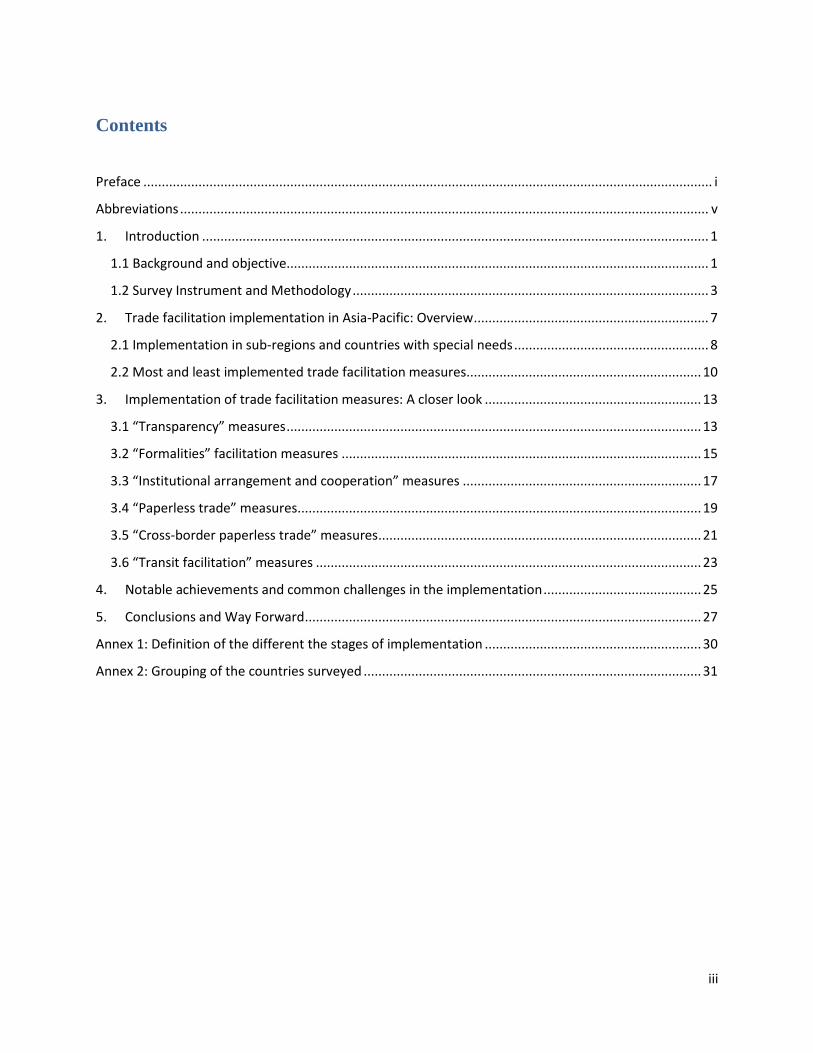
Contents
Preface ........................................................................................................................................................... i
Abbreviations ................................................................................................................................................ v
1. Introduction .......................................................................................................................................... 1
1.1 Background and objective................................................................................................................... 1
1.2 Survey Instrument and Methodology ................................................................................................. 3
2. Trade facilitation implementation in Asia-Pacific: Overview ................................................................ 7
2.1 Implementation in sub-regions and countries with special needs ..................................................... 8
2.2 Most and least implemented trade facilitation measures................................................................ 10
3. Implementation of trade facilitation measures: A closer look ........................................................... 13
3.1 “Transparency” measures ................................................................................................................. 13
3.2 “Formalities” facilitation measures .................................................................................................. 15
3.3 “Institutional arrangement and cooperation” measures ................................................................. 17
3.4 “Paperless trade” measures.............................................................................................................. 19
3.5 “Cross-border paperless trade” measures ........................................................................................ 21
3.6 “Transit facilitation” measures ......................................................................................................... 23
4. Notable achievements and common challenges in the implementation ........................................... 25
5. Conclusions and Way Forward ............................................................................................................ 27
Annex 1: Definition of the different the stages of implementation ........................................................... 30
Annex 2: Grouping of the countries surveyed ............................................................................................ 31
iv
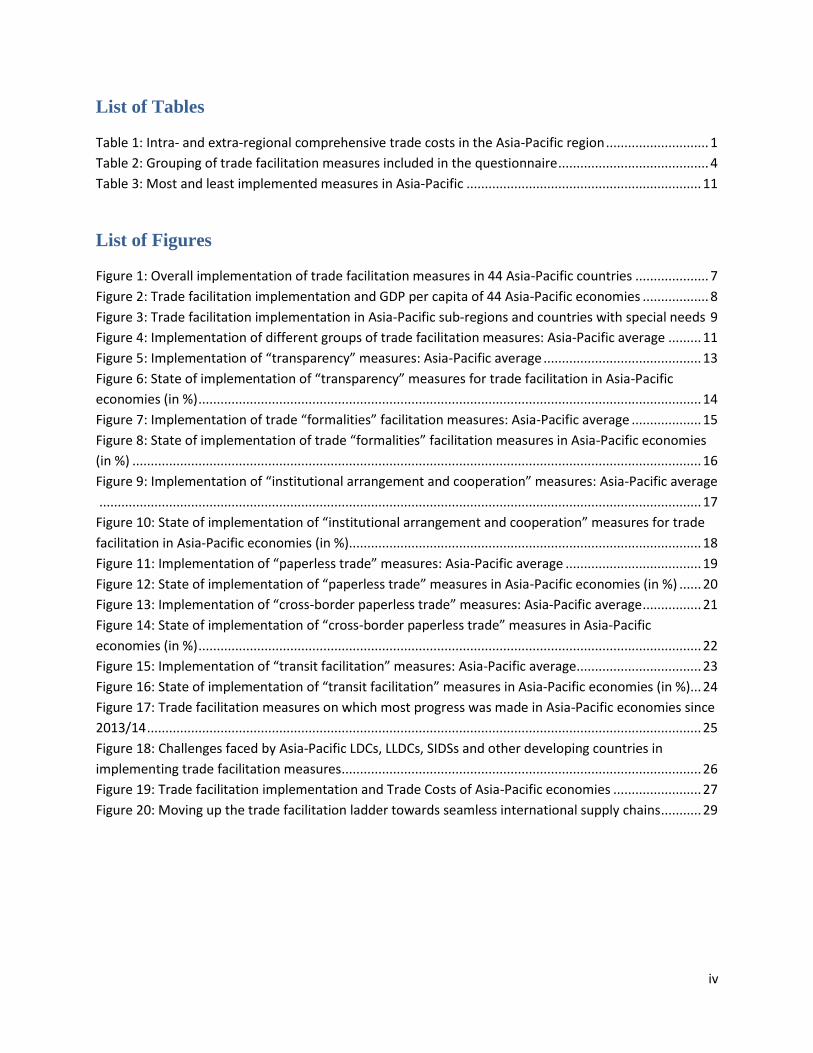
List of Tables
Table 1: Intra- and extra-regional comprehensive trade costs in the Asia-Pacific region ............................ 1
Table 2: Grouping of trade facilitation measures included in the questionnaire ......................................... 4
Table 3: Most and least implemented measures in Asia-Pacific ................................................................ 11
List of Figures
Figure 1: Overall implementation of trade facilitation measures in 44 Asia-Pacific countries .................... 7
Figure 2: Trade facilitation implementation and GDP per capita of 44 Asia-Pacific economies .................. 8
Figure 3: Trade facilitation implementation in Asia-Pacific sub-regions and countries with special needs 9
Figure 4: Implementation of different groups of trade facilitation measures: Asia-Pacific average ......... 11
Figure 5: Implementation of “transparency” measures: Asia-Pacific average ........................................... 13
Figure 6: State of implementation of “transparency” measures for trade facilitation in Asia-Pacific
economies (in %) ......................................................................................................................................... 14
Figure 7: Implementation of trade “formalities” facilitation measures: Asia-Pacific average ................... 15
Figure 8: State of implementation of trade “formalities” facilitation measures in Asia-Pacific economies
(in %) ........................................................................................................................................................... 16
Figure 9: Implementation of “institutional arrangement and cooperation” measures: Asia-Pacific average
.................................................................................................................................................................... 17
Figure 10: State of implementation of “institutional arrangement and cooperation” measures for trade
facilitation in Asia-Pacific economies (in %)................................................................................................ 18
Figure 11: Implementation of “paperless trade” measures: Asia-Pacific average ..................................... 19
Figure 12: State of implementation of “paperless trade” measures in Asia-Pacific economies (in %) ...... 20
Figure 13: Implementation of “cross-border paperless trade” measures: Asia-Pacific average ................ 21
Figure 14: State of implementation of “cross-border paperless trade” measures in Asia-Pacific
economies (in %) ......................................................................................................................................... 22
Figure 15: Implementation of “transit facilitation” measures: Asia-Pacific average .................................. 23
Figure 16: State of implementation of “transit facilitation” measures in Asia-Pacific economies (in %)... 24
Figure 17: Trade facilitation measures on which most progress was made in Asia-Pacific economies since
2013/14 ....................................................................................................................................................... 25
Figure 18: Challenges faced by Asia-Pacific LDCs, LLDCs, SIDSs and other developing countries in
implementing trade facilitation measures .................................................................................................. 26
Figure 19: Trade facilitation implementation and Trade Costs of Asia-Pacific economies ........................ 27
Figure 20: Moving up the trade facilitation ladder towards seamless international supply chains ........... 29

v
Abbreviations
ADB……………………………………………………… Asian Development Bank AEO……………………………………………………… Authorized economic operator APoA…………………………………………………….. Almaty Programme of Action AU……………………………………………………….. Australia ASEAN…………………………………………………... Association of Southeast Asian Nations ASYCUDA………………………………………………. Automated System for Customs Data ECA……………………………………………………… United Nations Economic Commission for Africa ECE……………………………………………………… United Nations Economic Commission for Europe ECLAC………………………………………………….. United Nations Economic Commission for Latin
America and the Caribbean ENEA……………………………………………………. East and North-East Asia ESCAP…………………………………………………… United Nations Economic and Social Commission for
Asia and the Pacific ESCWA………………………………………………….. United Nations Economic and Social Commission for
Western Asia EU………………………………………………………... European Union GATT……………………………………………………. General Agreement on Tariffs and Trade ICT……………………………………………………….. Information and communications technology IRU………………………………………………………. International Road Transport Union ITC……………………………………………………….. International Trade Centre Lao PDR…………………………………………………. Lao People’s Democratic Republic LDC……………………………………………………… Least developed country LLDC…………………………………………………….. Landlocked developing country NCA……………………………………………………… North and Central Asia NTFC…………………………………………………….. National trade facilitation committee NZ………………………………………………………... New Zealand OCO……………………………………………………… Oceania Customs Organization OECD……………………………………………………. Organization for Economic Co-operation and
Development PIDE……………………………………………………... Pacific island developing economies SAARC…………………………………………………... South Asian Association for Regional Cooperation SEA……………………………………………………… South-East Asia SELA…………………………………………………….. Latin American and Caribbean Economic System SIDS……………………………………………………... Small island developing states SSWA……………………………………………………. South and South-West Asia TF………………………………………………………... Trade facilitation TFA……………………………………………………… Trade Facilitation Agreement UN/CEFACT…………………………………………….. United Nations Centre for Trade Facilitation and
Electronic Business UNCTAD………………………………………………… United Nations Conference on Trade and Development UNNExT…………………………………………………. United Nations Network of Experts for Paperless Trade
and Transport for Asia and the Pacific UNRC……………………………………………………. United Nations Regional Commission USA……………………………………………………… United States of America USD……………………………………………………… United States dollar WTO……………………………………………………... World Trade Organization

vi
[This page has been intentionally left blank]

1
1. Introduction
1.1 Background and objective
It is well understood that reducing trade costs is essential in enabling economies to effectively
participate in regional and global value chains and continue to use trade as a main engine of growth and
sustainable development. According to the latest data from the ESCAP-World Bank International Trade
Cost Database, the overall cost of trading goods among the three largest European Union (EU)
economies is equivalent to a 43% average tariff on the value of goods traded (see Table 1). China, the
Republic of Korea and Japan (East Asia-3) come closest to matching the low intra-EU trade costs, with
average trade costs among themselves amounting to a 51% tariff-equivalent, followed by the middle-
income members of the Association of Southeast Asian Nations (ASEAN), whose intra-regional trade
costs stand at 76% tariff-equivalent.
Table 1: Intra- and extra-regional comprehensive trade costs in the Asia-Pacific region (excluding tariff costs), 2008-2013
(Sub-)Regions ASEAN-4 East Asia-3 North &
Central Asia-4 Pacific
Islands-2 South Asia SAARC-4
AU-NZ EU-3
ASEAN-4 76% (9%)
East Asia-3 75% (5%) 51% (-5%)
North & Central Asia-4 351% (9%) 177% (-7%) 121 (9%)
Pacific Islands -2 175% (-11%) 174% (-9%) 368% (34%) 133% (-10%)
South Asia SAARC-4 128% (2%) 125% (-0%) 282% (13%) 317% (2%) 114% (10%)
AU-NZ 101% (4%) 89% (-3%) 338% (-5%) 73% (-22%) 142% (-1%) 54% (1%)
EU-3 108% (2%) 85% (-4%) 152% (-8%) 211% (-6%) 114% (3%) 109% (0%) 43% (-4%)
USA 85% (11%) 63% (-0%) 180% (2%) 163% (-11) 109% (6%) 100% (4%) 67% (0%)
Source: ESCAP-World Bank Trade Cost Database (June 2015 update). Available at: http://databank.worldbank.org/data/views/variableselection/selectvariables.aspx?source=escap-world-bank-international-trade-costs and http://www.unescap.org/tid/artnet/trade-costs.asp. Notes: Trade costs may be interpreted as tariff equivalents. Percentage changes in trade costs between 2002-2007 and 2008-2013 are in parentheses. ASEAN-4: Indonesia, Malaysia, Philippines, Thailand; East Asia-3: China, Japan, Republic of Korea; North and Central Asia-4: Georgia, Kazakhstan, Kyrgyzstan, Russian Federation; Pacific islands-2: Fiji, Papua New Guinea; SAARC-4: Bangladesh, India, Pakistan, Sri Lanka; AU-NZ: Australia, New-Zealand; EU-3: Germany, France, United Kingdom; USA: United States of America.
Other groups of Asia-Pacific economies face much higher costs of trading among each other,
particularly in Central Asia, South Asia, and the South Pacific. However, the scope for further reducing
trade costs among Asia-Pacific developing economies is best understood when looking at inter-regional
trade costs with, for example, the trade costs between Southeast (ASEAN-4) and South (SAARC-4) Asian

2
economies (128%), two neighboring Asian sub-regions, still much higher than those between ASEAN and
the EU (108%) or between SAARC and the United States of America (109%).
Recent studies suggest that much of the trade cost reductions achieved over the past decade
have been through elimination or lowering of tariffs.2 Further trade cost reduction therefore, will have
to come from tackling non-tariff sources of trade costs, such as inefficient transport and logistics
infrastructure and services, but also cumbersome regulatory procedures and documentation. Indeed,
trade facilitation (the simplification and harmonization of import, export and transit procedures),
including paperless trade (the use and exchange of electronic data and documents to support the trade
transaction process), has taken increasing importance as evidenced by the successful conclusion of the
negotiations on a WTO Trade Facilitation Agreement in December 2013, and the progress made at
ESCAP on developing a complementary regional arrangement for the facilitation of cross-border
paperless trade since 2012.
For the past several years, the ESCAP Secretariat has set out to systematically collect and
analyze information on the implementation of trade facilitation measures in the region, to provide a
basis for developing more relevant capacity building and technical assistance programs as well as for
countries to design and prioritize their own trade facilitation implementation plans and strategies.
Taking into account the interest of Member States from the region in the application of modern
information and communication technologies (ICT) to trade procedures, a first regional survey on trade
facilitation and paperless trade implementation was conducted in 2012, in conjunction with the Asia-
Pacific Trade Facilitation Forum organized annually by ESCAP with the Asian Development Bank (ADB).3
One conclusion from that first survey effort was that it “should be treated as a continuous, rather than
an ad-hoc ‘one-off’ activity”.4 Accordingly, a second regional survey was conducted in 2013/14.5
Following extensive discussions at the Global Trade Facilitation Forum 20136 on the lack of
reliable and sufficiently detailed and regularly updated data on the implementation of trade facilitation
in general - and single window and paperless trade in particular -, it was decided that the next survey
(2014/15) should be conducted jointly by all United Nations Regional Commissions (UNRCs) at the global
level, in cooperation with other interested international organizations.7
This report is therefore part of the new global effort and features the results of the 2015 UNRCs
Joint Survey on Trade Facilitation and Paperless Trade implementation for the Asia-Pacific region. It
covers 44 developed and developing economies from five 5 different sub-regions. In contrast with the
2 For example, see ESCAP (2011), Asia-Pacific Trade and Investment Report 2011, United Nations.
3 The scope of the survey was based on the definition and list of trade facilitation measures being discussed by the
WTO Negotiation Group on Trade facilitation, but also extended to paperless trade measures, i.e., measures enabling the conduct of trade transactions on the basis of electronic rather than paper-based data and documents. 4 http://unnext.unescap.org/tfforum12-survey.asp.
5 More details are available at http://unnext.unescap.org/tfforum13-survey.asp.
6 Organized jointly by all the UN Regional Commissions (UNRCs) in Bangkok in November 2013. See
http://www.unescap.org/events/global-trade-facilitation-conference-2013 7 The survey has been conducted in close collaboration with OECD, ITC and UNCTAD, as well as several sub-
regional organizations, such as SELA in Latin America, and OCO in the South Pacific.

3
2012/13 and 2013/14 reports, this year’s report features data on the implementation of trade
facilitation measures for Pacific islands and Central Asian economies members of ESCAP. This was
achieved thanks to a close collaboration with relevant sub-regional organizations, in particular the
Oceania Customs Organization (OCO).
Following an introduction to the survey instrument and methodology in the next section, the
report first provides a region-wide overview of implementation of trade facilitation measures across
countries, sub-regions and in countries with special needs. This is followed by a closer look at the
implementation levels of various groups of trade facilitation measures, as well as a review of the main
trade facilitation achievements reported in Asia-Pacific economies over the past year and key challenges
faced. The report ends by highlighting some of the key findings and a brief discussion of the way forward
towards trade facilitation excellence.8
1.2 Survey Instrument and Methodology
The survey instrument was prepared taking into account the final list of provisions included in
the WTO Trade Facilitation Agreement (TFA) as well as the content of the draft text of the regional UN
treaty on cross-border paperless trade facilitation under negotiation at ESCAP. It covers 38 trade
facilitation measures divided into four groups, namely, General trade facilitation measures, Paperless
trade, Cross-border paperless trade and Transit facilitation.9
As can be seen from Table 2, the General trade facilitation measures – as well as Transit
facilitation measures - are essentially measures featured in the WTO TFA. In contrast, most paperless
trade and, in particular, cross-border paperless trade measures are not specifically featured in the WTO
TFA, although their implementation in many cases would support the better implementation of many of
the General trade facilitation measures. It is worth noting that, to ensure comparability of
implementation levels across countries, two of the measures classified under Institutional arrangement
and cooperation (No. 33, 34), one measure under Paperless trade (No. 20), and one measure under
Transit facilitation (No. 35) are excluded from the regional analysis.
8 Survey results for 5 sub-regions of Asia and the Pacific (South-East Asia, South and South-West Asia, North and
Central Asia, Pacific Island Developing Economies, and North-East Asia) as well as for 3 groups of Asia-Pacific economies with special needs (Least Developed Countries [LDCs], Landlocked Developing Countries [LLDCs], and Small Island Developing States [SIDs]) are discussed in more details in separate reports to be made available online at: http://unnext.unescap.org/UNTFsurvey2015.asp. We also make available the dataset for further analysis. 9 The survey questionnaire is available in full at: http://unnext.unescap.org/tfforum14-survey.asp

4
Table 2: Grouping of trade facilitation measures included in the questionnaire
Trade facilitation measure (and question No.) in the questionnaire
Ge
ne
ral T
F m
eas
ure
s
Transparency
2. Publication of existing import-export regulations on the Internet 3. Stakeholder consultation on new draft regulations (prior to their finalization) 4. Advance publication/notification of new regulation before their implementation (e.g., 30 days prior) 5. Advance ruling (on tariff classification) 9. Independent appeal mechanism (for traders to appeal Customs and other relevant trade control agencies’ rulings)
Formalities
6. Risk management (as a basis for deciding whether a shipment will be or not physically inspected) 7. Pre-arrival processing 8. Post-clearance audit 10. Separation of Release from final determination of customs duties, taxes, fees and charges 11. Establishment and publication of average release times 12. Trade facilitation measures for authorized operators 13. Expedited shipments 14. Acceptance of paper or electronic copies of supporting documents required for import, export or transit formalities.
Institutional arrangement
and cooperation
1. Establishment of a national trade facilitation committee or similar body 31. Cooperation between agencies on the ground at the national level 32. Government agencies delegating controls to Customs authorities 33. Alignment of working days and hours with neighbouring countries at border crossings, and 34. Alignment of formalities and procedures with neighbouring countries at border crossings
Paperless trade
15. Electronic/automated Customs System established (e.g., ASYCUDA) 16. Internet connection available to Customs and other trade control agencies at border-crossings 17. Electronic Single Window System 18. Electronic submission of Customs declarations 19. Electronic Application and Issuance of Trade Licenses 20. Electronic Submission of Sea Cargo Manifests 21. Electronic Submission of Air Cargo Manifests 22. Electronic Application and Issuance of Preferential Certificate of Origin 23. E-Payment of Customs Duties and Fees 24. Electronic Application for Customs Refunds
Cross-border paperless trade
25. Laws and regulations for electronic transactions are in place (e.g. e-commerce law, e-transaction law) 26. Recognized certification authority issuing digital certificates to traders to conduct electronic transactions 27. Engagement of the country in trade-related cross-border electronic data exchange with other countries 28. Certificate of Origin electronically exchanged between your country and other countries 29. Sanitary & Phyto-Sanitary Certificate electronically exchanged between your country and other countries 30. Banks and insurers in your country retrieving letters of credit electronically without lodging paper-based documents
Transit facilitation
35. Transit facilitation agreement(s) with neighbouring country(ies) 36. Customs Authorities limit the physical inspections of transit goods and use risk assessment 37. Supporting pre-arrival processing for transit facilitation 38. Cooperation between agencies of countries involved in transit

5
The dataset was developed following a three-step approach:
Step 1. Data submission by experts: The survey instrument was sent by the ESCAP Secretariat to
selected trade facilitation experts (from governments, private sector and/or academia) in Asia-Pacific
countries as well as the participants to the Asia-Pacific Trade Facilitation Forum 2014,10 to gather
preliminary information. The questionnaire was also made publicly available online and disseminated
with the support of OECD, ITC, UNCTAD, IRU as well as the United Nations Network of Experts for
Paperless Trade and Transport for Asia and the Pacific (UNNExT). In some cases, the questionnaire was
also sent to relevant national trade facilitation authorities or agencies and regional trade facilitation
partners or organizations. This first step took place essentially between September 2014 and March
2015.
Step 2. Data verification by the ESCAP secretariat: The ESCAP Secretariat cross-checked the
data collected in Step 1. Desk research and data sharing among UNRCs and survey partners were carried
out to further check the accuracy of data. Face-to-face or telephone interviews with key informants
were arranged to gather additional information when needed. The outcome of Step 2 was a consistent
set of responses per country. Step 2 took place as data was being received from individual experts,
essentially between October 2014 and April 2015.
Step 3. Data validation by national governments: The ESCAP Secretariat sent the completed
questionnaire to each national government to ensure that the country had the opportunity to review
the dataset and provide any additional information. The feedback from national governments was
incorporated to finalize the dataset. Step 3 took place between April and May 2015.11
For the purpose of analysis and presentation of the results, General trade facilitation measures
have been further divided into three sub-groups, namely, Transparency, Formalities, Institutional
arrangement and cooperation, as shown in Table 2. Based on the data collected, each of the trade
facilitation measures included in the survey and for which enough information was available was rated
either as “fully implemented”, “partially implemented”, “on a pilot basis”, or “not implemented”.
Definitions for each stage are provided in Annex 1. A score (weight) of 3, 2, 1 and 0 was assigned to each
of the 4 implementation stages in order to calculate implementation scores for individual measures
across countries, regions or categories. Country groupings used in the analysis are defined in Annex 2.
10
http://unnext.unescap.org/tfforum14.asp 11
Additional inputs on implementation of trade facilitation and paperless trade up to April 2015 in any of the countries covered are most welcome at any time to further improve the quality of the data and update the results to be maintained online.

6
[This page has been intentionally left blank]

7
2. Trade facilitation implementation in Asia-Pacific: Overview
Figure 1 shows the overall implementation levels of all 44 Asia-Pacific countries based on a
common set of 31 trade facilitation and paperless trade measures included in the survey12. The regional
average implementation of this comprehensive set of trade facilitation measures stands at 46.5%. The
implementation of trade facilitation measures in the region is very heterogeneous. Australia, Republic of
Korea and Singapore achieve implementation rates in excess of 85%, while implementation in several
other countries barely reaches 15%.
Figure 1: Overall implementation of trade facilitation measures in 44 Asia-Pacific countries
Source: ESCAP, UNRCs TF Survey 2015
12
Among 38 trade facilitation measures surveyed, three measures including 20. Electronic Submission of Sea Cargo Manifests, 33.Alignment of working days and hours with neighbouring countries at border crossings, and 34. Alignment of formalities and procedures with neighbouring countries at border crossings are excluded for calculating the overall score as they are not relevant to all countries surveyed. Similarly, four transit facilitation measures are also excluded. The overall score of each country is simply a summation of the scores of implementation (3,2,1 or 0) it receives for each trade facilitation measure. The maximum possible (full) score of a country is 93 and the average score across all 44 countries is 43.3 (or 46.5% in percentage term).
0%
20%
40%
60%
80%
100%
Transparency Formalities Institutional arrangement and cooperation Paperless trade Cross-border paperless trade

8
In general, more advanced or larger economies are at a higher level of trade facilitation than
many other countries in the region, while small or less developed countries, such as LDCs or small Pacific
countries, lag behind in the implementation of trade facilitation measures, particularly those related to
paperless trade. However, this is not always the case. For example, while both Cambodia and Lao PDR
are LDCs, both countries achieve high scores of implementation. Similarly, Maldives achieves a relatively
high score although it is a small island developing state (SIDS) that only recently graduated from the LDC
group.13
Further investigation of the level of trade facilitation implementation in relation to economic
development shows that, while high income economies systematically have achieved high levels of
trade facilitation implementation, implementation levels in low income economies differ dramatically
from one country to another, ranging from less than 15% to over 60% (see Figure 2).
Figure 2: Trade facilitation implementation and GDP per capita of 44 Asia-Pacific economies
Source: ESCAP, UNRCs TF Survey 2015; Worldbank World Development Indicators, accessed 29 May 2015.
2.1 Implementation in sub-regions and countries with special needs
Figure 3 presents an overview of the implementation of trade facilitation measures (measured
by percentage) in the sub-regions (indicated by the blue diamonds) and the groups of countries with
special needs, namely, LLDCs, LDCs and SIDS (indicated by the green triangles), as well as the average
level of implementation of each group of countries (indicated by the red bars). Aside from Australia and
13
Maldives graduated in 2011. More information is available at: http://www.un.org/en/development/desa/policy/cdp/ldc/ldc_graduated.shtml
0
10
20
30
40
50
60
70
80
90
100
0 10000 20000 30000 40000 50000 60000 70000
Trad
e f
acili
tati
on
imp
lem
en
tati
on
(%
)
GDP per capita (US$ 2013)

9
New Zealand (AU&NZ), the highest average level of implementation is obtained by East and North-East
Asia (ENEA) at 70%, followed by South-East Asia (SEA), North and Central Asia (NCA) and South and
South-West Asia (SSWA). Pacific Island Developing Economies (PIDEs) average implementation lags far
behind other sub-regions at only 25%.
Figure 3: Trade facilitation implementation in Asia-Pacific sub-regions and
countries with special needs
Trade Facilitation Implementation of individual economies (%)
Average Trade Facilitation Implementation of the group (%)
Source: ESCAP, UNRCs TF Survey 2015
Trade facilitation implementation varies widely within each sub-regional grouping. Differences
in trade facilitation implementation levels are widest in South-East Asia, but this is essentially due to
Myanmar and Timor-Leste, two economies that have only recently been able to actively engage in
international trade. In fact, regional integration processes appear to have played a significant and
positive role in trade facilitation implementation, with several LDCs in ASEAN, where regional
cooperation on trade facilitation has long been promoted, achieving higher implementation rates than
LDCs in other sub-regions. Differences in trade facilitation implementation levels are smallest within
PIDEs, which might also be explained by the strong emphasis of on-going economic cooperation
initiatives in this sub-region on trade facilitation – but arguably more likely by the fact that these small
and generally isolated economies all face relatively similar implementation constraints.
Countries with special needs in the Asia-Pacific region face particular challenges in
implementation of trade facilitation, in particular paperless trade and cross-border paperless trade
measures. This is reflected in the average implementation level of these countries, which varies
0%
10%
20%
30%
40%
50%
60%
70%
80%
90%
100%
Australia &
New Zealand
East and
North-EastAsia
South-East
Asia
North and
Central Asia
South and
South-WestAsia
Pacific Island
DevelopingEconomies
Landlocked
DevelopingCountries
Least
DevelopedCountries
Small Island
DevelopingStates

10
between 25 and 35% depending on the group of countries considered (see Figure 3). Interestingly, LLDCs
as a group appear to have achieved higher levels of trade facilitation on average than LDCs or SIDSs. This
is welcome news given the particular importance of trade facilitation for these economies and the
strong support of development partners to supporting implementation of trade and transport
facilitation in LLDCs, including in the context of the Almaty Programme of Action (APoA).14
2.2 Most and least implemented trade facilitation measures
All countries are engaged in implementation of various measures aimed at enhancing the
transparency of trade procedures, as well as in reducing the formalities associated with them. While
implementation levels vary greatly across countries for all categories of trade facilitation measures,
differences in overall implementation scores across countries are exacerbated by wide differences
among countries in the level of implementation of paperless trade measures, in particular cross-border
paperless trade. Indeed, while all but two economies in the region have taken steps towards
implementation of paperless trade, nearly a quarter of the countries have not implemented, even at the
pilot stage, any measure related to cross-border paperless trade, i.e., the exchange and legal recognition
of electronic trade data and documents across borders with trade partners.
Overall, as shown in Figure 4 and Table 3, “transparency” measures, including measures such as
Stakeholder consultation on new draft regulations prior to implementation; or Publication of existing
import-export regulations on the internet, have been the best implemented (regional average
implementation > 60%), followed by “transit facilitation” measures (57%). Measures aimed at reducing
or speeding-up “formalities”, in particular implementation of Risk management and Pre-arrival
processing of documents, have also been given serious attention in many economies of the region, with
the regional average implementation rate exceeding 50% in that category. Regional average
implementation also reaches 50% for measures related to “institutional arrangements and inter-agency
cooperation” (50%), in particular as many countries are working on Establishment of national trade
facilitation committees.
The regional average level of implementation of “paperless trade” measures also stands close to
50%. However, implementation varies greatly depending on the individual measures considered. For
example, while Internet connections available to Customs and other trade control agencies at border-
crossings and Electronic/automated Customs System are partially or fully implemented in nearly all
countries, facilities enabling the Electronic application and Issuance of Preferential Certificate of Origin
have yet to be considered for implementation in many economies. Similarly, while many economies
have developed legal frameworks to enable paperless trade, implementation of “cross-border paperless
trade” has yet to begin in many developing countries.
14
http://www.unescap.org/events/final-regional-review-almaty-programme-action-addressing-special-needs-landlocked-developing

11
The next section reviews regional implementation of the 6 groups of measures featured in
Figure 4 in more details.
Figure 4: Implementation of different groups of trade facilitation measures: Asia-Pacific average
Note: Blue dots show regional average implementation level of individual measures within each group. Average regional implementation level by groups of measures. Source: ESCAP, UNRCs TF Survey 2015
Table 3: Most and least implemented measures in Asia-Pacific (within each group of trade facilitation measures)
Most implemented Least implemented
Transparency
1. Stakeholder consultation on new draft regulations (prior to their implementation) 2. Publication of existing import-export regulations on the internet
1. Advance ruling (on tariff classification) 2. Advance publication/notification of new regulation before their implementation
Formalities 1. Risk management 2. Pre-arrival processing
1. Establishment and publication of average release times 2. Trade facilitation measures for authorized operators
Institutional arrangement
and cooperation
1. Cooperation between agencies on the ground at the national level 2. Establishment of National Trade Facilitation Committee
1. Government agencies delegating controls to Customs authorities
Paperless trade
1. Internet connection available to Customs and other trade control agencies at border-crossings 2. Electronic/automated Customs System
1. Electronic Application and Issuance of Preferential Certificate of Origin 2. Electronic Application for Customs Refunds
Cross-border paperless
trade
1. Laws and regulations for electronic transactions 2. Recognised certification authority
1. Banks and insurers retrieving letters of credit electronically without lodging paper-based documents 2. Electronic exchange of Sanitary & Phyto-Sanitary Certificate
Transit facilitation
- Cooperation between agencies of countries involved in transit - Customs authorities limit the physical inspections of transit goods and use risk assessment
1. Supporting pre-arrival processing for transit facilitation
Source: ESCAP, UNRCs TF Survey 2015
0%
20%
40%
60%
80%
100%
Transparency Formalities Institutional
arrangement and
cooperation
Paperless trade Cross-border
paperless trade
Transit facilitation

12
[This page has been intentionally left blank]

13
0%
50%
100%
Publication of existing import-export regulations
on the internet
Stakeholder consultation on new draft regulations
(prior to their finalization)
Advance publication/notification of new regulation
before their implementationAdvance ruling (on tariff classification)
Independent appeal mechanism
Asia-Pacific average South-East Asia average East and North-East Asia average
North and Central Asia average South and South-West Asia average Pacific Island Developing Economies average
3. Implementation of trade facilitation measures: A closer look
3.1 “Transparency” measures
Five trade facilitation measures included in the survey can be categorized as “transparency”
measures. They relate to Articles 1-5 of the WTO TFA and GATT Article X on Publication and
Administration of Trade Regulations. Figure 5 confirms that the average level of implementation of all
five “transparency” measures across the region is well in excess of 50%, indicating a significantly higher
level of implementation as compared to other types of measures. It also shows that implementation
levels of these measures across sub-regions vary widely, with East-Asia achieving near full
implementation of these measures. Implementation of advance rulings is found to be particularly
lacking in both North and Central Asia and the Pacific Islands Developing Economies.
Figure 5: Implementation of “transparency” measures: Asia-Pacific average
Source: ESCAP, UNRCs TF Survey 2015
Figure 6 lists the number of countries that have fully and partially implemented “transparency”
measures in descending order. Stakeholder consultation on new draft regulations (prior to their

14
finalization) is the most implemented “transparency” measure in the region, as more than 95% of the 44
economies have either fully or partially implemented it.
Figure 6: State of implementation of “transparency” measures for trade facilitation in Asia-Pacific
economies (in %)
Source: ESCAP, UNRCs TF Survey 2015
The least implemented “transparency” measures are Advance ruling (on tariff classification) and
Advance publication/notification of new regulation before their implementation. However, both have
been already either fully or partially implemented by 75 per cent of the countries (or 33 countries) in the
region. Two countries, namely Azerbaijan and Mongolia, are implementing these two measures on a
pilot basis. Nine countries have not started implementing them yet.
The other two measures in this group, Publication of existing import-export regulations on the
internet and Independent appeal mechanism, have been implemented by most countries surveyed.
Interestingly, although these two measures are not the most implemented measures in this group when
partial implementation is taken into account, they have been “fully implemented” in more countries
than any other measures in this group. This may be partly due to the fact that it is indeed much easier to
assess whether these two measures have been fully implemented than to determine whether sufficient
and systematic consultations on trade regulations are taking place – in turn suggesting the possible need
to develop more detailed implementation criteria or guidelines regarding that measure.
0% 10% 20% 30% 40% 50% 60% 70% 80% 90% 100%
Advance publication/notification of new regulation before their
implementation
Advance ruling (on tariff classification)
Independent appeal mechanism
Publication of existing import-export regulations on the internet
Stakeholder consultation on new draft regulations (prior to their
finalization)
Fully Implemented Partially Implemented Pilot Stage of Implementation Not Implemented Don't Know

15
0%
50%
100%
Risk management
Pre-arrival processing
Post-clearance audit
Separation of Release from final determination of
customs duties, taxes, fees and charges
Establishment and publication of average release
times
Trade facilitation measures for authorized
operators
Expedited shipments
Acceptance of paper or electronic copies of
supporting documents required for import, exportor transit formalities
Asia-Pacific average South-East Asia average East and North-East Asia average
North and Central Asia average South and South-West Asia average Pacific Island Developing Economies average
3.2 “Formalities” facilitation measures
Eight of the general trade facilitation measures included in the survey are categorized as
“formalities” facilitation measures, aimed at streamlining and/or expediting regulatory trade
procedures. They relate to Articles 6-10 of the WTO TFA and GATT Article VIII on “Fees and Formalities
connected with Importation and Exportation”. The level of implementation at the regional level is found
to vary significantly across measures in this group (Figure 7). Risk management, Pre-arrival processing
and, to a lesser extent, Post-clearance audit, are well on their way to be implemented. In contrast, the
implementation of Trade facilitation measures for authorized operators and Establishment and
publication of average release times has been generally limited, although countries in both the East and
North-East Asia and South-East Asia sub-regions seem to have implemented both of them to a
significant extent.
Figure 7: Implementation of trade “formalities” facilitation measures: Asia-Pacific average
Source: ESCAP, UNRCs TF Survey 2015
Figure 8 shows that Risk management has been implemented by 41 countries, or 93% of the
Asia-Pacific countries surveyed, although in some cases only on a pilot basis. Pre-arrival processing has
been partially or fully implemented by over 85% of the countries (38 countries). Two other measures,
namely, Post-clearance audit and Separation of release from final determination of customs duties,

16
taxes, fees and charges, have also been either fully or partially implemented by 75% of the countries
surveyed. However, the latter is much less fully implemented than other popular measures in this group
(i.e., by less than 25% of the countries), suggesting that countries may need relatively more support and
guidance to complete implementation of that particular measure.
Figure 8: State of implementation of trade “formalities” facilitation measures in Asia-Pacific economies (in %)
Source: ESCAP, UNRCs TF Survey 2015
Acceptance of copies of supporting documents instead of originals as well as measures to
facilitate Expedited (express) shipping is fully implemented in 30% of the countries, and is under
implementation in a majority of countries of the region. This is a welcome finding, as both measures are
particularly important facilitation measures for small and medium size enterprises less frequently
involved in trade transactions or shipping low volumes of goods.
As mentioned earlier, two measures in this group particularly stand out as poorly implemented.
Authorized economic operator programmes have been initiated in less than 50% of the countries.
Similarly, a majority of countries have not initiated Establishment and publication of average release
times, with only 14 countries considered to have partially or fully implemented this measure. The fact
that a significant number of countries seem to have conducted time release studies on a pilot basis is
encouraging, however.
0% 10% 20% 30% 40% 50% 60% 70% 80% 90% 100%
Establishment and publication of average release times
Trade facilitation measures for authorized operators
Expedited shipments
Acceptance of paper or electronic copies of supporting documents
required for import, export or transit formalities
Separation of Release from final determination of customs duties,
taxes, fees and charges
Post-clearance audit
Pre-arrival processing
Risk management
Fully Implemented Partially Implemented Pilot Stage of Implementation Not Implemented Don't Know

17
3.3 “Institutional arrangement and cooperation” measures
Three trade facilitation measures featured in the survey are grouped under “Institutional and
cooperation” measures. These relate to the long-standing recommendation that a national trade
facilitation body and other measures be implemented to ensure coordination and cooperation among
the various government agencies and other stakeholders involved in facilitating trade.15 All three
measures are also specified in various Articles of the WTO TFA.
Figure 9: Implementation of “institutional arrangement and cooperation” measures: Asia-Pacific average
Source: ESCAP, UNRCs TF Survey 2015
Figure 9 shows that National Trade Facilitation Committee and Cooperation between agencies
on the ground at the national level have already been quite extensively implemented in the region and
most sub-regions. In contrast, implementation levels of mechanisms enabling Government agencies to
delegate controls to Customs authorities remain well under 50%. This is particularly the case in North
and Central Asia and South and South-West Asia where the implementation level of this measure is near
0%.
15
See, for example, UN/CEFACT Recommendation No. 4 on establishment of national trade facilitation bodies, first issued in 1974.
0%
50%
100%
National Trade Facilitation Committee
Cooperation between agencies on the
ground at the national level
Government agencies delegating
controls to Customs authorities
Asia-Pacific average South-East Asia average
East and North-East Asia average North and Central Asia average
South and South-West Asia average Pacific Island Developing Economies average

18
Figure 10: State of implementation of “institutional arrangement and cooperation” measures for trade facilitation in Asia-Pacific economies (in %)
Source: ESCAP, UNRCs TF Survey 2015
While Cooperation between agencies is being implemented by almost all countries (97%), the
results show that implementation has been essentially partial. In fact, only 7 countries have fully
implemented that measure, highlighting the fact that strengthening cooperation among agencies is an
on-going process. Arguably, the ultimate form of inter-agency collaboration is the delegation of
authority by one or more agencies to another, as suggested by the measure Government agencies
delegating controls to Customs authorities. Not surprisingly, this latter measure has only been
implemented in very few countries and over 70% of the countries (33 of 44) have yet to take any action
towards its implementation.
The most fully implemented measure of the three measures considered in this group is
Establishment of National Trade Facilitation Committee. Establishment of such a committee is
mandatory for all countries intent on ratifying the WTO TFA.16 Approximately 75% of the countries have
already established such a body, although it remains often unclear whether that body is fully operational
or has the authority and membership necessary to support effective trade facilitation reforms.
16
See Article 23.2 of the WTO TFA.
0% 10% 20% 30% 40% 50% 60% 70% 80% 90% 100%
Government agencies delegating controls to Customs authorities
National Trade Facilitation Committee
Cooperation between agencies on the ground at the national level
Fully Implemented Partially Implemented Pilot Stage of Implementation Not Implemented Don't Know

19
3.4 “Paperless trade” measures
Nine of the trade facilitation measures included in the survey are categorized as “paperless
trade” measures. All these measures involve the use and application of modern information and
communications technologies (ICT) to trade “formalities”, starting from the availability of internet
connections at border-crossings and customs automation to full-fledge electronic single window
facilities. Many of the measures featured here are closely related to those specified in the WTO TFA,
although the new WTO agreement typically only encourages economies to work towards
implementation of such measures, rather than make them a requirement.17
Figure 11: Implementation of “paperless trade” measures: Asia-Pacific average
Source: ESCAP, UNRCs TF Survey 2015
The regional and sub-regional average levels of implementation of the nine measures
considered under “paperless trade” vary widely, as shown in Figure 11. At the regional level, Internet
connection available to Customs and other trade control agencies at border-crossings, availability of
Electronic/automated Customs System, along with Electronic submission of Customs Declarations, are
17
An example of this is the WTO TFA Article 10.3 on Single Window, which reads as follows: “Members shall endeavour to establish or maintain a single window, enabling traders to submit documentation and/or data requirements for importation, exportation, or transit of goods through a single entry point to the participating authorities or agencies... Members shall, to the extent possible and practicable, use information technology to support the single window.”
0%
50%
100%
Electronic/automated Customs System
Internet connection available to Customs and
other trade control agencies at border-crossings
Electronic Single Window System
Electronic submission of Customs declarations
Electronic Application and Issuance of Trade
LicensesElectronic Submission of Air Cargo Manifests
Electronic Application and Issuance of
Preferential Certificate of Origin
E-Payment of Customs Duties and Fees
Electronic Application for Customs Refunds
Asia-Pacific average South-East Asia average
East and North-East Asia average North and Central Asia average
South and South-West Asia average Pacific Island Developing Economies average

20
among the most implemented measures of all trade facilitation measures included in the survey. In
contrast, regional implementation of almost all other measures, including Electronic application and
issuance of Preferential Certificates of Origin and Trade Licenses are well below the overall regional
implementation average. The implementation levels of “paperless trade” measures in South-East Asia
and East and North-East Asia exceed those in the other sub-regions, especially for Electronic Single
Window System, Electronic application and issuance of trade licenses and Electronic submission of air
cargo manifests (particularly in East and North-East Asia’s case).
Recognizing the importance of having the basic ICT infrastructure and services in place to enable
“paperless trade”, nearly all countries (96%) have fully, partially, or on a pilot basis, made available
Internet connection to trade control agencies at border-crossings (see Figure 12). Electronic/automated
Customs System are fully implemented in more than half of the countries of the region, and are in any
case available at the main Customs station(s) of 39 of 44 countries included in the survey. Similarly,
Electronic submission of Customs Declaration has been fully or partially implemented by 14 and 24
countries, respectively (or 86% of the countries surveyed). Electronic payment of Customs duties is also
at least partially available in a majority of the countries surveyed, with a significant number of countries
currently pilot testing e-payment systems.
Figure 12: State of implementation of “paperless trade” measures in Asia-Pacific economies (in %)
Source: ESCAP, UNRCs TF Survey 2015
Beyond the use of electronic data and documents for customs procedures, Electronic Single
Window System has been implemented fully, partially, or on a pilot basis by 17 countries, or nearly 40%
of all the Asia-Pacific countries surveyed. Clearly, benchmarked against the high implementation rate of
customs automation, Electronic Single Window System implementation remains at a relatively early
stage, with a majority of the countries not having taken any significant steps towards its implementation
yet.
0% 10% 20% 30% 40% 50% 60% 70% 80% 90% 100%
Electronic Application and Issuance of Preferential Certificate…
Electronic Application for Customs Refunds
Electronic Application and Issuance of Trade Licenses
Electronic Single Window System
Electronic Submission of Air Cargo Manifests
E-Payment of Customs Duties and Fees
Electronic submission of Customs declarations
Electronic/automated Customs System
Internet connection available to Customs and other trade control…
Fully implemented Partially implemented Pilot stage of implementation Not Implemented Don't know

21
Interestingly, relatively simpler measures such as Electronic application and Issuance of Trade
Licenses and Electronic application and Issuance of Preferential Certificate of Origin are even less
implemented than Single Window. This may be explained in part because such agency-specific system
may become redundant as single window systems are implemented. However, this also highlights the
fact that Customs in most countries are indeed much more advanced than other trade-related agencies
in developing and using electronic and automation system for trade facilitation and compliance.
3.5 “Cross-border paperless trade” measures
Six of the trade facilitation measures included in the survey are categorized as “cross-border
paperless trade” measures, as shown in Figure 13. Two of the measures, Laws and regulations for
electronic transactions and Recognized certification authority, are basic building blocks towards enabling
the exchange and legal recognition of trade-related data and documents not only among stakeholders
within a country, but ultimately also between stakeholders along the entire international supply chain.
The other four measures relate to the implementation of systems enabling the actual exchange of trade-
related data and documents across borders to remove the need for sending paper documents.
Figure 13: Implementation of “cross-border paperless trade” measures: Asia-Pacific average
Source: ESCAP, UNRCs TF Survey 2015
0%
50%
100%
Laws and regulations for electronic
transactions
Recognised certification authority
Engagement in trade-related cross-border
electronic data exchange
Electronic exchange of Certificate of Origin
Electronic exchange of Sanitary & Phyto-
Sanitary Certificate
Banks and insurers retrieving letters of
credit electronically without lodging paper-based documents
Asia-Pacific average South-East Asia averageEast and North-East Asia average North and Central Asia averageSouth and South-West Asia average Pacific Island Developing Economies average

22
Figure 13 shows the average regional scores for “cross-border paperless trade” measures, along
with the sub-regional ones. At the regional level, the implementation of these measures is very low,
with the exception of Laws and regulation for electronic transactions whose implementation level is
slightly over 50%. The pattern is very similar at the sub-regional level, apart from East and North-East
Asia whose implementation levels far exceed those of other sub-regions for most of the “cross-border
paperless trade” measures.
Figure 14 shows that about 68% of the countries surveyed in the Asia-Pacific have at least
partially developed the legal and regulatory frameworks needed to support electronic transactions, but
that these frameworks remain incomplete and may not readily support the legal recognition of
electronic data or documents received from stakeholders in other countries. This is also true for
Certification Authorities (CAs) needed to issue traders with recognized electronic signature certificates,
which have yet to be established, even on a pilot basis, by a large majority of countries in the region.
Figure 14: State of implementation of “cross-border paperless trade” measures in Asia-Pacific economies (in %)
Source: ESCAP, UNRCs TF Survey 2015
In part as a result of the lack of institutional and legal frameworks to support cross-border
paperless trade, Engagement in trade-related cross-border electronic data exchange has remained
limited, typically conducted on a limited basis with a few specific trade partners, and often only on a
pilot basis. Indeed, Electronic exchange of Certificates of Origin and Electronic exchange of Sanitary &
Phyto-Sanitary Certificates have been implemented on a limited basis by less than 10% of the economies
of the region. Similarly, in all but 3 Asia-Pacific countries included in the survey, it is not yet feasible for
banks and insurers to retrieve letters of credit electronically without lodging paper-based documents.
0% 10% 20% 30% 40% 50% 60% 70% 80% 90% 100%
Banks and insurers retrieving letters of credit electronically without
lodging paper-based documents
Electronic exchange of Sanitary & Phyto-Sanitary Certificate
Electronic exchange of Certificate of Origin
Engagement in trade-related cross-border electronic data exchange
Recognised certification authority
Laws and regulations for electronic transactions
Fully implemented Partially implemented Pilot stage of implementation Not Implemented Don't know

23
3.6 “Transit facilitation” measures
Three trade facilitation measures included in the survey relate specifically to transit facilitation
and WTO TFA Article 11 on Freedom of Transit.18 The intent of these measures is to reduce as much as
possible all the formalities associated with traffic in transit, allowing goods from one country destined to
another country to be seamlessly transported through one or more other transit countries. These
measures are particularly important to landlocked developing countries, whose goods typically need to
go through a neighboring country’s territory before reaching a sea port for onward transportation to
their final destination.
Figure 15: Implementation of “transit facilitation” measures: Asia-Pacific average
Source: ESCAP, UNRCs TF Survey 2015
As shown in Figure 14, the implementation level of “transit” measures in the region slightly
exceeds 50% across all measures. The same holds true in all sub-regions but North and Central Asia,
18
These measures are not directly applicable to all countries in the region, as some countries are unlikely to see any traffic in transit in their territory. This is particularly the case of “island” countries but also of other countries facing specific geographical constraints. Therefore, only 23 or 44 countries are included in the analysis of transit measures, as follows: Afghanistan, Armenia, Azerbaijan, Bangladesh, Brunei Darussalam, Cambodia, China, India, Indonesia, Kazakhstan, Kyrgyzstan, Lao PDR, Malaysia, Mongolia, Myanmar, Pakistan, Russian Federation, Singapore, Tajikistan, Thailand, Turkey, Uzbekistan and Viet Nam.
0%
50%
100%
Customs Authorities limit the physical
inspections of transit goods and use riskassessment
Supporting pre-arrival processing for
transit facilitation
Cooperation between agencies of
countries involved in transit
Asia-Pacific average South-East Asia average East and North-East Asia average
North and Central Asia average South and South-West Asia average

24
where the implementation level is just under 50%. In South-East Asia and East and North-East Asia,
these levels are higher and oscillate around 70%.
Unfortunately, as shown in Figure 15, much remains to be done to achieve full regional
implementation, despite the fact that most of the countries involved in transit have already concluded
specific transit agreements with each other at the bilateral or regional level.
Figure 16: State of implementation of “transit facilitation” measures in Asia-Pacific economies (in %)
Source: ESCAP, UNRCs TF Survey 2015
The relatively low average implementation scores for transit facilitation can be explained by the
patterns in Figure 17. Indeed, while all three transit facilitation measures have been implemented by
more than 70% of the countries involved, implementation has mainly been partial. Indeed, Cooperation
between agencies of countries involved in transit is considered fully implemented in only 15% of the
countries involved. Similarly, Limited physical inspection of goods in transit and pre-arrival processing of
documents for goods in transit are fully in place in less than 25% of the countries.
0% 10% 20% 30% 40% 50% 60% 70% 80% 90% 100%
Supporting pre-arrival processing for transit facilitation
Customs Authorities limit the physical inspections of transit goods
and use risk assessment
Cooperation between agencies of countries involved in transit
Fully implemented Partially implemented Pilot stage of implementation Not Implemented Don't know

25
4. Notable achievements and common challenges in the implementation
As part of the data collection process, experts were asked to identify the trade facilitation
measures on which their country has made the most progress over the past 12 months. Responses
received from experts from 27 countries in Asia-Pacific are summarized in Figure 17.
Figure 17: Trade facilitation measures on which most progress was made in Asia-Pacific economies since 2013/14
Source: ESCAP, UNRCs TF Survey 2015
While the data remains anecdotal in nature, it suggests that many countries across the Asia-
Pacific region put the most emphasis over the past year on improving their Automated customs systems
and related Risk management systems. Many also worked on implementing Single Window and other
paperless trade measures, as well as in adopting new legislation and regulations for trade facilitation
(e.g., adoption of new or amended Customs laws). Finally, implementation of Post-clearance audit, a
measure very much complementary to that of risk management, and establishment of National Trade
0 2 4 6 8 10 12 14
Appeal procedures
Rules of origin
Publication of information
Pre-arrival processing
Stakeholder consultation on new draft regulation
Advance rulings
Border agency cooperation
Clearance procedures
Cross-border paperless trade
Trade facilitation measures for AEOs
National Trade Facilitation Committee
Post-clearance audit
Legislation and regulations on trade facilitation
Single Window and other paperless trade measures
Risk management
Automated Customs System
Number of countries where implementation of a measure has progressed most

26
Facilitation Committees, a measure required in the WTO TFA finalized in December 2013, also received
particular attention over the past 12 months across the Asia-Pacific region.
Experts involved in the survey were also requested to identify the three key challenges faced by
their countries in the implementation of trade facilitation measures. Responses were received from 30
countries. Lack of coordination between government agencies and Limited human resource capacity
were put forward as the most serious challenges faced for the implementation of trade facilitation
measures in 21 of 30 countries. Lack of political will, No clearly designated lead agency and Financial
constraints were also each mentioned in at least 16 countries.
Figure 18: Challenges faced by Asia-Pacific LDCs, LLDCs, SIDSs and other developing countries in implementing trade facilitation measures
Note: Data shown refers to the number of countries in each group where a particular challenge was identified. Source: ESCAP, UNRCs TF Survey 2015
Interestingly, the importance of the 5 most common challenges associated with trade
facilitation varies significantly across groups of countries. As shown in Figure 18, while all five challenges
seem to be equally important in LDCs, Limited human resource capacity seems to be relatively more
important than other challenges in SIDSs. In LLDCs, Lack of coordination between Government agencies
seems to be relatively less important than other challenges such as Financial constraints or Lack of
political will to facilitate trade. In contrast, in other developing countries, Lack of coordination between
government agencies seems to be the main challenge for making further progress on implementation of
trade facilitation.
0
3
6
9Financial constraints
No clearly designated lead agency
Lack of political willLimited human resource capacity
Lack of coordination between government
agencies
LDCs LLDCs SIDSs Developing countries

27
5. Conclusions and Way Forward
This report presented data on trade facilitation and paperless trade implementation collected
from 44 economies across the Asia-Pacific region and covering 5 different sub-regions. The survey
covered not only implementation of general trade facilitation measures, including most of those
featured in the WTO TFA, but also more advanced ICT-based trade facilitation measures aimed at
making data and documents needed to support trade transactions flow seamlessly among stakeholders
within a country, as well as across countries. Figure 19 confirms the strong relationship between Asia-
Pacific countries international trade costs and their level of trade facilitation implementation as revealed
by the survey.19
Figure 19: Trade facilitation implementation and Trade Costs of Asia-Pacific economies
Notes: Countries’ trade costs are based on average comprehensive bilateral trade costs with Germany, China and
the USA (2008-13) and expressed as ad valorem equivalents (%).
Source: ESCAP-World Bank International Trade Cost Database and ESCAP, UNRCs TF Survey 2015
Based on an ambitious package of more than 30 trade facilitation measures included in the
survey, regional average trade facilitation implementation is found to be nearing 50%, suggesting that
significant room remains for progress in many Asia-Pacific economies.20 The assessment confirms that a
19
A simple linear regression of trade costs against trade facilitation implementation – estimated using Ordinary Least Squares (OLS) - shows that trade facilitation implementation levels explain about 45% of the variations in trade costs; and that a 5% increase in the level of trade facilitation implementation is associated with a decrease in trade costs of 11.6%. 20
At the same time, it is worth noting that full implementation of only the trade facilitation measures specified in the WTO TFA, arguably now the baseline set of trade facilitation measures to be implemented, would bring a country to an implementation level of 55 to 60% within the context of this survey. This suggests that, on average,
0%
50%
100%
150%
200%
250%
300%
350%
400%
0% 10% 20% 30% 40% 50% 60% 70% 80% 90% 100%
Trad
e co
sts
(exc
lud
ing
tar
iff)
Trade facilitation implementation (%)

28
large majority of countries in the region has been actively engaged in implementing measures to
improve transparency, enhance inter-agency coordination and cooperation, and streamline fees and
formalities associated with trade. While Customs in essentially all countries have been actively
developing paperless systems to speed up customs clearance while also improving control, nearly 40%
of the economies are now also engaged in implementation of more advanced national multi-agency
paperless systems, such as national electronic single windows.
However, implementation of cross-border (bilateral, sub-regional or regional) paperless trade
systems remains mostly at the pilot stage. This is certainly not surprising given that, on one hand, many
less advanced countries in the region are at an early stage of development of national paperless systems
and that, on the other hand, more advanced countries have paperless systems in place that are not fully
interoperable with each other. In that regard, given the large potential benefits associated with the
implementation of these “next generation” trade facilitation measures,21 it is in the interest of countries
from all groups to work together and develop the legal and technical protocols needed for the seamless
exchange of regulatory and commercial data and documents along the international supply chain. Some
work has already been done bilaterally as well as in several Asian sub-regions (e.g., in ASEAN as part of
implementation of the ASEAN Single Window). This work can be further leveraged at the regional level
through adoption and implementation of the intergovernmental agreement for the facilitation of cross-
border paperless trade currently under negotiation at ESCAP.22
Remarkably, the only trade facilitation performance “monitoring” measure included in the
survey (Establishment and publication of average release times), remains one of the least implemented
measure across the region. This is worth highlighting, as what ultimately matters is not how many
measures one implements, but how effective they have been in reducing the time and cost of trade
transactions. Indeed, it is important to realize that trade facilitation and paperless trade measures are
very much inter-related and that the effect of a particular measure on trade transaction costs depends
on whether, and how well, other measures have been implemented.
In that regard, Figure 20 shows implementation of trade facilitation as a step-by step process,
based on the groups of measures included in this survey. Trade facilitation begins with the setting up of
the Institutional arrangement needed to prioritize and coordinate implementation of trade facilitation
measures. The next step is to make the trade processes more Transparent by sharing information on
existing laws, regulations and procedures as widely as possible and consulting with stakeholders when
developing new ones. Designing and implementing simpler and more efficient trade Formalities is next.
The re-engineered and streamlined processes may first be implemented based on paper documents, but
can then be further improved through ICT and the development of Paperless trade systems. The
the region is well on its way to fully implementing the WTO TFA. It further suggests that, based on the relationship identified in Figure 19 and average regional trade costs of about 150% across Asia-Pacific Developing Countries, fully implementing the WTO TFA in Asia-Pacific could reduce trade costs by 16 to 17%. 21
See ESCAP (2014) at http://www.unescap.org/resources/estimating-benefits-cross-border-paperless-trade 22
Full implementation of cross-border paperless trade is expected to generate USD 257 billion of additional export potential annually for the Asia-Pacific region alone. See http://www.unescap.org/resources/estimating-benefits-cross-border-paperless-trade.

29
ultimate step is to enable the electronic trade data and documents exchange by traders, government
and service providers within national (single window and other) systems to be used and re-used to
provide stakeholders in partner countries with the information they need to speed up the movement of
goods and reduce the overall costs of trade.23
Figure 20: Moving up the trade facilitation ladder towards seamless international supply chains
Note: the figure shows cumulative trade facilitation implementation scores of Asia-Pacific sub-regions for five groups of trade facilitation measures included in the survey. Full implementation of all measures = 100. Source: ESCAP, UNRCs TF Survey 2015
The regional and sub-regional cumulative trade facilitation implementation levels shown in
Figure 20 show that, while East and Southeast Asia are performing well above the Asia-Pacific average
and cross-border paperless trade facilitation is the least implemented of all groups of measures, all sub-
regions still have significant room to make progress in all areas of trade facilitation, starting with
institutional arrangements and further enhancing inter-agency cooperation.
--------------------
23
This step-by-step process is inspired from and generally consistent with the UN/CEFACT step-by-step approach to trade facilitation towards a single window environment.
0
20
40
60
80
100
Performance area
Frontier (full
implementation)
East and North-East
Asia
South-East Asia
Asia-Pacific
North and Central Asia
South and South-West
Asia
Pacific Island
Developing EconomiesInstitutional
arrangement
and cooperation
Transparency
Formalities
Paperless trade
Cross-border
paperless
trade
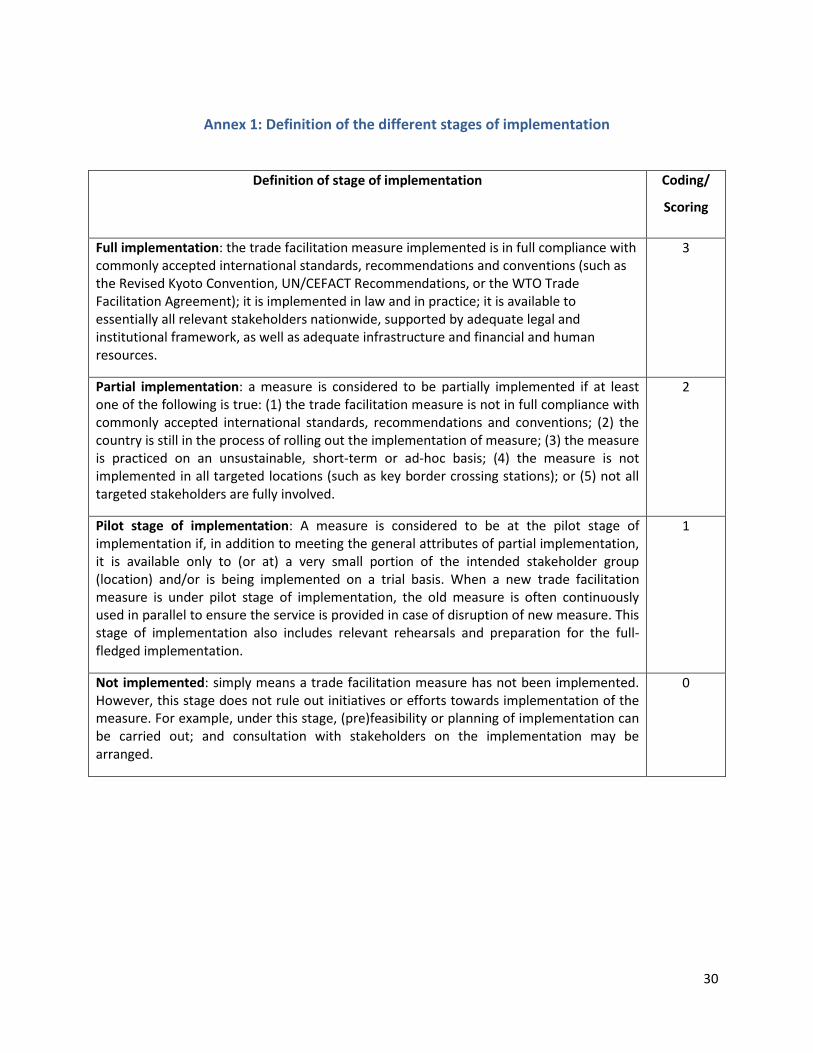
30
Annex 1: Definition of the different stages of implementation
Definition of stage of implementation Coding/
Scoring
Full implementation: the trade facilitation measure implemented is in full compliance with commonly accepted international standards, recommendations and conventions (such as the Revised Kyoto Convention, UN/CEFACT Recommendations, or the WTO Trade Facilitation Agreement); it is implemented in law and in practice; it is available to essentially all relevant stakeholders nationwide, supported by adequate legal and institutional framework, as well as adequate infrastructure and financial and human resources.
3
Partial implementation: a measure is considered to be partially implemented if at least one of the following is true: (1) the trade facilitation measure is not in full compliance with commonly accepted international standards, recommendations and conventions; (2) the country is still in the process of rolling out the implementation of measure; (3) the measure is practiced on an unsustainable, short-term or ad-hoc basis; (4) the measure is not implemented in all targeted locations (such as key border crossing stations); or (5) not all targeted stakeholders are fully involved.
2
Pilot stage of implementation: A measure is considered to be at the pilot stage of implementation if, in addition to meeting the general attributes of partial implementation, it is available only to (or at) a very small portion of the intended stakeholder group (location) and/or is being implemented on a trial basis. When a new trade facilitation measure is under pilot stage of implementation, the old measure is often continuously used in parallel to ensure the service is provided in case of disruption of new measure. This stage of implementation also includes relevant rehearsals and preparation for the full-fledged implementation.
1
Not implemented: simply means a trade facilitation measure has not been implemented. However, this stage does not rule out initiatives or efforts towards implementation of the measure. For example, under this stage, (pre)feasibility or planning of implementation can be carried out; and consultation with stakeholders on the implementation may be arranged.
0

31
Annex 2: Grouping of the countries surveyed24
The survey covers 44 Asia-Pacific countries, which can be divided into the following six sub-
regions:
East and North East-Asia (ENEA): China, Japan, Mongolia and Republic of Korea;
North and Central Asia (NCA): Armenia, Azerbaijan, Kazakhstan, Kyrgyzstan, Russian
Federation, Tajikistan and Uzbekistan;
Pacific Island Developing Economies (PIDEs): Fiji, Kiribati, Micronesia, Nauru, Palau,
Papua New Guinea, Samoa, Solomon Islands, Tonga, Tuvalu and Vanuatu;
South and South-West Asia (SSWA): Afghanistan, Bangladesh, Bhutan, India, Maldives,
Nepal, Pakistan, Sri Lanka and Turkey;
Pacific developed countries(AU&NZ): Australia and New Zealand;
South-East Asia (SEA): Brunei Darussalam, Cambodia, Indonesia, Lao PDR, Malaysia,
Myanmar, Philippines, Singapore, Thailand, Timor-Leste and Viet Nam.
Analysis is also extended to the following group of countries with special needs25:
Least Developed Countries (LDCs): Afghanistan, Bangladesh, Bhutan, Cambodia, Kiribati,
Lao PDR, Myanmar, Nepal, Solomon Islands, Timor-Leste, Tuvalu and Vanuatu;
Landlocked Developing Countries (LLDCs): Afghanistan, Armenia, Azerbaijan, Bhutan,
Kazakhstan, Kyrgyzstan, Lao PDR, Mongolia, Nepal, Tajikistan and Uzbekistan;
Small Island Developing States (SIDSs): Fiji, Kiribati, Maldives, Micronesia, Nauru, Palau,
Papua New Guinea, Samoa, Solomon Islands, Timor-Leste, Tonga, Tuvalu and Vanuatu.26
24
This grouping is largely in line with the Economic and Social Survey of Asia and the Pacific 2015. 25
More details are available at http://unohrlls.org/UserFiles/1_countries_with_special_needs.pdf. 26
It is important to note that Afghanistan, Bhutan and Lao PDR are both LDCs and LLDCs, while Kiribati, Solomon Islands, Timor-Leste, Tuvalu and Vanuatu are both LDCs and SIDSs.

United Nations
Economic and Social Commission for Asia and the Pacific
Trade and Investment Division
United Nations Building, Rajadamnern Nok Avenue
Bangkok 10200, Thailand
Email: [email protected]
Website: www.unescap.org