Embed Size (px)
Citation preview

JOINTRESEARCHCENTRE
EUROPEAN COMMISSION
Greenhouse Gas Emissions from Agriculture in the Monitoring Mechanism Framework
Adrian Leip, Joint Research Centre
Inventory and Projections Experts Workshop under Working Group I and Working Group II of the
EU GHG Monitoring Mechanism Committee
27th – 28th February, 2003
EEA, Copenhagen

JOINTRESEARCHCENTRE
EUROPEAN COMMISSION
Outline
Open questions - two examples
Goals of this workshop
Data Quality
Agriculture in EU-15

JOINTRESEARCHCENTRE
EUROPEAN COMMISSION
Data Quality Assessment and Control – Criteria
Timeliness
Completeness
Consistency
Transparency
Comparability
Accuracy
Precision
CO
MP
LE
XIT
Y
FE
AS
IBIL
ITY
HIE
RA
CH
ICA
L L
EV
EL
Verification

JOINTRESEARCHCENTRE
EUROPEAN COMMISSIONConsistency
Timeliness
Com
plet
enes
s
Transparency
Compa
rabi
lity
Verification
Precision
Acc
urac
y
Inventory System – Data Quality Aspects
MSETC/ACC-
EEA
JRC
EUROSTAT
IPC
C / R
esearch / MS

JOINTRESEARCHCENTRE
EUROPEAN COMMISSION
Data Quality – Role of this workshop
transparency / comparability:
learn about the methods used in the national inventories
evaluate comparability of the methods used
point on inconsistencies and unexplainable differences
accuracy / precision
discuss advantages and disadvantages of different methodologies
for national and EU inventories
to be able to account for mitigation measures

JOINTRESEARCHCENTRE
EUROPEAN COMMISSION
6 7
219
4. Agriculture
5. LUCF
6. Waste
N2O
108168
3
4. Agriculture
5. LUCF
6. Waste
CH4
Anthropogenic biogenic GHG emissions in Europe(2002 submissions)
Agricultural soils: 87%
Enteric
Fermentation:
78%
Total GHG emissions (2000): 4000 Tg CO2-eq.
Share of agriculture on total emissions: 10%
Share of biogenic emissions: 520 Tg CO2-eq. (13%)69% of N2O are biogenic
82% of CH4 are biogenic

JOINTRESEARCHCENTRE
EUROPEAN COMMISSION
CH4 sectoral CH4 emissions4. Agriculture A. Enteric Fermentation 1133436. Waste A. Solid Waste Disposal on Land 558294. Agriculture B. Manure Management 377481B. Energy - Fugitive Emissions from Fuels2. Oil and Natural Gas 228071B. Energy - Fugitive Emissions from Fuels1. Solid Fuels 138571Energy - A. Fuel Combustion (Sectoral Approach) 114916. Waste B. Wastewater Handling 47425. Land-Use Change and Forestry(1) 21136. Waste D. Other 13966. Waste C. Waste Incineration 4834. Agriculture C. Rice Cultivation 4744. Agriculture D. Agricultural Soils(2) 147
EU
-15
AU
BE
DK
FI
FR
DE
GR
IE IT LU
NE
PT
ES
SE
UK
38% 42% 41% 49% 54% 45% 52% 76% 67% 40% 36% 49% 34%29% 35% 25% 21% 29% 22% 19% 12% 10% 33% 26% 34% 28%10% 10% 17% 16% 10% 16% 15% 11% 9% 14% 21% 10% 17%
8% 5% 8% 12% 4% 6% 11% 1% 8% 9% 6% 7% 10%
6% 3% 3% 1% 2% 3% 3% 1% 5% 4% 3% 0% 4%
4% 3% 3% 1% 0% 3% 0% 0% 1% 0% 3% 0% 4%
2% 1% 1% 0% 0% 3% 0% 0% 1% 0% 2% 0% 2%

JOINTRESEARCHCENTRE
EUROPEAN COMMISSION
N2O sectoral emissions4. Agriculture D. Agricultural Soils(2) 1660711A. Energy - A. Fuel Combustion (Sectoral Approach) 436302. Industrial Processes 392104. Agriculture B. Manure Management 153665. Land-Use Change and Forestry(1) 56376. Waste B. Wastewater Handling 38693. Solvent and Other Product Use 33957. Other (please specify) 11846. Waste C. Waste Incineration 3194. Agriculture - F. Field Burning of Agricultural Residues 3111B. Energy - Fugitive Emissions from Fuels 52
EU
-15
AU
BE
DK
FI
FR
DE
GR
IE IT LU
NE
PT
ES
SE
UK
60% 48% 41% 86% 47% 64% 57% 72% 95% 43% 59% 58% 61%16% 23% 35% 9% 27% 14% 17% 16% 4% 41% 22% 26% 20%14% 13% 20% 5% 18% 9% 11% 7% 1% 7% 7% 7% 13%
6% 12% 2% 0% 5% 7% 11% 6% 0% 5% 5% 6% 3%2% 4% 1% 0% 2% 4% 3% 0% 0% 1% 4% 2% 3%1% 0% 1% 0% 1% 1% 0% 0% 0% 1% 1% 1% 0%1% 0% 0% 0% 0% 1% 0% 0% 0% 1% 1% 0% 0%

JOINTRESEARCHCENTRE
EUROPEAN COMMISSION
CH4
Fluxes in agricultural systems
ANIMAL
HOUSING/STORAGE
GRAZING
CH4NH3
N2OCH4
NH3NO
N2O
WATER
N2OCH4
FERT.
SOIL
N2OCH4
SOIL
flow of organic C and N
emission of C and N gases
deposition of N gases
flow of mineral N
agricultural system
OTHER

JOINTRESEARCHCENTRE
EUROPEAN COMMISSION
Enteric fermentation – background information
subcategories - where to put in CRF?
country-specific emission factors ?
Dairy Non-dairy
AT 101 52.6
BE
DK 104 37
FI 114 42.1
FR 103 51.6
DE 100 48
GR 81 56
IE 100 50
IT 113 50
LU
NL 81 45
PT 100 48
ES 106 59.4
SE 127 56.5
GB 117 42.9

JOINTRESEARCHCENTRE
EUROPEAN COMMISSION
Submission 2002 for 1997 (EC-IR):
6435 Gg CH4135135 Gg CO2-eq
in 2000, 83% of emissions were “cattle”:
5341 Gg CH4112162 Gg CO2-eq
IPCC sub-category EuroFarm classCalves on milk Bovine animals under 1 year oldCalves on forage Bovine animals 1-2 years oldMature males Bovine animals 2 year old and over, maleDairy cattle Dairy cowsReplacement/growing Bovine animals 2 year old and over, heifers and other cows
CH4 emissions from enteric fermentation [Gg CO2-eq]
NUTS 3 level
EuroFarm disaggregation using Corine Landcover classes “grassland” and “pasture”
EUROSTAT (EuroFarm) Livestock Data:
a) EFs from 2003 submissions:113021 Gg CO2-eq
b) IPCC Tier 1 (Dairy/non-dairycattle):
109750 Gg CO2-eq
c) IPCC Tier 1 excluding calves < 1 year:84929 Gg CO2-eq
d) IPCC Tier 2:93132 Gg CO2-eq
JOINTRESEARCHCENTRE
EUROPEAN COMMISSION
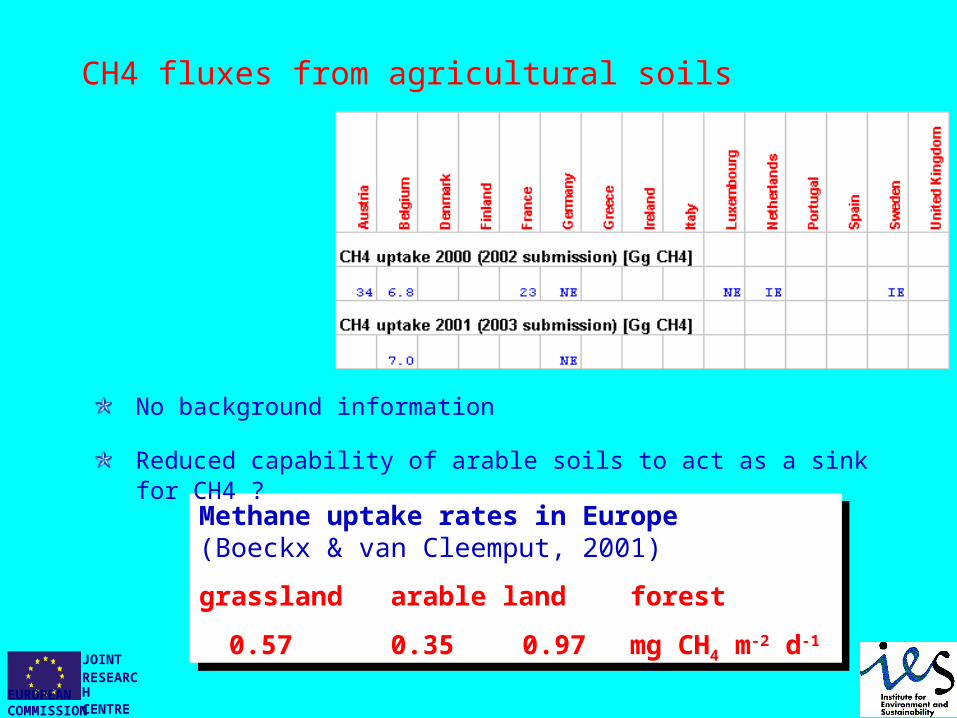
Methane uptake rates in Europe(Boeckx & van Cleemput, 2001)
grassland arable land forest
0.57 0.35 0.97 mg CH4 m-2 d-1
CH4 fluxes from agricultural soils
No background information
Reduced capability of arable soils to act as a sink for CH4 ?

JOINTRESEARCHCENTRE
EUROPEAN COMMISSION
Direct N2O emissions from agricultural soils
variations cannot be explained by input of nitrogen only:
land use history
application technique
organic carbon, ....
variability in caused by the local weather
EF of 1.25% too high?

JOINTRESEARCHCENTRE
EUROPEAN COMMISSION
N2O emissions from agricultural soils – “background emissions”
two MS have included an emission of N2O from agricultural soils due to cultivation of mineral soils of 0.5 kg N2O-N ha-1 year-1
factoring-out of anthropogenic induced background emissions ?
additional information required to determine level (land-use history) ?
modelling !!
16%
23%
30%
30%
1%
Synthetic fertitizer
Animal waste application
N-fixing crops
Crop residue
Background29%
46%
1%24%NL
SE

JOINTRESEARCHCENTRE
EUROPEAN COMMISSION
Conclusions
there are manyquestions ..