Embed Size (px)
Citation preview

Thematic Report 2013
Joint Nutrition Assessment
Syrian Refugees in LEBANON

2
2013 JOINT Nutrition Assessment
Syrian Refugees in LEBANON
ASSESSMENT CONDUCTED: October and November 2013
FINAL Report
FEBRUARY 2014

3
Nutrition Assessment Report for Syrian Refugees in
Lebanon
Undertaken through the SMART methodology in
conformity with the UNHCR SENS guidelines

4
Acknowledgements
UNICEF Lebanon, in collaboration with UNHCR, WHO, WFP and with support of IOCC Lebanon, has
commissioned and coordinated the assessment. The technical support for the assessment was
provided by the Nutrition Consultant Oumar Hamza, the Lebanon Task Force/ committee members,
UNICEF Regional Office Advisor and UNHCR HQ Nutrition officers. The anthropometric analysis was
reviewed and re-run jointly by UNICEF Regional Office and a team from Centre for Disease Control
(CDC)
We gratefully acknowledge the important contributions made by so many people that made this
assessment possible, particularly all agencies involved in planning and executing of the assessment.
Specific thanks to UNICEF, UNHCR, WHO, WFP, MOPH and IOCC Lebanon teams for their
collaboration in the entire duration of the exercise. Thanks to all the participants who engaged in data
collection and data entry. A special thank-you to the assessment teams including drivers and IOCC
administrative support team.
Most importantly, thanks to the women, men and children from different Syrian refugee families who
agreed to be interviewed, measured and weighed during this assessment.

5
Contributors
Assessment design and execution Oumar Hamza, SMART expert, Nutrition specialist and UNICEF Lebanon Consultant
In collaboration with James Kingori, Nutrition Specialist, UNICEF Regional Office
Ellen Andresen, Nutrition Officer, UNHCR Geneva
Caroline Wilkinson, Senior Nutrition Officer, UNHCR Geneva
Azzeddine Zeroual, Health, Nutrition and Emergency Specialist, UNICEF Lebanon
Task Force members
Coordination Oumar Hamza, SMART expert, Nutrition specialist, UNICEF Lebanon Consultant and Coordinator of the assessment
In collaboration with Task Force members
Supervision Oumar Hamza, SMART expert, Nutrition specialist, UNICEF Lebanon Consultant and Coordinator of the assessment
Aye Aye Than, Health Officer, UNHCR Lebanon
Sabeen Abdulsater, Nutritionist, IOCC
Marya Al Nawakil, Nutritionist, IOCC
Dima Ousta, Nutritionist, IOCC
Nanor Karaguezian, Nutritionist, IOCC
Analysis Oumar Hamza, SMART expert, Nutrition specialist, UNICEF Lebanon Consultant and Coordinator of the assessment
Ellen Andresen, Nutrition Officer, UNHCR Geneva
Revised analysis was done by UNICEF Regional Office and CDC
Report writing Oumar Hamza, SMART expert, Nutrition specialist, UNICEF Lebanon Consultant and Coordinator of the assessment

6
Contents
LIST OF TABLES ................................................................................................................................................... 7
ACRONYMS AND ABBREVIATIONS .................................................................................................................... 11
I. BACKGROUND AND RATIONALE ............................................................................................................... 28
II. JUSTIFICATION OF THE ASSESSMENT ....................................................................................................... 29
III. TASK FORCE COMMITTEE ......................................................................................................................... 30
IV. SCOPE OF THE ASSESSMENT .................................................................................................................... 31
V. DEMOGRAPHY ......................................................................................................................................... 32
VI. OBJECTIVES .............................................................................................................................................. 33
VII. METHODOLOGY ....................................................................................................................................... 34
7. TRAINING AND COORDINATION ............................................................................................................................... 49 8. PILOT TESTING AND REVISION OF THE ASSESSMENT TOOLS ............................................................................................ 50 9. DATA COLLECTION ................................................................................................................................................ 50 10. FIELD WORK AND QUALITY CONTROL ........................................................................................................................ 51 11. DATA ANALYSIS ................................................................................................................................................... 52 1. RESPONSE RATE ................................................................................................................................................... 53 2. DEMOGRAPHY ..................................................................................................................................................... 53 3. SOURCES OF INCOME ............................................................................................................................................ 57 4. HEALTH ASSISTANCE ............................................................................................................................................. 58 5. CHILDREN 6-59 MONTHS ...................................................................................................................................... 59 A. Anthropometric results (based on who growth standards 2006) ..................................................... 59 B. Anaemia results for children 6-59 months ....................................................................................... 70 C. Child morbidity 74 D. Children vaccination coverage ........................................................................................................ 75 E. Infant and young child feeding ........................................................................................................ 77 6. WOMEN 15-49 YEARS ......................................................................................................................................... 81 A. Physiological status ......................................................................................................................... 81 B. Women malnutrition ......................................................................................................................... 85 C. ANC enrolment and iron-folic acid supplementation coverage ....................................................... 88 D. Anaemia results for women 15-49 years ......................................................................................... 89
IX. RESULTS - HOUSEHOLD LEVEL – WASH ..................................................................................................... 90
1. WASH .............................................................................................................................................................. 90
LIMITATIONS .................................................................................................................................................... 96
DISCUSSION ...................................................................................................................................................... 97
CONCLUSION .................................................................................................................................................. 104
RECOMMENDATIONS AND PRIORITIES ........................................................................................................... 105
ANNEX ............................................................................................................................................................ 107
LIST OF TABLES ................................................................................................................................................... 7

7
ACRONYMS AND ABBREVIATIONS .................................................................................................................... 11
I. BACKGROUND AND RATIONALE ............................................................................................................... 28
II. JUSTIFICATION OF THE ASSESSMENT ....................................................................................................... 29
III. TASK FORCE COMMITTEE ......................................................................................................................... 30
IV. SCOPE OF THE ASSESSMENT .................................................................................................................... 31
V. DEMOGRAPHY ......................................................................................................................................... 32
VI. OBJECTIVES .............................................................................................................................................. 33
VII. METHODOLOGY ....................................................................................................................................... 34
7. TRAINING AND COORDINATION ............................................................................................................................... 49 8. PILOT TESTING AND REVISION OF THE ASSESSMENT TOOLS ............................................................................................ 50 9. DATA COLLECTION ................................................................................................................................................ 50 10. FIELD WORK AND QUALITY CONTROL ........................................................................................................................ 51 11. DATA ANALYSIS ................................................................................................................................................... 52 1. RESPONSE RATE ................................................................................................................................................... 53 2. DEMOGRAPHY ..................................................................................................................................................... 53 3. SOURCES OF INCOME ............................................................................................................................................ 57 4. HEALTH ASSISTANCE ............................................................................................................................................. 58 5. CHILDREN 6-59 MONTHS ...................................................................................................................................... 59 A. Anthropometric results (based on who growth standards 2006) ..................................................... 59 B. Anaemia results for children 6-59 months ....................................................................................... 70 C. Child morbidity 74 D. Children vaccination coverage ........................................................................................................ 75 E. Infant and young child feeding ........................................................................................................ 77 6. WOMEN 15-49 YEARS ......................................................................................................................................... 81 A. Physiological status ......................................................................................................................... 81 B. Women malnutrition ......................................................................................................................... 85 C. ANC enrolment and iron-folic acid supplementation coverage ....................................................... 88 D. Anaemia results for women 15-49 years ......................................................................................... 89
IX. RESULTS - HOUSEHOLD LEVEL – WASH ..................................................................................................... 90
1. WASH .............................................................................................................................................................. 90
LIMITATIONS .................................................................................................................................................... 96
DISCUSSION ...................................................................................................................................................... 97
CONCLUSION .................................................................................................................................................. 104
RECOMMENDATIONS AND PRIORITIES ........................................................................................................... 105
ANNEX ............................................................................................................................................................ 107
List of tables
Table 1: Nutrition status for Syria, Jordan, Lebanon and MENA Region Average, UNICEF SOWC, 2012 and
FHS 2009 29 Table 2: Distribution of Syrian refugees in the 4 strata 32 Table 3: Distribution of Syrian refugees in the 4 strata 32 Table 4.1-1: Parameters needed for sample size determination 36

8
Table 4.1-2: Household sample size and sampling-cluster 37 Table 5: Definitions of acute malnutrition using weight-for-height and/or oedema in children 6–59 months 42 Table 6: Definitions of stunting using height-for-age in children 6–59 months 42 Table 7: Definitions of underweight using weight-for-age in children 6–59 months 42 Table 7: Classification of acute malnutrition based on MUAC in children 6-59 months (WHO, 2000) 43 Table 8: Classification of public health significance of Anaemia prevalence (WHO, 2001) 44 Table 9: Definition of anaemia (WHO, 2001) 44 Table 10: Classification of under nutrition based on MUAC in women of reproductive age (15 to 49 years) 48 Table 11: Classification of public health significance for children under 5 years of age (WHO, 2000) 49 Table 12: Target sample size and number covered during the survey 53 Table 13: Proportion of HH headed by a woman, HH size and average number of children U5 54 Table 14: Situation of Children under 18 years old 54 Table 15: Proportion of HH sharing ccommodation with other Syrian refugees HH 57 Table 16-1: Distribution of age and sex of the all Syrian refugees in Lebanon (Global sample) 59 Table 16-2: Distribution of age and sex of the all Syrian refugees in Bekaa Region 60 Table 16-3: Distribution of age and sex of the all Syrian refugees in North of Lebanon 60 Table 16-4: Distribution of age and sex of the all Syrian refugees in South of Lebanon 60 Table 16-5: Distribution of age and sex of the all Syrian refugees in Beirut & Mount-Lebanon 60 Table 17-1: Prevalence of acute malnutrition for all Syrian refugees in Lebanon based on weight-for-height z-
scores (and/or oedema) and by sex 62 Table 17-1-1: Prevalence of acute malnutrition for all Syrian refugees in Lebanon based on MUAC cut off's
(and/or oedema) and by sex 62 Below is a summary of the four independent assessment results from the four strata conducted in Lebanon. 63 Table 17-2: Prevalence of acute malnutrition among Syrian refugees in Bekaa Valley based on weight-for-height
z-scores (and/or oedema) and by sex 63 Table 18-3: Prevalence of acute malnutrition in Northern Lebanon by age, based on weight-for-height z-scores
and/or oedema 64 Table 18-5: Prevalence of acute malnutrition in Beirut/Mount Lebanon by age, based on weight-for-height z-
scores and/or oedema 65 The number of oedema were found in only 2 strata, i.e. Bekaa and North Lebanon and though few they had to be
investigated as they were the only severely malnourished cases identified. Below is a distribution of the oedema
cases detected. 65 Table 19-1: Distribution of acute malnutrition and oedema based on weight-for-height z-scores 65 Table 19-2: Distribution of acute malnutrition and oedema based on weight-for-height z-scores 66 Table 21-1: Prevalence of underweight based on weight-for-age z-scores and by sex among all Syrian refugees in
Lebanon 68 Table 21-3: Prevalence of underweight based on weight-for-age z-scores and by sex among Syrian refugees in the
North of Lebanon 68 Table 21-4: Prevalence of underweight based on weight-for-age z-scores and by sex among Syrian refugees in the
South of Lebanon 68 Table 21-5: Prevalence of underweight based on weight-for-age z-scores and by sex among Syrian refugees in
Beirut and Mount-Lebanon 69 Table 22-1: Mean z-scores, design effects and excluded subjects – all Syrian refugees in Lebanon 69 * contains for WHZ and WAZ the children with edema 69 Table 22-2: Mean z-scores, design effects and excluded subjects – Syrian refugees in Bekaa 69 Table 22-3: Mean z-scores, design effects and excluded subjects – Syrian refugees in the North of Lebanon 69 Table 22-4: Mean z-scores, design effects and excluded subjects – Syrian refugees in the South of Lebanon 70 * contains for WHZ and WAZ the children with edema. 70 Table 22-5: Mean z-scores, design effects and excluded subjects – Syrian refugees in Beirut and Mount Lebanon
70
9
Table 23-1: Prevalence of total anaemia, Anaemia categories, and mean haemoglobin concentration in children 6-
59 months of age and by age group - All Syrian refugees in Lebanon 71 Table 23-1-1 Prevalence of Moderate and Severe anaemia in children 6-59 months of age and by age group,
Syrian refugees in Lebanon 71 Table 23-2: Prevalence of total anaemia, Anaemia categories, and mean haemoglobin concentration in children 6-
59 months of age and by age group – Syrian refugees in Bekaa 72 Table 23-2-1: Prevalence of Moderate and Severe anaemia in children 6-59 months of age and by age group,
Syrian refugees in Bekaa 72 Table 23-3: Prevalence of total anaemia, Anaemia categories, and mean haemoglobin concentration in children 6-
59 months of age and by age group – Syrian refugees in the North of Lebanon 72 Table 23-3-1 Prevalence of Moderate and Severe anaemia in children 6-59 months of age and by age group,
Syrian refugees in North of Lebanon 73 Table 23-4: Prevalence of total anaemia, Anaemia categories, and mean haemoglobin concentration in children 6-
59 months of age and by age group – Syrian refugees in South Lebanon 73 Table 23-4-1 Prevalence of Moderate and Severe anaemia in children 6-59 months of age and by age group,
Syrian refugees in South of Lebanon 73 Table 23-5: Prevalence of total anaemia, Anaemia categories, and mean haemoglobin concentration in children 6-
59 months of age and by age group – Syrian refugees in Beirut & Mount-Lebanon 74 Table 23-5-1 Prevalence of Moderate and Severe anaemia in children 6-59 months of age and by age group,
Syrian refugees in Beirut & Mount-Lebanon 74 Table 24: Prevalence of reported diarrhea, cough and fever in the two weeks prior to the interview 74 Table 25-1: Sources of immunization of children reported by mother or caregiver and by period stayed in
Lebanon 76 Table 25-2: Source of children’s immunization reported by mother/caregiver, by age of children 76 Figure 7: Immunization of children – Doses of Polio 76 Figure 8: Measles and Vitamin A Supplementation 77 Table 26-1: Prevalence of IYCF practices indicators – Syrian refugees in all Lebanon 78 Table 26-2: Prevalence of IYCF practices indicators – Syrian refugees in Bekaa 78 Table 26-3: Prevalence of IYCF practices indicators – Syrian refugees in the North of Lebanon 78 Table 26-4: Prevalence of IYCF practices indicators – Syrian refugees in the South of Lebanon 79 Table 26-5: Prevalence of IYCF practices indicators – Syrian refugees in Beirut and Mount-Lebanon 79 Table 27-1: Women physiological status and age – All Syrian refugees in Lebanon 81 Table 27-2: Women physiological status and age – Syrian refugees in Bekaa 81 Table 27-3: Women physiological status and age –Syrian refugees in the North of Lebanon 82 Table 27-4: Women physiological status and age –Syrian refugees in the South of Lebanon 82 Table 27-5: Women physiological status and age – Syrian refugees in Beirut and Mount Lebanon 83 Table 28: Prevalence of malnutrition among Syrian women 15-49 years in Lebanon 85 Table 29: ANC enrolment and iron-folic acid pills coverage, among Syrian Women 15-49 years in Lebanon 88 Table 30: Prevalence of Anaemia and Haemoglobin concentration in non-pregnant women of reproductive age
(15-49 years) – Syrian refugees in Lebanon 89 Table 31: WASH quality - Syrian refugees in Lebanon 90 Table 32: Different WASH indicators - Syrian refugees in Lebanon 93 Table 33: Prevalence of malnutrition compared to UNICEF SOWC, 2012 and FHS 2009 97

10
List of figures
Figure 1: Localization of Syrian refugees in Lebanon .............................................................................................30 Figure 2-1: Period stayed in Lebanon – All Syrian refugees....................................................................................55 Figure 2-2: Period stayed in Bekaa ..........................................................................................................................55 Figure 2-3: Period stayed in North Lebanon ............................................................................................................55 Figure 2-4: Period stayed in South Lebanon ............................................................................................................55 Figure 2-5: Period stayed in Beirut and Mount Lebanon .........................................................................................55 Figure 3: Source of income of Syrian refugees HH in Lebanon ..............................................................................58 Figure 4: Sources of Health Assistance ....................................................................................................................58 Figure 5: Reasons for no Health Assistance .............................................................................................................59 Figure 6-1: Distribution of age and sex of the all Syrian refugees in Lebanon (Global sample) .............................61 Figure 9-1: Physiological status by age, women 15-49 years – All Syrian refugees in Lebanon ............................83 Figure 9-2: Physiological status by age, women 15-49 years – Syrian refugees in Bekaa ......................................84 Figure 9-3: Physiological status by age, women 15-49 years – Syrian refugees in North .......................................84 Figure 9-4: Physiological status by age, women 15-49 years – Syrian refugees in South .......................................84 Figure 9-5: Physiological status by age, women 15-49 years – Syrian refugees in Beirut and Mount Lebanon .....85 Figure 10-1: Prevalence of malnutrition among women by age group – All Syrian refugees in Lebanon ..............87 Figure 11-1: Proportion of HH that said they are satisfied with the drinking water supply .....................................91 Figure 11-1: Main reason for dissatisfaction among households not satisfied with the water supply .....................91 Figure 12: Proportion of HH with children under 3 years old whose (last) stools ...................................................92

11
Acronyms and abbreviations
ANC Antenatal Care
CDC Centers for Disease Control and prevention
CI Confidence Interval
DEFF Design effect
ENA Emergency Nutrition Assessment
EPI Expanded Programme on Immunization
GAM Global Acute Malnutrition
HAZ Height-for-Age z-score
Hb Haemoglobin
HH Household
HIV/AIDS Human Immunodeficiency Virus/Acquired Immune Deficiency Syndrome
IOCC International Orthodox Christian Charities
IYCF Infant and Young Child Feeding
MAM Moderate Acute Malnutrition
MCH Maternal and Child Heath
MICS Multiple Indicators Cluster Survey
MMU Medical mobile unit
MOPH Ministry of Public Health
MOSA Ministry of Social Affairs
MUAC Middle Upper Arm Circumference
NCHS National Centre for Health Statistics
NGO Non-Government Organization
PHC Primary Health Care
PPS Probability Proportional to Size
ProGres UNHCR registration database for refugees
SAM Severe Acute Malnutrition
SD Standard Deviation
SENS Standardised Expanded Nutrition Survey methodology
SMART Standardized Monitoring & Assessment of Relief & Transitions
SOWC The State of the World’s Children
SPSS Statistical Package for Social Sciences (Statistical software)
TOR Terms of Reference
U5 Children under 5 years old
U18 Children under 18 years old
UN United Nations
UNHCR United Nations High Commissioner for refugees

12
UNICEF United Nations Children’s Funds
VASyr Vulnerability Assessment among Syrian refugees in Lebanon
WASH Water Sanitation and Hygiene
WAZ Weight-for-Age z-score
WHZ Weight-for-Height z-score
WFP World Food Programme
WHO World Health Organization
WRA Women of Reproductive Age

13
Executive Summary
Among the basic indicators used to assess the severity of a crisis are excess mortality and the nutritional
status of the population. An estimation of these two measures is reached through conducting an assessment
study of the affected population. To know the magnitude of the problem is important to know the affected
population’s size and, if applicable, the demographic characteristics of the population. A high proportion of
malnourished cases in a small population size are normally of less magnitude than a lower proportion of
malnourished cases in a large population size. The scale and type of intervention depends on the magnitude
of the emergency rather than simply on the prevalence of malnutrition.
In September 2012, the nutrition and food situation of Syrians displaced in Lebanon was assessed by a UN
inter-agency nutrition assessment team. The nutrition situation was within the acceptable levels of acute
malnutrition (the Global Acute Malnutrition rate was 4.4%). However, it was noted that the presence of
aggravating factors such as poor living conditions for some of the refugees, onset of the cold season, high
disease burden, sub-optimal coverage of immunization and the unpredictable income levels of families, many
of whom lost their livelihood and rely on money to purchase food, could affect the nutrition well-being of the
population, in the future.
The situation in Syria has not improved and the number of Syrian refugees arriving to Lebanon has
continuously increased. UNHCR and partners’ estimates at the end of 2013 indicate that there were 890,136
Syrian registered or awaiting registration in Lebanon of which 19.9% were estimated to be children under 5
years of age. This follow-up assessment aimed at identifying the nutrition wellbeing of vulnerable Syrian
women and children and the potential nutrition and health related interventions taking into consideration
existing public health programs and policies in Lebanon. The SMART (Standardized Monitoring and
Assessment of Relief and Transition) methodology was utilised for the assessment due to its reliability and
to facilitate comparison of results with those of 2012 results.
Since there is no database of the iron deficiency or anaemia levels of children under the age of 5 and women
of reproductive age (WRA) among the Syrian refugees in Lebanon, the UN agencies and their partners
decided to measure the prevalence of anaemia in children from 6-59 months of age and in women of
reproductive age for surveillance purposes and to create a baseline of the iron deficiency situation.
A Task Force committee constituted by the representatives from UN agencies (UNICEF, WFP, WHO and
UNHCR) in Lebanon, Ministry of Puble Health (MOPH) and NGO partners helped and advised on the
coordination of the nutrition assessment through all its stages.
Objectives: The nutrition assessment examined the nutritional status of Syrian refugees in Lebanon. Children
under the age of five, as well as women of reproductive age were assessed for malnutrition. Women and
children were also tested for anaemia. Any case of anaemia or malnutrition identified during the assessment
was referred to the MOPH primary health care structures for treatment. Moreover, the infant and young child
feeding (IYCF) practices among children 0-23 months were investigated and the level of access to health
services and access and use of improved water, sanitation and hygiene facilities were also assessed. As the
VASyr study was conducted by WFP three months before the current assessment (May-June 2013),
assessing the Syrian refugee vulnerability including the situation of food security situation, this nutrition
assessment did not cover food security.

14
Specific objectives of the assessment were:
1. To estimate the prevalence of acute malnutrition, stunting (chronic malnutrition) and underweight of
children from 6-59 months of age.
2. To estimate the malnutrition levels among women of reproductive age based on middle-upper arm
circumference (MUAC) measurement.
3. To assess the two-week period prevalence of diarrhea, cough and fever among children 6-59 months.
4. To measure the prevalence of anaemia among children 6-59 months and women of reproductive age
(non-pregnant), 15-49 years.
5. To determine the coverage of measles and Polio vaccination among children 9-59 months.
6. To determine the coverage of vitamin A supplementation in the last six months among children 6-59
months and postnatal women.
7. To investigate IYCF practices among parents of children 0-23 months.
8. To determine the population’s access to and use of improved water, sanitation and hygiene facilities.
9. To identify/document the underlying factors likely to influence the nutritional well-being of Syrian
refugees in Lebanon.
Initially, the Joint Nutrition Assessment was planned to assess the overall nutrition status of both Syrian
refugees and Lebanese host community concurrently in the areas where Syrian refugees live. However, at
the end of the surveyor’s preparation phase (selection and training) and the completion of the sampling
process for Syrian refugees’ assessment, the process to build the sample frame for Lebanese host
communities was still pending due to political concerns. Thus, after a delay in commencing the field work for
the Nutrition Assessment, it was decided to do the data collection for Syrian refugees (in all Lebanon) first. As
a second step, it was planned that when the data collection of Syrian refugees ended, the sample frame
process for Lebanese host communities would be ready and the data collection from host communities would
begin directly.
Unfortunately, two months later (at the end of data collection for Syrian refugees) winter storms had arrived,
and the sample frame process for Lebanese host communities was still not complete. So it was decided that
the Nutrition Assessment for Lebanese host communities will be conducted after winter. Thus, this report will
cover only the Nutrition Assessment of Syrian refugees in Lebanon.
Design and methodology: The SMART (Standardized Monitoring and Assessment of Relief and
Transition) methodology, in conformity with a UNHCR SENS methodology, was used to collect and analyze
data on child anthropometry. Additional questionnaires were designed to collect quantitative data on infant
and young child feeding, health (disease and immunization), water and sanitation services. The basic
anthropometric data was collected using standard anthropometric equipment and tools (questionnaire) to
enable analysis of the basic nutrition indicators of wasting, stunting and underweight. Some of the data
collected include age, sex, weight and height for 6-59 months old children and MUAC measurement (for both
children and women of reproductive age from 15-49. Additional qualitative information was collected to
complement the quantitative data – including infant feeding and access to basic services. In addition to the
limited quantitative variables recommended in the SMART guidelines1 for rapid assessment, haemoglobin
1Standardized Monitoring and Assessment of Relief and Transition (SMART) Methodology Guidelines
15
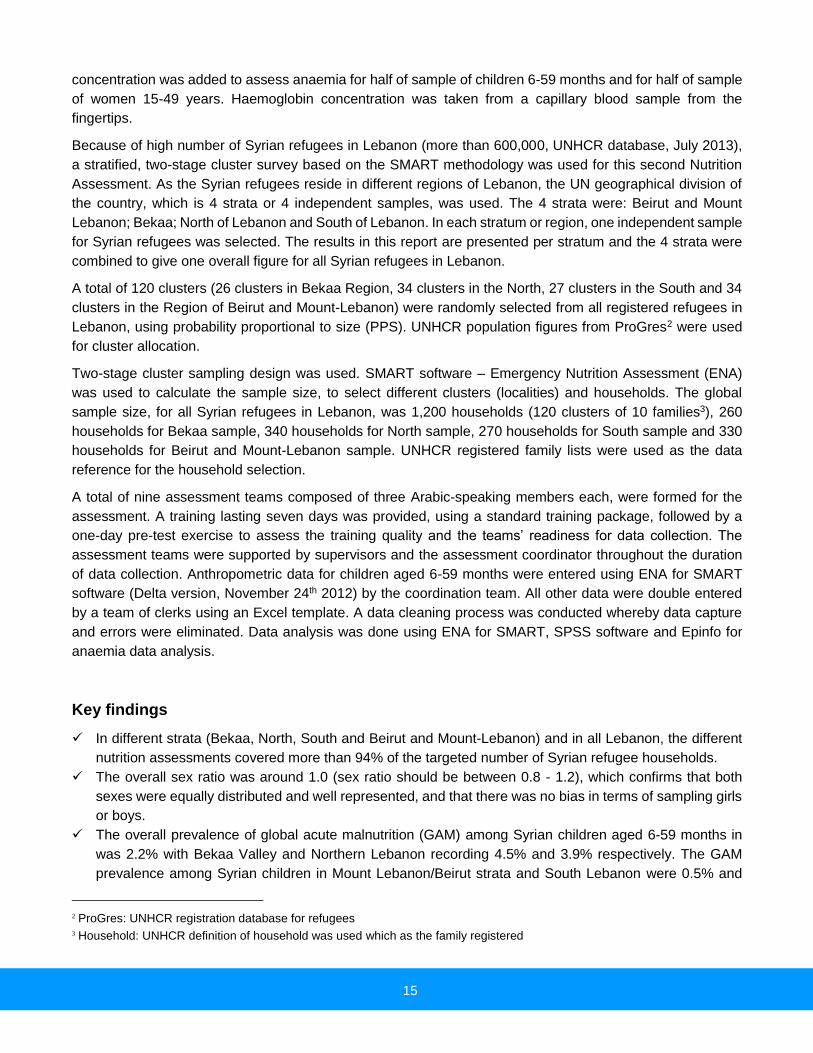
concentration was added to assess anaemia for half of sample of children 6-59 months and for half of sample
of women 15-49 years. Haemoglobin concentration was taken from a capillary blood sample from the
fingertips.
Because of high number of Syrian refugees in Lebanon (more than 600,000, UNHCR database, July 2013),
a stratified, two-stage cluster survey based on the SMART methodology was used for this second Nutrition
Assessment. As the Syrian refugees reside in different regions of Lebanon, the UN geographical division of
the country, which is 4 strata or 4 independent samples, was used. The 4 strata were: Beirut and Mount
Lebanon; Bekaa; North of Lebanon and South of Lebanon. In each stratum or region, one independent sample
for Syrian refugees was selected. The results in this report are presented per stratum and the 4 strata were
combined to give one overall figure for all Syrian refugees in Lebanon.
A total of 120 clusters (26 clusters in Bekaa Region, 34 clusters in the North, 27 clusters in the South and 34
clusters in the Region of Beirut and Mount-Lebanon) were randomly selected from all registered refugees in
Lebanon, using probability proportional to size (PPS). UNHCR population figures from ProGres2 were used
for cluster allocation.
Two-stage cluster sampling design was used. SMART software – Emergency Nutrition Assessment (ENA)
was used to calculate the sample size, to select different clusters (localities) and households. The global
sample size, for all Syrian refugees in Lebanon, was 1,200 households (120 clusters of 10 families3), 260
households for Bekaa sample, 340 households for North sample, 270 households for South sample and 330
households for Beirut and Mount-Lebanon sample. UNHCR registered family lists were used as the data
reference for the household selection.
A total of nine assessment teams composed of three Arabic-speaking members each, were formed for the
assessment. A training lasting seven days was provided, using a standard training package, followed by a
one-day pre-test exercise to assess the training quality and the teams’ readiness for data collection. The
assessment teams were supported by supervisors and the assessment coordinator throughout the duration
of data collection. Anthropometric data for children aged 6-59 months were entered using ENA for SMART
software (Delta version, November 24th 2012) by the coordination team. All other data were double entered
by a team of clerks using an Excel template. A data cleaning process was conducted whereby data capture
and errors were eliminated. Data analysis was done using ENA for SMART, SPSS software and Epinfo for
anaemia data analysis.
Key findings
In different strata (Bekaa, North, South and Beirut and Mount-Lebanon) and in all Lebanon, the different
nutrition assessments covered more than 94% of the targeted number of Syrian refugee households.
The overall sex ratio was around 1.0 (sex ratio should be between 0.8 - 1.2), which confirms that both
sexes were equally distributed and well represented, and that there was no bias in terms of sampling girls
or boys.
The overall prevalence of global acute malnutrition (GAM) among Syrian children aged 6-59 months in
was 2.2% with Bekaa Valley and Northern Lebanon recording 4.5% and 3.9% respectively. The GAM
prevalence among Syrian children in Mount Lebanon/Beirut strata and South Lebanon were 0.5% and
2 ProGres: UNHCR registration database for refugees
3 Household: UNHCR definition of household was used which as the family registered

16
0.3% respectively. Though there was slightly elevated levels in Bekaa and North Lebanon strata, the
overall nutrition situation is within acceptable level according to the WHO categorization
The overall total anaemia prevalence among children from 6 to 59 months of age were, for all Syrian
refugees in Lebanon: 21.0%; in Bekaa: 13.9%; for Syrian refugees in North: 25.8%; in South: 23.4% and
for Syrian refugees in Beirut and Mount Lebanon: 21.2%.
Children between 6-23 months tended to be the most affected by anaemia: 31.5% among all Syrian
children from 6 to 23 months of age, 24.1% for the same group of age in Bekaa, 42.9% in the North, 30.8%
in the South and 27.7% in Beirut and Mount Lebanon. The children from 6 to 23 months of age, in the
North of Lebanon, were most affected by anaemia (more than 40%).
For households (HH) that had been in Lebanon for less than 12 months (at the time of the survey), 45.3%
of children received their vaccinations in Syria. This proportion was 31.1% among Syrian refugee HH who
had been in Lebanon for 1 year or more. However, for the HH that had been in Lebanon for 1 year or
more, more children received their immunization from the Primary Healthcare Center (PHC) (45.5%
compared to 34.2%).
For households that had children of less than 24 months of age, 60.4% immunized their children in a PHC
and only 18.1% of their children were vaccinated only in Syria. However, 20% of HH with children less
than 2 years of age reported that they received vaccines from different places.
Among all Syrian refugees in Lebanon, more than 85% of children 0-23 months were ever breastfed. More
than 60% of mothers initiated breastfeeding in the first 23 hours after birth and 25% of children 0-23
months were exclusively breastfed. However, around 35% of children 0-23 months received bottle
feedings.
Regarding the duration of breastfeeding, more than 50% of children 0-23 months were breastfed until the
age of one year and depending on the stratum, between 20-33% of children 0-23 months were breastfed
until 2 years old.
The prevalence of malnutrition among women aged 15-49 years was similar to the prevalence observed
last year.
The Syrian refugee women aged 15-49 years in the North and in the South presented the highest
prevalence of malnutrition (the North for the severely malnourished and the South for the total
malnourished).
More than 75% of malnourished women among Syrian refugees in Lebanon were aged less than 35 years
old. With the excpetion of the Beirut and Mount-Lebanon stratum (where 36% of malnourished were 15-
19 years), more than 40% of malnourished Syrian refugee women were between 15-19 years old.
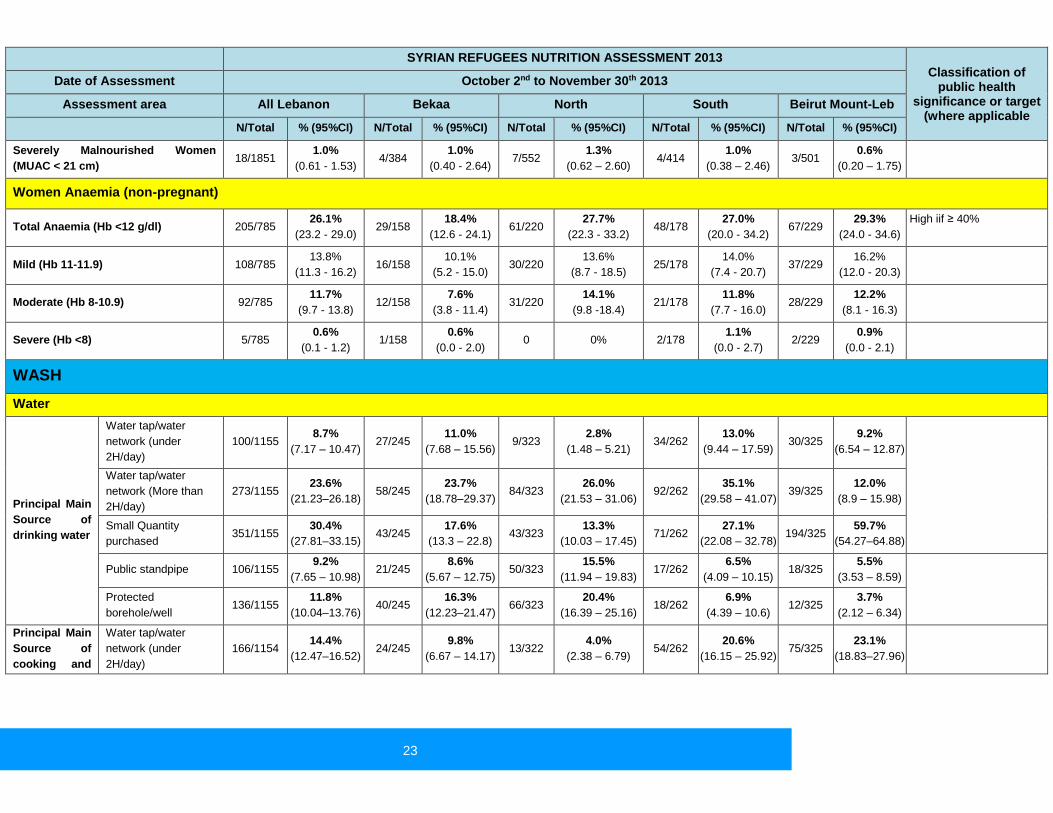
The total prevalence of anaemia for non-pregnant women of reproductive age (15-49 years) was: for all
Syrian refugees in Lebanon, 26.1%; in Bekaa, 18.4%; in North, 27.7%; in South, 27.0% and for Syrian
refugees in Beirut and Mount Lebanon, 29.3%.
The non-pregnant Syrian refugee women of reproductive age (15-49 years) who lived in Beirut and Mount-
Lebanon had more anaemia cases and those who lived in Bekaa had fewer anaemia cases.
Conclusion
The prevalence of GAM among children is within acceptable levels according to the WHO categorization
though Bekaa Valley and and Northern Lebanon strata had elevated rates of malnutrition. The malnutrition
rates among women aged 15-49 years is 5.0%. Due to aggravating factors (the increase in food prices in
winter, risk of food insecurity, increasing of numbers and the new arrivals that could be in worse condition),
the nutrition situation can change quickly and has the potential to deteriorate rapidly. Concerted, integrated
17
efforts, in collaboration with MOPH, will be required to maintain the GAM levels to the WHO acceptable level
of < 5%.
Immediate measures must be taken to improve the package and coverage of preventative
services of IYCF, micronutrient, puclic health and adequate food intervention. Screening
activities should be strengthened to identify any cases with malnutrition and referral for
treatment, targeting both women and children from the refugee community.
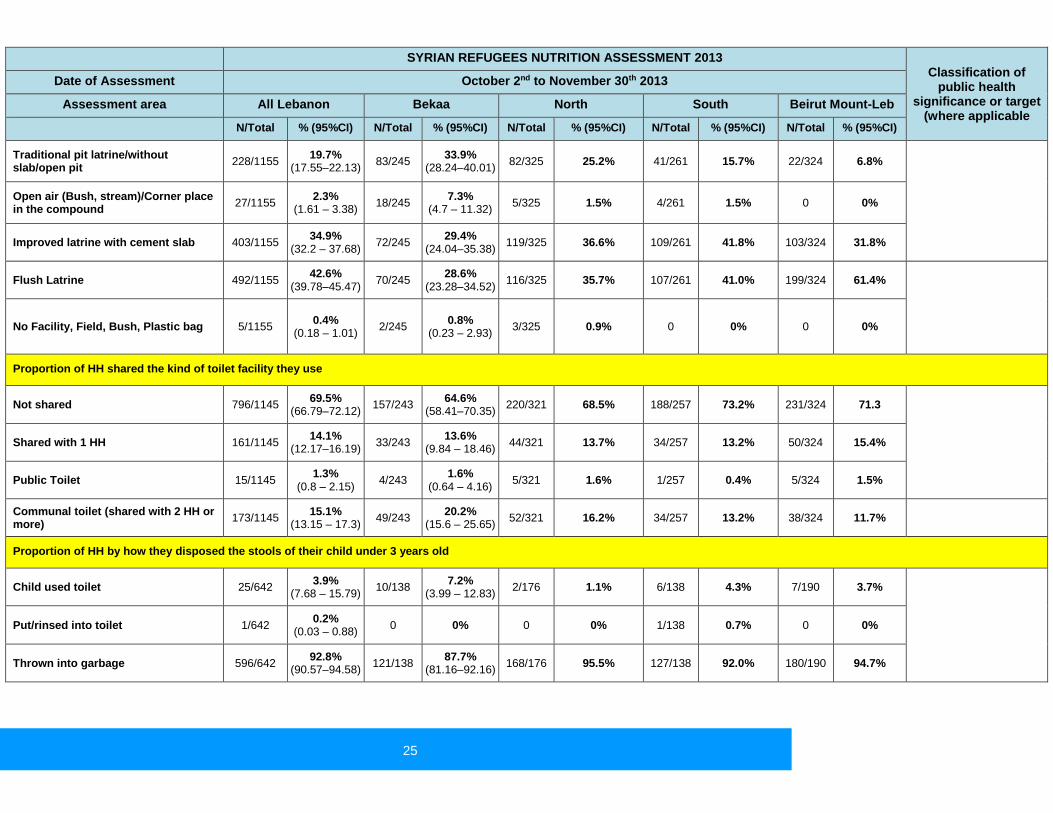
Moreover, more than 90% of the Syrian refugee HH in Lebanon threw the stools of their children under 3 years
old in garbage. This situation needs more investigation.
Recommendations and priorities
Immediate term
1. Discussing with MOPH, MOSA and all other partners to strengthen capacity for acute malnutrition
management for preparedness purposes.
2. Setting up a Nutrition Working Group and reinforcing the role and responsibility of the nutrition group
and its respective members to organize and coordinate the nutrition sector and response.
3. Setting up or reinforcing a screening mechanism of children and mothers for malnutrition upon arrival in
Lebanon.
4. Setting up or reinforcing services for screening of children and mothers, at community and health facility
level, and referral for treatment of any malnourished cases identified.
5. Developing national guidelines or national protocol for acute malnutrition management and prevention
or adopt the international ones to the Lebanon context, including the national training plan.
6. Strengthening the awareness, promotion, and protection of positive infant and young child feeding
practices through NGOs and PHCs or other government services’ activities by accelerating sensitization
and awareness creation on appropriate breast-feeding and complementary feeding practices as well as
micronutrient provision including exploring possibility for dietary diversification.
7. Improving education and communication strategies in the health centers and in the community including
integrating communication for development strategies to positively influence behavior and practices.
8. Scale-up of hygiene promotion activities (including adequate access to soap through either distribution
or the means to purchase) and improve water quality access and monitoring the quality of water to
address disease incidence and facilitate disease treatment through the health facilities.
9. Facilitate adequate dietary intake for women and children to promote optimal growth and prevent
malnutrition through adequate food provision and livelihood support to families.
10. Scale-up of sanitation promotion activities (including how to dispose in an improved way the stools of
the children under 3 years old).
Medium term
1. Strengthening the nutrition surveillance system and to explore how to integrate it in the existing Health
Surveillance System and improve a food security monitoring system.
2. Putting a proper target of the most vulnerable refugees and host communities with a minimum response
package on health and nutrition surveillance, disease treatment, appropriate health and nutrition
promotion, adequate food security, water and sanitation services, and shelter against harsh weather.
18
Longer term
1. If the situation in Syria does not improve sufficiently to enable the return of the refugees to Syria, then a
nutrition survey in different regions should be conducted every year (depending on the delivery of
adequate response in the next 6 months). Survey methodology should be simplified to capture only key
indicators of anthropometry in children aged 6-59 months and mortality in the whole population as
recommended by the SMART methodology and if possible, to include components about nutrition
response (CMAM, micronutrient and IYCF) coverage.
2. A full expanded nutrition survey should be repeated only every 2 years.

19
Summary of the Results
SYRIAN REFUGEES NUTRITION ASSESSMENT 2013 Classification of
public health significance or target
(where applicable
Date of Assessment October 2nd to November 30th 2013
Assessment area All Lebanon Bekaa North South Beirut Mount-Leb
N/Total % (95%CI) N/Total % (95%CI) N/Total % (95%CI) N/Total % (95%CI) N/Total % (95%CI)
FAMILY OR HOUSEHOLD CHARACTERISTICS
Sample coverage (Response rate for
HH) 1158/1200 96.5% 245/260 94.2% 325/340 95.6% 263/270 97.4% 325/330 98.5%
Sample coverage (Response rate for
Children U5) 1387/828 167.5% 303/207 146.4% 362/207 174.9% 303/207 146.4% 419/207 202.4%
Average number of Children U5 ---- 1.4 --- 1.4 --- 1.3 ---- 1.3 ---- 1.5
Average HH size ---- 7.6 --- 7.1 --- 8.0 ---- 7.4 ---- 7.7
Woman headed households 151/1158 13% 54/245 22% 50/325 15.4% 31/263 11.8% 16/325 4.9%
Period stayed
in Lebanon
< 3 month 22/1158 1.9%
(1.26 – 2.86) 5/245
2.0%
(0.87 – 4.69) 9/325
2.8%
(1.46 – 5.18) 3/262
1.2%
(0.39 – 3.32) 33/325
10.2%
(7.32–13.91)
3-6 months 186/1158 16.1%
(1.26 – 2.86) 53/245
21.7%
(16.93 –
2.86)
83/325 25.5%
(21.10 – 30.55) 22/262
8.4%
(5.61 – 12.39) 121/325
37.2%
(32.15–42.6)
7-12 months 550/1158 47.5%
(1.26 – 2.86) 130/245
53.1%
(1.26–21.63) 164/325
50.5%
(45.05 – 55.86) 135/262
51.5%
(4.55 – 55.52) 126/325
38.8%
(33.63–44.17)
12-24 months 313/1158 27.1%
(1.26 – 2.86) 48/245
19.`6%
(15.11–25.01) 52/325
16.0%
(12.41 – 20.38) 87/262
33.2%
(27.79 –
39.12)
45/325 13.8%
(10.52–18.03)
≥ 24 months 86/1158 7.4%
(1.26 – 2.86) 9/245
3.7%
(1.94 – 6.83) 17/325
5.2%
(3.29 – 8.22) 15/262
5.7%
(0.35 – 9.24) 5/325
1.5%
(0.66 – 3.55)
Principal
Sources of HH
income
Work 592/1156 51.2%
(48.33 – 58.08) 132/245
53.9% (47.63 – 60.01)
121/325 37.2%
(32.15 – 42.61) 147/262
56.1% (50.06 – 61.99)
192/324 59.3%
(53.83–64.47)
Skilled Labor 101/1156 8.7%
(7.25 – 10.51) 14/245
5.7% (3.43 – 9.36)
24/325 7.4%
(5.01 – 10.75) 23/262
8.8% (5.92 – 12.83)
40/324 12.3%
(9.20 –16.35)
Cash from
Humanitarian Org 125/1156
10.8% (9.15 – 12.73)
25/245 10.2%
(7.00 – 14.62) 53/325
16.3% (12.69 – 20.72)
24/262 9.2%
(6.23 – 13.27) 23/324
7.1%
(4.78 – 10.43)

20
SYRIAN REFUGEES NUTRITION ASSESSMENT 2013 Classification of
public health significance or target
(where applicable
Date of Assessment October 2nd to November 30th 2013
Assessment area All Lebanon Bekaa North South Beirut Mount-Leb
N/Total % (95%CI) N/Total % (95%CI) N/Total % (95%CI) N/Total % (95%CI) N/Total % (95%CI)
Food Vouchers 209/1156 18.1%
(15.97–20.45) 41/245
16.7% (12.58–21.91)
94/325 28.9%
(24.26 – 34.07) 33/262
12.6% (9.11 – 17.17)
41/324 12.7%
(9.46 – 16.71)
CHILDREN UNDER 5 YEARS
Acute Malnutrition (WHO 2006 Growth Standards) – 95% Confidence Interval (CI)
Global Acute Malnutrition (GAM) 30/1352 2.2 %
(1.5 – 3.3) 13/292
4.5 % (2.3 – 8.3)
14/356 3.9 %
(2.5 – 6.1) 1/299
0.3 % (0.0 – 2.6)
2/405 0.5 %
(0.1 – 2.1)
Critical: if ≥ 15%
Serious: between 10-
14.9%
Poor: between 5 - 9.9%
Acceptable :Less than 5%
Moderate Acute Malnutrition (MAM) 24/1352 1.8 %
(1.2 – 2.6) 8/292
2.7 % (1.3 – 5.5)
13/356 3.7 %
(2.3 – 5.8) 1/299
0.0 % (0.0 – 2.6)
2/405 0.5 %
(0.1 – 2.1)
Severe Acute Malnutrition (SAM) 6/1352 0.4) 5/292 1.7 %
(0.5 - 5.4) 1/356
0.3 % (0.0 – 2.1 )
0 0(0.0 – 0.0) 0 0.0 %
(0.0 – 0.0)
Oedema 6/1352 0.4 % 5/292 1.7 %
1/356 0.3% 0 0% 0 0%
Stunting (WHO 2006 Growth Standards) – 95% CI
Total stunting 248/1331 18.6 % (16.4 – 21.1)
60/285 21.1 %
(15.7 – 27.6 70/3350
20.0 % (15.6- - 25.3)
62/298 20.8 %
(16.3 – 26.1) 56/398
14.1 % (10.8-18.1)
Critical: if ≥ 40%
Serious: between 30-
39.9%
Poor: between 20 - 29.9%
Severe stunting 37/1331 2.8 %
(2.0 - 3.8) 12/285
4.2% (2.3 - 7.7)
9/350 2.6 %
(1.5 - 4.5) 13/298
4.4 % (2.4 – 7.7)
3/398 0.8 %
(0.2 - 2.3)
Underweight (WHO 2006 Growth Standards) – 95% CI
Total underweight 35/1343 2.6 %
(1.9 – 3.6) 7/288
2.4 % (1.0 - 5.9)
11/355 3.1 %
(1.8 – 5.2) 10/299
3.3 % (1.9 – 5.7)
9/403 2.2 %
(1.0 - 5.0)
Critical: if ≥ 30%
Serious: between 20-
29.9%
Poor: between 10 - 19.9%
Severe underweight 3/1343 0.2 %
(0.1 – 0.7) 2/288
0.7 % (0.2 – 2.9)
1/355 0.3 %
(0.0 - 2.1) 1/299
0.3 % (0.0 – 2.6)
1/403 0.2 %
(0.0 - 1.9)
Programme coverage

21
SYRIAN REFUGEES NUTRITION ASSESSMENT 2013 Classification of
public health significance or target
(where applicable
Date of Assessment October 2nd to November 30th 2013
Assessment area All Lebanon Bekaa North South Beirut Mount-Leb
N/Total % (95%CI) N/Total % (95%CI) N/Total % (95%CI) N/Total % (95%CI) N/Total % (95%CI)
Vitamin A supplementation within
past 6 months 82/1465
5.6% (4.53 – 6.90)
14/320 4.4%
(2.63 – 7.21) 28/388
7.2% (5.04– 10.24)
21/311 6.8%
(4.46 – 10.10) 19/446
4.3% (2.74 – 6.56)
Target of ≥ 95%
Proportion of children vaccinated in
Syria with card or recall 1117/1493
74.8% (72.56–76.96)
243/326 74.6%
(69.54 – 78.96) 292/393
74.3% (69.76 – 78.37)
239/316 75.6%
(70.61 – 80.04) 343/458
74.9% (70.72–78.64)
Measles vaccination with card or
recall (9-59 months) 349/1223
28.5% (26.08–31.14)
68/276 24.7%
(19.93 – 30.05) 79/320
24.7% (20.28 – 29.70)
87/253 34.4%
(28.81 – 40.44) 115/374
39.7% (26.29–35.60)
Target of ≥ 90%
Number of doses of Polio
vaccine had given
1 dose 241/853 28.3%
(25.33–31.36) 66/166
39.8%
(32.63–47.36) 68/198
34.3%
(28.08–41.20) 51/193
26.4%
(20.70–33.06) 56/296
18.9%
(14.87–23.77)
2 doses 279/853 32.7%
(29.65–35.93) 57/166
34.3%
(27.54–41.84) 51/198
25.8%
(20.17–32.27) 64/193
33.2%
(26.90–40.07) 107/296
36.2%
(30.89–41.77)
3 doses 333/853 39.0%
(45.82–42.36) 43/166
25.9%
(19.83–33.06) 79/198
39.9%
(33.33–46.85) 78/193
40.4%
(33.74–47.45) 133/296
44.9%
(39.36–50.63)
Source of
Immunization
PHC center 526/1379 38.1%
(35.61–40.73) 97/293
33.1%
(27.97–38.69) 127/349
36.4%
(31.52–41.56) 141/295
47.8%
(42.16–53.49) 161/442
36.4%
(32.08–41.02)
Through MMU 24/1379 1.7%
(1.17 – 2.58) 3/293
1.0%
(0.35 – 2.96) 3/349
0.9%
(0.29 – 2.50) 3/295
1.0%
(0.35 – 2.95) 15/442
3.4%
(2.06 – 5.52)
Private Dr 12/1379 0.9%
(0.50 – 1.51) 2/293
0.7%
(0.19 – 2.45) 3/349
0.9%
(0.29 – 2.50) 0/295 0.0% 7/442
1.6%
(0.77 – 3.23)
Different places 261/1379 18.9%
(16.95–21.08) 83/293
28.3%
(23.48–33.74) 45/349
12.9%
(9.77 – 16.81) 44/295
14.9%
(11.31–19.44) 89/442
20.1%
(16.67–24.13)
Only in Syria 556/1379 40.3%
(37.76–42.93) 108/293
36.9%
(31.54–42.52) 171/349
49.0%
(43.79 – 54.23) 107/295
36.3%
(30.99–41.90) 170/442
38.5%
(34.04–43.19)
Children Morbidity
Diarrhea in past 2 weeks 376/1511 24.9%
(22.77–27.12) 88/330
26.7%
(22.19–31.69) 133/399
33.3%
(28.88–38.09) 76/322
23.6%
(19.29–28.53) 79/460
17.2%
(14.0 –20.88)
Cough in past 2 weeks 605/1507 40.1%
(37.70–42.65) 109/329
33.1%
(28.26–38.39) 174/396
43.9%
(39.13–48.86) 130/322
40.4%
(35.16–45.81) 192/460
41.7%
(37.32–46.30)
Fever in past 2 weeks 512/1508 34.0%
(31.60–36.38) 120/330
36.4%
(31.35–41.68) 155/398
38.9%
(34.28–43.81) 115/321
35.8%
(30.78–41.21) 122/459
26.6%
(22.75–30.80)
Children Anaemia
Total Anaemia (Hb <11 g/dl) 139/661 21.0%
(17.6 - 24.5) 22/158
13.9%
(8.2 - 19.6) 40/155
25.8%
(16.9 - 34.7) 34/145
23.4%
(16.3 - 30.6) 43/203
21.2%
(15.3 - 27.1)
High iif ≥ 40%

22
SYRIAN REFUGEES NUTRITION ASSESSMENT 2013 Classification of
public health significance or target
(where applicable
Date of Assessment October 2nd to November 30th 2013
Assessment area All Lebanon Bekaa North South Beirut Mount-Leb
N/Total % (95%CI) N/Total % (95%CI) N/Total % (95%CI) N/Total % (95%CI) N/Total % (95%CI)
Mild (Hb 10-10.9) 109/661 16.5%
(13.5 - 19.5) 20/158
12.7%
(7.6 - 17.7) 31/155
20.0%
(11.8 - 28.2) 25/145
17.2%
(11.0 - 23.5) 33/203
16.3%
(11.3 - 21.2)
Moderate (Hb 7-9.9) 30/661 4.5%
(2.9 - 6.2) 2/158
1.3%
(0.0 - 3.1) 9/155
5.8%
(2.8 - 8.8) 9/145
6.2%
(1.5 - 10.9) 10/203
4.9%
(1.8 - 8.0)
Severe (Hb <7) 0 0% 0 0% 0 0% 0 0% 0 0%
IYCF indicators
Timely Initiation of
Breastfeeding (First
time to put child to the
breast)
< 24 hours 157/502 31.3%
(27.37–35.45) 31/102
30.4%
(22.31–39.89) 32/146
21.9%
(15.98 – 29.3) 32/108
29.6%
(21.84–38.82) 62/146
42.5%
(34.75–50.58)
1-24 hours 201/502 40.0%
(35.85–44.39) 34/102
33.3%
(24.93–42.94) 74/146
50.7%
(42.66–58.67) 46/108
42.6%
(33.58–52.01) 47/146
32.2%
(25.15–40.14)
≥ 24 hours 144/502 28.7%
(24.91–32.8) 37/102
36.3%
(27.6 –45.95) 40/146
27.4%
(20.81–35.14) 30/108
27.8%
(20.21–36.88) 37/146
25.3%
(18.98–32.97)
Exclusive Breastfeeding < 6 months 22/88 25.0%
(17.13–34.96) 4/16
25.0%
(10.18 – 49.5) 6/24
25.0%
(12.0 – 44.9) 4/16
25.0%
(10.18 – 49.5) 8/32
25.0%
(13.25–42.11)
Continued breastfeeding at 1 year 44/68 64.7%
(52.85 – 75.0) 9/12
75.0%
(46.77–99.11) 15/23
65.2%
(44.89–81.19) 7/13
53.8%
(29.15 – 76.8) 13/20
65.0%
(43.29–81.88)
Continued breastfeeding at 2 years 19/63 30.2%
(20.24–42.36) 4/12
33.3%
(13.81–60.93) 3/15
20.0%
(7.05 – 45.19) 5/14
35.7%
(16.34–61.23) 7/22
31.8%
(16.36–52.68)
WOMEN 15-49 YEARS
Physiological Status
Women aged 15-49 years who were
pregnant 231/1896
12.2%
(10.78–13.73) 51/395
12.9%
(9.96 – 16.58) 64/558
11.5%
(9.09 – 14.38) 59/425
13.9%
(10.92–17.49) 57/518
11.0%
(8.59 – 13.99)
Women aged 15-49 years who were
Lactating 288/1896
15.1%
(16.64–16.88) 68/395
17.2%
(13.82–21.25) 82/558
14.7%
(12.0 – 17.88) 60/425
14.1%
(11.13–17.75) 76/518
14.7%
(11.88–18.08)
MUAC Women
Malnourished Women (MUAC < 23 cm) 92/1851 5.0%
(4.07 - 6.06) 14/384
3.6%
(2.19 - 6.03) 29/552
5.3%
(3.68 - 7.44) 27/414
6.5%
(4.52 - 9.32) 22/501
4.4%
(2.92 – 6.56)
23
SYRIAN REFUGEES NUTRITION ASSESSMENT 2013 Classification of
public health significance or target
(where applicable
Date of Assessment October 2nd to November 30th 2013
Assessment area All Lebanon Bekaa North South Beirut Mount-Leb
N/Total % (95%CI) N/Total % (95%CI) N/Total % (95%CI) N/Total % (95%CI) N/Total % (95%CI)
Severely Malnourished Women
(MUAC < 21 cm) 18/1851
1.0%
(0.61 - 1.53) 4/384
1.0%
(0.40 - 2.64) 7/552
1.3%
(0.62 – 2.60) 4/414
1.0%
(0.38 – 2.46) 3/501
0.6%
(0.20 – 1.75)
Women Anaemia (non-pregnant)
Total Anaemia (Hb <12 g/dl) 205/785 26.1%
(23.2 - 29.0) 29/158
18.4%
(12.6 - 24.1) 61/220
27.7%
(22.3 - 33.2) 48/178
27.0%
(20.0 - 34.2) 67/229
29.3%
(24.0 - 34.6)
High iif ≥ 40%
Mild (Hb 11-11.9) 108/785 13.8%
(11.3 - 16.2) 16/158
10.1%
(5.2 - 15.0) 30/220
13.6%
(8.7 - 18.5) 25/178
14.0%
(7.4 - 20.7) 37/229
16.2%
(12.0 - 20.3)
Moderate (Hb 8-10.9) 92/785 11.7%
(9.7 - 13.8) 12/158
7.6%
(3.8 - 11.4) 31/220
14.1%
(9.8 -18.4) 21/178
11.8%
(7.7 - 16.0) 28/229
12.2%
(8.1 - 16.3)
Severe (Hb <8) 5/785 0.6%
(0.1 - 1.2) 1/158
0.6%
(0.0 - 2.0) 0 0% 2/178
1.1%
(0.0 - 2.7) 2/229
0.9%
(0.0 - 2.1)
WASH
Water
Principal Main
Source of
drinking water
Water tap/water
network (under
2H/day)
100/1155 8.7%
(7.17 – 10.47) 27/245
11.0%
(7.68 – 15.56) 9/323
2.8%
(1.48 – 5.21) 34/262
13.0%
(9.44 – 17.59) 30/325
9.2%
(6.54 – 12.87)
Water tap/water
network (More than
2H/day)
273/1155 23.6%
(21.23–26.18) 58/245
23.7%
(18.78–29.37) 84/323
26.0%
(21.53 – 31.06) 92/262
35.1%
(29.58 – 41.07) 39/325
12.0%
(8.9 – 15.98)
Small Quantity
purchased 351/1155
30.4%
(27.81–33.15) 43/245
17.6%
(13.3 – 22.8) 43/323
13.3%
(10.03 – 17.45) 71/262
27.1%
(22.08 – 32.78) 194/325
59.7%
(54.27–64.88)
Public standpipe 106/1155 9.2%
(7.65 – 10.98) 21/245
8.6%
(5.67 – 12.75) 50/323
15.5%
(11.94 – 19.83) 17/262
6.5%
(4.09 – 10.15) 18/325
5.5%
(3.53 – 8.59)
Protected
borehole/well 136/1155
11.8%
(10.04–13.76) 40/245
16.3%
(12.23–21.47) 66/323
20.4%
(16.39 – 25.16) 18/262
6.9%
(4.39 – 10.6) 12/325
3.7%
(2.12 – 6.34)
Principal Main
Source of
cooking and
Water tap/water
network (under
2H/day)
166/1154 14.4%
(12.47–16.52) 24/245
9.8%
(6.67 – 14.17) 13/322
4.0%
(2.38 – 6.79) 54/262
20.6%
(16.15 – 25.92) 75/325
23.1%
(18.83–27.96)

24
SYRIAN REFUGEES NUTRITION ASSESSMENT 2013 Classification of
public health significance or target
(where applicable
Date of Assessment October 2nd to November 30th 2013
Assessment area All Lebanon Bekaa North South Beirut Mount-Leb
N/Total % (95%CI) N/Total % (95%CI) N/Total % (95%CI) N/Total % (95%CI) N/Total % (95%CI)
washing
water
Water tap/water
network (More than
2H/day) 472/1154
40.9%
(3.81 – 43.76) 66/245
26.9%
(21.77–32.82) 128/322
39.8%
(34.56 – 45.19) 135/262
51.5%
(45.5 – 57.52) 143/325
44.0%
(38.7 – 49.44)
Small Quantity
purchased 71/1154
6.2%
(4.9 – 7.69) 27/245
11.0%
(7.68 – 15.56) 12/322
3.7%
(2.15 – 6.4) 13/262
5.0%
(2.78 – 8.53) 19/325
5.8%
(3.78 – 8.95)
Protected
borehole/well 235/1154
20.4%
(18.14–22.78) 56/245
22.9%
(18.04–28.51) 84/322
26.1%
(21.6 – 31.15) 33/262
12.6%
(9.11 – 17.17) 62/325
19.1%
(15.18– 23.7)
Unprotected
borehole/well 71/1154
6.2%
(4.9 – 7.69) 28/245
11.4%
(8.03 – 16.02) 31/322
9.6%
(6.87 – 13.34) 7/262
2.7%
(0.13 – 5.41) 5/325
1.5%
(0.66 – 3.55)
Proportion of HH with water storage
capacity 790/1156
68.3%
(65.6 – 70.9) 155/245
63.3%
(57.07–69.06) 211/324
65.1%
(59.78 – 70.1) 181/262
69.1%
(63.24 – 74.37) 243/325
74.8%
(69.78–79.18)
Volume of
water storage
capacity
Less than 500 Liters 214/769 27.8%
(24.78–31.1) 37/152
24.3%
(18.21–31.74) 55/204
27.0%
(21.34 – 33.43) 46/180 25.6% 76/233 32.6%
500 – 1,000 Liters 359/769 46.7%
(43.18–50.21) 63/152
41.4%
(33.92–49.4) 99/204
48.5%
(41.76 – 55.35) 93/180 51.7% 104/233 44.6%
1,000 – 3,000 Liters 176/769 22.9%
(20.06–25.99) 46/152
30.3%
(23.52–37.98) 44/204
21.6%
(16.48 – 27.71) 37/180 20.6% 49/233 21.0%
More than 3,000
Liters 20/769
2.6%
(1.69 – 3.98) 6/152
3.9%
(1.82 – 8.35) 6/204
2.9%
(1.35 – 6.27) 4/180 2.2% 4/233 1.7%
Proportion of HH that say they are
satisfied with drinking water supply 575/1156
49.7%
(46.86–52.62) 110/245
44.9%
(38.8 – 51.16) 171/324
52.8%
(47.34 - 58.15) 145/262 55.3% 149/325 45.8%
Reasons for
none
satisfaction
with drinking
water supply
Not enough for
adequate personal
hygiene of children
147/592 24.8%
(21.52–28.46) 51/136
37.5%
(29.81–45.87) 51/156
32.7%
(25.82 – 40.39) 20/116 17.2% 25/184 13.6%
Have to pay for water
– Cost 126/592
21.3%
(18.17–24.76) 26/136
19.1%
(13.4 – 26.54) 22/156
14.1%
(9.5 – 20.43) 27/116 23.3% 51/184 27.7%
Bad Taste 21/592 3.5%
(2.33 – 5.37) 4/136
2.9%
(1.15 – 7.32) 6/156
3.8%
(1.78 – 8.14) 3/116 2.6% 8/184 4.3%
Bad Quality of Water 199/592 33.6%
(29.92–37.51) 51/136
37.5%
(29.81–45.87) 55/156 35.3% 42/116 36.2% 51/184 27.7%
Proportion of HH that say they have
access to soap and hygiene products 686/1153
59.5%
(56.8–62.46) 152/245
62.0%
(55.82–67.89) 219/324 67.6% 147/261 56.3% 168/323 52.0%
Proportion of HH by kind of toilet facility they use
25
SYRIAN REFUGEES NUTRITION ASSESSMENT 2013 Classification of
public health significance or target
(where applicable
Date of Assessment October 2nd to November 30th 2013
Assessment area All Lebanon Bekaa North South Beirut Mount-Leb
N/Total % (95%CI) N/Total % (95%CI) N/Total % (95%CI) N/Total % (95%CI) N/Total % (95%CI)
Traditional pit latrine/without slab/open pit
228/1155 19.7%
(17.55–22.13) 83/245
33.9% (28.24–40.01)
82/325 25.2% 41/261 15.7% 22/324 6.8%
Open air (Bush, stream)/Corner place in the compound
27/1155 2.3%
(1.61 – 3.38) 18/245
7.3% (4.7 – 11.32)
5/325 1.5% 4/261 1.5% 0 0%
Improved latrine with cement slab 403/1155 34.9%
(32.2 – 37.68) 72/245
29.4% (24.04–35.38)
119/325 36.6% 109/261 41.8% 103/324 31.8%
Flush Latrine 492/1155 42.6%
(39.78–45.47) 70/245
28.6% (23.28–34.52)
116/325 35.7% 107/261 41.0% 199/324 61.4%
No Facility, Field, Bush, Plastic bag 5/1155 0.4%
(0.18 – 1.01) 2/245
0.8% (0.23 – 2.93)
3/325 0.9% 0 0% 0 0%
Proportion of HH shared the kind of toilet facility they use
Not shared 796/1145 69.5%
(66.79–72.12) 157/243
64.6% (58.41–70.35)
220/321 68.5% 188/257 73.2% 231/324 71.3
Shared with 1 HH 161/1145 14.1%
(12.17–16.19) 33/243
13.6% (9.84 – 18.46)
44/321 13.7% 34/257 13.2% 50/324 15.4%
Public Toilet 15/1145 1.3%
(0.8 – 2.15) 4/243
1.6% (0.64 – 4.16)
5/321 1.6% 1/257 0.4% 5/324 1.5%
Communal toilet (shared with 2 HH or more)
173/1145 15.1%
(13.15 – 17.3) 49/243
20.2% (15.6 – 25.65)
52/321 16.2% 34/257 13.2% 38/324 11.7%
Proportion of HH by how they disposed the stools of their child under 3 years old
Child used toilet 25/642 3.9%
(7.68 – 15.79) 10/138
7.2% (3.99 – 12.83)
2/176 1.1% 6/138 4.3% 7/190 3.7%
Put/rinsed into toilet 1/642 0.2%
(0.03 – 0.88) 0 0% 0 0% 1/138 0.7% 0 0%
Thrown into garbage 596/642 92.8%
(90.57–94.58) 121/138
87.7% (81.16–92.16)
168/176 95.5% 127/138 92.0% 180/190 94.7%

26
SYRIAN REFUGEES NUTRITION ASSESSMENT 2013 Classification of
public health significance or target
(where applicable
Date of Assessment October 2nd to November 30th 2013
Assessment area All Lebanon Bekaa North South Beirut Mount-Leb
N/Total % (95%CI) N/Total % (95%CI) N/Total % (95%CI) N/Total % (95%CI) N/Total % (95%CI)
Put/rinsed into drain or ditch 6/642 0.9%
(0.43 – 2.02) 3/138
2.2% (0.74 – 6.19)
2/176 1.1% 1/138 0.7% 0 .0%
Other 14/642 2.2%
(1.3 – 3.63) 4/138
2.9% (1.13 – 7.22)
4/176 2.3% 3/138 2.2% 3/190 1.6%
CHILD PROTECTION
Average number of Children U18 ----- 3.79 ----- 3.69 ----- 3.77 ----- 3.93 ----- 3.76
Proportion of HH with children U18
from relatives 232/1058
21.9%
(19.54–24.52) 46/225
20.4%
(15.69–26.18) 70/291
24.1%
(19.5 – 29.28) 45/249
18.1%
(13.79–23.32) 71/293
24.2%
(19.68–29.45)
Proportion of HH by who is taking care of children U18
Mother 924/1054 87.7%
(85.55–87.67) 196/222
88.3%
(83.39–91.88) 249/290
85.9%
(81.38 – 89.4) 221/248
89.1%
(84.62–92.41) 258/294
87.8
(83.52–91.03)
Father 100/1054 9.5%
(7.86 – 11.41) 19/222
8.6%
(5.55 – 12.98) 31/290
10.7%
(7.63 – 14.77) 18/248
7.3%
(4.64 – 11.18) 32/294
10.9%
(7.81 – 14.96)
Brother or Sister 11/1054 1.1%
(0.58 – 1.85) 2/222
0.9%
(0.25 – 3.22) 5/290
1.7%
(7.4 – 3.97) 4/248
1.6%
(0.63 – 4.07) 0 0%
Grand parent 16/1054 1.5%
(0.94 – 2.45) 5/222
2.3%
(0.96 – 5.16) 3/290
1.0%
(2.7 – 2.99) 4/248
1.6%
(0.63 – 4.07) 4/294
1.4%
(0.53 – 3.68)
Proportion of HH by status of children U18
At School 439/1055 41.6%
(38.67–44.61) 67/222
30.2%
(24.52–36.51) 93/290
32.1%
(26.96 – 37.65) 137/249
55.0%
(48.81 – 61.08) 142/294
48.3%
(42.65–54.0)
With Disability 59/1055 5.6%
(4.36 – 7.14) 21/222
9.5%
(6.27 – 14.03) 16/290
5.5%
(3.43 – 8.78) 12/249
4.8%
(2.78 – 8.23) 10/294
3.4%
(1.86 – 6.15)
Orphan 50/1055 4.7%
(3.61 – 6.25) 13/222
5.9%
(3.46 – 9.76) 23/290
7.9%
(5.34 – 11.62) 7/249
2.8%
(1.37 – 5.69) 7/294
2.4%
(1.16 – 4.83)
On the street 9/1055 0.9%
(0.45 – 1.67) 4/222
1.8%
(0.7 – 4.54) 2/290
0.7%
(0.19 – 2.48) 1/249
0.4%
(0.07 – 2.24) 2/294
0.7%
(0.19 – 2.45)

27
Introduction
This report presents the outcomes of a four independent strata nutrition assessment
conducted in Lebanon to assess the overall nutrition situation of Syrian refugees in Lebanon
and it presents presenting the specific nutrition situation in each stratum. Because of the
high number of Syrian refugees in Lebanon (more than 600,000, UNHCR database, July
2013), for this second Nutrition Assessment (in which the first nutrition assessment was
conducted in September 2012), a stratified, two-stage cluster survey based on the SMART
methodology (in conformity with a UNHCR SENS methodology) was used. Since the Syrian
refugees reside in different regions of Lebanon, the UN geographical division of the country
in 4 strata or 4 independent samples, was used. The 4 strata were: Beirut and Mount
Lebanon; Bekaa; North of Lebanon and South of Lebanon; and in stratum or region, we
developed one independent sample for Syrian refugees.
The assessment was commissioned by UN agencies (UNICEF, UNHCR, WHO and WFP),
led by UNICEF, in collaboration with MOPH and IOCC. The data collection for the
assessment was conducted from October 2nd until November 30th 2013. At the time of writing
this report (January 2014), the UNHCR database indicated that the number of Syrian
refugees in Lebanon was 890,136 (841,942 registered and 48,194 Syrians in Lebanon
awaiting registration).
The nutrition survey assessed the nutrition situation of the Syrian refugees residing in
Lebanon. It is a nutrition assessment among Syrian refugees who lived in the Bekaa, North,
South and Beirut & Mount-Lebanon regions.
This report is divided into the following sections:
Executive summary: This section includes a brief summary of the methodology, main
results and recommendations.
Background and Rationale: In this section the background information related to
Syrian situation and justification of survey is presented.
Methodology: This section explains the methodology (in conformity with a UNHCR
SENS methodology) used in this assessment; a standardized protocol of the
methodology was used in the different regions.
Results: The results are reported in combined sections.
The discussion: The discussion highlights similarities and differences between the
Syrian refugees in different regions, the implications of the results on the larger
humanitarian situation and the relationships identified (or that emerged) between
various factors.
Recommendations: This section presents the recommendations regarding the overall
humanitarian action needed targeting the Syrian refugees in Lebanon. It also presents,

28
when relevant, the specific needed humanitarian action of the Syrian refugees
specified by region of residence.
I. Background and rationale
The basic indicators used to assess the severity of a crisis are mortality or death rate and
the nutritional status of the population. An estimation of these two measures is reached
through conducting an assessment study of the affected population.
To know the magnitude of the problem is important to know the affected population size and,
if applicable, the demographic characteristics of the population. A high proportion of
malnourished cases in a small population size are normally of less magnitude than a lower
proportion of malnourished cases in a large population size. The scale and type of
intervention depends on the magnitude of the emergency rather than simply on the
prevalence of malnutrition.
Since the beginning of the Syrian crisis in early 2011, the number of Syrians crossing the
border into Lebanon has been gradually increasing. In Lebanon, joint registration of refugees
by the Lebanese Government and UNHCR is ongoing. Many of these refugees might be in
a precarious situation, with little or no financial resources to rely on.
The majority of the refugees are women and children, since many men/head of households
could not leave Syria. Displaced dependents in Lebanon are therefore socially and
economically vulnerable and have a myriad of needs. Most Syrians fled their homes and
villages due to fighting in these areas. They have been deeply affected by the loss of their
homes, neighborhoods and many have lost loved ones. Over 75% of those who are being
assisted are woman and children. At the early stage of the crisis, many lived with hosting
families who themselves struggle to meet their ends; however, recent data shows that
refugees are now living on their own. Among the most pressing needs are food, basic non-
food items, shelter, medical care and psychosocial support.
The 2012 Syrian refugee nutrition assessment results and recommendations led some
nutrition activities to take place:
1. Health staff were trained to monitor or treat malnutrition cases.
2. Health centers were equipped (anthropometric material) to monitor or treat malnutrition
cases.
3. Malnutrition screening was set-up by some NGOs and the children identified with acute
malnutrition were referred for treatment.
29
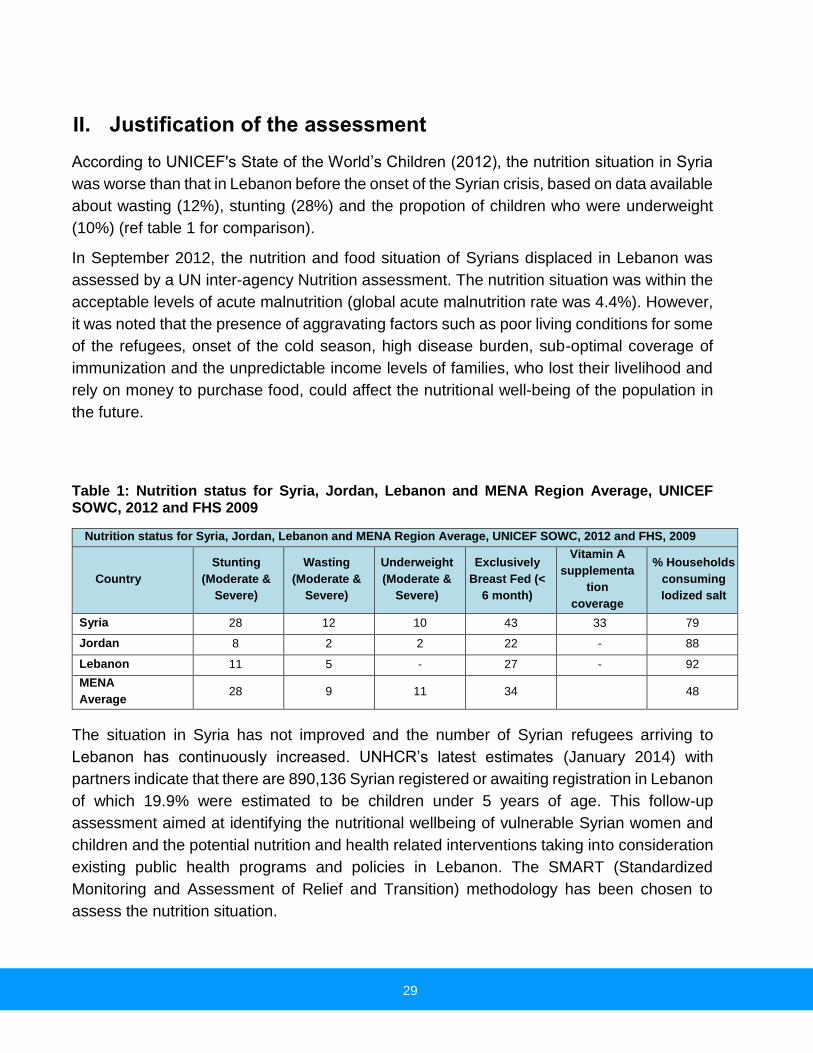
II. Justification of the assessment
According to UNICEF's State of the World’s Children (2012), the nutrition situation in Syria
was worse than that in Lebanon before the onset of the Syrian crisis, based on data available
about wasting (12%), stunting (28%) and the propotion of children who were underweight
(10%) (ref table 1 for comparison).
In September 2012, the nutrition and food situation of Syrians displaced in Lebanon was
assessed by a UN inter-agency Nutrition assessment. The nutrition situation was within the
acceptable levels of acute malnutrition (global acute malnutrition rate was 4.4%). However,
it was noted that the presence of aggravating factors such as poor living conditions for some
of the refugees, onset of the cold season, high disease burden, sub-optimal coverage of
immunization and the unpredictable income levels of families, who lost their livelihood and
rely on money to purchase food, could affect the nutritional well-being of the population in
the future.
Table 1: Nutrition status for Syria, Jordan, Lebanon and MENA Region Average, UNICEF SOWC, 2012 and FHS 2009
The situation in Syria has not improved and the number of Syrian refugees arriving to
Lebanon has continuously increased. UNHCR’s latest estimates (January 2014) with
partners indicate that there are 890,136 Syrian registered or awaiting registration in Lebanon
of which 19.9% were estimated to be children under 5 years of age. This follow-up
assessment aimed at identifying the nutritional wellbeing of vulnerable Syrian women and
children and the potential nutrition and health related interventions taking into consideration
existing public health programs and policies in Lebanon. The SMART (Standardized
Monitoring and Assessment of Relief and Transition) methodology has been chosen to
assess the nutrition situation.
Nutrition status for Syria, Jordan, Lebanon and MENA Region Average, UNICEF SOWC, 2012 and FHS, 2009
Country
Stunting
(Moderate &
Severe)
Wasting
(Moderate &
Severe)
Underweight
(Moderate &
Severe)
Exclusively
Breast Fed (<
6 month)
Vitamin A
supplementa
tion
coverage
% Households
consuming
Iodized salt
Syria 28 12 10 43 33 79
Jordan 8 2 2 22 - 88
Lebanon 11 5 - 27 - 92
MENA
Average 28 9 11 34 48

30
Since the majority of Syrian refugees reside in the areas where the most vulnerable
Lebanese families live (see figure 1), it was suggested to conduct an assessment of the
nutrition situation of Lebanese families who live in the same localities. For this reason, both
of these populations were initially targeted in this assessment.
Also, as there is no database about iron deficiency or anaemia levels of children under the
age of 5 and women of reproductive age (WRA) among the Syrian refugees in Lebanon, the
UN agencies and their partners decided to measure the prevalence of anaemia in children
aged 6-59 months and in women of reproductive age for surveillance purposes and to create
a baseline of the iron deficiency situation.
Figure 1: Localization of Syrian refugees in Lebanon
III. Task force committee
The Joint Nutrition Assessment was planned to assess the nutrition situation of both Syrian
refugees and Lebanese host community in the areas where the Syrian refugees live, by
using SMART (Standardized Monitoring and Assessment of Relief and Transition)
methodology. SMART has more requirements than other methodologies but can provide
more reliable and accurate information/results easily and rapidly for decision makers.
To help and advise on the coordination of the nutrition assessment through all the stages of
the assessment, a task force was established in the early planning phase of the assessment.
The duties of the members of the Task Force were to:
1. Review and validate the TOR of the nutrition assessment;

31
2. Review and validate the methodology and all the tools suggested for the Nutrition
Assessment;
3. Advise the assessment coordination team on the feasibility of different activities
planned and ensure smooth implementation;
4. Help the assessment coordination to resolve any difficulties that emerged during the
assessment;
5. Review and validate the data and results of the Nutrition Assessment.
6. Review and validate the report and recommendations of the Nutrition Assessment.
The members of the task force have a good technical background and/or a good knowledge
of the Lebanese and assessment context. They helped in the realization of the nutrition
assessment by advising on the coordination process of the assessment and by supporting
the preparatory and logistical aspects of the assessment.
The task force committee members are representatives from UN agencies (UNICEF, WFP,
WHO and UNHCR) in Lebanon, the Ministry of Public Health (MOPH) and an NGO partner.
IV. Scope of the assessment
The nutrition assessment aimed to examine the nutritional status of both Syrian refugees
and Lebanese host community in the areas where the Syrian refugees live. Children under
the age of five, as well as women of reproductive age were assessed for malnutrition.
Women and children were also tested for anaemia. Any cases of anaemia or malnutrition
identified during the assessment were referred to the MOPH primary health care structures
for treatment. Moreover, the IYCF practices among children 0-23 months were investigated
and the level of access to health services, access to and use of potable water, sanitation
and hygiene facilities was also assessed. The food security situation among the Syrian
refugees in Lebanon was assessed in the VASyr study conducted by WFP three months
before the data collection of this assessment (May-June 2013). This nutrition assessment
was initially planned to assess the food security only of Lebanese host community families
who live in the areas where Syrian refugees also resided.
Initially, the Joint Nutrition Assessment was planned to assess the overall nutrition status of
both Syrian refugees and Lebanese host community concurrently in the areas where the
Syrian refugees live. However, at the end of the surveyor’s preparation phase (selection and
training) and the completion of the sampling process for Syrian refugees’ assessment, the
process to build the sample frame for Lebanese host communities was still pending due to
some political concerns. Thus, after a delay to start the field work for the Nutrition
Assessment, it was decided to do the data collection for Syrian refugees (in all Lebanon)
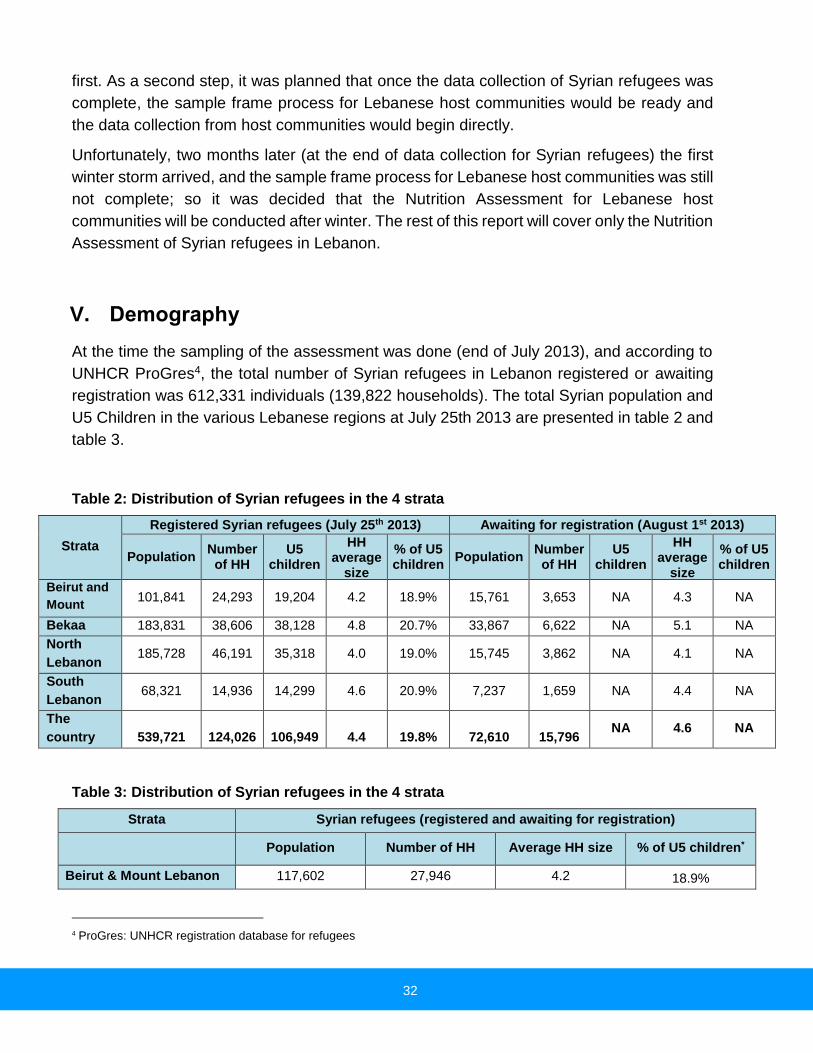
32
first. As a second step, it was planned that once the data collection of Syrian refugees was
complete, the sample frame process for Lebanese host communities would be ready and
the data collection from host communities would begin directly.
Unfortunately, two months later (at the end of data collection for Syrian refugees) the first
winter storm arrived, and the sample frame process for Lebanese host communities was still
not complete; so it was decided that the Nutrition Assessment for Lebanese host
communities will be conducted after winter. The rest of this report will cover only the Nutrition
Assessment of Syrian refugees in Lebanon.
V. Demography
At the time the sampling of the assessment was done (end of July 2013), and according to
UNHCR ProGres4, the total number of Syrian refugees in Lebanon registered or awaiting
registration was 612,331 individuals (139,822 households). The total Syrian population and
U5 Children in the various Lebanese regions at July 25th 2013 are presented in table 2 and
table 3.
Table 2: Distribution of Syrian refugees in the 4 strata
Strata
Registered Syrian refugees (July 25th 2013) Awaiting for registration (August 1st 2013)
Population Number of HH
U5 children
HH average
size
% of U5 children
Population Number of HH
U5 children
HH average
size
% of U5 children
Beirut and
Mount
Lebanon
101,841 24,293 19,204 4.2 18.9% 15,761 3,653 NA 4.3 NA
Bekaa 183,831 38,606 38,128 4.8 20.7% 33,867 6,622 NA 5.1 NA
North
Lebanon 185,728 46,191 35,318 4.0 19.0% 15,745 3,862 NA 4.1 NA
South
Lebanon 68,321 14,936 14,299 4.6 20.9% 7,237 1,659 NA 4.4 NA
The
country 539,721 124,026 106,949 4.4 19.8% 72,610 15,796 NA 4.6 NA
Table 3: Distribution of Syrian refugees in the 4 strata
Strata Syrian refugees (registered and awaiting for registration)
Population Number of HH Average HH size % of U5 children*
Beirut & Mount Lebanon 117,602 27,946 4.2 18.9%
4 ProGres: UNHCR registration database for refugees

33
Bekaa 217,698 45,228 4.8 20.7%
North of Lebanon 201,473 50,053 4.0 19.0%
South of Lebanon 75,558 16,595 4.6 20.9%
The country 612,331 139,822 4.4 19.8%
* As the number of children under 5 is not available for awaiting Syrian refugees for registration, the % of U5 children among awaiting Syrian refugees
families can’t be calculated. Because of that, the % of U5 children among registered Syrian refugees’ families will be used as a proxy.
VI. Objectives
The nutrition assessment aimed to assess the general nutrition status of Syrian refugees,
identify some of the factors likely to undermine the nutrition status and to fill the information
gap on the nutritional well-being of the vulnerable Syrian women and children in order to
formulate workable recommendations for appropriate nutritional and public health
interventions, if (or in case) the need for response to mitigate deterioration, is identified.
Specific objectives for the assessment are:
1. To estimate the prevalence of acute malnutrition, stunting (chronic malnutrition),
underweight and overweight of children aged 6-59 months in Lebanon.
2. To estimate the acute malnutrition levels for women of reproductive age in Lebanon
based on MUAC measurement.
3. To assess the two-week period prevalence of diarrhea, cough and fever among
children 6-59 months.
4. To measure the prevalence of anaemia among children aged 6-59 months and women
of reproductive age (non-pregnant), 15-49 years.
5. To determine the coverage of measles and polio vaccination among children 9-59
months.
6. To determine the coverage of vitamin A supplementation in the last six months among
children 6-59 months and postnatal women.
7. To investigate IYCF practices among children 0-23 months.
8. To determine the refugee population’s access to and use of improved water, sanitation
and hygiene facilities.
9. To identify and document the underlying factors likely to influence the nutritional well-
being of the Syrian population in Lebanon.

34
VII. Methodology
1. Study Population
The study population was the vulnerable Syrian women and children in Lebanon (registered or
awaiting registration with UNHCR). Establishing the up-to-date Syrian population size and their
current location as well as village-level Lebanese population details is a pre-requisite for sound
sampling procedures application. This includes details of satellite villages/ settlements surrounding
Bekaa Valley, Beirut and Mount Lebanon and North and South regions of the country. A detailed list
of the locations and the population size was prepared, from which the sampling frame/ sampling
universe was formed and used in the random selection of households; then the children and the
mothers were enrolled in the assessment.
Based on the established study population and the estimated acute malnutrition prevalence
(percentage for the case of Syrian refugees of 4.4% (GAM from 2012 Survey), the sample size for
Syrian refugees in Lebanon was determined by using the Emergency Nutrition Assessment (ENA)
for SMART software.
Because of the high number of Syrian refugees in Lebanon (more than 600,000, UNHCR database,
July 2013), a stratified, two-stage cluster survey based on the SMART methodology was used for
this second Nutrition Assessment. As the Syrian refugees reside in different regions of Lebanon, the
UN geographical division of the country, which is 4 strata or 4 independent samples, was used. The
4 strata were: Beirut and Mount Lebanon; Bekaa; North of Lebanon and South of Lebanon. In each
stratum or region, one independent sample for Syrian refugees was selected. The results in this
report are presented per stratum and the 4 strata were combined to give one overall figure for all
Syrian refugees in Lebanon.
An independent representative sample of Syrian refugee children from 0 to 59 months of age and
women from 15 to 49 years old were surveyed.
In each stratum for Syrian refugees, an independent representative sample of Syrian refugee
children from 0 to 59 months of age and women from 15 to 49 years old were randomly selected.
The sample size ranged between 300 and 600 households for each stratum, depending on the
parameters5 used in the calculation.
For this assessment, the sampling unit used was the household. The definition of household as used
in this study is: a group of people who live together and routinely eat out from the same pot. In some
cases, the survey teams combined 2 or more families, registered by UNHCR, in the same HH.
2. Some definitions
5 Parameters include estimated acute malnutrition rate, desired precision, design effect, average household size, % of U5 and
% non-response.

35
Household (HH): a household is a group of people who live together and routinely eat out from the
same pot.
Residence: is the group of people living under the same roof. Therefore, several households can be
found in the same residence.
Head of household or of the family: a member of the family (usually a man or another adult) who
manages the family resources and is the final decision maker in the house.
Respondent: is the person who takes care of the child (usually the mother or other woman) and will
be able to answer the questions of the assessment.
3. Sampling and Sample Size Determination
Cluster sampling was the most appropriate sampling methodology for this situation and the
HH was the sample unit.
A two stage Cluster sampling used is described in the next sections.
3.1 Sample size determination
The different sample sizes were calculated using Standardized Monitoring and
Assessment of Relief and Transitions (ENA for SMART6) software7, in conformity with a
UNHCR SENS methodology. The established study population and the estimated acute
malnutrition prevalence was used (the percentage of GAM observed in 2012 Syrian
refugees survey in Lebanon (4.4%) was used).
SMART methodology recommends using the fixed number of households method rather
than the fixed number of children method. The main reasons are:
It is more logical to have a fixed number of households as a target to reach in each cluster.
In other words, since it is only possible to estimate the approximate number of eligible
children per household prior to data collection (which might not reflect the actual number
found in selected houses), it will be impossible to know in advance the number of HH to
select that will contain the exact number of children. The ENA software for SMART first
calculates the number of children to be surveyed and then converts the sample size from
number of children into number of households to be surveyed. So, the target of the survey
is not the number of children.
Inclusion of HH with no children: When survey teams have a target number of children to
reach, they may have a tendency to skip households that do not have children. This
number of children is only an estimate of the approximate number of eligible children per
6 SMART : Standardized Monitoring and Assessment of Relief and Transitions
7 Emergency Nutrition Assessment. Le logiciel ENA (Delta version) pour SMART peut-être téléchargé sur
http://www.nutrisurvey.net/ena/ena.html

36
household prior to data collection and it will be wrong for other indicators collected during
the same survey (such as WASH, food security.) – it need to be measured at the
household level. Measuring these indicators only in households with young children and
excluding all other households will create a serious bias.
The total population to be surveyed was derived from ProGres database. A non-response
rate of 10% was used in all sample size calculations. Systematic random sampling
methodology was used at the second stage to identify households within the cluster.
A. Syrian refugees Samples
For different Syrian refugees’ strata, to determine the sample for each stratum, we need the
following parameters (cf. Table 4.1-1).
Table 4.1-1: Parameters needed for sample size determination
Syri
an
Refu
ge
es N
utr
itio
n A
sse
ssm
en
t, L
eb
an
on
Parameters/Indicators
Rate/Number
Syrian Refugees in Lebanon
Beirut & Mount Lebanon
Bekaa North Lebanon South Lebanon
Population Size in each stratum 117,602 217,698 201,473 75,558
Number of Households or families 27,946 45,228 50,053 16,595
Estimated Prevalence of Global Acute
Malnutrition 4.4% (2012 Syrian refugees GAM rate)
Desired Precision 3.5%
Design Effect (DEF) 1.44 (2012 Survey DEF)
Average HH size (calculated from
UNHCR data base) 4.2 4.8 4.0 4.6
% Children under 5 18.9 20.7 19.0 20.9
% Non-Response HH 10%
Children Sample Size 207 207 207 207
Households Sample Size 322 257 336 266
Number of HH by Cluster 10 10 10 10
Number of Cluster in the sample 33 26 34 27
The Syrian refugee sample sizes for different components of the Assessment are presented
in the table 3.1-2.

37
Table 4.1-2: Household sample size and sampling-cluster
Assessment
component
Sampling (based on
SMART and the UNHCR
SENS methodology)
Sample size/Number of Clusters
Beirut and
Mount Lebanon
Bekaa North of
Lebanon
South of
Lebanon
Anthropometry,
Health, IYCF
and WASH
All eligible children within
all of the sampled HH will
be assessed for
anthropometry, health and
WASH indicators.
322 HH
33
clusters
of 10
HH
257 HH
26
clusters
of 10
HH
336 HH
34
clusters
of 10
HH
266 HH
27
clusters
of 10
HH
Children and
women
Anaemia
Half of the selected HH
(sub-sample) should be
randomly assessed for
anaemia and all eligible
children found in these HH
should be assessed for
anaemia indicators.
161 HH
33
clusters
of 5 HH
129 HH
26
clusters
of 5 HH
168 HH
34
clusters
of 5 HH
133 HH
27
clusters
of 5 HH
3.2 First stage of cluster sampling methodology
The first stage of sampling consists of choosing randomly the number of clusters in each
stratum for Syrian refugees, which is usually derived from census data or projected
population data. The census data base is usually provided by the central statistics office of
the country. However, in this case, the census data base was not appropriate because Syrian
refugees are not the primary population and are not homogenously distributed.
Instead, we used as the sample frame, the database (list of registered Syrian refugees and
list of awaiting for registration) from UNHCR. The current list of Syrian refugees obtained
from UNHCR tallied individuals by districts, sub-districts, cities, neighborhoods, ‘mohafaza’,
‘qada’, and village. The ultimate assessment subjects were households’ members, primarily
children under five, and women of reproductive age. In each stratum, after excluding all
non-accessible areas for insecurity issue, we selected randomly the different clusters
(localities, district or sub-districts, ‘mohafaza’, ‘qada’, and village).
The first stage of sampling permitted us to have randomly the number of clusters needed for
each stratum. However, we also needed to select 10 households randomly (as requested by
Cluster sampling methodology), for each cluster.
3.3 Second stage of cluster sampling methodology
During the second stage of cluster sampling, in each stratum and for each geographical unit
(locality, district or sub-district, ‘mohafaza’, ‘qada’ or village) chosen as a cluster, similar to
last year’s assessment, we used the best database available about registered and awaiting

38
for registration Syrian refugees – the most complete UNHCR lists (with name of head of
family and phone number provided) – to choose randomly 10 households per cluster.
After choosing households for the different clusters, volunteers from NGO partner and
different team leaders (in the field) verified the household’s address prior to the date of data
collection, through phone calls. During the actual date of data collection, the volunteers of
NGO partner or the community guides helped the teams to find the Households. The sample
assessed is presented in Annex 1.
4. Questionnaire
The questionnaire is presented in Annexes 2-3. It was originally prepared in English language
and then it was translated and administered in Arabic language. The questionnaire was pre-
tested before the assessment.
All information regarding nutrition assessment of children aged between 0 and 59 months
and women in childbearing age (15 – 49 years) at a household level was gathered using a
validated interview questionnaire. Four modules were designed to provide information on the
relevant indicators of the different target groups as indicated in the assessment objectives.
The four module questionnaire covers the following areas and the following measurements:
Module 1: A Household consent form – This module permitted the team leader to explain to
the head of household clearly the purpose of the assessment, the assessment procedures,
the confidentiality of data collected and anonymity and that the information were used only
for this Nutrition Assessment. It permitted the team leader, to explain clearly the right to refuse
to participate, or to not answer any question and to stop at anytime. This module also
permitted to collect the data about the HH characteristics and the data about WASH.
Module 2: Women in reproductive age (15 to 49 years old) - This module included questions
and measures for women aged 15 – 49 years. Information was collected on women’s
physiological status (pregnancy and lactation statuses), intake of iron-folic acid pills and ANC
attendance for pregnant women, post-natal vitamin A supplementation, haemoglobin
assessment (for non pregnant women) and MUAC measurement.
Module 3: Children 6-59 months - This module included questions and measures on children
aged 6-59 months. Information was collected on sex, age, anthropometric status (weight,
height, oedema, MUAC) immunization (measles), vitamin A supplementation in last six
months, morbidity from diarrhoea, cough and fever in past two weeks and haemoglobin
assessment.
Module 4: IYCF practices of infants 0-23 months - This module included questions on infant
feeding for children aged 0- 23 months, in conformity with UNHCR SENS methodology
recommendations.

39
The Arabic questionnaire is presented in annex 2 and the English version is presented in
annex 3.
5. Measurement methods
a) Household-level indicators
WASH: The VASyr study, conducted by WFP, 3 months before the data collection of this
assessment (May-June 2013), also had a WASH section. However, the UNICEF WASH team
suggested a more complete module. The questions about WASH were a combination
between the questions suggested by UNICEF WASH team and some adapted questions
from the ones recommended by UNHCR’s newly developed Standardized Expanded
Nutrition Survey Guidelines for Refugee Populations and which were validated by UNICEF
and UNHCR WASH officers.
Health: The questionnaire on health was validated by WHO and UNHCR Lebanon.
b) Individual-level indicators
Sex of children: Gender was recorded as either male or female.
Age in months for children 0-59 months: In Syria, a lot of births are registered up to 6
months after the exact date of birth, and parents usually provide a later date of birth than the
actual one. So in this study, the child’s age was estimated in months using the “Events
Calendar”, which was developed during the assessment planning phase (annex 4). The age
was recorded in months on the questionnaire sheet. In the cases were the child’s age was
absolutely impossible to determine through the use of local events calendar or by probing,
then the child’s length/height were used to determine inclusion; the child had to measure
between 65 cm and 110 cm to be included.
Age of women 15-49 years: Reported age was recorded in years.
Weight of children 6-59 months: Measurements were taken to the closest 100 grams using
an electronic scale (SECA scale) with a wooden board placed under the scale, to stabilize
when taking measurements. In the Syrian cultural context, most children were weighed with
clothes. Hence, the mean weight of 100 grams (for clothes – an estimation of the average of
clothes weight was made during the Pilot test) was taken into consideration during data
analysis. Ideally, clothes were removed and only very light underwear will be allowed;
however, if this was a problem, then teams were instructed to take weight inside of the
surveyed house. The double-weighing technique was used to weigh young children (usually
under the age of 2), who were unable to stand on their own or unable to understand
instructions such as not to move while on the scale.

40
Height/length of children 6-59 months: Children’s height or length was taken to the closest
millimeter using a wooden height board. Height was used to decide on whether a child should
be measured lying down (length) or standing up (height). Children less than 87cm (who in
most cases where under the age of 2 years) were measured lying down (length), while those
greater than or equal to 87cm were measured standing up (height). However, for children
taller than 87 cm who could not stand, length was taken and then later adjusted by deducting
0.7cm from the recorded reading.
Oedema in children 6-59 months: bilateral oedema was assessed by applying gentle
thumb pressure on to the top of both feet of the child for a period of three seconds and
thereafter observing for the presence or absence of an indent. All oedema cases reported by
the assessment teams were verified by the assessment coordinators/supervisors and then
were immediately referred to primary health care center.
MUAC of children 6-59 months and women 15-49 years: MUAC was measured at the
mid-point of the left upper arm between the elbow and the shoulder and taken to the closest
millimeter using a standard tape. MUAC was recorded in centimeters for women of
reproductive age.
Measles and Polio vaccination in children 6-59 months: vaccination was assessed by
checking for vaccine records on the EPI card if available or by asking the mother or the
caregiver to recall if no EPI card was available. For measles and for ease of data collection,
all children aged 6-59 months were assessed but analysis was only done on children aged
9-59 months.
Measles vaccination coverage: UNHCR recommends target coverage of 95% (same as
Sphere Standards).
Vitamin A supplementation in last 6 months in children 6-59 months: to check if the
child received a vitamin A capsule over the past six months in case it was recorded onthe
EPI card or health card if available; if no card was available, the mother or the caregiver was
asked to recall. A vitamin A capsule image was shown to the caregiver to aid her/him when
asked to recall.
Vitamin A supplementation coverage in children: UNHCR Strategic Plan for Nutrition and
Food Security (2008-2012) states that the target for vitamin A supplementation coverage for
children aged 6-59 months in camp, country and region should be > 90%.
Haemoglobin concentration in children 6-59 months and women 15-49 years:
Haemoglobin concentration was measured from a capillary blood sample taken from the
fingertip and recorded to the closest gram per deciliter by using the portable HemoCue Hb
301 Analyzer (HemoCue, Sweden). If severe anaemia was detected, the child or the woman
was referred for treatment immediately.

41
Anaemia data: UNHCR Strategic Plan for Nutrition and Food Security (2008-2012) states
that the targets for the prevalence of anaemia in children 6-59 months of age and in women
15-49 years of age should be low i.e. < 20%. The severity of the public health situation should
be classified according to WHO criteria.
Diarrhea in last 2 weeks in children 0-59 months: Mothers or caregivers were asked if
their child had suffered from diarrhoea in the past two weeks and were asked about the
duration (number of days) of the diarrhoea occurrence. Diarrhoea: Presence of three or more
loose or watery stools in a 24-hour period was as used as the operational definition.
Cough in last 2 weeks in children 0-59 months: Mothers or caregivers were asked if their
child had suffered from a cough in the past two weeks.
Fever in last 2 weeks in children 0-59 months: Mothers or caregivers were asked if their
child had suffered from fever in the past two weeks.
ANC enrolment and iron and folic acid pills coverage: if the surveyed woman was
pregnant, it was assessed whether she was enrolled in the ANC program and if she was
receiving iron-folic acid pills. An iron-folic acid pill image was shown to the pregnant woman
when asked to recall.
Post-natal vitamin A supplementation: if the surveyed woman delivered a baby in the last
six months, it was assessed by card or recall whether she received vitamin A
supplementation after delivery or not. A vitamin A capsule image was shown to her when
asked to recall.
Infant and young child feeding practices in children 0-24 months: Infant and young child
feeding practices were assessed based on UNHCR SENS methodology recommendations.
Referrals: In collaboration of MOPH and IOCC, Children aged 6-59 months were referred to
health center for treatment when index weight/height indicated yellow or red (< - 2 SD), when
MUAC was < 12.5 cm, when oedema was present, or when haemoglobin was < 7.0 g/dl.
Women of reproductive age were referred to the hospital for treatment when haemoglobin
was < 8.0 g/dl.
6. Different definitions and calculations
A. Malnutrition in children 6-59 months
Acute malnutrition is defined using weight-for-height index values or the presence of
oedema and classified as shown in Table 5. Main results were reported after analysis using
the WHO 2006 Growth Standards. Results using the NCHS 1977 Growth Reference were
reported in an Annex 5.
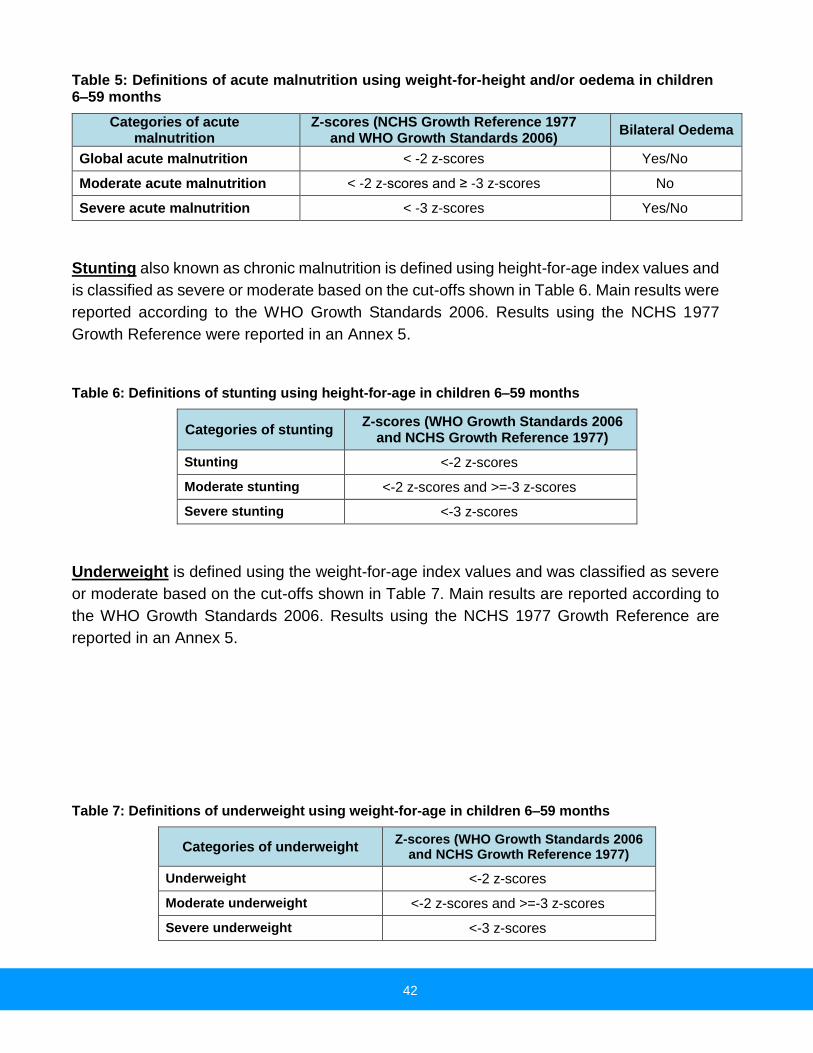
42
Table 5: Definitions of acute malnutrition using weight-for-height and/or oedema in children 6–59 months
Categories of acute malnutrition
Z-scores (NCHS Growth Reference 1977 and WHO Growth Standards 2006)
Bilateral Oedema
Global acute malnutrition < -2 z-scores Yes/No
Moderate acute malnutrition < -2 z-scores and ≥ -3 z-scores No
Severe acute malnutrition < -3 z-scores Yes/No
Stunting also known as chronic malnutrition is defined using height-for-age index values and
is classified as severe or moderate based on the cut-offs shown in Table 6. Main results were
reported according to the WHO Growth Standards 2006. Results using the NCHS 1977
Growth Reference were reported in an Annex 5.
Table 6: Definitions of stunting using height-for-age in children 6–59 months
Categories of stunting Z-scores (WHO Growth Standards 2006
and NCHS Growth Reference 1977)
Stunting <-2 z-scores
Moderate stunting <-2 z-scores and >=-3 z-scores
Severe stunting <-3 z-scores
Underweight is defined using the weight-for-age index values and was classified as severe
or moderate based on the cut-offs shown in Table 7. Main results are reported according to
the WHO Growth Standards 2006. Results using the NCHS 1977 Growth Reference are
reported in an Annex 5.
Table 7: Definitions of underweight using weight-for-age in children 6–59 months
Categories of underweight Z-scores (WHO Growth Standards 2006
and NCHS Growth Reference 1977)
Underweight <-2 z-scores
Moderate underweight <-2 z-scores and >=-3 z-scores
Severe underweight <-3 z-scores

43
Mid Upper Arm Circumference (MUAC) values for children aged 6-59 months is used to
define malnutrition according to the cut-offs shown in Table 7. However, the official results
are those based on the weight for height indicator.
Table 7: Classification of acute malnutrition based on MUAC in children 6-59 months (WHO, 2000)
Categories of Malnutrition MUAC Reading
At risk of malnutrition ≥ 12.5 cm and <13.5 cm
Moderate malnutrition ≥ 11.5 cm and <12.5 cm
Severe malnutrition < 11.5 cm
B. Anaemia
This section is to give the background about anaemia, to introduce the HemoCue and
describe how it can be used to assess anaemia.
Background
Anaemia is a condition of low levels of the haemoglobin (Hb) concentration in the blood. This
results in reduced oxygen-carrying capacity and a reduced amount of oxygen being
transported in the body, and may lead to reduced aerobic activity in the body’s cells.
Iron is a main component of Hb and iron deficiency is estimated to be responsible for over
half of anaemia globally. Other causes of anaemia include malaria, hookworm and other
helminthes; other micronutrient deficiencies such as vitamin A, vitamin B12 or folic acid
deficiency; chronic infections; genetic conditions which vary by region (such as Sickle Cell
and Thalassemia here in the Middle East); HIV/AIDS; and high fertility.
Anaemia is a serious concern for pregnant women and children. It increases the risk of
maternal mortality and poor birth outcomes. For children, iron deficiency adversely affects
the cognitive performance, behaviour, and physical growth of infants. Moreover, iron
deficiency can affect the immune status and morbidity from infections of all age groups; and
the use of energy sources by muscles and thus the physical capacity and work performance
of adolescents and adults of all age groups. WHO considers iron deficiency or anaemia as a
public health problem when there is prevalence of low Haemoglobin concentration (< 11.0
g/dl) that exceeds 5.0% of the intended population. The situation needs immediate action
when the prevalence of anaemia exceeds 20%. The situation is considered a severe public
health problem when the prevalence of Haemoglobin concentration exceeds 40.0%
(WHO/UNICEF/UNU 2001. Iron Deficiency Anaemia: Assessment, prevention and control: A
guide for program managers).

44
Anaemia is classified according to the cut-offs below in children 6-59 months and non-
pregnant women of reproductive age. Anaemia cut-offs for pregnant women should be
adjusted depending on the stage of pregnancy (gestational age), thus it was not included as
part of this assessment.
Table 8: Classification of public health significance of Anaemia prevalence (WHO, 2001)
Prevalence % Severe Moderate Low Normal
Anaemia ≥ 40 20-39 5-19 < 5%
Information about the prevalence of anaemia can be useful for the development of health-
intervention programs designed to prevent anaemia, such as promoting consumption of iron-
rich foods, iron supplementation, home food fortification, malnutrition prevention and
treatment, and deworming programs as appropriate.
Haemoglobin is a commonly used, well validated, and widely accepted indicator for anaemia.
Mean Haemoglobin is one useful way to present this indicator. However, anaemia is also
commonly presented based on cutoffs. The following Haemoglobin cutoffs are used to
classify anaemia severity.
Table 9: Definition of anaemia (WHO, 2001)
Age/Sex groups Categories of Anaemia (Hb g/dL)
Non-Anaemic
Mild Moderate Severe
Children 6 - 59 months ≥ 11.0 10.0 - 10.9 7.0 – 9.9 < 7.0
Non-pregnant adult females 15-49
years
≥ 12.0 11.0 - 11.9 8.0 - 10.9 < 8.0
Anaemia data measurement
Data on the prevalence of anaemia is essential to collect to establish a baseline and for future
monitoring purposes.
Because of sample size issues (usually a small number of pregnant women is found) as well
as the difficulties in assessing gestational age of pregnant women, UNHCR SENS
methodology suggest to collect anaemia data on children aged 6-59 months and non-
pregnant women of reproductive age (15-49 years). In this assessment data reflecting the
prevalence of anaemia among children aged 6-59 months and non-pregnant women of
reproductive age (15-49 years) was collected. Therefore, as is routine in emergency nutrition
surveys, pregnant women were not included in the anaemia measurements portion of the
assessment.

45
The anaemia data is presented by category of severity (mild, moderate, severe and total
anaemia) for children 6–59 months of age, children 6-23 months and 24-59 months as well
as for non-pregnant women 15-49 years of age. Mean Hb (g/dL) and (SD / 95% CI) as well
as the range are also presented.
To ensure a good quality of Hb data, a thorough training was provided to the surveyors.
Moreover, close supervision and checking of the quality of the equipment and
measurements, were conducted on a regular basis throughout the survey to ensure that the
anaemia data are reliable.
Standard methods for Hb measurements were followed when using HemoCue 301+, to
maintain the quality, reliability and usability of the results.
HemoCue is a portable, field-friendly machine used to measure Hb concentration in the
blood. Haemoglobin is the oxygen-carrying part of red blood cells. The amount of Hb in
blood is typically expressed in g/dL (grams of Hb per deciliter of blood). It is also sometimes
expressed in g/L (grams of Hb per liter of blood).
Because HemoCue use involves handling a blood sample, in a minimally invasive way, we
provided appropriate teaching and quality training, and tried when applicable to have among
the surveyors, one lab technician or nurse in each team.
Additional to Haemoglobin measured by HemoCue, other data was needed to assess the
anaemia situation, including age of children 6-59 months and women 15-49 years and
pregnancy status.
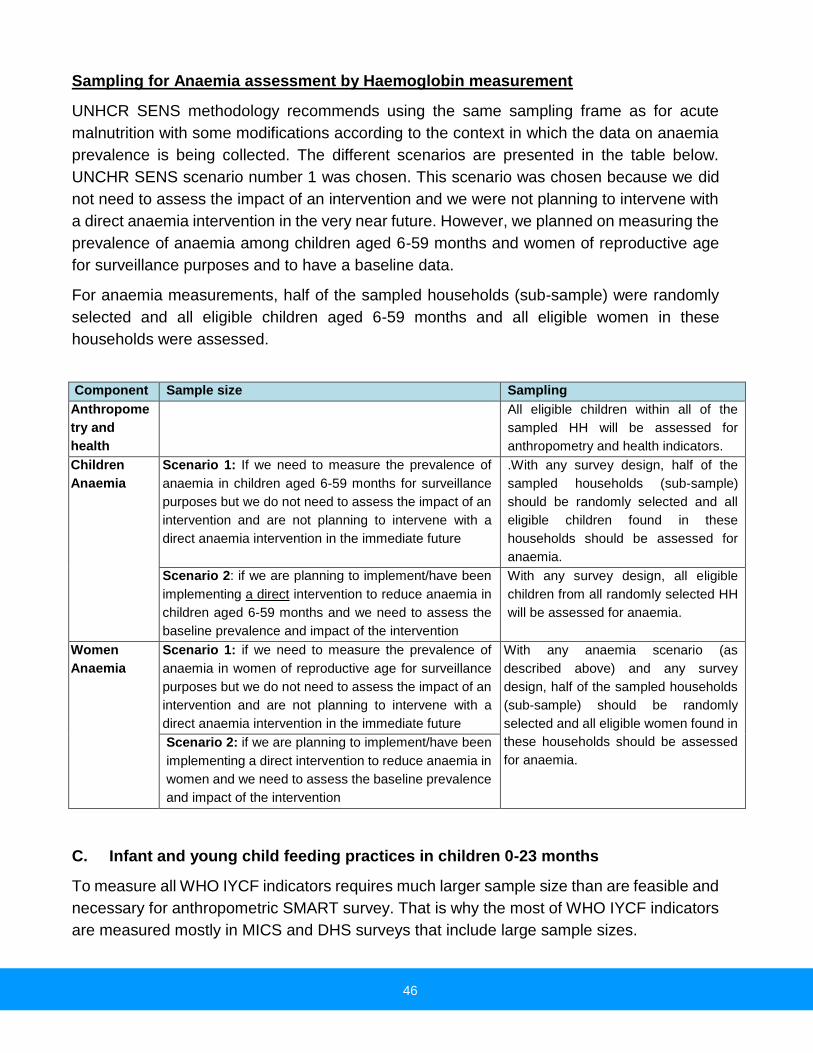
46
Sampling for Anaemia assessment by Haemoglobin measurement
UNHCR SENS methodology recommends using the same sampling frame as for acute
malnutrition with some modifications according to the context in which the data on anaemia
prevalence is being collected. The different scenarios are presented in the table below.
UNCHR SENS scenario number 1 was chosen. This scenario was chosen because we did
not need to assess the impact of an intervention and we were not planning to intervene with
a direct anaemia intervention in the very near future. However, we planned on measuring the
prevalence of anaemia among children aged 6-59 months and women of reproductive age
for surveillance purposes and to have a baseline data.
For anaemia measurements, half of the sampled households (sub-sample) were randomly
selected and all eligible children aged 6-59 months and all eligible women in these
households were assessed.
Component Sample size Sampling
Anthropome
try and
health
All eligible children within all of the
sampled HH will be assessed for
anthropometry and health indicators.
Children
Anaemia
Scenario 1: If we need to measure the prevalence of
anaemia in children aged 6-59 months for surveillance
purposes but we do not need to assess the impact of an
intervention and are not planning to intervene with a
direct anaemia intervention in the immediate future
.With any survey design, half of the
sampled households (sub-sample)
should be randomly selected and all
eligible children found in these
households should be assessed for
anaemia.
Scenario 2: if we are planning to implement/have been
implementing a direct intervention to reduce anaemia in
children aged 6-59 months and we need to assess the
baseline prevalence and impact of the intervention
With any survey design, all eligible
children from all randomly selected HH
will be assessed for anaemia.
Women
Anaemia
Scenario 1: if we need to measure the prevalence of
anaemia in women of reproductive age for surveillance
purposes but we do not need to assess the impact of an
intervention and are not planning to intervene with a
direct anaemia intervention in the immediate future
With any anaemia scenario (as
described above) and any survey
design, half of the sampled households
(sub-sample) should be randomly
selected and all eligible women found in
these households should be assessed
for anaemia.
Scenario 2: if we are planning to implement/have been
implementing a direct intervention to reduce anaemia in
women and we need to assess the baseline prevalence
and impact of the intervention
C. Infant and young child feeding practices in children 0-23 months
To measure all WHO IYCF indicators requires much larger sample size than are feasible and
necessary for anthropometric SMART survey. That is why the most of WHO IYCF indicators
are measured mostly in MICS and DHS surveys that include large sample sizes.

47
Since our sample size was not large enough to measure all the WHO IYCF indicators, we
followed the recommendations of UNHCR SENS survey guidelines and we included in this
assessment, only the IYCF indicators recommended by UNHCR SENS methodology. The
indicators that were included are: the timely initiation of breastfeeding (0-23 months), the
exclusive breastfeeding under 6 months (0-5 months), the continued breastfeeding at 1 year
(12-15 months); the continued breastfeeding at 2 years (20-23 months), the introduction of
solid, semi-solid or soft foods (6-8 months), the consumption of iron-rich or iron fortified foods
(6-23 months) and the bottle feeding (0-23 months).
The IYCF indicators, which were measured among children aged 0-23 months, were:
1) Timely initiation of breastfeeding in children aged 0-23 months:
Proportion of children 0-23 months that were put to the breast within one hour of birth.
Children 0-23 months who received breast milk within one hour of birth: Children 0-23 months
of age
2) Exclusive breastfeeding under 6 months:
Proportion of infants 0–5 months of age who are fed exclusively with breast milk: including
expressed breast milk or from a wet nurse, ORS, drops or syrups (vitamins, breastfeeding
minerals, medicines)
Infants 0–5 months of age who received only breast milk during the previous day: Infants 0–5
months of age
3) Continued breastfeeding at 1 year:
Proportion of children 12–15 months of age who are fed breast milk
Children 12–15 months of age who received breast milk during the previous day: Children 12–
15 months of age
4) Continued breastfeeding at 2 years:
Proportion of children 20–23 months of age who are fed breast milk
Children 20–23 months of age who received breast milk during the previous day: Children 20–
23 months of age
5) Introduction of solid, semi-solid or soft foods:
Proportion of infants 6–8 months of age who receive solid, semi-solid or soft foods
Infants 6–8 months of age who received solid, semi-solid or soft foods during the previous
day: Infants 6–8 months of age
6) Consumption of iron rich or iron fortified foods in children aged 6-23 months:
Proportion of children 6–23 months of age who receive an iron-rich or iron-fortified food that is
specially designed for infants and young children, or that is fortified in the home.
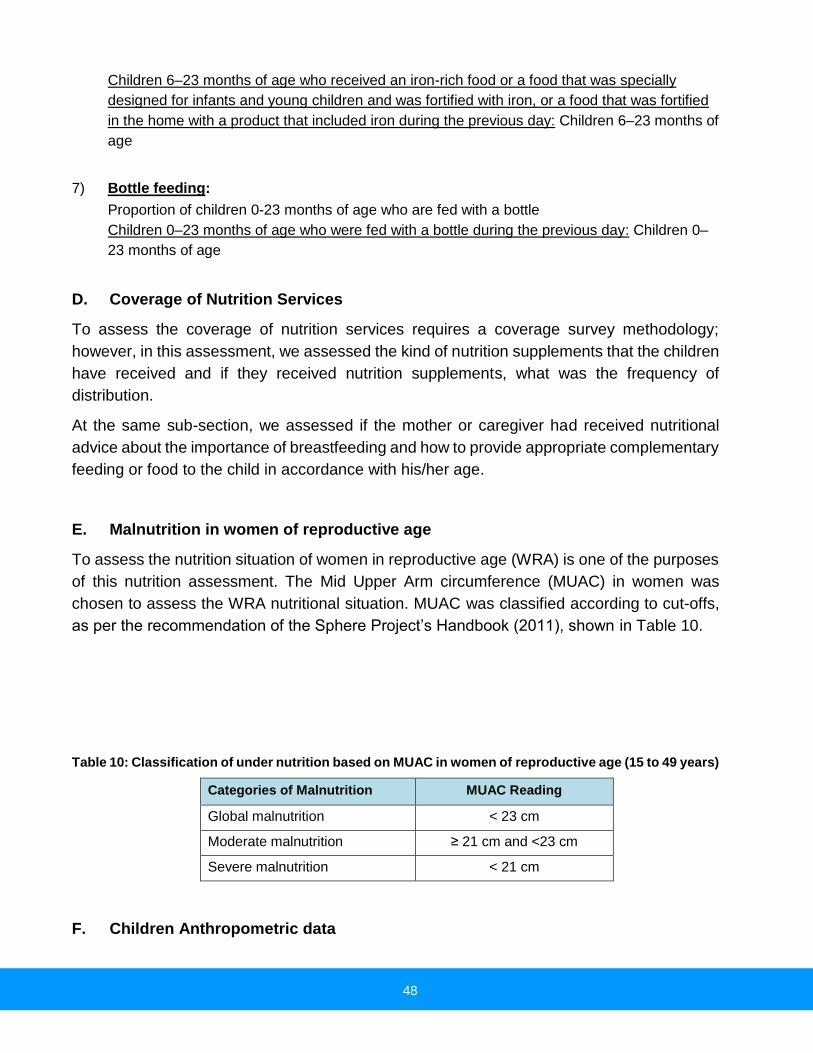
48
Children 6–23 months of age who received an iron-rich food or a food that was specially
designed for infants and young children and was fortified with iron, or a food that was fortified
in the home with a product that included iron during the previous day: Children 6–23 months of
age
7) Bottle feeding:
Proportion of children 0-23 months of age who are fed with a bottle
Children 0–23 months of age who were fed with a bottle during the previous day: Children 0–
23 months of age
D. Coverage of Nutrition Services
To assess the coverage of nutrition services requires a coverage survey methodology;
however, in this assessment, we assessed the kind of nutrition supplements that the children
have received and if they received nutrition supplements, what was the frequency of
distribution.
At the same sub-section, we assessed if the mother or caregiver had received nutritional
advice about the importance of breastfeeding and how to provide appropriate complementary
feeding or food to the child in accordance with his/her age.
E. Malnutrition in women of reproductive age
To assess the nutrition situation of women in reproductive age (WRA) is one of the purposes
of this nutrition assessment. The Mid Upper Arm circumference (MUAC) in women was
chosen to assess the WRA nutritional situation. MUAC was classified according to cut-offs,
as per the recommendation of the Sphere Project’s Handbook (2011), shown in Table 10.
Table 10: Classification of under nutrition based on MUAC in women of reproductive age (15 to 49 years)
Categories of Malnutrition MUAC Reading
Global malnutrition < 23 cm
Moderate malnutrition ≥ 21 cm and <23 cm
Severe malnutrition < 21 cm
F. Children Anthropometric data

49
UNHCR target for the prevalence of global acute malnutrition (GAM) for children 6-59 months
of age by camp, country and region should be < 10% and the target for the prevalence of
severe acute malnutrition (SAM) should be < 2%. Table 11 shows the classification of public
health significance of the anthropometric results for children under-5 years of age according
to WHO.
Table 11: Classification of public health significance for children under 5 years of age (WHO, 2000)
Prevalence % Critical Serious Poor Acceptable
Low weight-for-height ≥ 15 10-14 5-9 < 5
Low height-for-age ≥ 40 30-39 20-29 < 20
Low weight-for-age ≥ 30 20-29 10-19 < 10
7. Training and coordination
To support the realization of the nutrition assessment, UNICEF Lebanon hired IOCC
Lebanon a twopartite partnership agreement to support the nutrition consultant. IOCC
Lebanon conducted the preparatory work for the assessment (hiring the surveyors, preparing
and organizing the logistics for the training); hired the clerks for the complementary data entry
and managed the logistics during the data collection.
The design of assessments was conceptualized by a UNICEF nutrition consultant (Oumar
Hamza), with the technical support of the Nutrition Specialist in UNICEF MENA Regional
Office (James Kingori). The assessment was coordinated by UNICEF nutrition consultant
(Oumar Hamza) with support from UNICEF Lebanon Health, Nutrition and Emergency
specialist (Azzeddine Zeroual), with support of UNHCR Lebanon (Aye Aye Than) and with
support of IOCC Lebanon (Linda Shaker Berbari, Sabeen Abdulsater, Marya Al Nawakil and
Dima Ousta).
The training lasted seven days followed by two days to finalize the standardization test (and
to organize the different teams) and one day pre-test. Training was conducted to all
assessment team members (see annex 6): enumerators, team leaders and field supervisors.
The training took place from September 18th to 26th and the pre-test was on September
27th. The training focused on: the purpose and objectives of the assessment; roles and
responsibilities of each team member, familiarization with the questionnaires by reviewing
the purpose for each question; interviewing skills and recording of data; interpretation of
events calendar and age determination; how to take anthropometric measurements and
haemoglobin measurements and common errors; and a practical session on sampling
procedures. The practical session on anthropometric measurements involved volunteer
children for practice as well as a standardization test. The practical session on haemoglobin

50
measurements involved the trainees and trainers themselves as well as a standardization
test.
Most of the training was held in Arabic when possible and at the end of this training, the team
members were able to demonstrate good understanding and could follow the sampling
procedure; were able to take and record measurements correctly under field conditions; and
could administer the different modules of the questionnaire and some were able to use
HemoCue machine properly.
The assessment was undertaken by 9 teams. Each team was composed of three members
who speak Arabic; a team leader and two measurers. The daily supervision was conducted
by the UNICEF nutrition consultant in addition to two field supervisors. The team leaders
conducted the interview for all parts of the questionnaire. The rest of the team members took
the anthropometric measurements and assisted with sampling, age determination and
reading of health/vaccination cards or birth certificates. However, a tested or designated
surveyor (team leader or other member of the team) had the responsibility of taking the
haemoglobin measurements.
8. Pilot testing and revision of the assessment tools
Before beginning of the assessment, tools and methods were pre-tested and revised. A half
day pre-test exercise was conducted, that included all the process and data collection
methods. This activity helped to ensure that the team leaders understood the questions and
were able to follow the interview/data collection procedures as outlined in the assessment
protocol and during training. It also helped in having feedback about to what extent
interviewees understood questions. For the pre-test, each team selected five households,
administered the questionnaire and took the required measurements.
The second half of the day (afternoon) was used to review and discuss the findings of the
pre-test, logistic issues, questionnaires, and difficulties based on the pre-test assessment.
Based on this pre-test and discussions, the data collection tools and forms were reviewed
and finalized.
9. Data collection
Prior to the data collection phase, a sensitization session was done targeting community
leaders gathered from sites in the sampling frame/ universe. It included a presentation of the
assessment objectives and the role of the whole assessment team, roles expected from
leaders, as well as clarification about possible expectations among communities.
Data collection lasted six days from 2nd – 7th October 2013 in Bekaa, seven days from 8th
– 14th October 2013 in the North of Lebanon, seven days from 16th – 22th October 2013 in

51
the South of Lebanon and five weeks from October 23rd to November 30th in the Beirut and
Mount Lebanon. Due to difficulties with security and requirements to enter Mount-Lebanon
Dahieh, the permission for data collection in the 10 clusters in the Dahieh area took 5 weeks.
Each assessment team explained the purpose of the survey and issues of confidentiality and
obtained verbal consent before proceeding with the survey in the selected households. The
informed consent form is shown in Annex 7.
10. Field work and quality control
Due to cultural and social considerations, female members performed the women’s
anthropometric measurements.
Throughout the field work, rigorous quality control measures were adopted. Anthropometric
equipment (scales, height boards and MUAC tapes) were calibrated and checked before
distribution to the teams and the calibration and accuracy verification was repeated every
day before starting the field work (an example of a filled form in Annex 8).
Every day, filled questionnaires were reviewed on site by team leaders and checked by field
supervisors for data accuracy and completeness. For each case of severe acute malnutrition
or anaemia, a referral form (Annex 9) was filled with the child’s details or woman’s (in case
of anaemia) details and the team leader advised the parent/caregiver or the woman to take
the child or to go to a designated health center for further nutrition support or investigation
and guidance.
Team leaders checked the questionnaires before leaving the household, identified errors and
made sure data collected was correct before signing off. At the end of each day and/or before
leaving the cluster, the team leader checked all the questionnaires for any identifiable errors
and made sure data collected was correct. While still in the field or at the end of the day
(before the anthropometric data entry began), supervisors re-checked the questionnaires to
ascertain completeness. After verification, team leaders prepared the questionnaires and
brought them for the daily anthropometric data entry.
For the Hb testing control, the surveyor responsible of anaemia or one supervisor checked
every day that the microcuvette containers of each team had enough are left for conducting
the Hb tests for the day and to ensure that the survey team carries an additional microcuvette
container with them. Moreover, the supervisor did a visual inspection of the HemoCue
machine of each team and ensured that it was clean. If not, cleaning procedures were applied
as indicated during the training. Survey supervisors or coordinators closely followed cleaning
procedures and checked whether the machine was working properly, if not it was replaced
with another machine. All HemoCue machines were cleaned in the beginning of data
collection and after the data was done in the 2 strata among the 4.

52
The coordinator (Nutrition consultant) with the support of supervisors verified all the
questionnaires filled by the team in each cluster on the same day. The anthropometric data
entry using the ENA software was organized and checked for any suspect data (outliers)
every night through the appropriate sections of the plausibility report (Plausibility check is an
important data quality verification property of the ENA software). The nutrition consultant
reviewed the anthropometric data quality report and gave the feedback to the supervisors
and teams the next day, during the daily early morning meeting (planning of the day).
Plausibility reports and feed-back of the consultant determined whether the team needed to
go back to the previous day’s cluster to rectify the errors identified, before embarking on
another cluster. In case of incorrect anthropometric measurements or “flagged” results which
demanded the return to the previous day’s cluster, the field supervisor accompanied the team
back to the cluster to take fresh measurement of the child.
11. Data analysis
All anthropometric data entry was completed every night in the field using ENA for SMART
software (delta version, November 24th 2012), by the coordinator of the survey (Consultant)
supported by the supervisors and team leaders. The entry of complementary data was
completed by a team of four (4) clerks using an Excel template, at IOCC office in Beirut.
All questionnaires were manually checked for completeness, consistency and range before
data entry by the supervisors and coordinator. This check was also used to provide feedback
to the teams to improve data collection as the assessment progressed. All data files were
cleaned before analysis. A data cleaning process was conducted whereby data capture and
errors were eliminated.
Analysis was performed using ENA for SMART, SPSS software and Epiinfo for Anaemia data
analysis. The SMART Plausibility Report was generated in order to check the quality of the
anthropometric data and a summary of the key quality criteria is shown in Annexes 10-1 to
10-5.
To ensure there were no data entry errors, after completion of the data entry, all entries were
double checked one by one with the original questionnaire. For cleaning the anthropometric
data, the flexible cleaning approach recommended in the UNHCR Standardized Nutrition
Survey Guidelines (Version 1.2, June 2011) in accordance with SMART recommendations
was used.
During the process of data analysis, the UNICEF nutrition consultant and assessment
coordinator was supported by a UNHCR HQ Nutrition team for aneamia data analysis.

53
VIII.
1. Response rate
Table 12 shows the different response rates and the total number of households and children
under 5 who participated in the assessments. For all Syrian refugees in Bekaa, 26 clusters
were sampled; in North of Lebanon, 34 clusters were sampled; in South of Lebanon, 27
clusters were sampled; and in Beirut and Mount-Lebanon, 33 clusters were sampled.
Globally, for all Syrian refugees in Lebanon, 120 clusters were sampled for all indicators.
Table 12: Target sample size and number covered during the survey
Target groups Target
sample size
Families/ children covered
Response Rate (% of the
target)
Syrian refugees in Bekaa Region Survey
Number of households 260 245 94.2%
Number of Children U5 207 303 146.4%
Syrian refugees in North of Lebanon Survey
Number of households 340 325 95.6%
Number of Children U5 207 362 174.9%
Syrian refugees in South of Lebanon Survey
Number of households 270 263 97.4%
Number of Children U5 207 303 146.4%
Syrian refugees in Beirut & Mount-Lebanon Survey
Number of households 330 325 98.5%
Number of Children U5 207 419 202.4%
All Syrian refugees in Lebanon (Global data)
Number of households 1,200 1,158 96.5%
Number of Children U5 828 1,387 167.5%
For Syrian refugees in each of the 4 strata, the nutrition assessment covered more than 94%
of the targeted number of households and for all Syrian refugees in Lebanon, the nutrition
assessment covered more than 96% of the targeted number of households.
Regarding the number of children under 5 years of age, the average household size and
consequently the number of children was under-estimated. The number of children identified
after visiting the households was much higher than anticipated; hence the response rate was
more than 145% of the targeted sample number of children U5 in each of the 4 strata and it
was more than 165% for the targeted number of all children U5 among Syrian refugees in
Lebanon.
2. Demography
For Syrian refugees in all Lebanon and in each stratum, the average household size was
between 7 and 8 people. This finding is similar to the average size observed in VASyr
assessment. However, the average household size for Syrian refugees in all Lebanon,
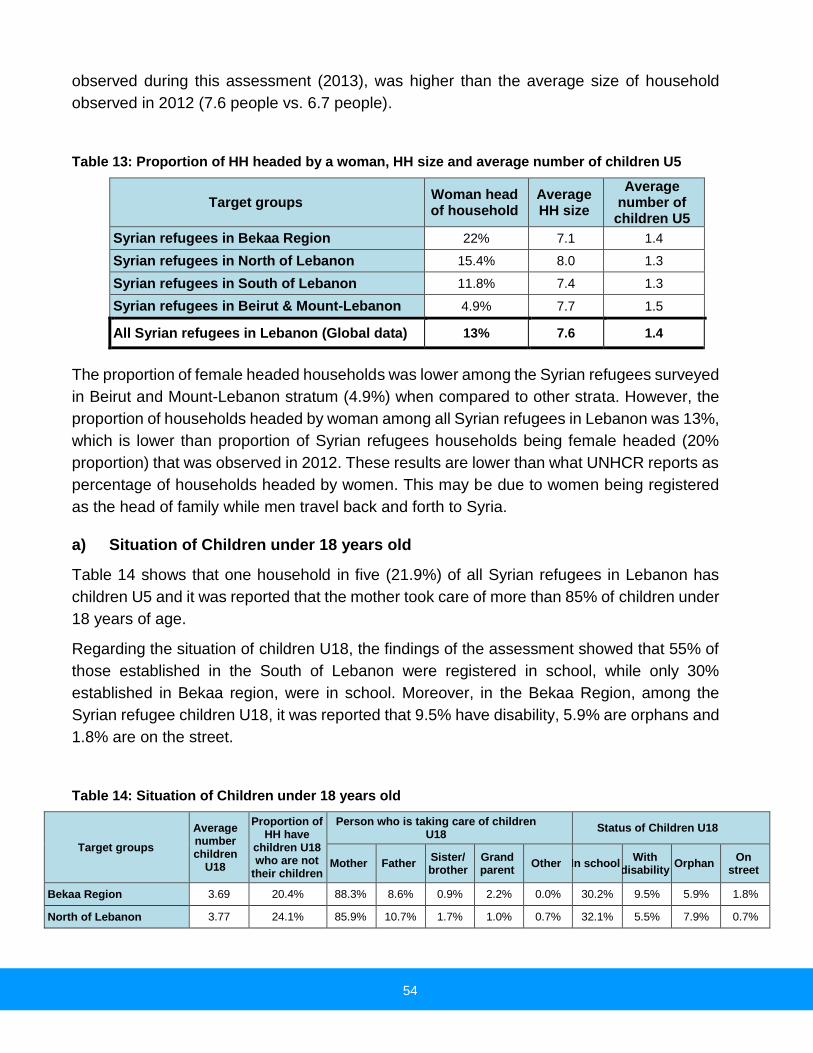
54
observed during this assessment (2013), was higher than the average size of household
observed in 2012 (7.6 people vs. 6.7 people).
Table 13: Proportion of HH headed by a woman, HH size and average number of children U5
Target groups Woman head of household
Average HH size
Average number of children U5
Syrian refugees in Bekaa Region 22% 7.1 1.4
Syrian refugees in North of Lebanon 15.4% 8.0 1.3
Syrian refugees in South of Lebanon 11.8% 7.4 1.3
Syrian refugees in Beirut & Mount-Lebanon 4.9% 7.7 1.5
All Syrian refugees in Lebanon (Global data) 13% 7.6 1.4
The proportion of female headed households was lower among the Syrian refugees surveyed
in Beirut and Mount-Lebanon stratum (4.9%) when compared to other strata. However, the
proportion of households headed by woman among all Syrian refugees in Lebanon was 13%,
which is lower than proportion of Syrian refugees households being female headed (20%
proportion) that was observed in 2012. These results are lower than what UNHCR reports as
percentage of households headed by women. This may be due to women being registered
as the head of family while men travel back and forth to Syria.
a) Situation of Children under 18 years old
Table 14 shows that one household in five (21.9%) of all Syrian refugees in Lebanon has
children U5 and it was reported that the mother took care of more than 85% of children under
18 years of age.
Regarding the situation of children U18, the findings of the assessment showed that 55% of
those established in the South of Lebanon were registered in school, while only 30%
established in Bekaa region, were in school. Moreover, in the Bekaa Region, among the
Syrian refugee children U18, it was reported that 9.5% have disability, 5.9% are orphans and
1.8% are on the street.
Table 14: Situation of Children under 18 years old
Target groups
Average number children
U18
Proportion of HH have
children U18 who are not
their children
Person who is taking care of children U18
Status of Children U18
Mother Father Sister/ brother
Grand parent
Other In school With
disability Orphan
On street
Bekaa Region 3.69 20.4% 88.3% 8.6% 0.9% 2.2% 0.0% 30.2% 9.5% 5.9% 1.8%
North of Lebanon 3.77 24.1% 85.9% 10.7% 1.7% 1.0% 0.7% 32.1% 5.5% 7.9% 0.7%

55
South of Lebanon 3.93 18.1% 89.1% 7.3% 1.6% 1.6% 0.4% 55.0% 4.8% 2.8% 0.4%
Beirut & Mount-Lebanon 3.76 24.2% 87.8% 10.9% 0% 1.4% 0.0% 48.3% 3.4% 2.4% 0.7%
All Lebanon (Global data)
3.79 21.9% 87.7% 9.5% 1.1% 1.5% 0.2% 41.6% 5.6% 4.7% 0.9%
b) Period stayed in Lebanon
The figures 2-1 to 2-5 below illustrate that, at the assessment period, more than 75% of all
Syrian refugees assessed have been in Lebanon between 7-24 months. In comparison to
2012 Syrian refugees Nutrition Assessment in Lebanon 40% of all Syrian refugees assessed
were in Lebanon for more than 6 months; whereas, this year findings show that more than
80% of all Syrian refugees assessed have been in Lebanon for a period greater than 6
months.
Figure 2-1: Period stayed in Lebanon – All Syrian refugees
Figure 2-2: Period stayed in Bekaa Figure 2-3: Period stayed in North Lebanon
Figure 2-4: Period stayed in South Figure 2-5: Period stayed in Beirut and
2%
22%
53%
19%
4%
Chart Title
< 3 month
3-6 months
7-12 months
12-24 months
≥ 24 months
3%
25%
51%
16%
5%
Chart Title
< 3 month
3-6 months
7-12 months
12-24 months
≥ 24 months

56
Lebanon Mount Lebanon
The situation is a little different in Beirut and Mount-Lebanon. The findings of assessment
show that the proportion of Syrian refugees in this stratum, who have been in Lebanon during
7-24 months was 52% (which is less than 75% if compared to the results in 2012 assessment)
and the proportion of Syrian refugees in this stratum who have been in Lebanon less than 3
months is the highest one (10%).
c) Sharing an accommodation
For Syrian refugees in Lebanon, 12.1% of households were hosted by resident families (table
15). Twenty-six percent (26.3%) of all Syrian refugees HHs reported that they shared
accommodation with other Syrian refugee HHs. Among all the HHs who shared
accommodation, 30.3% shared accommodation with one HH; 57.0% shared accommodation
with 2-3 other Syrian HHs and 12.7% shared accommodation with 4 or more other Syrian
HHs. These numbers are coherent with other sources, indicating that the majority of Syrian
refugees in Lebanon have moved into their own settlements (not hosted by resident families).
Moreover, in comparison to the proportion of Syrian refugee families who shared
accommodation as observed in year 2012, the number of HHs who shared accommodation
with one HH increased (12.4% in 2012 and 30.3% in 2013) and the number of HHs who
shared accommodation with 4 HHs or more decreased (24.9% in 2012 and 12.7% in 2013).
This result can be an indication of improvement in livelihood conditions of Syrian refugees.
10%
37%38%
14%
1%
Chart Title
< 3 month
3-6 months
7-12 months
12-24 months
≥ 24 months
1% 8%
52%
33%
6%
Chart Title
< 3 month
3-6 months
7-12 months
12-24 months
≥ 24 months

57
Table 15: Proportion of HH sharing ccommodation with other Syrian refugees HH
Target groups Proportion of HH hosted
N
Proportion HH
shared
accommodation
N Proportion of HH shared accommodation
N With one HH 2-3 HH 4 HH or more
Bekaa Region 13.1% 245 20.7% 227 35.8% 49.3% 14.9% 67
North of Lebanon 13.2% 325 26.4% 295 27.8% 57.7% 14.4% 97
South of Lebanon 8.4% 262 26.3% 247 32.9% 58.2% 8.9% 79
Beirut and Mount Lebanon 13.2% 325 30.6% 291 27.5% 60.0% 12.5% 120
All Lebanon (Global data)
12.1% 1,157 26.3% 1,060 30.3% 57.0% 12.7%% 363
3. Sources of income
For all Syrian refugees in Lebanon, the 3 main sources of income of HH surveyed were: work
(51.2%), food vouchers (18.1%) and cash from humanitarian organization (10.8%).
The findings of the assessment (figure 3) show that in all the strata the first and second
sources of income for the Syrian refugees were the income from work (first source) and then
food vouchers. The third main source of income for Syrian refugees in Bekaa, in the North
and in the South was the cash that the HH received from a humanitarian organization.
However, the third main source of income for Syrian refugees in Beirut and Mount-Lebanon
was not cash that the HH received from a humanitarian organization but rather the income
from skilled labor.

58
Figure 3: Source of income of Syrian refugees HH in Lebanon
4. Health assistance
For all Syrian refugees in Lebanon, the main sources of health assistance were: CBO Health
care – Cost sharing (34.1%); HH paid all health related cost (24.1%); CBO Health care – free
health care (15.5%) and Pharmacy (12.6%).
Figure 4: Sources of Health Assistance
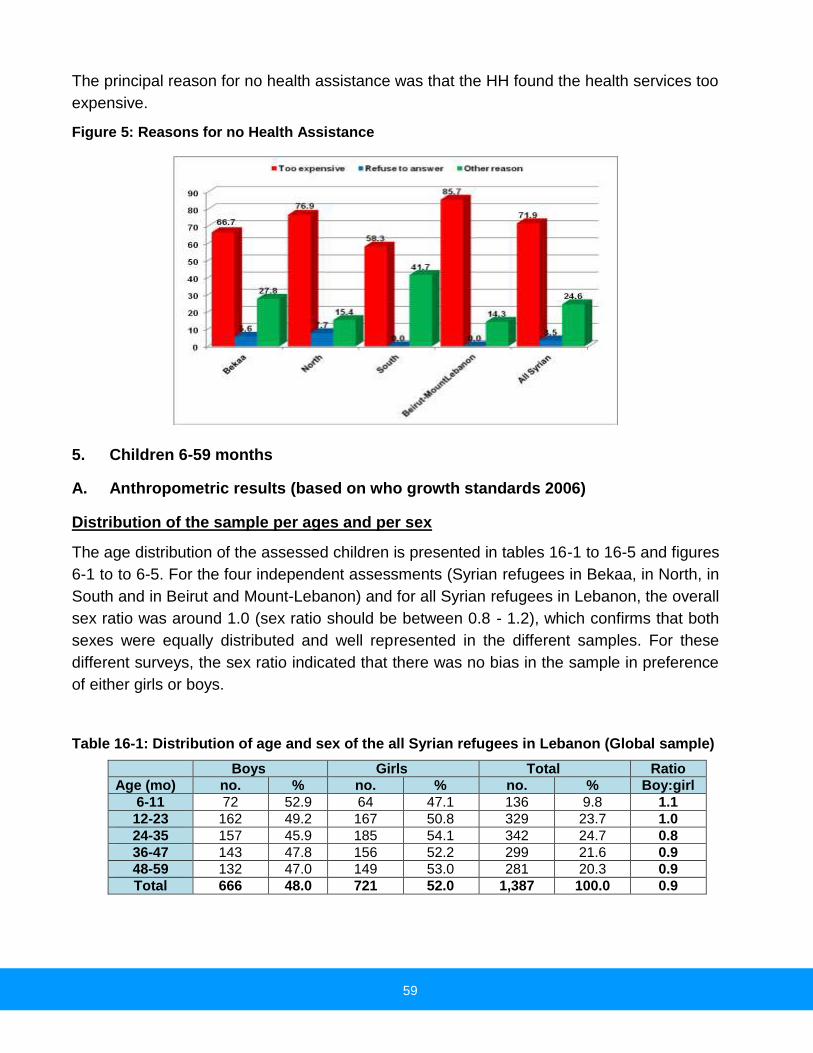
59
The principal reason for no health assistance was that the HH found the health services too
expensive.
Figure 5: Reasons for no Health Assistance
5. Children 6-59 months
A. Anthropometric results (based on who growth standards 2006)
Distribution of the sample per ages and per sex
The age distribution of the assessed children is presented in tables 16-1 to 16-5 and figures
6-1 to to 6-5. For the four independent assessments (Syrian refugees in Bekaa, in North, in
South and in Beirut and Mount-Lebanon) and for all Syrian refugees in Lebanon, the overall
sex ratio was around 1.0 (sex ratio should be between 0.8 - 1.2), which confirms that both
sexes were equally distributed and well represented in the different samples. For these
different surveys, the sex ratio indicated that there was no bias in the sample in preference
of either girls or boys.
Table 16-1: Distribution of age and sex of the all Syrian refugees in Lebanon (Global sample)
Boys Girls Total Ratio
Age (mo) no. % no. % no. % Boy:girl
6-11 72 52.9 64 47.1 136 9.8 1.1
12-23 162 49.2 167 50.8 329 23.7 1.0
24-35 157 45.9 185 54.1 342 24.7 0.8
36-47 143 47.8 156 52.2 299 21.6 0.9
48-59 132 47.0 149 53.0 281 20.3 0.9
Total 666 48.0 721 52.0 1,387 100.0 0.9

60
Table 16-2: Distribution of age and sex of the all Syrian refugees in Bekaa Region
Boys Girls Total Ratio
Age (mo) no. % no. % no. % Boy:girl
6-11 18 62.1 11 37.9 29 9.6 1.6
12-23 44 61.1 28 38.9 72 23.8 1.6
24-35 32 42.7 43 57.3 75 24.8 0.7
36-47 29 49.2 30 50.8 59 19.5 1.0
48-59 33 48.5 35 51.5 68 22.4 0.9
Total 156 51.5 147 48.5 303 100.0 1.1
Table 16-3: Distribution of age and sex of the all Syrian refugees in North of Lebanon
Boys Girls Total Ratio
Age (mo) no. % no. % no. % Boy:girl
6-11 18 46.2 21 53.8 39 10.8 0.9
12-23 38 42.2 52 57.8 90 24.9 0.7
24-35 34 39.5 52 60.5 86 23.8 0.7
36-47 42 51.2 40 48.8 82 22.7 1.0
48-59 29 44.6 36 55.4 65 18.0 0.8
Total 161 44.5 201 55.5 362 100.0 0.8
Table 16-4: Distribution of age and sex of the all Syrian refugees in South of Lebanon
Boys Girls Total Ratio
Age (mo) no. % no. % no. % Boy:girl
6-11 17 63.0 10 37.0 27 8.9 1.7
12-23 34 42.0 47 58.0 81 26.7 0.7
24-35 31 48.4 33 51.6 64 21.1 0.9
36-47 31 41.9 43 58.1 74 24.4 0.7
48-59 21 36.8 36 63.2 57 18.8 0.6
Total 134 44.2 169 55.8 303 100.0 0.8
Table 16-5: Distribution of age and sex of the all Syrian refugees in Beirut & Mount-Lebanon
Boys Girls Total Ratio
Age (mo) no. % no. % no. % Boy:girl
6-11 19 46.3 22 53.7 41 9.8 0.9
12-23 46 53.5 40 46.5 86 20.5 1.1
24-35 60 51.3 57 48.7 117 27.9 1.1
36-47 41 48.8 43 51.2 84 20.0 1.0
48-59 49 53.8 42 46.2 91 21.7 1.2
Total 215 51.3 204 48.7 419 100.0 1.1

61
Figure 6-1: Distribution of age and sex of the all Syrian refugees in Lebanon (Global sample)

62
Prevalence of Acute Malnutrition by sex
The results from tables 17-1 to 17-5 show the global acute malnutrition rates for all Syrian
refugees in Lebanon: 2.2%; for Syrian refugees in Bekaa: 4.5%%; for Syrian refugees in
North: 3.9%; for Syrian refugees in the South of Lebanon: 0.3% and for Syrian refugees in
Beirut and Mount-Lebanon: 0.5%. The tables also show variations between boys and girls in
the prevalence of acute malnutrition, in both surveys. However, the difference between boys
and girls in the prevalence of acute malnutrition is not statistically significant.
In Bekaa region, the findings of the assessment showed that the prevalence of oedema was
very high (1.7%); all cases of SAM were identified by presence of oedema.
Table 17-1: Prevalence of acute malnutrition for all Syrian refugees in Lebanon based on weight-for-height z-scores (and/or oedema) and by sex
All
n = 1352
Boys n = 650
Girls n = 702
Prevalence of global malnutrition (<-2 z-score and/or oedema)
(30) 2.2 % (1.5 - 3.3 95% C.I.)
(19) 2.9 % (1.9 - 4.5 95% C.I.)
(11) 1.6 % (0.8 - 3.0 95% C.I.)
Prevalence of moderate malnutrition (<-2 z-score and >=-3 z-score, no oedema)
(24) 1.8 % (1.2 - 2.6 95% C.I.)
(16) 2.5 % (1.5 - 4.0 95% C.I.)
(8) 1.1 % (0.5 - 2.4 95% C.I.)
Prevalence of severe malnutrition (<-3 z-score and/or oedema)
(6) 0.4 % (0.2 - 1.2 95% C.I.)
(3) 0.5 % (0.1 - 1.4 95% C.I.)
(3) 0.4 % (0.1 - 1.3 95% C.I.)
The prevalence of oedema is (6) 0.4%.
Prevalence of Acute Malnutrition based on MUAC
Under 5 children MUAC has a good relationship with the risk of mortality due to severe acute
malnutrition. Prevalence of malnutrition based on MUAC was lower than based on weight-
for-height among all Syrian refugee children. Therefore the proportion of children at risk of
mortality due to malnutrition is low.
Table 17-1-1: Prevalence of acute malnutrition for all Syrian refugees in Lebanon based on MUAC cut off's (and/or oedema) and by sex
All (n = 1363) Boys (n = 656) Girls (n = 707)
Prevalence of global malnutrition (< 125 mm and/or oedema)
(21) 1.5 % (0.9 - 2.6 95% C.I.)
(9) 1.4 % (0.7 - 2.8 95% C.I.)
(12) 1.7 % (1.0 - 3.0 95% C.I.)
Prevalence of moderate malnutrition (< 125 mm and >= 115 mm, no oedema)
(13) 1.0 % (0.6 - 1.6 95% C.I.)
(4) 0.6 % (0.2 - 1.6 95% C.I.)
(9) 1.3 % (0.7 - 2.3 95% C.I.)
Prevalence of severe malnutrition (< 115 mm and/or oedema)
(8) 0.6 % (0.2 - 1.5 95% C.I.)
(5) 0.8 % (0.3 - 2.1 95% C.I.)
(3) 0.4 % (0.1 - 1.3 95% C.I.)

63
Below is a summary of the four independent assessment results from the four strata conducted in Lebanon.
Table 17-2: Prevalence of acute malnutrition among Syrian refugees in Bekaa Valley based on weight-for-height z-scores (and/or oedema) and by sex
All
n = 292
Boys n = 147
Girls n = 145
Prevalence of global malnutrition (<-2 z-score and/or oedema)
(13) 4.5 % (2.3 - 8.3 95% C.I.)
(8) 5.4 % (2.9 - 9.9 95% C.I.)
(5) 3.4 % (1.1 - 10.1 95% C.I.)
Prevalence of moderate malnutrition (<-2 z-score and >=-3 z-score, no oedema)
(8) 2.7 % (1.3 - 5.5 95% C.I.)
(5) 3.4 % (1.5 - 7.6 95% C.I.)
(3) 2.1 % (0.5 - 8.4 95% C.I.)
Prevalence of severe malnutrition (<-3 z-score and/or oedema)
(5) 1.7 % (0.5 - 5.4 95% C.I.)
(3) 2.0 % (0.6 - 6.4 95% C.I.)
(2) 1.4 % (0.3 - 5.3 95% C.I.)
The prevalence of oedema is 1.7 %
Table 17-3: Prevalence of acute malnutrition among Syrian refugees in North Lebanon based on weight-for-height z-scores (and/or oedema) and by sex
All
n = 356
Boys n = 157
Girls n = 199
Prevalence of global malnutrition (<-2 z-score and/or oedema)
(14) 3.9 % (2.5 - 6.1 95% C.I.)
(9) 5.7 % (3.0 - 10.8 95% C.I.)
(5) 2.5 % (1.1 - 5.7 95% C.I.)
Prevalence of moderate malnutrition (<-2 z-score and >=-3 z-score, no oedema)
(13) 3.7 % (2.3 - 5.8 95% C.I.)
(9) 5.7 % (3.0 - 10.8 95% C.I.)
(4) 2.0 % (0.8 - 5.1 95% C.I.)
Prevalence of severe malnutrition (<-3 z-score and/or oedema)
(1) 0.3 % (0.0 - 2.1 95% C.I.)
(0) 0.0 % (0.0 - 0.0 95% C.I.)
(1) 0.5 % (0.1 - 3.8 95% C.I.)
The prevalence of oedema is 0.3 %
Table 17-4: Prevalence of acute malnutrition among Syrian refugees in South Lebanon based on weight-for-height z-scores (and/or oedema) and by sex
All
n = 299
Boys n = 133
Girls n = 166
Prevalence of global malnutrition (<-2 z-score and/or oedema)
(1) 0.3 % (0.0 - 2.6 95% C.I.)
(1) 0.8 % (0.1 - 5.6 95% C.I.)
(0) 0.0 % (0.0 - 0.0 95% C.I.)
Prevalence of moderate malnutrition (<-2 z-score and >=-3 z-score, no oedema)
(1) 0.3 % (0.0 - 2.6 95% C.I.)
(1) 0.8 % (0.1 - 5.6 95% C.I.)
(0) 0.0 % (0.0 - 0.0 95% C.I.)
Prevalence of severe malnutrition (<-3 z-score and/or oedema)
(0) 0.0 % (0.0 - 0.0 95% C.I.)
(0) 0.0 % (0.0 - 0.0 95% C.I.)
(0) 0.0 % (0.0 - 0.0 95% C.I.)
The prevalence of oedema is 0.0 %
Table 17-5: Prevalence of acute malnutrition among Syrian refugees in Beirut and Mount Lebanon stratum based on weight-for-height z-scores (and/or oedema) and by sex
All
n = 405
Boys n = 213
Girls n = 192
Prevalence of global malnutrition (<-2 z-score and/or oedema)
(2) 0.5 % (0.1 - 2.1 95% C.I.)
(1) 0.5 % (0.1 - 3.4 95% C.I.)
(1) 0.5 % (0.1 - 4.0 95% C.I.)
Prevalence of moderate malnutrition (<-2 z-score and >=-3 z-score, no oedema)
(2) 0.5 % (0.1 - 2.1 95% C.I.)
(1) 0.5 % (0.1 - 3.4 95% C.I.)
(1) 0.5 % (0.1 - 4.0 95% C.I.)
Prevalence of severe malnutrition (<-3 z-score and/or oedema)
(0) 0.0 % (0.0 - 0.0 95% C.I.)
(0) 0.0 % (0.0 - 0.0 95% C.I.)
(0) 0.0 % (0.0 - 0.0 95% C.I.)
The prevalence of oedema is 0.0 %

64
Prevalence of Acute Malnutrition (wasting) by age
On the overall, there is no specifc trend to indicate increased vulnerability to any of the age
group across the strata as per the summary below. All age group should be given equal
attention if offering child care. Below is a summary of tables with on nutrition status by age
category.
Table 18-1: Prevalence of acute malnutrition in the Syrian population in Lebanon by age, based on weight-for-height z-scores and/or oedema
Severe
wasting
(<-3 z-score)
Moderate wasting (>= -3 and <-2 z-
score )
Normal (> = -2 z score)
Oedema
Age (mo) Total no. No. % No. % No. % No. %
6-17 278 0 0.0 9 3.2 268 96.4 1 0.4
18-29 342 0 0.0 7 2.0 330 96.5 5 1.5
30-41 312 0 0.0 3 1.0 309 99.0 0 0.0
42-53 293 0 0.0 1 0.3 292 99.7 0 0.0
54-59 127 0 0.0 4 3.1 123 96.9 0 0.0
Total 1352 0 0.0 24 1.8 1322 97.8 6 0.4
Table 18-2: Prevalence of acute malnutrition in Bekaa Valley by age, based on weight-for-height z-scores and/or oedema
Severe wasting
(<-3 z-score)
Moderate wasting (>= -3 and <-2 z-
score )
Normal (> = -2 z score)
Oedema
Age (mo)
Total no.
No. % No. % No. % No. %
6-17 63 0 0.0 3 4.8 59 93.7 1 1.6
18-29 72 0 0.0 2 2.8 66 91.7 4 5.6
30-41 66 0 0.0 0 0.0 66 100.0 0 0.0
42-53 64 0 0.0 0 0.0 64 100.0 0 0.0
54-59 27 0 0.0 3 11.1 24 88.9 0 0.0
Total 292 0 0.0 8 2.7 279 95.5 5 1.7
Table 18-3: Prevalence of acute malnutrition in Northern Lebanon by age, based on weight-for-height z-scores and/or oedema
Severe wasting
(<-3 z-score)
Moderate wasting (>= -3 and <-2 z-
score )
Normal (> = -2 z score)
Oedema
Age (mo)
Total no.
No. % No. % No. % No. %
6-17 84 0 0.0 5 6.0 79 94.0 0 0.0
18-29 87 0 0.0 4 4.6 82 94.3 1 1.1
30-41 82 0 0.0 2 2.4 80 97.6 0 0.0
42-53 71 0 0.0 1 1.4 70 98.6 0 0.0
54-59 32 0 0.0 1 3.1 31 96.9 0 0.0
Total 356 0 0.0 13 3.7 342 96.1 1 0.3

65
Table 18-4: Prevalence of acute malnutrition in South Lebanon by age, based on weight-for-height z-scores and/or oedema
Severe
wasting
(<-3 z-score)
Moderate wasting (>= -3 and <-2 z-
score )
Normal (> = -2 z score)
Oedema
Age (mo)
Total no.
No. % No. % No. % No. %
6-11 28 0 0.0 1 3.6 27 96.4 0 0.0
12-23 78 0 0.0 0 0.0 78 100.0 0 0.0
24-34 57 0 0.0 0 0.0 57 100.0 0 0.0
35-47 80 0 0.0 0 0.0 80 100.0 0 0.0
48-59 56 0 0.0 0 0.0 56 100.0 0 0.0
Total 299 0 0.0 1 0.3 298 99.7 0 0.0
Table 18-5: Prevalence of acute malnutrition in Beirut/Mount Lebanon by age, based on weight-for-height z-scores and/or oedema
Severe
wasting
(<-3 z-score)
Moderate wasting (>= -3 and <-2 z-
score )
Normal (> = -2 z score)
Oedema
Age (mo)
Total no.
No. % No. % No. % No. %
6-17 70 0 0.0 0 0.0 70 100.0 0 0.0
18-29 107 0 0.0 1 0.9 106 99.1 0 0.0
30-41 93 0 0.0 1 1.1 92 98.9 0 0.0
42-53 91 0 0.0 0 0.0 91 100.0 0 0.0
54-59 44 0 0.0 0 0.0 44 100.0 0 0.0
Total 405 0 0.0 2 0.5 403 99.5 0 0.0
The number of oedema were found in only 2 strata, i.e. Bekaa and North Lebanon and though few they had to be investigated as they were the only severely malnourished cases identified. Below is a distribution of the oedema cases detected.
Table 19-1: Distribution of acute malnutrition and oedema based on weight-for-height z-scores
SYRIAN REFUGGEES IN
All Lebanon Bekaa North of Lebanon
<-3 z-score >=-3 z-score >=-3 z-score >=-3 z-score <-3 z-score >=-3 z-score
Oedema present
Marasmic kwashiorkor No. 0 (0.0 %)
Kwashiorkor No. 6
(0.4 %)
Marasmic kwashiorkor No. 0 (0.0 %)
Kwashiorkor No. 5
(1.7 %)
Marasmic kwashiorkor No. 0 (0.0 %)
Kwashiorkor No. 1
(0.3 %)
Oedema absent
Marasmic No. 8
(0.6 %)
Not severely malnourished
No. 1370 (99.0 %)
Marasmic No. 0
(0.0 %)
Not severely malnourished
No. 298 (98.3 %)
Marasmic No. 3
(0.8 %)
Not severely malnourished
No. 356 (98.9 %)

66
Table 19-2: Distribution of acute malnutrition and oedema based on weight-for-height z-scores
SYRIAN REFUGGEES IN
South of Lebanon Beirut and Mount-Lebanon
<-3 z-score >=-3 z-score <-3 z-score
Oedema present
Marasmic kwashiorkor No. 0 (0.0 %)
Kwashiorkor No. 0
(0.0 %)
Marasmic kwashiorkor No. 0 (0.0 %)
Kwashiorkor No. 0
(0.0 %)
Oedema absent
Marasmic No. 2
(0.7 %)
Not severely malnourished
No. 300 (99.3 %)
Marasmic No. 3
(0.7 %)
Not severely malnourished
No. 416 (99.3 %)
All cases (6) of children with oedema were confirmed by Nutrition Assessment coordinator
and/or supervisor. After confirmation of oedema, the treatement was initiated and the child
was referred to the PHC or to another health/nutrition unit, for follow-up.
Prevalence of Chronic Malnutrition (Stunting) by sex
In the current context gathering data on the exact ages of children can be difficult as many
children are do not have the necessary documentation with them or their birth dates are not
correctly registered and parents or caregivers do not always remember precise dates of
births. In this regard and as explained in the methodology section, teams made reference to
the “Events Calendar” to estimate and verify age in months. It’s therefore worthnoting that
even though great caution was taken to ensure quality of age data, the data must be
understood in light of its limitations.
The assessment found an overall low prevalence of chronic malnutrition of 18.6% with Bekaa
stratum recording the highest level of 21.1% while Mount-Lebanon recorded 14.1% (Ref:
tables 20-1 to 20-5), based on the 2006 WHO child growth standards. The oveall prevalence
of 18,6% was higher than the prevalence of stunting observed in the 2012 last year’s Nutrition
assessment (18.6% stunting in 2013 vs. 12.2% stunting in 2012).
Below is a summary of the stunting prevalence disaggregated by gender.

67
Table 20-1: Prevalence of stunting based on height-for-age z-scores by sex among all Syrian refugees in Lebanon
All (n = 1331) Boys (n = 636) Girls (n = 695)
Prevalence of stunting (<-2 z-score)
(248) 18.6 % (16.4 - 21.1 95% C.I.)
(122) 19.2 % (16.0 - 22.9 95% C.I.)
(126) 18.1 % (15.4 - 21.3 95% C.I.)
Prevalence of moderate stunting (<-2 z-score and >=-3 z-score)
(211) 15.9 % (13.8 - 18.2 95% C.I.)
(100) 15.7 % (12.8 - 19.2 95% C.I.)
(111) 16.0 % (13.5 - 18.8 95% C.I.)
Prevalence of severe stunting (<-3 z-score)
(37) 2.8 % (2.0 - 3.8 95% C.I.)
(22) 3.5 % (2.3 - 5.3 95% C.I.)
(15) 2.2 % (1.3 - 3.7 95% C.I.)
Table 20-2: Prevalence of stunting based on height-for-age z-scores by sex among Syrian refugees in Bekaa Valley
All
n = 285
Boys n = 141
Girls n = 144
Prevalence of stunting (<-2 z-score)
(60) 21.1 % (15.7 - 27.6 95% C.I.)
(27) 19.1 % (13.4 - 26.7 95% C.I.)
(33) 22.9 % (15.8 - 32.1 95% C.I.)
Prevalence of moderate stunting (<-2 z-score and >=-3 z-score)
(48) 16.8 % (12.1 - 22.9 95% C.I.)
(21) 14.9 % (10.2 - 21.3 95% C.I.)
(27) 18.8 % (12.9 - 26.5 95% C.I.)
Prevalence of severe stunting (<-3 z-score)
(12) 4.2 % (2.3 - 7.7 95% C.I.)
(6) 4.3 % (1.7 - 10.0 95% C.I.)
(6) 4.2 % (1.5 - 10.8 95% C.I.)
Table 20-3: Prevalence of stunting based on height-for-age z-scores by sex among Syrian refugees in the North of Lebanon
All
n = 350
Boys n = 156
Girls n = 194
Prevalence of stunting (<-2 z-score)
(70) 20.0 % (15.6 - 25.3 95% C.I.)
(33) 21.2 % (13.6 - 31.3 95% C.I.)
(37) 19.1 % (14.3 - 24.9 95% C.I.)
Prevalence of moderate stunting (<-2 z-score and >=-3 z-score)
(61) 17.4 % (13.4 - 22.4 95% C.I.)
(27) 17.3 % (11.0 - 26.2 95% C.I.)
(34) 17.5 % (13.1 - 23.0 95% C.I.)
Prevalence of severe stunting (<-3 z-score)
(9) 2.6 % (1.5 - 4.5 95% C.I.)
(6) 3.8 % (1.8 - 8.0 95% C.I.)
(3) 1.5 % (0.5 - 4.7 95% C.I.)
Table 20-4: Prevalence of stunting based on height-for-age z-scores by sex among Syrian refugees in the South of Lebanon
All
n = 298
Boys n = 133
Girls n = 165
Prevalence of stunting (<-2 z-score)
(62) 20.8 % (16.3 - 26.1 95% C.I.)
(29) 21.8 % (14.9 - 30.7 95% C.I.)
(33) 20.0 % (15.0 - 26.1 95% C.I.)
Prevalence of moderate stunting (<-2 z-score and >=-3 z-score)
(49) 16.4 % (11.8 - 22.5 95% C.I.)
(21) 15.8 % (9.4 - 25.4 95% C.I.)
(28) 17.0 % (12.4 - 22.8 95% C.I.)
Prevalence of severe stunting (<-3 z-score)
(13) 4.4 % (2.4 - 7.7 95% C.I.)
(8) 6.0 % (2.8 - 12.6 95% C.I.)
(5) 3.0 % (1.3 - 7.1 95% C.I.)
Table 20-5: Prevalence of stunting based on height-for-age z-scores by sex among Syrian refugees in Beirut & Mount-Lebanon
All
n = 398
Boys n = 206
Girls n = 192
Prevalence of stunting (<-2 z-score)
(56) 14.1 % (10.8 - 18.1 95% C.I.)
(33) 16.0 % (11.3 - 22.2 95% C.I.)
(23) 12.0 % (7.8 - 18.0 95% C.I.)
Prevalence of moderate stunting (<-2 z-score and >=-3 z-score)
(53) 13.3 % (10.1 - 17.3 95% C.I.)
(31) 15.0 % (10.2 - 21.7 95% C.I.)
(22) 11.5 % (7.3 - 17.6 95% C.I.)
Prevalence of severe stunting (<-3 z-score)
(3) 0.8 % (0.2 - 2.3 95% C.I.)
(2) 1.0 % (0.2 - 3.7 95% C.I.)
(1) 0.5 % (0.1 - 3.9 95% C.I.)

68
Prevalence of Underweight by Sex
The prevalence of underweight by sex found in the different assessments is given in tables
21-1 to 21-5. The assessment found very low prevalence of underweight in among boys and
girls as summarized in the tables below. .
Table 21-1: Prevalence of underweight based on weight-for-age z-scores and by sex among all Syrian refugees in Lebanon
All (n = 1343) Boys (n = 645) Girls (n = 698)
Prevalence of underweight (<-2 z-score)
(35) 2.6 % (1.9 - 3.6 95% C.I.)
(16) 2.5 % (1.5 - 4.1 95% C.I.)
(19) 2.7 % (1.7 - 4.2 95% C.I.)
Prevalence of moderate underweight (<-2 z-score and >=-3 z-score)
(32) 2.4 % (1.7 - 3.4 95% C.I.)
(15) 2.3 % (1.4 - 4.0 95% C.I.)
(17) 2.4 % (1.5 - 3.9 95% C.I.)
Prevalence of severe underweight (<-3 z-score)
(3) 0.2 % (0.1 - 0.7 95% C.I.)
(1) 0.2 % (0.0 - 1.1 95% C.I.)
(2) 0.3 % (0.1 - 1.2 95% C.I.)
Table 21-2: Prevalence of underweight based on weight-for-age z-scores and by sex among Syrian refugees in Bekaa
All
n = 288
Boys n = 146
Girls n = 142
Prevalence of underweight (<-2 z-score)
(7) 2.4 % (1.0 - 5.9 95% C.I.)
(3) 2.1 % (0.7 - 6.2 95% C.I.)
(4) 2.8 % (0.7 - 10.4 95% C.I.)
Prevalence of moderate underweight (<-2 z-score and >=-3 z-score)
(5) 1.7 % (0.5 - 5.5 95% C.I.)
(1) 0.7 % (0.1 - 5.1 95% C.I.)
(4) 2.8 % (0.7 - 10.4 95% C.I.)
Prevalence of severe underweight (<-3 z-score)
(2) 0.7 % (0.2 - 2.9 95% C.I.)
(2) 1.4 % (0.3 - 5.6 95% C.I.)
(0) 0.0 % (0.0 - 0.0 95% C.I.)
Table 21-3: Prevalence of underweight based on weight-for-age z-scores and by sex among Syrian refugees in the North of Lebanon
All
n = 355
Boys n = 157
Girls n = 198
Prevalence of underweight (<-2 z-score)
(11) 3.1 % (1.8 - 5.2 95% C.I.)
(7) 4.5 % (2.0 - 9.5 95% C.I.)
(4) 2.0 % (0.8 - 5.0 95% C.I.)
Prevalence of moderate underweight (<-2 z-score and >=-3 z-score)
(10) 2.8 % (1.6 - 4.9 95% C.I.)
(6) 3.8 % (1.6 - 8.9 95% C.I.)
(4) 2.0 % (0.8 - 5.0 95% C.I.)
Prevalence of severe underweight (<-3 z-score)
(1) 0.3 % (0.0 - 2.1 95% C.I.)
(1) 0.6 % (0.1 - 4.8 95% C.I.)
(0) 0.0 % (0.0 - 0.0 95% C.I.)
Table 21-4: Prevalence of underweight based on weight-for-age z-scores and by sex among Syrian refugees in the South of Lebanon
All
n = 299
Boys n = 134
Girls n = 165
Prevalence of underweight (<-2 z-score)
(10) 3.3 % (1.9 - 5.7 95% C.I.)
(4) 3.0 % (1.1 - 7.7 95% C.I.)
(6) 3.6 % (1.7 - 7.5 95% C.I.)
Prevalence of moderate underweight (<-2 z-score and >=-3 z-score)
(9) 3.0 % (1.7 - 5.4 95% C.I.)
(4) 3.0 % (1.1 - 7.7 95% C.I.)
(5) 3.0 % (1.3 - 6.8 95% C.I.)
Prevalence of severe underweight (<-3 z-score)
(1) 0.3 % (0.0 - 2.6 95% C.I.)
(0) 0.0 % (0.0 - 0.0 95% C.I.)
(1) 0.6 % (0.1 - 4.6 95% C.I.)
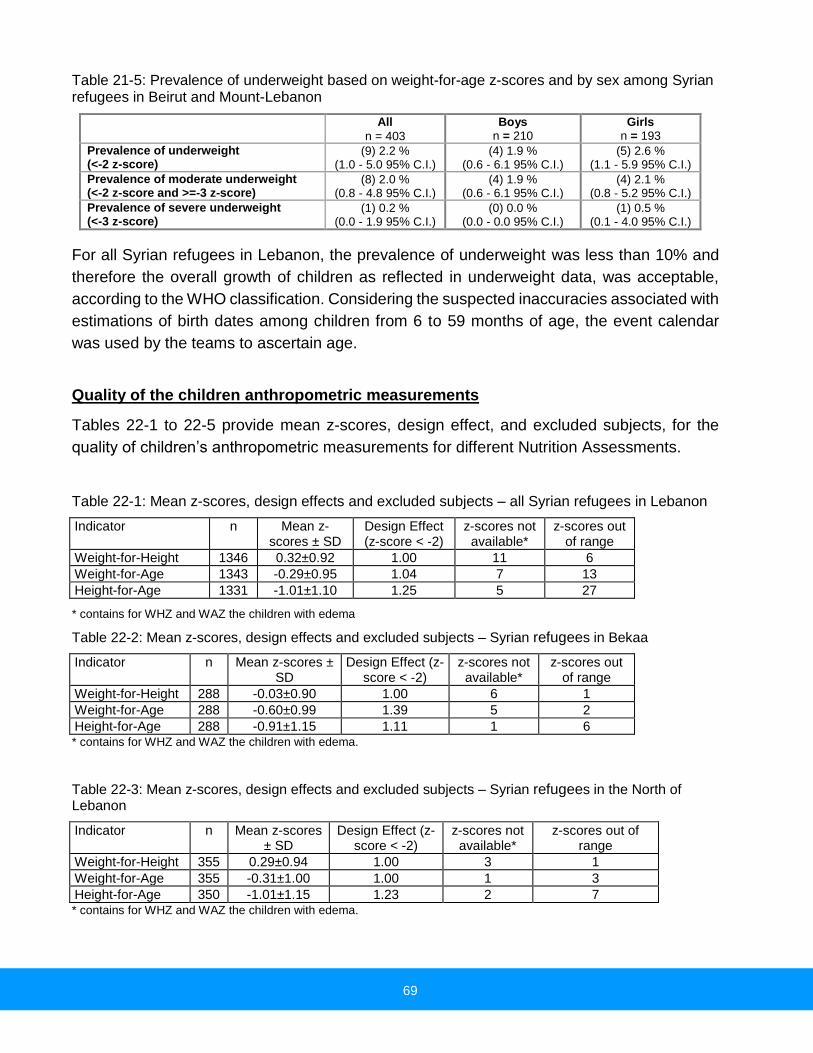
69
Table 21-5: Prevalence of underweight based on weight-for-age z-scores and by sex among Syrian refugees in Beirut and Mount-Lebanon
All
n = 403
Boys n = 210
Girls n = 193
Prevalence of underweight (<-2 z-score)
(9) 2.2 % (1.0 - 5.0 95% C.I.)
(4) 1.9 % (0.6 - 6.1 95% C.I.)
(5) 2.6 % (1.1 - 5.9 95% C.I.)
Prevalence of moderate underweight (<-2 z-score and >=-3 z-score)
(8) 2.0 % (0.8 - 4.8 95% C.I.)
(4) 1.9 % (0.6 - 6.1 95% C.I.)
(4) 2.1 % (0.8 - 5.2 95% C.I.)
Prevalence of severe underweight (<-3 z-score)
(1) 0.2 % (0.0 - 1.9 95% C.I.)
(0) 0.0 % (0.0 - 0.0 95% C.I.)
(1) 0.5 % (0.1 - 4.0 95% C.I.)
For all Syrian refugees in Lebanon, the prevalence of underweight was less than 10% and
therefore the overall growth of children as reflected in underweight data, was acceptable,
according to the WHO classification. Considering the suspected inaccuracies associated with
estimations of birth dates among children from 6 to 59 months of age, the event calendar
was used by the teams to ascertain age.
Quality of the children anthropometric measurements
Tables 22-1 to 22-5 provide mean z-scores, design effect, and excluded subjects, for the
quality of children’s anthropometric measurements for different Nutrition Assessments.
Table 22-1: Mean z-scores, design effects and excluded subjects – all Syrian refugees in Lebanon
Indicator n Mean z-scores ± SD
Design Effect (z-score < -2)
z-scores not available*
z-scores out of range
Weight-for-Height 1346 0.32±0.92 1.00 11 6
Weight-for-Age 1343 -0.29±0.95 1.04 7 13
Height-for-Age 1331 -1.01±1.10 1.25 5 27
* contains for WHZ and WAZ the children with edema
Table 22-2: Mean z-scores, design effects and excluded subjects – Syrian refugees in Bekaa
Indicator n Mean z-scores ± SD
Design Effect (z-score < -2)
z-scores not available*
z-scores out of range
Weight-for-Height 288 -0.03±0.90 1.00 6 1
Weight-for-Age 288 -0.60±0.99 1.39 5 2
Height-for-Age 288 -0.91±1.15 1.11 1 6 * contains for WHZ and WAZ the children with edema.
Table 22-3: Mean z-scores, design effects and excluded subjects – Syrian refugees in the North of Lebanon
Indicator n Mean z-scores ± SD
Design Effect (z-score < -2)
z-scores not available*
z-scores out of range
Weight-for-Height 355 0.29±0.94 1.00 3 1
Weight-for-Age 355 -0.31±1.00 1.00 1 3
Height-for-Age 350 -1.01±1.15 1.23 2 7 * contains for WHZ and WAZ the children with edema.

70
Table 22-4: Mean z-scores, design effects and excluded subjects – Syrian refugees in the South of Lebanon
Indicator n Mean z-scores ± SD
Design Effect (z-score < -2)
z-scores not available*
z-scores out of range
Weight-for-Height 299 0.37±0.89 1.01 1 2
Weight-for-Age 299 -0.27±0.97 1.00 1 2
Height-for-Age 298 -1.06±1.13 1.03 1 3
* contains for WHZ and WAZ the children with edema.
Table 22-5: Mean z-scores, design effects and excluded subjects – Syrian refugees in Beirut and Mount Lebanon
Indicator n Mean z-scores ± SD
Design Effect (z-score < -2)
z-scores not available*
z-scores out of range
Weight-for-Height 405 0.35±0.91 1.00 1 1
Weight-for-Age 403 -0.26±0.91 1.44 0 4
Height-for-Age 398 -0.93±0.96 1.03 1 8 * contains for WHZ and WAZ the children with edema.
The other indicators of quality for children’s anthropometric data were generally good.
B. Anaemia results for children 6-59 months
During the emergency situation, data on the prevalence of anaemia is essential to collect in
order to assess the anaemia and iron deficiency situation, and to establish a data baseline
for future monitoring purposes.
The Haemoglobin concentration was measured from a capillary blood sample from the
fingertip and recorded to the closest gram per decilitre by using the portable HemoCue Hb
301 Analyser (HemoCue, Sweden). All children from every second HH in the selected cluster
list were tested.
The results from tables 23-1 to 23-5 show the overall total anaemia prevalence in children
whose ages ranged from 6-59 months for all Syrian refugees in Lebanonwas 21.0%; for
Syrian refugees in Bekaa: 13.9%; for Syrian refugees in North: 25.8%; for Syrian refugees in
the South of Lebanon: 23.4% and for Syrian refugees in Beirut & Mount-Lebanon: 21.2%.
The tables also show that the children between 6-23 months of age tended to be the most
affected by anaemia: 31.5% among all Syrian children aged from 6-23 months, 24.1% for the
same age group in Bekaa, 42.9% in the North, 30.8% in the South and 27.7% in Beirut and
Mount-Lebanon for the same age group. The children whose ages ranged from 6-23 months,
from the North of Lebanon, were affected by anaemia (more than 40%).
According to WHO classification and in conformity of UNHCR operational guidance, anaemia
prevalence between 20-39% is classified as a MODERATE public health significance and
that is not an indication of need for preventive interventions with MNPs.

71
Regarding the WHO classification and the UNHCR operational guidance, with the prevalence
of 21.0% of anaemia among all Syrian refugee children in Lebanon and considering the rate
of GAM in Lebanon (5.9%), the situation is acceptable and does not need a preventive
intervention with micro-nutrient supplementation.
Table 23-1: Prevalence of total anaemia, Anaemia categories, and mean haemoglobin
concentration in children 6-59 months of age and by age group - All Syrian refugees in Lebanon
6-59 months
n = 661*
6-23 months
n = 238
24-59 months
n = 421
Total Anaemia (Hb<11.0 g/dL) (139) 21.0%
(17.6-24.5 95% CI)
(75) 31.5%
(25.9-37.2 95% CI)
(64) 15.2%
(11.8-18.6 95% CI)
Mild Anaemia (Hb 10.0-10.9 g/dL) (109) 16.5%
(13.5-19.5 95% CI)
(57) 24.0%
(18.7-29.2 95% CI)
(52) 12.4%
(9.3-15.4 95% CI)
Moderate Anaemia (7.0-9.9 g/dL) (30) 4.5%
(2.9-6.2 95% CI)
(18) 7.6%
(4.1-11.0 95% CI)
(12) 2.9%
(1.3-4.4 95% CI)
Severe Anaemia (<7.0 g/dL) (0) 0% (0) 0% (0) 0%
Mean Hb (g/dL) (95% CI) [range]
11.9 g/dL
(11.8-12.0 95% CI)
[7.0, 15.7]
11.5 g/dL
(11.3-11.6 95% CI)
[8.6, 15.7]
12.1 g/dL
(12.0-12.2 95% CI)
[7.0, 15.6]
*2 children did not have information on age and are included in the anaemia analysis among 6-59 months, but not in age specific anaemia analysis.
Among all Syrian refugee children in Lebanon, children aged 6-23 months are more at risk
of being anaemic than children aged 24-59 months (X2: 24.217; p < 0.05).
Table 23-1-1 Prevalence of Moderate and Severe anaemia in children 6-59 months of age and by
age group, Syrian refugees in Lebanon
6-59 months
n = 661*
6-23 months
n = 238
24-59 months
n = 421
Moderate and Severe Anaemia
(Hb<10.0 g/dL)
(30) 4.5%
(2.9-6.2 95% CI)
(18) 7.6%
(4.1-11.0 95% CI)
(12) 2.9%
(1.3-4.3 95%
CI) *2 children did not have information on age and are included in the anaemia analysis among 6-59 months, but not in age specific anaemia analysis.

72
Table 23-2: Prevalence of total anaemia, Anaemia categories, and mean haemoglobin
concentration in children 6-59 months of age and by age group – Syrian refugees in Bekaa
6-59 months
n = 158*
6-23 months
n = 58
24-59 months
n = 98
Total Anaemia (Hb<11.0 g/dL) (22) 13.9%
(8.2-19.6 95% CI)
(14) 24.1%
(14.1-34.2 95% CI)
(8) 8.2%
(2.4-14.0 95%
CI)
Mild Anaemia (Hb 10.0-10.9 g/dL) (20) 12.7%
(7.6-17.7 95% CI)
(13) 22.4%
(12.6-32.2 95% CI)
(7) 7.1%
(1.7-12.6 95%
CI)
Moderate Anaemia (7.0-9.9 g/dL) (2) 1.3%
(0.0-3.1 95% CI)
(1) 1.7%
(0.0-5.4 95% CI)
(1) 1.0%
(0.0-3.2 95% CI)
Severe Anaemia (<7.0 g/dL) (0) 0% (0) 0% (0) 0%
Mean Hb (g/dL) (95% CI) [range]
12.2 g/dL
(12.0-12.4 95% CI)
[9.1, 15.7]
11.8 g/dL
(11.5-12.0 95% CI)
[9.1, 15.7]
12.5 g/dL
(12.2-12-7 95%
CI)
[9.7, 14.6] *2 children did not have information on age and are included in the anaemia analysis among 6-59 months, but not in age
specific anaemia analysis.
In Bekaa, Syrian refugee children aged 6-23 months are more at risk of being anaemic than
children aged 24-59 months (X2: 5.222; p < 0.05).
Table 23-2-1: Prevalence of Moderate and Severe anaemia in children 6-59 months of age and by
age group, Syrian refugees in Bekaa
6-59 months
n = 158*
6-23 months
n = 58
24-59 months
n = 98
Moderate and Severe Anaemia
(Hb<10.0 g/dL)
(2) 1.3%
(0.0-3.1 95% CI)
(1) 1.7 %
(0.0-5.4 95% CI)
(1) 1.0%
(0.0-3.2 95% CI)
*2 children did not have information on age and are included in the anaemia analysis among 6-59 months, but not in age specific anaemia analysis.
Table 23-3: Prevalence of total anaemia, Anaemia categories, and mean haemoglobin
concentration in children 6-59 months of age and by age group – Syrian refugees in the North of Lebanon
6-59 months
n = 155
6-23 months
n = 63
24-59 months
n = 92
Total Anaemia (Hb<11.0 g/dL) (40) 25.8%
(16.9-34.7 95% CI)
(27) 42.9%
(30.3-55.4 95% CI)
(13) 14.1%
(6.0-22.2 95% CI)
Mild Anaemia (Hb 10.0-10.9 g/dL) (31) 20.0%
(11.8-28.2 95% CI)
(21) 33.3%
(19.7-47.0 95% CI)
(10) 10.9%
(4.6-17.1 95% CI)
Moderate Anaemia (7.0-9.9 g/dL) (9) 5.8%
(2.8-8.8 95% CI)
(6) 9.5%
(2.3-16.8 95% CI)
(3) 3.3%
(0.0-6.8 95% CI)
Severe Anaemia (<7.0 g/dL) (0) 0% (0) 0% (0) 0%
Mean Hb (g/dL) (95% CI) [range]
11.7 g/dL
(11.4-11.9 95% CI)
[8.6, 16.6]
11.1 g/dL
(10.9-11.4 95% CI)
[8.6, 14.7]
12.0 g/dL
(11.7-12.3 95% CI)
[9.2, 15.6]

73
In North, Syrian refugee children aged 6-23 months are more at risk of being anaemic than
children aged 24-59 months (X2: 16.117; p < 0.05).
Table 23-3-1 Prevalence of Moderate and Severe anaemia in children 6-59 months of age and by
age group, Syrian refugees in North of Lebanon
6-59 months
n = 155
6-23 months
n = 63
24-59 months
n = 92
Moderate and Severe Anaemia
(Hb<10.0 g/dL)
(9 ) 5.8%
(2.8-8.8 95% CI)
(6) 9.5%
(2.3-16.8 95% CI)
(3) 3.3%
(0.0-6.8 95% CI)
Table 23-4: Prevalence of total anaemia, Anaemia categories, and mean haemoglobin
concentration in children 6-59 months of age and by age group – Syrian refugees in South Lebanon
6-59 months
n = 145
6-23 months
n = 52
24-59 months
n = 93
Total Anaemia (Hb<11.0 g/dL) (34) 23.4%
(16.3-30.6 95% CI)
(16) 30.8%
(17.6-44.0 95% CI)
(18) 19.4%
(11.5-27.2 95% CI)
Mild Anaemia (Hb 10.0-10.9 g/dL) (25) 17.2%
(11.0-23.5 95% CI)
(9) 17.3%
(9.0-25.6 95% CI)
(16) 17.2%
(9.1-25.3 95% CI)
Moderate Anaemia (7.0-9.9 g/dL) (9) 6.2%
(1.5-10.9 95% CI)
(7) 13.5%
(2.8-24.1 95% CI)
(2) 2.2%
(0.0-5.2 95% CI)
Severe Anaemia (<7.0 g/dL) (0) 0% (0) 0% (0) 0%
Mean Hb (g/dL) (95% CI) [range]
11.7 g/dL
(11.6-11.9 95% CI)
[8.6, 14.4]
11.5 g/dL
(11.0-11.9 95% CI)
[8.6, 14.0]
11.9 g/dL
(11.7-12.1 95% CI)
[9.0, 14.4]
In the South, the difference between the prevalence of total anaemia in Syrian refugee
children aged 6-23 months and the prevalence of anaemia in children aged 24-59 months is
not statistically significant (X2: 2.421; p > 0.05).
Table 23-4-1 Prevalence of Moderate and Severe anaemia in children 6-59 months of age and by
age group, Syrian refugees in South of Lebanon
6-59 months
n = 145
6-23 months
n = 52
24-59 months
n = 93
Moderate and Severe
Anaemia (Hb<10.0 g/dL)
(9) 6.2%
(1.5-10.9 95% CI)
(7) 13.5%
(2.8-24.1 95% CI)
(2) 2.2%
(0.0-5.2 95%
CI)

74
Table 23-5: Prevalence of total anaemia, Anaemia categories, and mean haemoglobin
concentration in children 6-59 months of age and by age group – Syrian refugees in Beirut & Mount-Lebanon
6-59 months
n = 203
6-23 months
n = 65
24-59 months
n = 138
Total Anaemia (Hb<11.0 g/dL) (43) 21.2%
(15.3-27.1 95% CI)
(18) 27.7%
(17.9-37.5 95% CI)
(25) 18.1%
(12.4-23.8 95% CI)
Mild Anaemia (Hb 10.0-10.9 g/dL) (33) 16.3%
(11.3-21.2 95% CI)
(14) 21.5%
(12.7-30.4 95% CI)
(19) 13.8%
(8.8-18.8 95% CI)
Moderate Anaemia (7.0-9.9 g/dL) (10) 4.9%
(1.8-8.0 95% CI)
(4) 6.2%
(0.4-12.0 95% CI)
(6) 4.3%
(1.3-7.4 95% CI)
Severe Anaemia (<7.0 g/dL) (0) 0% (0) 0% (0) 0%
Mean Hb (g/dL) (95% CI) [range]
11.8 g/dL
(11.7-12.0 95% CI)
[7.0, 15.2]
11.8 g/dL
(11.7-12.0 95% CI)
[7.0, 15.2]
11.9 g/dL
(11.7-12.1 95% CI)
[7.0, 15.2]
In Beirut and Mount-Lebanon, the difference between the prevalence of total anaemia in
Syrian refugee children aged 6-23 months and the prevalence of anaemia in children aged
24-59 months is not statistically significant (X2: 2.427; p > 0.05).
Table 23-5-1 Prevalence of Moderate and Severe anaemia in children 6-59 months of age and by
age group, Syrian refugees in Beirut & Mount-Lebanon
6-59 months
n = 203
6-23 months
n = 65
24-59 months
n = 138
Moderate and Severe Anaemia
(Hb<10.0 g/dL)
(10) 4.9%
(1.8-8.0 95% CI)
(4) 6.2%
(0.4-12.0 95% CI)
(6) 4.3%
(1.3-7.4 95% CI)
C. Child morbidity
The prevalence of reported diarrhea, cough and fever during the two last weeks before data
collection among all Syrian refugees in Lebanon and among Syrian refugees in Bekaa, in
North, in South and in Beirut & Mount-Lebanon are presented in the table below.
Table 24: Prevalence of reported diarrhea, cough and fever in the two weeks prior to the interview
Target groups Diarrhea during the
last 2 weeks
Average duration of
Diarrhea Cough during the
last 2 weeks Fever during the
last 2 weeks
Bekaa Region 26.7%
(22.19 – 31.69) 4.83 days
33.1%
(28.26 – 38.39)
36.4%
(31.35 – 41.68)
North of Lebanon 33.3%
(28.88 – 38.09) 5.91 days 43.9%
(39.13 – 48.86
38.9%
(34.28 – 43.81)
South of Lebanon 23.6%
(19.29 – 28.53) 5.69 days
40.4%
(35.16 – 45.81)
35.8%
(30.78 – 41.21)
Beirut & Mount-Lebanon 17.2%
(14.0 – 20.88) 4.86 days 41.7%
(37.32 – 46.30)
26.6%
(22.75 – 30.80)
All Lebanon (Global data) 24.9%
(22.77 – 27.12) 5.39 days 40.1%
(37.70 – 42.65)
34.0%
(31.60 – 36.38)

75
In all Lebanon and in each of the 4 strata, mothers/caretakers of children less than 5 years
of age had reported more cases of diarrhea, cough and fever two weeks prior to the interview
date.
As for the occurrence of diarrhea during the last 2 weeks before the starting of the different
assessments, the findings showed that the highest rate was among the Syrian refugee
children in the North of Lebanon, where also the average duration of diarrhea was almost 6
days (5.91 days).The lowest rate of diarrhea during the last 2 weeks before the assessment
was observed in Beirut and Mount-Lebanon.
In comparison with last year’s findings, the rate of diarrhea during the last 2 weeks before the
onset of this year’s assessment was found to be lower than the diarrhea rate observed last
year (24.9% in 2013 compared to 40.2% in 2012). This difference may be due to the different
periods of data collection: in 2012, the assessment was done during the month of September,
in which highest incidents of diarrhea usually occur.
D. Children vaccination coverage
The data collection of the nutrition assessment including the vaccination data was done from
October 2nd to November 30th and the data collection in 110 localities or areas among 120
was done before the end of October. However, the last polio and measles campaign was
done from November 8th to 15th. In that case, a minor possible overlap in the polio campaign
activity versus data collection could have occurred in only 10 clusters (in Mount-Lebanon
Dahieh) x 10 households interviewed.
The findings of the assessment show that, for HH who had been in Lebanon for less than 12
months (by the time of data collection), 45.3% of their children received theirs vaccines in
Syria; this proportion was 31.1% among Syrian refugee HHs that have been in Lebanon for
1 year or more. However, for the HH that had spent 1 year or more in Lebanon, more children
received their immunization from the PHC Center (45.5% vs. 34.2%).

76
Table 25-1: Sources of immunization of children reported by mother or caregiver and by period stayed in Lebanon
Target groups
PHC Center Through MMU Private Dr Different places Only in Syra
Period stayed in Lebanon
< 1 year ≥ 1 year < 1 year ≥ 1 year < 1 year ≥ 1 year < 1 year ≥ 1 year < 1 year ≥ 1 year
Bekaa Region 32.0% 38.5% 1.2% 0.0% 0.0% 3.8% 26.1% 38.5% 40.7% 19.2%
North of Lebanon 35.7% 39.1% 0.7% 1.4% 0.7% 1.4% 13.6% 10.1% 49.3% 47.8%
South of Lebanon 40.0% 60.0% 0.0% 2.6% 0.0% 0.0% 20.6% 6.1% 39.4% 31.3%
Beirut & Mount-Lebanon 29.2% 42.1% 2.6% 4.0% 3.1% 0.4% 14.4% 24.7% 50.8% 28.7%
All Lebanon (Global data) 34.2% 45.5% 1.1% 2.9% 0.9% 0.8% 18.5% 19.7% 45.3% 31.1%
Table 25-2: Source of children’s immunization reported by mother/caregiver, by age of children
Target groups
PHC Center Through MMU Private Dr Different places Only in Syra
Age of children (0-23 months and 24-59 months)
< 2 years ≥ 2 years < 2 years ≥ 2 years < 2 years ≥ 2 years < 2 years ≥ 2 years < 2 years ≥ 2 years
Bekaa Region 45.8% 25.8% 2.8% 0.0% 1.9% 0.0% 33.6% 25.3% 15.9% 48.9%
North of Lebanon 57.3% 23.9% 1.5% 0.5% 1.5% 0.5% 15.3% 11.5% 24.4% 63.8%
South of Lebanon 72.6% 32.4% 0.0% 1.6% 0.0% 0.0% 12.4% 16.5% 15.0% 49.5%
Beirut & Mount-Lebanon 64.1% 21.3% 5.1% 2.4% 2.6% 1.0% 11.5% 24.8% 16.7% 50.3%
All Lebanon (Global data) 60.4% 25.2% 2.6% 1.3% 1.6% 0.5% 17.4% 19.8% 18.1% 53.2%
The findings of the assessment also show that, for HH who had children of less than 24
months of age, 60.4% immunized their children in PHC center and only 18.1% immunized
their children only in Syria. However, 20% of HH with children of less than 2 years of age
reported that they received vaccines from different places (PHC, MMU or Private Doctor).
Figure 7: Immunization of children – Doses of Polio

77
Figure 10 above shows that the coverage for Polio vaccine was higher for Syrian refugees in
Beirut and Mount-Lebanon. However, the coverage for the third dose was lower in Bekaa.
Figure 8: Measles and Vitamin A Supplementation
Usually the coverage of vitamin A supplementation and Measles vaccination is the same.
The results of the assessments however, showed that the coverage of Vitamin A
supplementation was very low in comparison with the coverage of Measles. This difference
could be explained by the fact that the surveyors did not show the samples of vitamin A
capsule to all mothers or to all caregivers. In addition, the nutrition data collection took place
just one month before Polio/ Vitamin A vaccination/ supplementation campaign.
E. Infant and young child feeding
When IYCF indicators are collected in nutritional surveys, it is not feasible to achieve a large
sample size, that would allow for some of the indicators to be estimated as precisely as
desired, especially the indicators that cover a very narrow age range (e.g. 12-15 months, 6-
8 months). Hence, trend analyses need to be interpreted with caution. Nevertheless, trend
analyses are useful for assessing the situation and major differences seen from year to year
should warrant further investigation.
For the global sample, with the sample of 1,200 HH, we were able to obtain interesting results
about IYCF for all Syrian refugee children whose ages ranged from 0-23 months. The tables
27-1 to 27-5 present the results about IYCF.
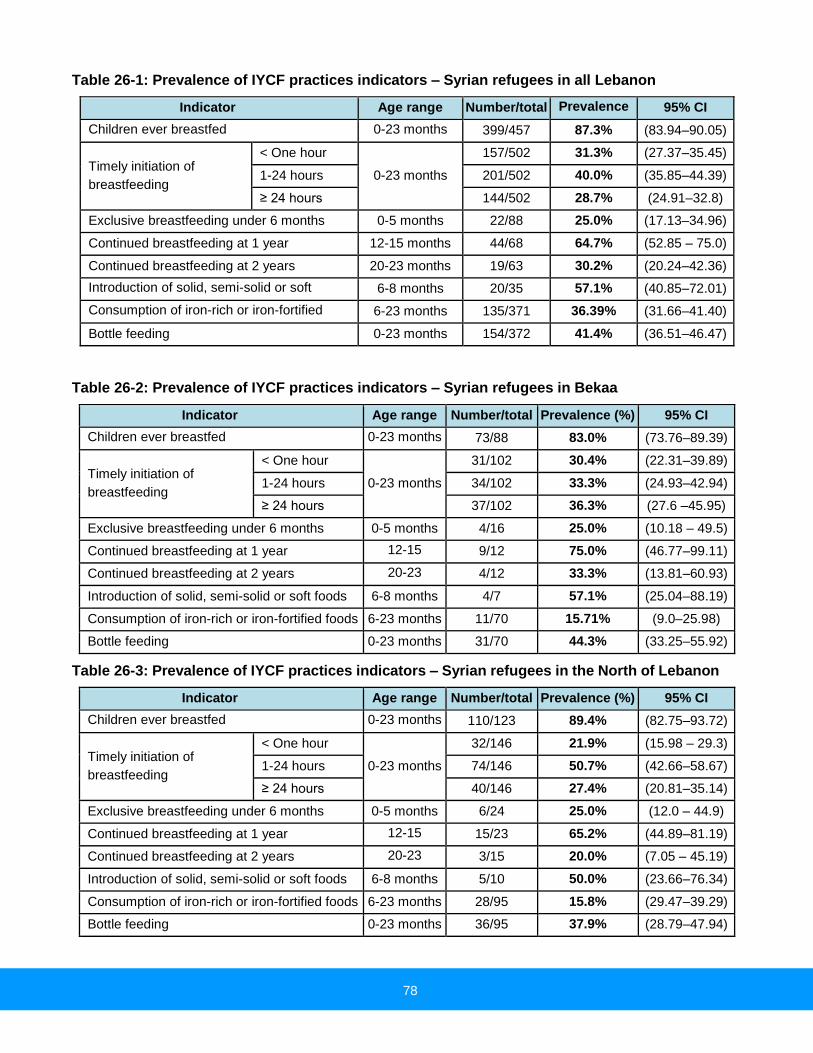
78
Table 26-1: Prevalence of IYCF practices indicators – Syrian refugees in all Lebanon
Indicator Age range Number/total Prevalence
(%)
95% CI
Children ever breastfed 0-23 months 399/457 87.3% (83.94–90.05)
Timely initiation of
breastfeeding
< One hour
0-23 months
157/502 31.3% (27.37–35.45)
1-24 hours 201/502 40.0% (35.85–44.39)
≥ 24 hours 144/502 28.7% (24.91–32.8)
Exclusive breastfeeding under 6 months 0-5 months 22/88 25.0% (17.13–34.96)
Continued breastfeeding at 1 year 12-15 months 44/68 64.7% (52.85 – 75.0)
Continued breastfeeding at 2 years 20-23 months 19/63 30.2% (20.24–42.36)
Introduction of solid, semi-solid or soft
foods
6-8 months 20/35 57.1% (40.85–72.01)
Consumption of iron-rich or iron-fortified
foods
6-23 months 135/371 36.39% (31.66–41.40)
Bottle feeding 0-23 months 154/372 41.4% (36.51–46.47)
Table 26-2: Prevalence of IYCF practices indicators – Syrian refugees in Bekaa
Indicator Age range Number/total Prevalence (%) 95% CI
Children ever breastfed 0-23 months 73/88 83.0% (73.76–89.39)
Timely initiation of
breastfeeding
< One hour
0-23 months
31/102 30.4% (22.31–39.89)
1-24 hours 34/102 33.3% (24.93–42.94)
≥ 24 hours 37/102 36.3% (27.6 –45.95)
Exclusive breastfeeding under 6 months 0-5 months 4/16 25.0% (10.18 – 49.5)
Continued breastfeeding at 1 year 12-15
months
9/12 75.0% (46.77–99.11)
Continued breastfeeding at 2 years 20-23
months
4/12 33.3% (13.81–60.93)
Introduction of solid, semi-solid or soft foods 6-8 months 4/7 57.1% (25.04–88.19)
Consumption of iron-rich or iron-fortified foods 6-23 months 11/70 15.71% (9.0–25.98)
Bottle feeding 0-23 months 31/70 44.3% (33.25–55.92)
Table 26-3: Prevalence of IYCF practices indicators – Syrian refugees in the North of Lebanon
Indicator Age range Number/total Prevalence (%) 95% CI
Children ever breastfed 0-23 months 110/123 89.4% (82.75–93.72)
Timely initiation of
breastfeeding
< One hour
0-23 months
32/146 21.9% (15.98 – 29.3)
1-24 hours 74/146 50.7% (42.66–58.67)
≥ 24 hours 40/146 27.4% (20.81–35.14)
Exclusive breastfeeding under 6 months 0-5 months 6/24 25.0% (12.0 – 44.9)
Continued breastfeeding at 1 year 12-15
months
15/23 65.2% (44.89–81.19)
Continued breastfeeding at 2 years 20-23
months
3/15 20.0% (7.05 – 45.19)
Introduction of solid, semi-solid or soft foods 6-8 months 5/10 50.0% (23.66–76.34)
Consumption of iron-rich or iron-fortified foods 6-23 months 28/95 15.8% (29.47–39.29)
Bottle feeding 0-23 months 36/95 37.9% (28.79–47.94)

79
Table 26-4: Prevalence of IYCF practices indicators – Syrian refugees in the South of Lebanon
Indicator Age range Number/total Prevalence (%) 95% CI
Children ever breastfed 0-23 months 92/101 91.1% (83.93–95.24)
Timely initiation of
breastfeeding
< One hour
0-23 months
32/108 29.6% (21.84–38.82)
1-24 hours 46/108 42.6% (33.58–52.01)
≥ 24 hours 30/108 27.8% (20.21–36.88)
Exclusive breastfeeding under 6 months 0-5 months 4/16 25.0% (10.18 – 49.5)
Continued breastfeeding at 1 year 12-15
months
7/13 53.8% (29.15 – 76.8)
Continued breastfeeding at 2 years 20-23
months
5/14 35.7% (16.34–61.23)
Introduction of solid, semi-solid or soft foods 6-8 months 4/7 57.1% (25.04–88.19)
Consumption of iron-rich or iron-fortified
foods
6-23 months 43/87 49.43% (39.17–59.74)
Bottle feeding 0-23 months 38/88 43.2% (33.33–53.6)
Table 26-5: Prevalence of IYCF practices indicators – Syrian refugees in Beirut and Mount-Lebanon
Indicator Age range Number/total Prevalence (%) 95% CI
Children ever breastfed 0-23 months 124/145 85.5% (78.88–90.33)
Timely initiation of
breastfeeding
< One hour
0-23 months
62/146 42.5% (34.75–50.58)
1-24 hours 47/146 32.2% (25.15–40.14)
≥ 24 hours 37/146 25.3% (18.98–32.97)
Exclusive breastfeeding under 6 months 0-5 months 8/32 25.0% (13.25–42.11)
Continued breastfeeding at 1 year 12-15
months
13/20 65.0% (43.29–81.88)
Continued breastfeeding at 2 years 20-23
months
7/22 31.8% (16.36–52.68)
Introduction of solid, semi-solid or soft foods 6-8 months 7/11 63.6% (35.38–84.84)
Consumption of iron-rich or iron-fortified foods 6-23 months 53/119 44.54% (34.92–53.50)
Bottle feeding 0-23 months 49/119 41.2% (32.75–50.16)
The findings of the different assessments showed that among Syrian refugees in all Lebanon,
more than 85% of children of 0-23 months of age were breastfed. More than 60% of mothers
initiated the breastfeeding in the first 23 hours after birth and 25% of children of 0-23 months
of age were exclusively breastfed. However, around 35% of children of 0-23 months of age
received bottle feedings.
Moreover, the findings of the assessments showed that more than 50% of children, whose
ages ranged from 0-23 months, were breastfed until the age of one and varying between the
stratums, 20-33% of children 0-23 months of age were breastfed until the age of 2.

80
The IYCF indicators have a link with acute malnutrition prevalence. The link between
complementary food introduction (the introduction of solid, semi-solid or soft foods), receiving
bottle feeding, length of breastfeeding (continued breastfeeding at 1 year and continued
breastfeeding at 2 years) and acute malnutrition, was analysed. The link is not statistically
significant for introduction of solid, semi-solid or soft foods (X2: 0.05, P> 0.05), for bottle
feeding (X2: 0.936, P> 0.05), for continued breastfeeding at 1 year (X2: 3.091, P> 0.05), and
for continued breastfeeding at 2 years (X2: 0.023, P> 0.05).
The non significant statistical link between the IYCF indicators can be explained by the fact
that, at the national level too, the indicators that cover a very narrow age range, the number
of children in some of the indicators is quite low and the number of children with actute
malnutrition is not very high.

81
6. Women 15-49 years
A. Physiological status
Tables 27-1 to 27-5 present the results of the different assessments about the physiological
status of women whose ages ranged between 15-49 years. For all Syrian refugees in
Lebanon, the results of the assessment showed that 12% of women 15-49 years old were
pregnant and 15.1% were lactating.The Syrian refugees in Bekaa presented the highest
proportion of lactating women (17.2%).
Table 27-1: Women physiological status and age – All Syrian refugees in Lebanon
Physiological status Number/total % of sample
Non-pregnant 1379/1896 72.7%
Pregnant 231/1896 12.2%
Lactating women 286/1896 15.1%
Age groups
15-19 years 356/1934 18.4%
20-24 years 440/1934 22.8%
25-29 years 396/1934 20.5%
30-34 years 300/1934 15.5%
35-39 years 192/1934 9.9%
40-44 years 148/1934 7.7%
45-49 years 102/1934 5.3%
Mean age (range) 27.8 years
Table 27-2: Women physiological status and age – Syrian refugees in Bekaa
Physiological status Number/total % of sample
Non-pregnant 276/395 69.9%
Pregnant 51/395 12.9%
Lactating women 68/395 17.2%
Age groups
15-19 years 69/399 17.3%
20-24 years 98/399 24.6%
25-29 years 71/399 17.8%
30-34 years 56/399 14.0%
35-39 years 43/399 10.8%
40-44 years 44/399 11.0%
45-49 years 18/399 4.5%
Mean age (range) 28.2 years

82
Table 27-3: Women physiological status and age –Syrian refugees in the North of Lebanon
Physiological status Number/total % of sample
Non-pregnant 412/558 73.8%
Pregnant 64/558 11.5%
Lactating women 82/558 14.7%
Age groups
15-19 years 110/576 19.1%
20-24 years 137/576 23.8%
25-29 years 122/576 21.2%
30-34 years 82/576 14.3%
35-39 years 52/576 9.0%
40-44 years 35/576 6.1%
45-49 years 37/576 6.4%
Mean age (range) 27.5 years
Table 27-4: Women physiological status and age –Syrian refugees in the South of Lebanon
Physiological status Number/total % of sample
Non-pregnant 306/425 72.0%
Pregnant 59/425 13.9%
Lactating women 60/425 14.1%
Age groups
15-19 years 84/435 19.3%
20-24 years 84/435 19.3%
25-29 years 82/435 18.9%
30-34 years 80/435 18.4%
35-39 years 49/435 11.3%
40-44 years 33/435 7.6%
45-49 years 23/435 5.3%
Mean age (range) 28.2 years

83
Table 27-5: Women physiological status and age – Syrian refugees in Beirut and Mount Lebanon
Physiological status Number/total % of sample
Non-pregnant 385/518 74.3%
Pregnant 57/518 11.0%
Lactating women 76/518 14.7%
Age groups
15-19 years 93/525 17.7%
20-24 years 121/525 23.0%
25-29 years 121/525 23.0%
30-34 years 82/525 15.6%
35-39 years 48/525 9.1%
40-44 years 36/525 6.9%
45-49 years 24/525 4.6%
Mean age (range) 27.6 years
The findings of the assessments presented in figures 9-1 to 9-5 showed that among all Syrian
refugees in Lebanon 12.4% of pregnant women and 10.3% of lactating women were 15 to
20 years old. However, in Beirut and Mount-Lebanon, the proportion of pregnant women and
lactating women whose age ranged from 15 to 20 years, were the highest group: 16.3% for
young pregnant women and 14.1% for young lactating women. Regarding the young
pregnant women, 7.0% of the pregnant women are under 18 years old (15-17 years).
However, the findings of different assessments showed that more than 80% of pregnant and
lactating Syrian refugee women in Lebanon were between 20 and 40 years of age.
Figure 9-1: Physiological status by age, women 15-49 years – All Syrian refugees in Lebanon

84
Figure 9-2: Physiological status by age, women 15-49 years – Syrian refugees in Bekaa
Figure 9-3: Physiological status by age, women 15-49 years – Syrian refugees in North
Figure 9-4: Physiological status by age, women 15-49 years – Syrian refugees in South
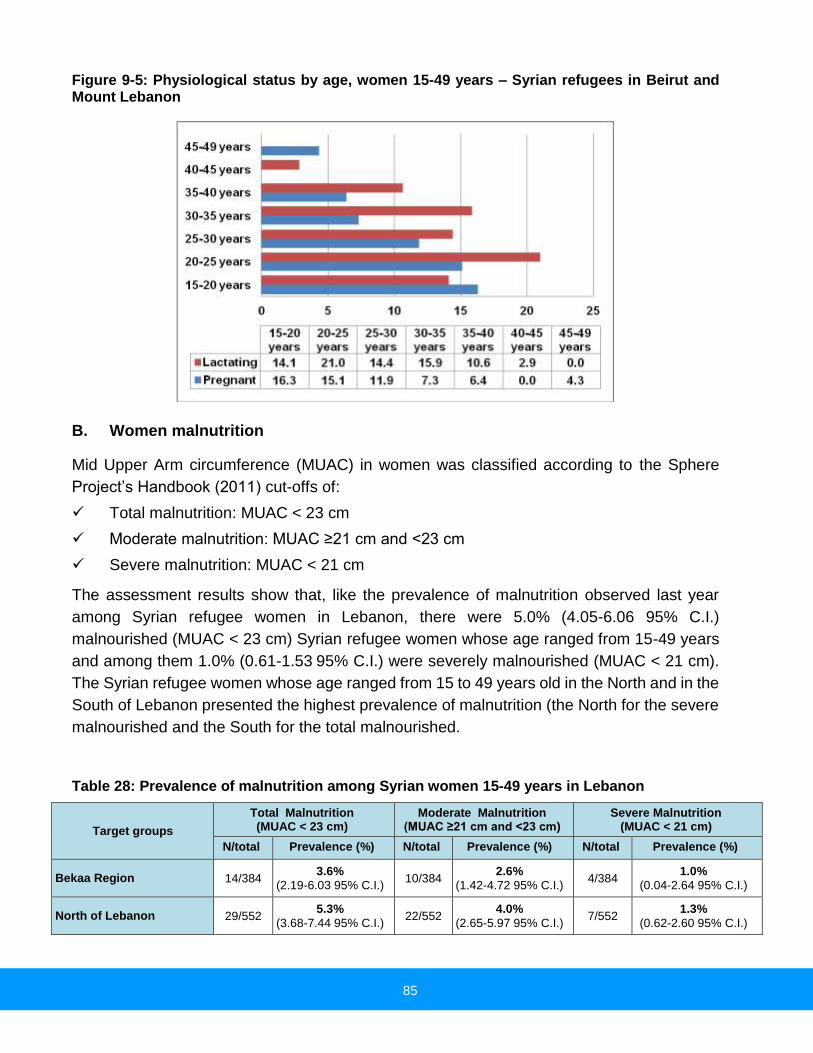
85
Figure 9-5: Physiological status by age, women 15-49 years – Syrian refugees in Beirut and Mount Lebanon
B. Women malnutrition
Mid Upper Arm circumference (MUAC) in women was classified according to the Sphere
Project’s Handbook (2011) cut-offs of:
Total malnutrition: MUAC < 23 cm
Moderate malnutrition: MUAC ≥21 cm and <23 cm
Severe malnutrition: MUAC < 21 cm
The assessment results show that, like the prevalence of malnutrition observed last year
among Syrian refugee women in Lebanon, there were 5.0% (4.05-6.06 95% C.I.)
malnourished (MUAC < 23 cm) Syrian refugee women whose age ranged from 15-49 years
and among them 1.0% (0.61-1.53 95% C.I.) were severely malnourished (MUAC < 21 cm).
The Syrian refugee women whose age ranged from 15 to 49 years old in the North and in the
South of Lebanon presented the highest prevalence of malnutrition (the North for the severe
malnourished and the South for the total malnourished.
Table 28: Prevalence of malnutrition among Syrian women 15-49 years in Lebanon
Target groups
Total Malnutrition (MUAC < 23 cm)
Moderate Malnutrition (MUAC ≥21 cm and <23 cm)
Severe Malnutrition (MUAC < 21 cm)
N/total Prevalence (%) N/total Prevalence (%) N/total Prevalence (%)
Bekaa Region 14/384 3.6%
(2.19-6.03 95% C.I.) 10/384
2.6%
(1.42-4.72 95% C.I.) 4/384
1.0%
(0.04-2.64 95% C.I.)
North of Lebanon 29/552 5.3%
(3.68-7.44 95% C.I.) 22/552
4.0%
(2.65-5.97 95% C.I.) 7/552
1.3%
(0.62-2.60 95% C.I.)
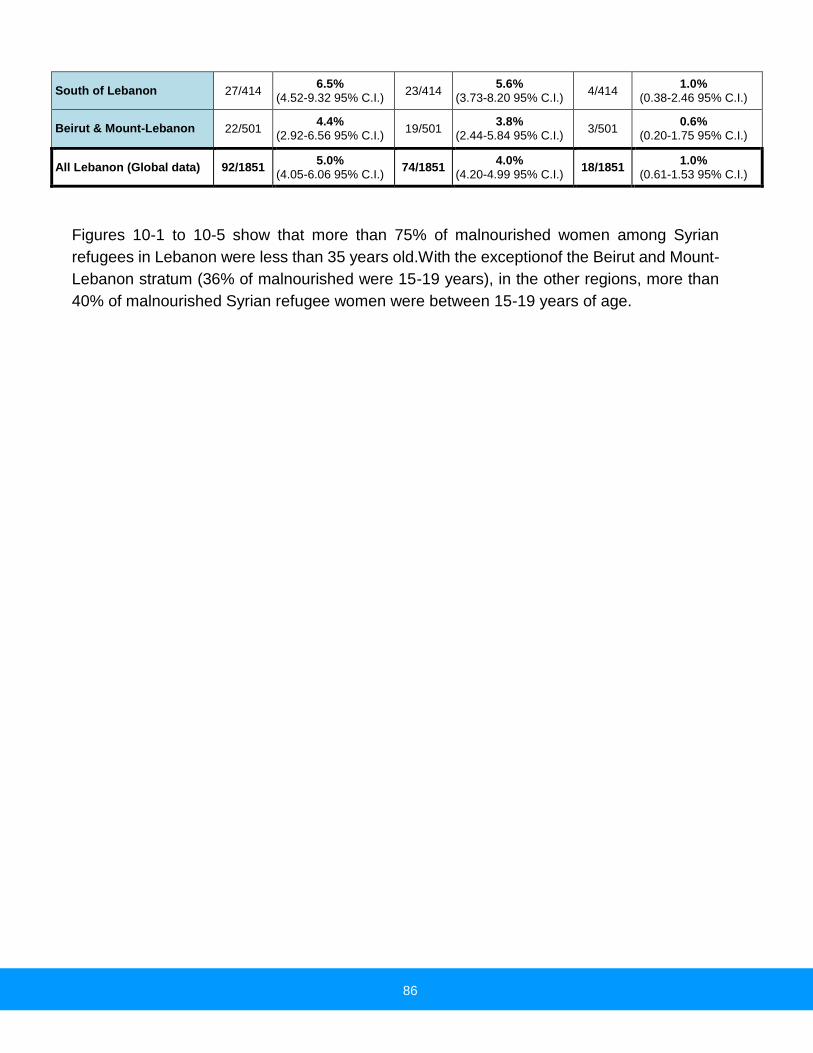
86
South of Lebanon 27/414 6.5%
(4.52-9.32 95% C.I.) 23/414
5.6%
(3.73-8.20 95% C.I.) 4/414
1.0%
(0.38-2.46 95% C.I.)
Beirut & Mount-Lebanon 22/501 4.4%
(2.92-6.56 95% C.I.) 19/501
3.8%
(2.44-5.84 95% C.I.) 3/501
0.6%
(0.20-1.75 95% C.I.)
All Lebanon (Global data) 92/1851 5.0%
(4.05-6.06 95% C.I.) 74/1851
4.0%
(4.20-4.99 95% C.I.) 18/1851
1.0%
(0.61-1.53 95% C.I.)
Figures 10-1 to 10-5 show that more than 75% of malnourished women among Syrian
refugees in Lebanon were less than 35 years old.With the exceptionof the Beirut and Mount-
Lebanon stratum (36% of malnourished were 15-19 years), in the other regions, more than
40% of malnourished Syrian refugee women were between 15-19 years of age.
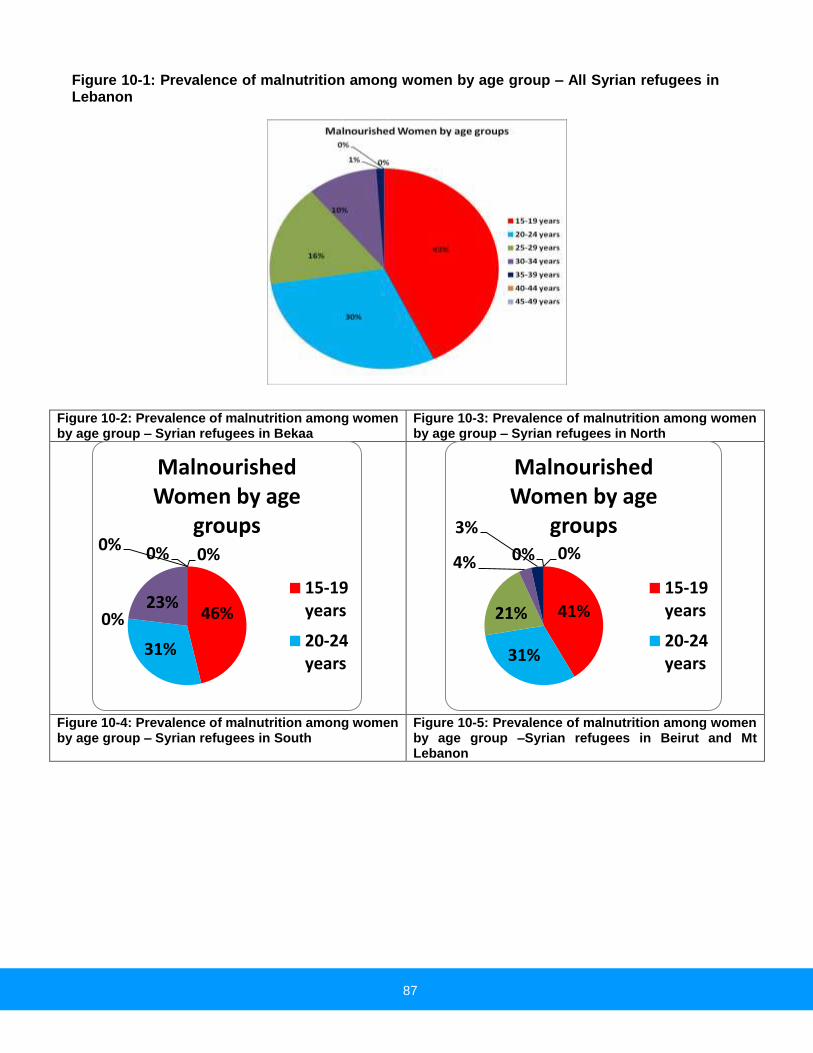
87
Figure 10-1: Prevalence of malnutrition among women by age group – All Syrian refugees in Lebanon
Figure 10-2: Prevalence of malnutrition among women by age group – Syrian refugees in Bekaa
Figure 10-3: Prevalence of malnutrition among women by age group – Syrian refugees in North
Figure 10-4: Prevalence of malnutrition among women by age group – Syrian refugees in South
Figure 10-5: Prevalence of malnutrition among women by age group –Syrian refugees in Beirut and Mt Lebanon
46%
31%
0%23%
0% 0% 0%
Malnourished Women by age
groups
15-19years
20-24years
41%
31%
21%
4%
3%
0% 0%
Malnourished Women by age
groups
15-19years
20-24years
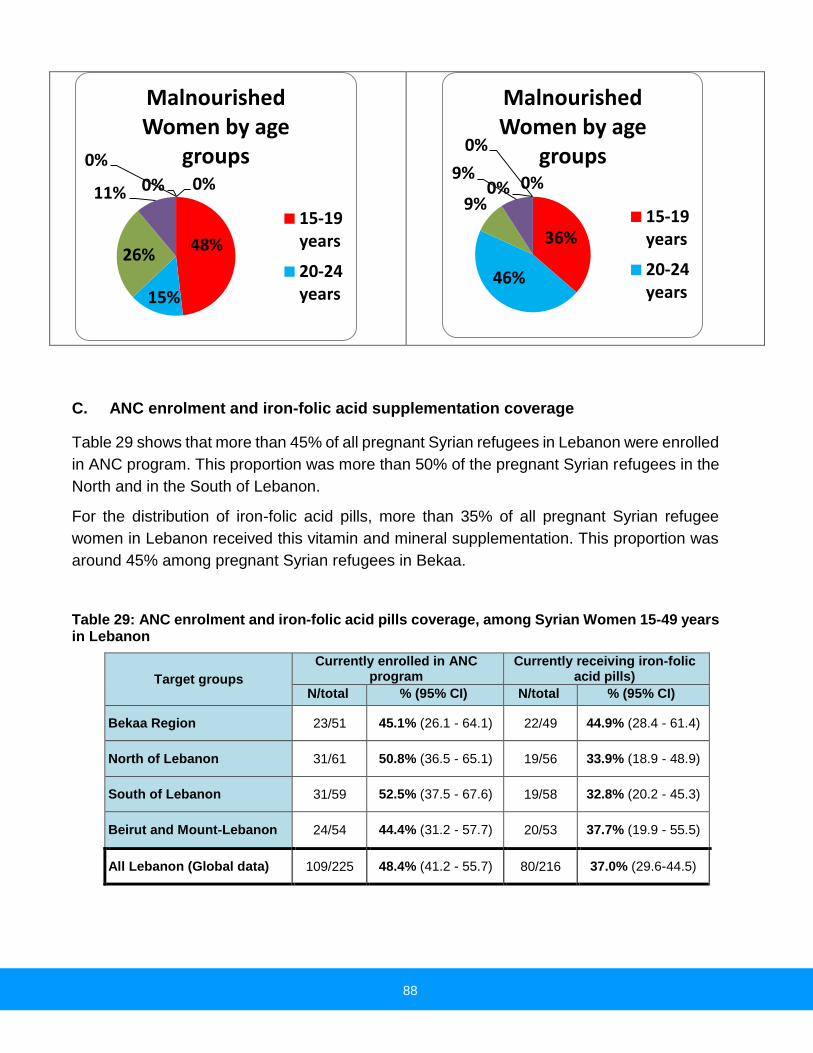
88
C. ANC enrolment and iron-folic acid supplementation coverage
Table 29 shows that more than 45% of all pregnant Syrian refugees in Lebanon were enrolled
in ANC program. This proportion was more than 50% of the pregnant Syrian refugees in the
North and in the South of Lebanon.
For the distribution of iron-folic acid pills, more than 35% of all pregnant Syrian refugee
women in Lebanon received this vitamin and mineral supplementation. This proportion was
around 45% among pregnant Syrian refugees in Bekaa.
Table 29: ANC enrolment and iron-folic acid pills coverage, among Syrian Women 15-49 years in Lebanon
Target groups
Currently enrolled in ANC program
Currently receiving iron-folic acid pills)
N/total % (95% CI) N/total % (95% CI)
Bekaa Region 23/51 45.1% (26.1 - 64.1) 22/49 44.9% (28.4 - 61.4)
North of Lebanon 31/61 50.8% (36.5 - 65.1) 19/56 33.9% (18.9 - 48.9)
South of Lebanon 31/59 52.5% (37.5 - 67.6) 19/58 32.8% (20.2 - 45.3)
Beirut and Mount-Lebanon 24/54 44.4% (31.2 - 57.7) 20/53 37.7% (19.9 - 55.5)
All Lebanon (Global data) 109/225 48.4% (41.2 - 55.7) 80/216 37.0% (29.6-44.5)
48%
15%
26%
11%
0%
0% 0%
Malnourished Women by age
groups
15-19years
20-24years
36%
46%
9%
9%0%
0%
0%
Malnourished Women by age
groups
15-19years
20-24years

89
D. Anaemia results for women 15-49 years
For women 15 to 49 years old, the anaemia assessment was done for non pregnant women.
All non pregnant women of 15 to 49 years old from every second HH were tested.
The Haemoglobin concentration was measured by a capillary blood sample taken from the
fingertip and recorded to the closest gram per decilitre by using the portable HemoCue Hb
301 Analyser (HemoCue, Sweden).
Table 30: Prevalence of Anaemia and Haemoglobin concentration in non-pregnant women of reproductive age (15-49 years) – Syrian refugees in Lebanon
Anaemia in non-pregnant women of reproductive age (15-49 years)
All Syrian refugees in Lebanon n = 785
All Syrian refugees in
Bekaa n = 158
All Syrian refugees in the
North of Lebanon n = 220
All Syrian refugees in the
South of Lebanon n = 178
All Syrian refugees in
Beirut & Mount-
Lebanon n = 229
Total Anaemia (<12.0 g/dL)
(205) 26.1% (23.2-29.0 95%
CI)
(29) 18.4% (12.6-24.1 95%
CI)
(61) 27.7% (22.3-33.2 95%
CI)
(48) 27.0% (20.0-34.2 95%
CI)
(67) 29.3% (24.0-34.6 95%
CI)
Mild Anaemia (11.0-11.9 g/dL)
(108) 13.8% (11.3-16.2 95%
CI)
(16) 10.1% (5.2-15.0 95% CI)
(30) 13.6% (8.7-18.5 95% CI)
(25) 14.0% (7.4-20.7 95% CI)
(37) 16.2% (12.0-20.3 95%
CI)
Moderate Anaemia (8.0-10.9 g/dL)
(92) 11.7% (9.7-13.8 95% CI)
(12) 7.6% (3.8-11.4 95% CI)
(31) 14.1% (9.8-18.4 95% CI)
(21) 11.8% (7.7-16.0 95% CI)
(28) 12.2% (8.1-16.3 95% CI)
Severe Anaemia (<8.0 g/dL)
(5) 0.6% (0.1-1.2 95% CI)
(1) 0.6% (0.0-2.0 95% CI)
(0) 0% (2) 1.1%
(0.0-2.7 95% CI) (2) 0.9%
(0.0-2.1 95% CI)
Mean Hb (g/dL) (95% CI) [range]
12.7 g/dL (12.6-12.8 95%
CI) [6.5, 17.9]
13.3 g/dL (13.0-13.5 95%
CI) [7.8, 17.1]
12.6 g/dL (12.4-12.7 95%
CI) [8.6, 15.4]
12.6 g/dL (12.4-12.8 95%
CI) [6.5, 16.3]
12.5 g/dL (12.3-12.7 95%
CI) [7.2, 17.9]
The results from table 30 show the overall Total Anaemia prevalence for non-pregnant
women of reproductive age (15-49 years) which were, for all Syrian refugees in Lebanon:
26.1%; for Syrian refugees in Bekaa: 18.4%; for Syrian refugees in North: 27.7%; for Syrian
refugees in the South of Lebanon: 27.0% and for Syrian refugees in Beirut and Mount-
Lebanon: 29.3%.
The findings of the different assessments showed that the non-pregnant Syrian refugee
women of reproductive age (15-49 years) who lived in Beirut and Mount-Lebanon had the
highest anaemia incidences and those who lived in Bekaa had the fewest anaemia
incidences.

90
According to WHO classification and in conformity of UNHCR operational guidance, anaemia
prevalence between 20-39% is classified as a MODERATE public health significance and
that is not an indication of need for preventive interventions with MNPs.
Regarding the WHO classification and the UNHCR operational guidance, with the prevalence
of 26.1% of anaemia among all Syrian refugee women of reproductive age in Lebanon, the
situation is acceptable and does not need a preventive intervention with micro-nutrient
supplementation.
IX. Results - household level – wash
1. WASH
The inclusion of the basic WASH module in the nutrition assessment provided key information
for planning interventions to address public health concerns and to ensure that basic rights
are upheld. Poor water, sanitation and hygiene have serious consequences for the health
and nutrition status of people.
All households (UNHCR registered) randomly selected, responded on questions about water,
sanitation and hygiene. This module of the nutrition assessment report presents the key
findings.
Table 31: WASH quality - Syrian refugees in Lebanon
Target groups
Proportion of HH using an improved drinking water
source
Proportion of HH that say they are satisfied with their drinking water supply
N/total % (95% CI) N/total % (95% CI)
Bekaa Region 137/245 55.92% (49.66 – 62.0) 155/245 63.3% (57.07–69.06
North of Lebanon 230/323 71.21 (66.05 – 75.88) 211/324 65.1% (59.78 – 70.1)
South of Lebanon 137/262 52.29 (46.25 – 58.26) 181/262 69.1% (63.24 – 74.37)
Beirut and Mount-Lebanon 79/325 24.31 (19.96 – 29.26) 243/325 74.8% (69.78–79.18)
All Lebanon (Global data) 583/1155 50.48 (47.6 – 53.36) 790/1156 68.3% (65.6 – 70.9)
The findings presented in table 32 show that more than 60% of HH surveyed were satisfied
with their drinking water supply; 75% of the Syrian refugee participants in Beirut and Mount-
Lebanon were satisfied with their drinking water supply. The table indicates that more than
50% of Syrian refugee HH used the improved drinking water supply and the three main
reasons for dissatisfaction about the water supply were: the bad quality of water, having to
pay for water (cost) and not enough water (quantity) for personal hygiene.

91
Figure 11-1: Proportion of HH that said they are satisfied with the drinking water supply
Figure 11-1: Main reason for dissatisfaction among households not satisfied with the water supply
About sanitation (toilet), the findings of the different assessments show that:
77.5% of Households used an improved excreta disposal facility;
14% of the HH used a shared family toilet;
16.4% of the HH used the communal toilet;

92
Only 4% of the HH with children under 3 years old, disposed feces safely and 92.8%
discarded into garbage.
The distinction between throwing the used dipper in garbage or directly throwing the feces in
the garbage was not made (it was not clear in the modality how to dispose the feces by
throwing it into the garbage). Due to this limitation, probably, the proportion of HH that
disposed feces by throwing it directly into the garbage could be high, but this result has to be
interpreted with caution, and the situation needs more investigation.
Figure 12: Proportion of HH with children under 3 years old whose (last) stools
The link between the satisfaction about the drinking water supply, the kind of toilet used
(improved or unimproved) and acute malnutrition, was analysed. The link is not statistically
significant for the satisfaction with the drinking water supply (X2: 0.056, P> 0.05) and for the
kind of toilet used (improved or unimproved) (X2: 5.300, P> 0.05). However, the analysis of
the link between the same WASH indicators and the prevalence of diarrhea showed that the
link between the kind of toilet used (improved or unimproved) and the prevalence of diarrhea
is statistically significant (X2: 17.869, P< 0.05). However, the relationship between the
satisfaction on the drinking water supply and the prevalence of diarrhea is not statistically
significant (X2: 3.187, P> 0.05 – p=0.074).

93
Table 32: Different WASH indicators - Syrian refugees in Lebanon
SYRIAN REFUGEES NUTRITION ASSESSMENT 2013 Classification of public health
significance or target (where
applicable
Date of Assessment October 2nd to November 30th 2013
Assessment area All Lebanon Bekaa North South Beirut Mont-Leb
N/Total % (95%CI) N/Total % (95%CI) N/Total % (95%CI) N/Total % (95%CI) N/Total % (95%CI)
WASH
Water
Principal
Main Source
of drinking
water
Water tap/water
network (under 2H/day) 100/1155
8.7%
(7.17 – 10.47) 27/245
11.0%
(7.68 – 15.56) 9/323
2.8%
(1.48 – 5.21) 34/262
13.0%
(9.44 – 17.59) 30/325
9.2%
(6.54 – 12.87)
Water tap/water
network (More than
2H/day)
273/1155 23.6%
(21.23–26.18) 58/245
23.7%
(18.78–29.37) 84/323
26.0%
(21.53 – 31.06) 92/262
35.1%
(29.58 – 41.07) 39/325
12.0%
(8.9 – 15.98)
Small Quantity
purchased 351/1155
30.4%
(27.81–33.15) 43/245
17.6%
(13.3 – 22.8) 43/323
13.3%
(10.03 – 17.45) 71/262
27.1%
(22.08 – 32.78) 194/325
59.7%
(54.27–64.88)
Public standpipe 106/1155 9.2%
(7.65 – 10.98) 21/245
8.6%
(5.67 – 12.75) 50/323
15.5%
(11.94 – 19.83) 17/262
6.5%
(4.09 – 10.15) 18/325
5.5%
(3.53 – 8.59)
Protected borehole/well 136/1155 11.8%
(10.04–13.76) 40/245
16.3%
(12.23–21.47) 66/323
20.4%
(16.39 – 25.16) 18/262
6.9%
(4.39 – 10.6) 12/325
3.7%
(2.12 – 6.34)
Principal
Main Source
of cooking
and washing
water
Water tap/water
network (under 2H/day) 166/1154
14.4%
(12.47–16.52) 24/245
9.8%
(6.67 – 14.17) 13/322
4.0%
(2.38 – 6.79) 54/262
20.6%
(16.15 – 25.92) 75/325
23.1%
(18.83–27.96)
Water tap/water network
(More than 2H/day) 472/1154
40.9%
(3.81 – 43.76) 66/245
26.9%
(21.77–32.82) 128/322
39.8%
(34.56 – 45.19) 135/262
51.5%
(45.5 – 57.52) 143/325
44.0%
(38.7 – 49.44)
Small Quantity
purchased 71/1154
6.2%
(4.9 – 7.69) 27/245
11.0%
(7.68 – 15.56) 12/322
3.7%
(2.15 – 6.4) 13/262
5.0%
(2.78 – 8.53) 19/325
5.8%
(3.78 – 8.95)
Protected borehole/well 235/1154 20.4%
(18.14–22.78) 56/245
22.9%
(18.04–28.51) 84/322
26.1%
(21.6 – 31.15) 33/262
12.6%
(9.11 – 17.17) 62/325
19.1%
(15.18– 23.7)
Unprotected
borehole/well 71/1154
6.2%
(4.9 – 7.69) 28/245
11.4%
(8.03 – 16.02) 31/322
9.6%
(6.87 – 13.34) 7/262
2.7%
(0.13 – 5.41) 5/325
1.5%
(0.66 – 3.55)
Proportion of HH with water storage
capacity 790/1156
68.3%
(65.6 – 70.9) 155/245
63.3%
(57.07–69.06) 211/324
65.1%
(59.78 – 70.1) 181/262
69.1%
(63.24 – 74.37) 243/325
74.8%
(69.78–79.18)
Volume of
water storage
capacity
Less than 500 Liters 214/769 27.8%
(24.78–31.1) 37/152
24.3%
(18.21–31.74) 55/204
27.0%
(21.34 – 33.43) 46/180 25.6% 76/233 32.6%
500 – 1,000 Liters 359/769 46.7%
(43.18–50.21) 63/152
41.4%
(33.92–49.4) 99/204
48.5%
(41.76 – 55.35) 93/180 51.7% 104/233 44.6%

94
SYRIAN REFUGEES NUTRITION ASSESSMENT 2013 Classification of public health
significance or target (where
applicable
Date of Assessment October 2nd to November 30th 2013
Assessment area All Lebanon Bekaa North South Beirut Mont-Leb
N/Total % (95%CI) N/Total % (95%CI) N/Total % (95%CI) N/Total % (95%CI) N/Total % (95%CI)
WASH
1,000 – 3,000 Liters 176/769 22.9%
(20.06–25.99) 46/152
30.3%
(23.52–37.98) 44/204
21.6%
(16.48 – 27.71) 37/180 20.6% 49/233 21.0%
More than 3,000 Liters 20/769 2.6%
(1.69 – 3.98) 6/152
3.9%
(1.82 – 8.35) 6/204
2.9%
(1.35 – 6.27) 4/180 2.2% 4/233 1.7%
Proportion of HH that say they are
satisfied with drinking water supply 575/1156
49.7%
(46.86–52.62) 110/245
44.9%
(38.8 – 51.16) 171/324
52.8%
(47.34 - 58.15) 145/262 55.3% 149/325 45.8%
Reasons for
none
satisfaction
with drinking
water supply
Not enough for
adequate personal
hygiene of children
147/592 24.8%
(21.52–28.46) 51/136
37.5%
(29.81–45.87) 51/156
32.7%
(25.82 – 40.39) 20/116 17.2% 25/184 13.6%
Have to pay for water –
Cost 126/592
21.3%
(18.17–24.76) 26/136
19.1%
(13.4 – 26.54) 22/156
14.1%
(9.5 – 20.43) 27/116 23.3% 51/184 27.7%
Bad Taste 21/592 3.5%
(2.33 – 5.37) 4/136
2.9%
(1.15 – 7.32) 6/156
3.8%
(1.78 – 8.14) 3/116 2.6% 8/184 4.3%
Bad Quality of Water 199/592 33.6%
(29.92–37.51) 51/136
37.5%
(29.81–45.87) 55/156 35.3% 42/116 36.2% 51/184 27.7%
Proportion of HH that say they have
access to soap and hygiene products 686/1153
59.5%
(56.8–62.46) 152/245
62.0%
(55.82–67.89) 219/324 67.6% 147/261 56.3% 168/323 52.0%
Proportion of HH by kind of toilet facility they use
Traditional pit latrine/without slab/open pit
228/1155 19.7%
(17.55–22.13) 83/245
33.9% (28.24–40.01)
82/325 25.2% 41/261 15.7% 22/324 6.8%
Open air (Bush, stream)/Corner place in the compound
27/1155 2.3%
(1.61 – 3.38) 18/245
7.3% (4.7 – 11.32)
5/325 1.5% 4/261 1.5% 0 0%
Improved latrine with cement slab 403/1155 34.9%
(32.2 – 37.68) 72/245
29.4% (24.04–35.38)
119/325 36.6% 109/261 41.8% 103/324 31.8%
Flush Latrine 492/1155 42.6%
(39.78–45.47) 70/245
28.6% (23.28–34.52)
116/325 35.7% 107/261 41.0% 199/324 61.4%
No Facility, Field, Bush, Plastic bag 5/1155 0.4%
(0.18 – 1.01) 2/245
0.8% (0.23 – 2.93)
3/325 0.9% 0 0% 0 0%

95
SYRIAN REFUGEES NUTRITION ASSESSMENT 2013 Classification of public health
significance or target (where
applicable
Date of Assessment October 2nd to November 30th 2013
Assessment area All Lebanon Bekaa North South Beirut Mont-Leb
N/Total % (95%CI) N/Total % (95%CI) N/Total % (95%CI) N/Total % (95%CI) N/Total % (95%CI)
WASH
Proportion of HH shared the kind of toilet facility they use
Not shared 796/1145 69.5%
(66.79–72.12) 157/243
64.6% (58.41–70.35)
220/321 68.5% 188/257 73.2% 231/324 71.3
Shared with 1 HH 161/1145 14.1%
(12.17–16.19) 33/243
13.6% (9.84 – 18.46)
44/321 13.7% 34/257 13.2% 50/324 15.4%
Public Toilet 15/1145 1.3%
(0.8 – 2.15) 4/243
1.6% (0.64 – 4.16)
5/321 1.6% 1/257 0.4% 5/324 1.5%
Communal toilet (shared with 2 HH or more)
173/1145 15.1%
(13.15 – 17.3) 49/243
20.2% (15.6 – 25.65)
52/321 16.2% 34/257 13.2% 38/324 11.7%
Proportion of HH by how they disposed the stools of their child under 3 years old
Child used toilet 25/642 3.9%
(7.68 – 15.79) 10/138
7.2% (3.99 – 12.83)
2/176 1.1% 6/138 4.3% 7/190 3.7%
Put/rinsed into toilet 1/642 0.2%
(0.03 – 0.88) 0 0% 0 0% 1/138 0.7% 0 0%
Thrown into garbage 596/642 92.8%
(90.57–94.58) 121/138
87.7% (81.16–92.16)
168/176 95.5% 127/138 92.0% 180/190 94.7%
Put/rinsed into drain or ditch 6/642 0.9%
(0.43 – 2.02) 3/138
2.2% (0.74 – 6.19)
2/176 1.1% 1/138 0.7% 0 .0%
Other 14/642 2.2%
(1.3 – 3.63) 4/138
2.9% (1.13 – 7.22)
4/176 2.3% 3/138 2.2% 3/190 1.6%
96
Limitations
Poor quality of age data for children U5 years: Considering the inaccuracies in
birth registration (date of birth has been changed), there were challenges in age
documentation among children 6-59 months of age. Due to this limitation and although
an event calendar was used by the teams to ascertain age, stunting and underweight
results were to be interpreted with caution because z-scores for height-for-age (and
weight for age) require accurate ages to be within two weeks of exact birth date
(CDC/WFP: A manual: Measuring and Interpreting Mortality and Malnutrition, 2005).
The distinction between to dispose the used diaper in garbage or to dispose
directly the feces in the garbage was not made (it was not clear in the modality
how to dispose the feces by throwing it into the garbage). Due to this limitation,
probably, the proportion of HH that they disposed feces by throwing it directly into the
garbage could be high but this result has to be interpreted with caution, and the
situation needs more investigation.
Sample had not covered the unregistered Syrian families: The analysis only
included those who are part of aid programs (registered by UNHCR). Households that
were not registered or with incorrect information were not represented in this
assessment.
The questionnaire was heavy to administrate due to the needs of different UN
agencies
Coverage of Vitamin A supplementation: Enumerators had Vitamin A capsules.
However the surveyors did not show the samples of the vitamin A capsule to all
mothers or to all caregivers.

97
Discussion
For Syrian refugees in different strata (Bekaa, North, South and Beirut and Mount-Lebanon)
and in all Lebanon, the different nutrition assessments covered more than 94% of the
targeted number of Syrian refugees’ households. For the different assessments, the overall
sex ratio was around 1.0 (sex ratio should be between 0.8 - 1.2), which confirms that both
sex were equally distributed and well represented and that there was no bias in terms of
sampling girls or boys.
For children under 5 years old, in each stratum and globally the assessment covered more
than 140% of the targeted sample. Among all the samples surveyed, the average size of HH
was 7.6 people and only 13% of the HH were female headed. These 2013 Assessment
findings are higher than the average size of family (6.2 people) and lower than the 20%
female headed HH, observed in 2012.
The findings of the assessment show that 88% of HH reported the mother as the person
who takes care of the children. However, 22% of all HH surveyed said that they take care of
children under 18 years old who are not their children.
1. Nutritional status of young children
The close supervision and the daily data entry of anthropometric measurements combined
with the daily feed-back to assessment teams on the data quality enabled achievement of
valid anthropometric data for children under 5 years old (tables 22-1 to 22-5).
Table 33: Prevalence of malnutrition compared to UNICEF SOWC, 2012 and FHS 2009
SURVEY Wasting
(GAM rate)
Total
Underweight rate
Total
Stunting rate
Syrian refugees in Bekaa
communities – October 2013 4.5 %
(2.3 – 8.3) 2.4 %
(1.0 - 5.9) 21.1 %
(15.7 - 27.6)
Syrian refugees in The North –
October 2013 3.9 %
(2.5 – 6.1) 3.1 %
(1.8 – 5.2) 20.0 %
(15.6 – 25.3)
Syrian refugees in The South –
October 2013 0.3 %
(0 – 2.6) 3.3 %
(1.9 – 5.7) 20.8 %
(16.3 – 26.1)
Syrian refugees in Beirut and
Mount-Lebanon – October and
November 2013
0.5 % (0.1 – 2.1)
2.2 % (1.0 - 5.0)
14.1 % (10.8 – 18.1)
All Syrian refugees in Lebanon –
October and November 2013 2.2 %
(1.5 – 3.3) 2.6 %
(1.9 – 3.6)
18.6 %
(16.4 – 21.1)
All Syrian refugees in Lebanon –
September 2012 4.4 %
(2.6 - 7.3) 3.1 %
(1.9 - 4.9) 12.2 %
(9.2 - 16.1)
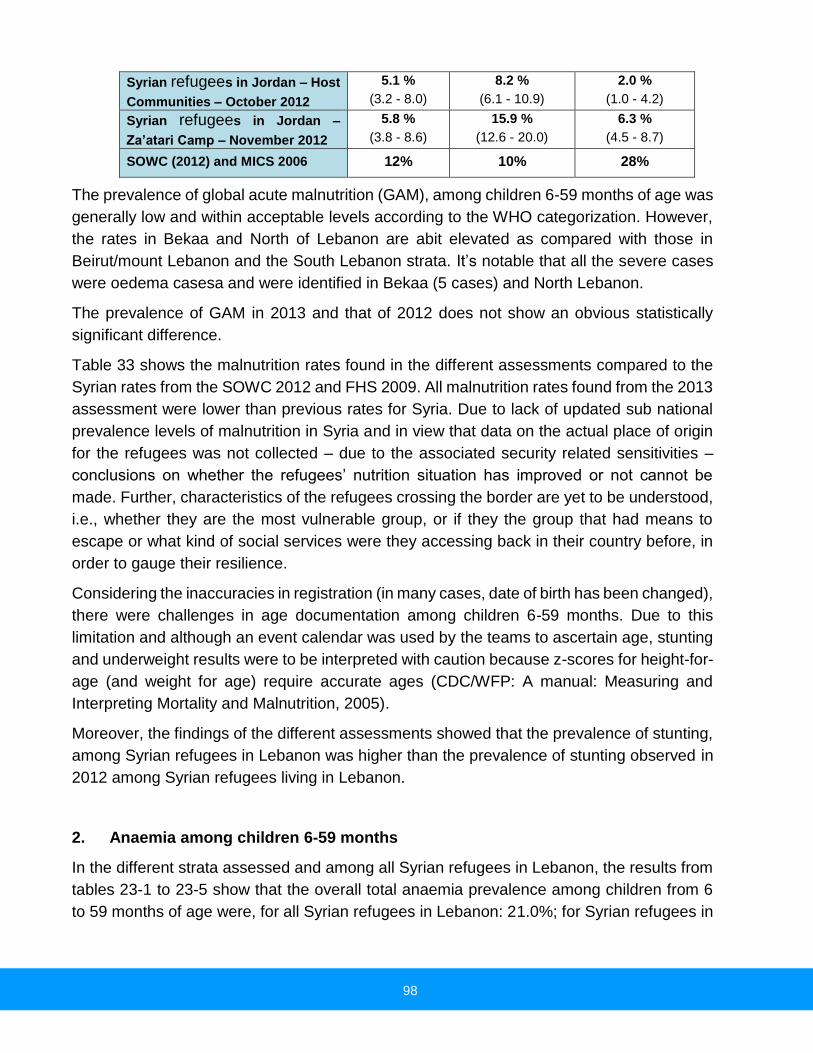
98
Syrian refugees in Jordan – Host
Communities – October 2012
5.1 %
(3.2 - 8.0)
8.2 %
(6.1 - 10.9)
2.0 %
(1.0 - 4.2)
Syrian refugees in Jordan –
Za’atari Camp – November 2012
5.8 %
(3.8 - 8.6)
15.9 %
(12.6 - 20.0)
6.3 %
(4.5 - 8.7)
SOWC (2012) and MICS 2006 12% 10% 28%
The prevalence of global acute malnutrition (GAM), among children 6-59 months of age was
generally low and within acceptable levels according to the WHO categorization. However,
the rates in Bekaa and North of Lebanon are abit elevated as compared with those in
Beirut/mount Lebanon and the South Lebanon strata. It’s notable that all the severe cases
were oedema casesa and were identified in Bekaa (5 cases) and North Lebanon.
The prevalence of GAM in 2013 and that of 2012 does not show an obvious statistically
significant difference.
Table 33 shows the malnutrition rates found in the different assessments compared to the
Syrian rates from the SOWC 2012 and FHS 2009. All malnutrition rates found from the 2013
assessment were lower than previous rates for Syria. Due to lack of updated sub national
prevalence levels of malnutrition in Syria and in view that data on the actual place of origin
for the refugees was not collected – due to the associated security related sensitivities –
conclusions on whether the refugees’ nutrition situation has improved or not cannot be
made. Further, characteristics of the refugees crossing the border are yet to be understood,
i.e., whether they are the most vulnerable group, or if they the group that had means to
escape or what kind of social services were they accessing back in their country before, in
order to gauge their resilience.
Considering the inaccuracies in registration (in many cases, date of birth has been changed),
there were challenges in age documentation among children 6-59 months. Due to this
limitation and although an event calendar was used by the teams to ascertain age, stunting
and underweight results were to be interpreted with caution because z-scores for height-for-
age (and weight for age) require accurate ages (CDC/WFP: A manual: Measuring and
Interpreting Mortality and Malnutrition, 2005).
Moreover, the findings of the different assessments showed that the prevalence of stunting,
among Syrian refugees in Lebanon was higher than the prevalence of stunting observed in
2012 among Syrian refugees living in Lebanon.
2. Anaemia among children 6-59 months
In the different strata assessed and among all Syrian refugees in Lebanon, the results from
tables 23-1 to 23-5 show that the overall total anaemia prevalence among children from 6
to 59 months of age were, for all Syrian refugees in Lebanon: 21.0%; for Syrian refugees in

99
Bekaa: 13.9%; for Syrian refugees in North: 25.8%; for Syrian refugees in the South of
Lebanon: 23.4% and for Syrian refugees in Beirut and Mount-Lebanon: 21.2%.
Children between 6-23 months tended to be the most affected by anaemia: 31.5% among
all Syrian children from 6 to 23 months of age, 24.1% for the same group of age in Bekaa,
42.9% in the North, 30.8% in the South and 27.7% in Beirut and Mount-Lebanon for the
same group of age. The children from 6 to 23 months of age, in the North of Lebanon, were
affected by anaemia (more than 40%).
According to WHO classification and in conformity of UNHCR operational guidance,
anaemia prevalence between 20-39% is classified as a MODERATE public health
significance and that is not an indication of need for preventive interventions with MNPs.
Regarding the WHO classification and the UNHCR operational guidance, with the
prevalence of 21.0% of anaemia among all Syrian refugee children in Lebanon and
considering the rate of GAM in Lebanon (5.9%), the situation is acceptable and does not
need a preventive intervention with micro-nutrient supplementation.
3. Child morbidity
The relationship between disease and nutrition is well documented. Repeated episodes of
infection or persistent subclinical infection can cause or aggravate the child malnutrition.
Diarrhea is associated with insufficient water quality and quantity, and poor hygiene
practices. And in general, infections compromise the nutritional status of children because
of higher nutrient requirements and appetite suppression and malnourished children are
prone to infections because of a compromised immune system.
Regarding diarrhea during the last 2 weeks before the different assessments, the findings
showed that the highest rate was among the Syrian refugees in the North of Lebanon, where
the average duration of diarrhea was almost 6 days (5.91 days) and the lowest rate of
diarrhea during the last 2 weeks before the assessment was observed in Beirut and Mount-
Lebanon.
In comparison with last year findings, the rate of diarrhea during the last 2 weeks before the
assessment found this year was lower than the diarrhea rate observed last year (24.9% in
2013 compared to 40.2% in 2012). This difference can likely be explained by the different
periods of data collection: in 2012, the assessment was during one of the high periods of
diarrhea (in September).The high morbidity remains a risk factor likely to undermine the
nutrition wellbeing of the Syrian refugees in Lebanon.

100
4. Vaccination and vitamin a supplementation
The data collection of the nutrition assessment including the vaccination data was done from
October 2nd to November 30th and the data collection in 110 localities or areas among 120
was done before end October. However, the last polio and measles campaign was done
from November 8th to 15th. In that case, a minor possible overlap in the polio campaign
activity vs data collection could have happened in only 10 clusters (in Mount-Lebanon
Dahieh) x 10 households interviewed.
The findings of the different assessments show that, for HH that had been in Lebanon for
fewer than 12 months (at the time of the survey), 45.3% of their children received their
vaccines in Syria and this proportion was 31.1% among Syrian refugee HH who had been
in Lebanon for 1 year or more. However, for the HH who had been 1 year or more in
Lebanon, more children received their immunization from the PHC Center (45.5% vs.
34.2%). As for the HH that had children of less than 24 months of age, 60.4% immunized
their children in PHC center and only 18.1% of their children received their vaccines only in
Syria. However, 20% of HH with children less than 2 years of age reported that they received
vaccines from different places.
The coverage number of Polio doses was higher for Syrian refugees in Beirut and Mount-
Lebanon. For the supplementation of vitamin A, usually the coverage is the same as the
coverage of Measles vaccination. The results of the different assessments showed that the
coverage of Vitamin A supplementation was very low compared with the coverage of
measles vaccination. This difference could be explained by the fact that the surveyors did
not show the samples of the vitamin A capsule to all mothers or to all caregivers. In addition,
the nutrition data collection took place just one month before Polio/ Vitamin A vaccination/
supplementation campaign. Vitamin A enhances immune system hence it is essential in the
disease outbreak prevention. The situation necessitates urgent improvement of vitamin A
supplementation coverage.
The coverage of measles, of polio doses and of supplementation of vitamin A through routine
programmes looks very low hence there is need to consider regaular accelerated campaigns
to address the gaps.
5. IYCF indicators
Adequate food alone will not result in improved nutritional status if practices related to child
care remain poor. It has been shown that children from food secure and well off households
can still be malnourished if caring practices such as hygiene and child feeding practices are
poor.
101
When IYCF indicators are collected in nutritional surveys, it is not feasible to achieve a large
enough sample size for some of the indicators to be estimated as precisely as desired,
especially for indicators covering a very narrow age range (e.g. 12-15 months, 6-8 months).
Hence, trend analyses need to be interpreted with caution. Nevertheless, trend analyses are
useful for assessing the situation and major differences seen from year to year should
warrant further investigation.
Ffor the global sample, with the sample of 1,200 HH, we were able to obtain interesting
results about IYCF for all Syrian refugees children aged from 0-23 months. The tables 27-1
to 27-5 presented the results about IYCF.
The findings of the different assessments showed that among Syrian refugees in all
Lebanon, more than 85% of children 0-23 months were ever breastfed. More than 60% of
mothers initiated breastfeeding in the first 23 hours after birth and 25% of children 0-23
months were exclusively breastfed. However, around 35% of children 0-23 months received
bottle feedings.
Moreover, the findings of the assessments showed that more than 50% of children 0-23
months were breastfed until the age of one year and depending on the stratum, between
20-33% of children 0-23 months were breastfed until 2 years old.
The link between complementary food introduction (the introduction of solid, semi-solid or
soft foods), receiving bottle feeding, length of breastfeeding (continued breastfeeding at 1
year and continued breastfeeding at 2 years) and acute malnutrition, was analysed. The link
is not statistically significant for introduction of solid, semi-solid or soft foods (X2: 0.05, P>
0.05), for bottle feeding (X2: 0.936, P> 0.05), for continued breastfeeding at 1 year (X2: 3.091,
P> 0.05), and for continued breastfeeding at 2 years (X2: 0.023, P> 0.05).
The non significant statistical link between the IYCF indicators can be explained by the fact
that, at the national level too, the indicators that cover a very narrow age range and the
number of children with actute malnutrition is not very high.
6. Physiological status
The results of the assessment showed that 12% of women 15-49 years old were pregnant
and 15.1% were lactating. However, the Syrian refugees in Bekaa presented the highest
proportion of lactating women (17.2%). Among all Syrian refugees in Lebanon 12.4% of
pregnant women and 10.3% of lactating women were between the ages of 15 and 20 years
old. However, in Beirut and Mount-Lebanon, the proportion of pregnant women and lactating
women aged 15-20 years were the highest: 16.3% for young pregnant women and 14.1%
for young lactating women.

102
Moreover, the findings of different assessments showed that more than 80% pregnant and
lactating Syrian refugee women in Lebanon were aged between 20 and 40 years old.
7. Nutritional status of women 15-49 years
Mid Upper Arm circumference (MUAC) in women was classified according to different cut-
offs. Global malnutrition: MUAC < 23 cm; Moderate malnutrition: MUAC ≥21 cm and <23 cm
and Severe malnutrition: MUAC < 21 cm as per the recommendation of the Sphere Project’s
Handbook (2011).
The assessment results show that, like the prevalence of malnutrition observed last year
among Syrian refugee women in Lebanon, there were 5.0% (4.05-6.06 95% C.I.)
malnourished (MUAC < 23 cm) Syrian refugee women aged 15-49 years and among them
1.0% (0.61-1.53 95% C.I.) were severely malnourished (MUAC < 21 cm). The Syrian refugee
women aged 15-49 years in the North and in the South of Lebanon presented highest
prevalence of malnutrition (the North for the severe malnourished and the South for the total
malnourished).
Moreover, more than 75% of malnourished women among Syrian refugees in Lebanon were
aged less than 35 years old. With the excpetion of the Beirut and Mount-Lebanon stratum
(where 36% of malnourished were 15-19 years), in the other regions more than 40% of
malnourished Syrian refugee women were between 15-19 years old.
These prevalence figures can be used as a basic situation to provide a food supplementation
program to pregnant (from second trimester) and lactating women (up to 6 months post
delivery) on a bi-monthly basis in addition to addressing the broader maternal nutrition and
health issues including maternal care, access to adequate micronutrient supplementation,
and adequate household security.
8. Anaemia among non-pregnant women 15-49 years
In the different strata assessed and among all Syrian refugees in Lebanon, the results from
table 31 show the overall total anaemia prevalence for non-pregnant women of reproductive
age (15-49 years) as follows, for all Syrian refugees in Lebanon: 26.1%; for Syrian refugees
in Bekaa: 18.4%; for Syrian refugees in North: 27.7%; for Syrian refugees in the South of
Lebanon: 27.0% and for Syrian refugees in Beirut and Mount-Lebanon: 29.3%.
The non-pregnant Syrian refugee women of reproductive age (15-49 years) who lived in
Beirut and Mount-Lebanon had more anaemia cases and those who lived in Bekaa had
fewer anaemia cases.

103
According to WHO classification and in conformity of UNHCR operational guidance,
anaemia prevalence between 20-39% is classified as a MODERATE public health
significance and that is not an indication of need for preventive interventions with MNPs.
Regarding the WHO classification and the UNHCR operational guidance, with the
prevalence of 26.1% of anaemia among all Syrian refugee women of reproductive age in
Lebanon, the situation is acceptable and does not need a preventive intervention with micro-
nutrient supplementation.
9. WASH indicators
Poor water, sanitation and hygiene have serious consequences on health and nutritional
status, especially among the most vulnerable population groups. Improvements in hygiene
and particularly hand washing with soap can have a significant impact on reducing diarrhea
prevalence.
The inclusion of the basic WASH module in the nutrition assessment provided key
information for planning interventions that address public health concerns and to ensure that
basic rights are upheld. Poor water, sanitation and hygiene have serious consequences for
the health and nutrition status of people.
During the different assessments, the findigs showed that more than 60% of HH surveyed
were satisfied with their drinking water supply and 75% of Syrian refugees assessed in Beirut
and Mount-Lebanon were satisfied with their drinking water supply. Table 33 indicates that
more than 50% of Syrian refugee HH used the improved drinking water supply and the three
main reasons for dissatisfaction about the water supply were: the bad quality of water,
having to pay for water (cost) and not enough water for personal hygiene.
About sanitation (toilet), the findings of the different assessments show that:
77.5% of Households used an improved excreta disposal facility;
14% of the HH used a shared family toilet;
16.4% of the HH used the communal toilet;
Only 4% of the HH with children under 3 years old, disposed of feces safely and
92.8% threw it in garbage.
The distinction between: to throw the used diaper in garbage or to directly throw the feces
in the garbage was not made (it was not clear in the modality how to dispose the feces by
throwing it into the garbage). Due to this limitation, probably, the proportion of HH that they
disposed feces by throwing it directly into the garbage could be high, but this result has to
be interpreted with caution, and the situation needs more investigation.
Concerning the questions about access to “Soap and/or Hygienic products”, 59.5% among
all Syrian refugees in Lebanon reported that they had access to “Soap and/or Hygienic

104
products” and in Bekaa and the North, the proportion of people who had access to “Soap
and/or Hygienic products” was more than 60% (62.0% in Bekaa and 67.6% in the North).
The link between the satisfaction about the drinking water supply, the kind of toilet used
(improved or unimproved) and acute malnutrition, was analysed. The link is not statistically
significant for the satisfaction with the drinking water supply (X2: 0.056, P> 0.05) and for the
kind of toilet used (improved or unimproved) (X2: 5.300, P> 0.05). However, the analysis of
the link between the same WASH indicators and the prevalence of Diarrhea showed that
the link between the kind of toilet used (improved or unimproved) and the prevalence of diarrhea
is statistically significant (X2: 17.869, P< 0.05) but it is not significant between the satisfaction
about the drinking water supply and the prevalence of diarrhea is statistically significant (X2: 3.187,
P> 0.05 – p=0.074).
Conclusion
The prevalence of GAM in 2013 is 2.2% and it’s within acceptable levels according to WHO
categorization. About 0.4% of the assessed children were severely malnourished with all
having been identified with bilateral oedema. About 5% of the women aged 15-49 years
were identified with malnutrition. Its however notable that due to the prevailing aggravating
factors (winter, risk of food insecurity, increasing of numbers and the new arrivals that could
be in worse condition), the nutrition situation can rapidly change, hence the need for
mitigation measures. Concerted integrated efforts, in collaboration with MOPH, will be
required to sustain the low GAM levels and promote nutrition situation in the strata recording
some vulnerability (Bekaa and North Lebanon).
Immediate measures must be taken to improve the package and coverage of preventative
services of IYCF, micronutrient, public health and adequate food intervention. Screening
activities should be strengthened to identify any cases with malnutrition and referral for
treatment, targeting both women and children from the refugee community.
Moreover, more than 90% of the Syrian refugee HH in Lebanon threw the stools of their
children under 3 years old in garbage. This situation needs more investigation.

105
Recommendations and priorities
Immediate term
1. Discussing with MOPH, MOSA and all other partners to strengthen capacity for acute
malnutrition management for preparedness purposes.
2. Setting up a Nutrition Working Group and reinforcing role and responsibility of the nutrition
group and its respective members to organize and coordinate the nutrition sector and
response.
3. Setting up or reinforcing a screening mechanism of children and mothers for malnutrition upon
arrival in Lebanon.
4. Setting up or reinforcing services for screening of children and mothers, at community and
health facility level, and referral for treatment of any malnourished cases identified.
5. Developing national guidelines or national protocol for acute malnutrition management and
prevention or adopt the international ones to the Lebanon context, including the national
training plan
6. Strengthening the awareness, promotion, and protection of positive infant and young
child feeding practices through NGOs and PHC or other government services activities
by accelerating sensitization and awareness creation on appropriate breast-feeding
and complementary feeding practices as well as micronutrient provision, including
exploring possibility for dietary diversification.
7. Improving education and communication strategies in the health centers and in the
community including integrating communication for development strategies to
positively influence behavior and practices.
8. Scale-up of hygiene promotion activities (including adequate access to soap through
either distribution or the means to purchase) and improve water quality access and
monitoring the quality of water to address disease incidence and facilitate disease
treatment through the health facilities.
9. Scale-up of sanitation promotion activities (including how to dispose in the improved
way the stools of the children under 3 years old).
10. Facilitate adequate dietary intake for women and children to promote optimal growth
and prevent malnutrition through adequate food provision and livelihood support to
families.
Medium term
1. Strengthen the nutrition surveillance system and explore how to integrate it in the
existing Health Surveillance System and improve a food security monitoring system.

106
2. Agree a proper target of the most vulnerable refugees and host communities with a
minimum response package on health and nutrition surveillance, disease treatment,
appropriate health and nutrition promotion, adequate food security, water and
sanitation services, and shelter against harsh weather.
Longer term
1. If the situation in Syria does not improve sufficiently to enable the return of the refugees,
then a nutrition survey in different regions should be conducted every year (depending
on the delivery of adequate response in the next 6 months). Survey methodology
should be simplified to capture only key indicators of anthropometry in children aged
6-59 months and mortality in the whole population as recommended by the SMART
methodology and if possible, to include components about nutrition response (CMAM,
micronutrient and IYCF) coverage.
2. A full expanded nutrition survey should be repeated only every 2 years.
107
ANNEX
Annex 1: Sample for Syrian refugees in Lebanon
Annex 2: Arabic Questionnaire for Syrian refugees in Lebanon
Annex 3: Questionnaire in English, for Syrian refugees in Lebanon, before Arabic translation
and last revision
Annex 4: Event Calendar
Annex 5: Results using the NCHS 1977 Growth Reference for Syrian refugees in Lebanon
Annex 6: Assessment teams’ members for Syrian refugees in Lebanon
Annex 7: Consent form for Syrian refugees in Lebanon
Annex 8: Example of form filled for every day anthropometric material calibration & accuracy
verification
Annex 9: Referral form
Annex 10-1: SMART Plausibility Report for All Syrian refugees in Lebanon
Annex 10-2: SMART Plausibility Report for Syrian refugees in stratum of Bekaa
Annex 10-3: SMART Plausibility Report for Syrian refugees in stratum of North
Annex 10-4: SMART Plausibility Report for Syrian refugees in stratum of South
Annex 10-5: SMART Plausibility Report for Syrian refugees in stratum of Beirut & Mount-
Lebanon

For more information contact: United Nations Children’s Fund Clemenceau, Gefinor Centre, Block E, 6th Floor Beirut, Lebanon www.unicef.org Tel: 9611 756101 © United Nations Children’s Fund (UNICEF) February 2014