Embed Size (px)
Citation preview

Joint meeting of RDU IIA and ISACANovember 11, 2008, Capitol Club, Raleigh, North Carolina
Joint meeting of the RDU IIA and ISACA chaptersNovember 11, 2008, Capitol Club, Raleigh, NC
Slide <#> Slide 1
ProcurementProcurement FraudFraudDetection and PreventionDetection and Prevention
November 11, 2008November 11, 2008
Mike BlakleyMike Blakley

Slide 2Joint meeting of the RDU IIA and ISACA chaptersNovember 11, 2008, Capitol Club, Raleigh, NC
Session objectives1. Current trends, techniques
and best practices2. Understand statistical basis
for analysis3. Procurement cards (p-
cards) 4. Understand use of Excel

Slide 3Joint meeting of the RDU IIA and ISACA chaptersNovember 11, 2008, Capitol Club, Raleigh, NC
Top Six IndicatorsThat you might have a fraud
• 6. System designed to do “three way match”, but only does two way
• 5. Procurement software system doesn’t do a match
• 4. When auditors ask to help them out, they point to the door
• 3. No procurement software system• 2. Procurement clerk drives a Porsche• 1. Clerk’s kids drive Porsches between
mountain home and beach home

Slide 4Joint meeting of the RDU IIA and ISACA chaptersNovember 11, 2008, Capitol Club, Raleigh, NC
Overview• Fraud patterns detectable
with digital analysis• Basis for digital analysis
approach• Usage examples• Using Excel
Slide 5Joint meeting of the RDU IIA and ISACA chaptersNovember 11, 2008, Capitol Club, Raleigh, NC
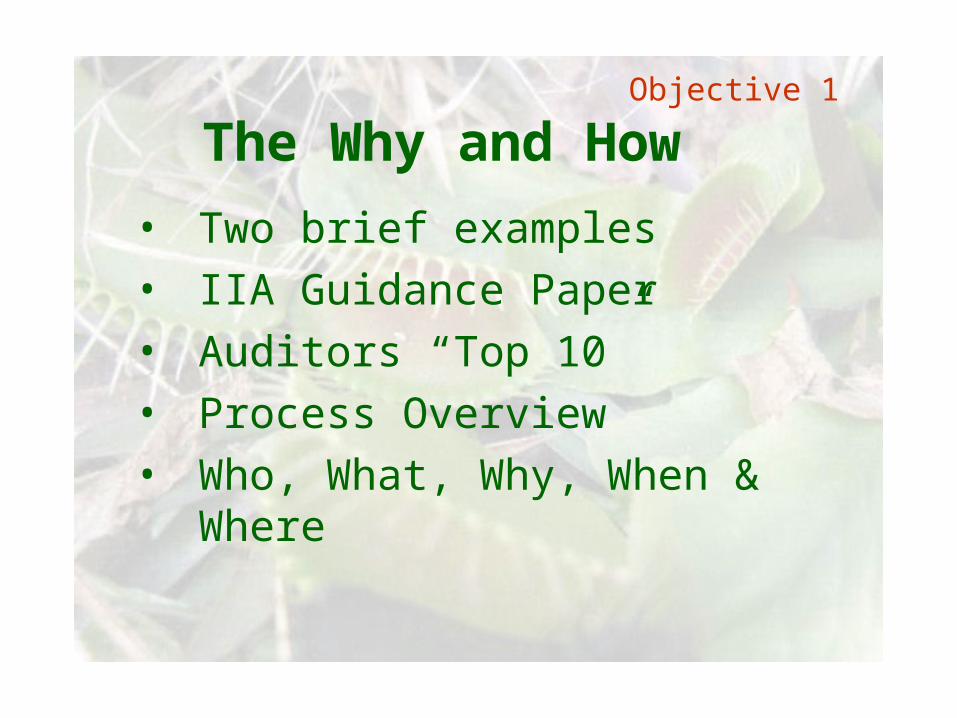
The Why and How
• Two brief examples• IIA Guidance Paper• Auditors “Top 10”• Process Overview• Who, What, Why, When &
Where
Objective 1

Slide 6Joint meeting of the RDU IIA and ISACA chaptersNovember 11, 2008, Capitol Club, Raleigh, NC
Example 1School Bus Transportation Fraud
• Supplier Kickback – School Bus parts
• $5 million• Jail sentences• Period of years
Objective 1

Slide 7Joint meeting of the RDU IIA and ISACA chaptersNovember 11, 2008, Capitol Club, Raleigh, NC
Regression Analysis
• Stepwise to find relationships– Forwards– Backwards
• Intervals– Confidence– Prediction
Objective 1

Slide 8Joint meeting of the RDU IIA and ISACA chaptersNovember 11, 2008, Capitol Club, Raleigh, NC
Data outliersObjective 1
• Sometimes an “out and out Liar”
• But how do you detect it?

Slide 9Joint meeting of the RDU IIA and ISACA chaptersNovember 11, 2008, Capitol Club, Raleigh, NC
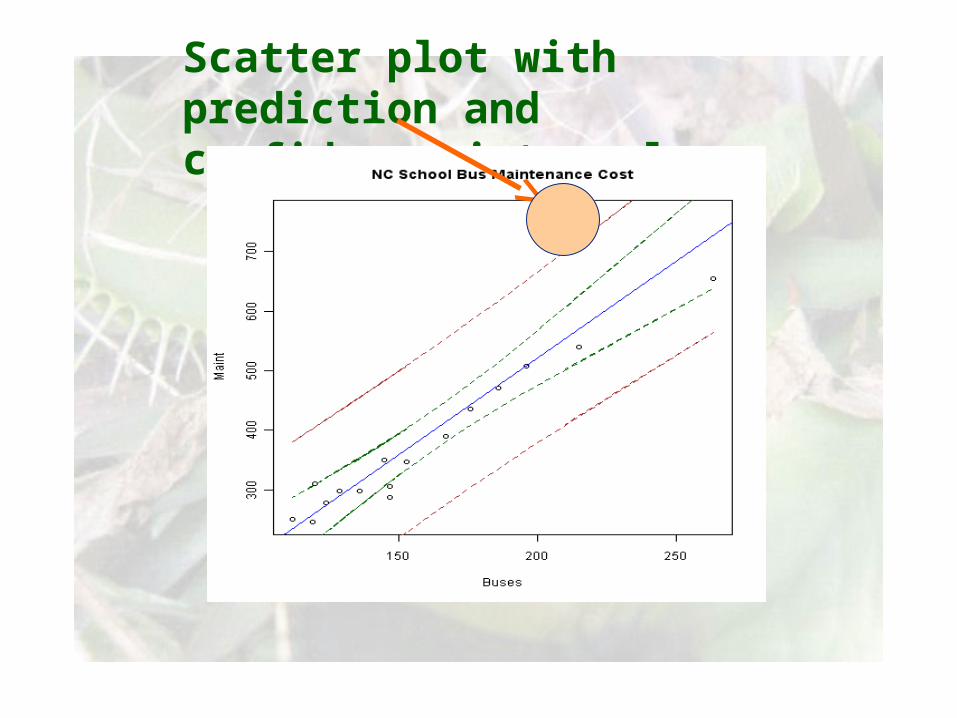
Data Outliers
• Plot transportation costs vs. number of buses
• “Drill down” on costs– Preventive maintenance– Fuel– Inspection
Objective 1
Slide 10Joint meeting of the RDU IIA and ISACA chaptersNovember 11, 2008, Capitol Club, Raleigh, NC
Scatter plot with prediction and confidence intervals

Slide 11Joint meeting of the RDU IIA and ISACA chaptersNovember 11, 2008, Capitol Club, Raleigh, NC
Medicare HIV Infusion Costs
Objective 1
• CMS Report for 2005• South Florida - $2.2
Billion• Rest of the country
combined - $.1 Billion

Slide 12Joint meeting of the RDU IIA and ISACA chaptersNovember 11, 2008, Capitol Club, Raleigh, NC
Pareto ChartObjective 1
Medicare HIV Infusion Costs - 2005 ($Billions)data source: HHS CMS
0.0%
20.0%
40.0%
60.0%
80.0%
100.0%
120.0%
County
Ann
ual M
edic
are
Cos
ts
Pct
Cum Pct

Slide 13Joint meeting of the RDU IIA and ISACA chaptersNovember 11, 2008, Capitol Club, Raleigh, NC
Guidance Paper• A proposed implementation
approach• “Managing the Business Risk of
Fraud: A Practical Guide” http://tinyurl.com/3ldfza
• Five Principles• Fraud Detection• Coordinated Investigation
Approach
Objective 1

Slide 14Joint meeting of the RDU IIA and ISACA chaptersNovember 11, 2008, Capitol Club, Raleigh, NC
Managing the Business Risk of Fraud: A Practical Guide
• IIA, AICPA and ACFE• Report issued 5/2008• Section 5 – Fraud
Detection
Objective 1

Slide 15Joint meeting of the RDU IIA and ISACA chaptersNovember 11, 2008, Capitol Club, Raleigh, NC
Section 5 – Fraud Detection
• Detective Controls• Process Controls• Anonymous Reporting• Internal Auditing• Proactive Fraud
Detection
Objective 1

Slide 16Joint meeting of the RDU IIA and ISACA chaptersNovember 11, 2008, Capitol Club, Raleigh, NC
Proactive Fraud Detection
• Data Analysis to identify:– Anomalies– Trends– Risk indicators
Objective 1

Slide 17Joint meeting of the RDU IIA and ISACA chaptersNovember 11, 2008, Capitol Club, Raleigh, NC
Specific Examples Cited
• Journal entries – suspicious transactions
• Identification of relationships• Benford’s Law• Continuous monitoring
Objective 1

Slide 18Joint meeting of the RDU IIA and ISACA chaptersNovember 11, 2008, Capitol Club, Raleigh, NC
Data Analysis enhances ability to detect fraud
• Identify hidden relationships• Identify suspicious transactions• Assess effectiveness of internal
controls• Monitor fraud threats• Analyze millions of transactions
Objective 1

Slide 19Joint meeting of the RDU IIA and ISACA chaptersNovember 11, 2008, Capitol Club, Raleigh, NC
Peeling the Onion
Population as Whole
Possible Error Conditions
Fraud Items
Objective 1c

Slide 20Joint meeting of the RDU IIA and ISACA chaptersNovember 11, 2008, Capitol Club, Raleigh, NC
Fraud Pattern Detection
Market Basket
Stratification
Trend Line
Holiday
Day of Week
Duplicates
Univariate
Gaps
Benford’s Law
Round Numbers
Target Group
Objective 1d

Slide 21Joint meeting of the RDU IIA and ISACA chaptersNovember 11, 2008, Capitol Club, Raleigh, NC
Who Uses Analytics
• Traditionally, IT specialists• With appropriate tools,
audit generalists (CAATs)• Growing trend of business
analytics• Essential component of
continuous monitoring
Objective 1e

Slide 22Joint meeting of the RDU IIA and ISACA chaptersNovember 11, 2008, Capitol Club, Raleigh, NC
Analytics – what is it?• Using software to:
– Classify– Quantify– Compare
• Both numeric and non-numeric data
Objective 1e

Slide 23Joint meeting of the RDU IIA and ISACA chaptersNovember 11, 2008, Capitol Club, Raleigh, NC
How - Assessing fraud risk • Basis is quantification• Software can do the “leg work”• Statistical measures of
difference– Chi square– Kolmogorov-Smirnov– D-statistic
• Specific approaches
Objective 1e

Slide 24Joint meeting of the RDU IIA and ISACA chaptersNovember 11, 2008, Capitol Club, Raleigh, NC
Why - Advantages• Automated process• Handle large data populations• Objective, quantifiable metrics• Can be part of continuous monitoring• Can produce useful business analytics• 100% testing is possible • Quantify risk• Repeatable process
Objective 1e

Slide 25Joint meeting of the RDU IIA and ISACA chaptersNovember 11, 2008, Capitol Club, Raleigh, NC
Why - Disadvantages
• Costly (time and software costs)
• Learning curve• Requires specialized
knowledge
Objective 1e

Slide 26Joint meeting of the RDU IIA and ISACA chaptersNovember 11, 2008, Capitol Club, Raleigh, NC
When to Use Analytics
• Traditional – intermittent (one off)
• Trend is to use it as often as possible
• Continuous monitoring• Scheduled processing
Objective 1e

Slide 27Joint meeting of the RDU IIA and ISACA chaptersNovember 11, 2008, Capitol Club, Raleigh, NC
Where Is It Applicable?
• Any organization with data in digital format, and especially if:– Volumes are large– Data structures are complex– Potential for fraud exists
Objective 1e

Slide 28Joint meeting of the RDU IIA and ISACA chaptersNovember 11, 2008, Capitol Club, Raleigh, NC
Objective 1 Summarized
• Two brief examples• IIA Guidance Paper• “Top 10” Metrics• Process Overview
Objective 1

Slide 29Joint meeting of the RDU IIA and ISACA chaptersNovember 11, 2008, Capitol Club, Raleigh, NC
Objective 1 - Summarized1. Understand why and how 2. Understand statistical basis for
quantifying differences3. Identify ten general tools and
techniques
Next is the basis …

Slide 30Joint meeting of the RDU IIA and ISACA chaptersNovember 11, 2008, Capitol Club, Raleigh, NC
Basis for Pattern Detection
• Analytical review• Isolate the
“significant few” • Detection of errors• Quantified approach
Objective 2

Slide 31Joint meeting of the RDU IIA and ISACA chaptersNovember 11, 2008, Capitol Club, Raleigh, NC
Trapping anomaliesObjective 3Objective 2

Slide 32Joint meeting of the RDU IIA and ISACA chaptersNovember 11, 2008, Capitol Club, Raleigh, NC
Understanding the Basis
• Quantified Approach• Population vs. Groups• Measuring the Difference• Stat 101 – Counts, Totals,
Chi Square and K-S• The metrics used
Objective 2
Slide 33Joint meeting of the RDU IIA and ISACA chaptersNovember 11, 2008, Capitol Club, Raleigh, NC
Quantified Approach
• Based on measureable differences
• Population vs. Group• “Shotgun” technique
Objective 2a

Slide 34Joint meeting of the RDU IIA and ISACA chaptersNovember 11, 2008, Capitol Club, Raleigh, NC
Detection of Fraud Characteristics
• Something is different than expected
Objective 2a

Slide 35Joint meeting of the RDU IIA and ISACA chaptersNovember 11, 2008, Capitol Club, Raleigh, NC
Fraud patterns• Common theme –
“something is different”• Groups• Group pattern is different
than overall population
Objective 2b

Slide 36Joint meeting of the RDU IIA and ISACA chaptersNovember 11, 2008, Capitol Club, Raleigh, NC
Measurement Basis
•Transaction counts
•Transaction amounts
Objective 2c

Slide 37Joint meeting of the RDU IIA and ISACA chaptersNovember 11, 2008, Capitol Club, Raleigh, NC
How is digital analysis done?• Comparison of group with
population as a whole• Can be based on either counts or
amounts• Difference is measured• Groups can then be ranked using
a selected measure• High difference = possible
error/fraud
Objective 2d

Slide 38Joint meeting of the RDU IIA and ISACA chaptersNovember 11, 2008, Capitol Club, Raleigh, NC
Histograms• Attributes tallied and categorized
into “bins”• Counts or sums of amounts
Objective 2d
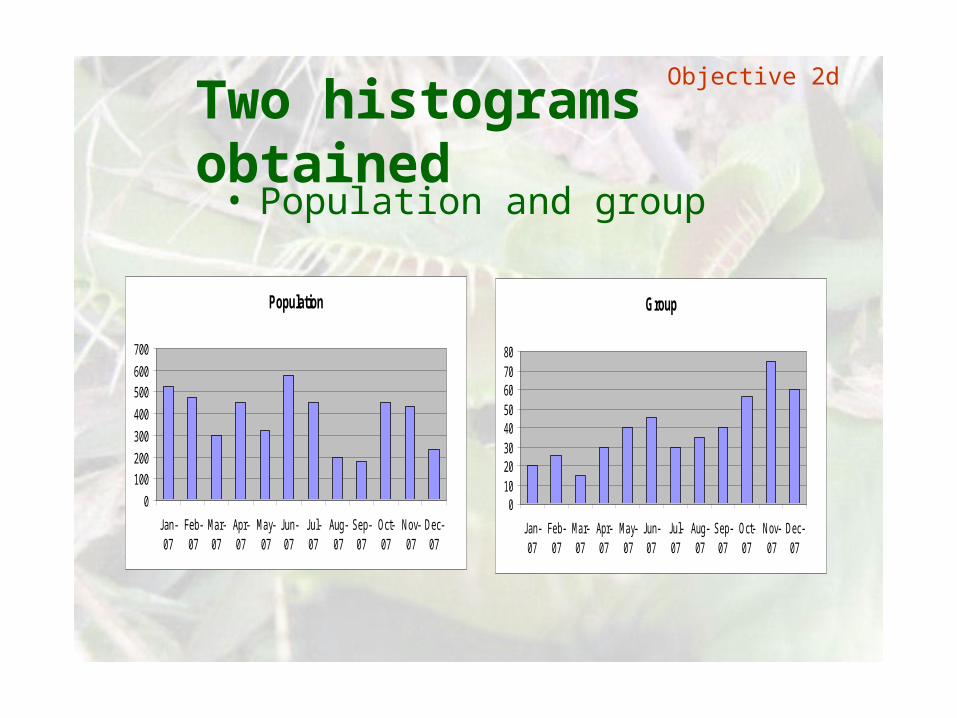
Slide 39Joint meeting of the RDU IIA and ISACA chaptersNovember 11, 2008, Capitol Club, Raleigh, NC
Two histograms obtained• Population and group
Population
0
100
200
300
400
500
600
700
Jan-07
Feb-07
Mar-07
Apr-07
May-07
Jun-07
Jul-07
Aug-07
Sep-07
Oct-07
Nov-07
Dec-07
Group
01020304050607080
Jan-07
Feb-07
Mar-07
Apr-07
May-07
Jun-07
Jul-07
Aug-07
Sep-07
Oct-07
Nov-07
Dec-07
Objective 2d

Slide 40Joint meeting of the RDU IIA and ISACA chaptersNovember 11, 2008, Capitol Club, Raleigh, NC
Compute Cumulative Amount for each
Count by Month
0
10
20
30
40
50
60
70
80
Month
Cou
nt
Cum Pct
0.0%
20.0%
40.0%
60.0%
80.0%
100.0%
120.0%
Jan-
07
Mar
-07
May
-07
Jul-0
7
Sep-0
7
Nov-0
7
Objective 2d

Slide 41Joint meeting of the RDU IIA and ISACA chaptersNovember 11, 2008, Capitol Club, Raleigh, NC
Are the histograms different?
• Two statistical measures of difference
• Chi Squared (counts)• K-S (distribution)• Both yield a difference
metric
Objective 2d
Slide 42Joint meeting of the RDU IIA and ISACA chaptersNovember 11, 2008, Capitol Club, Raleigh, NC
Chi Squared
• Classic test on data in a table
• Answers the question – are the rows/columns different
• Some limitations on when it can be applied
Objective 2d

Slide 43Joint meeting of the RDU IIA and ISACA chaptersNovember 11, 2008, Capitol Club, Raleigh, NC
Chi Squared
• Table of Counts• Degrees of Freedom• Chi Squared Value• P-statistic• Computationally intensive
Objective 2d

Slide 44Joint meeting of the RDU IIA and ISACA chaptersNovember 11, 2008, Capitol Club, Raleigh, NC
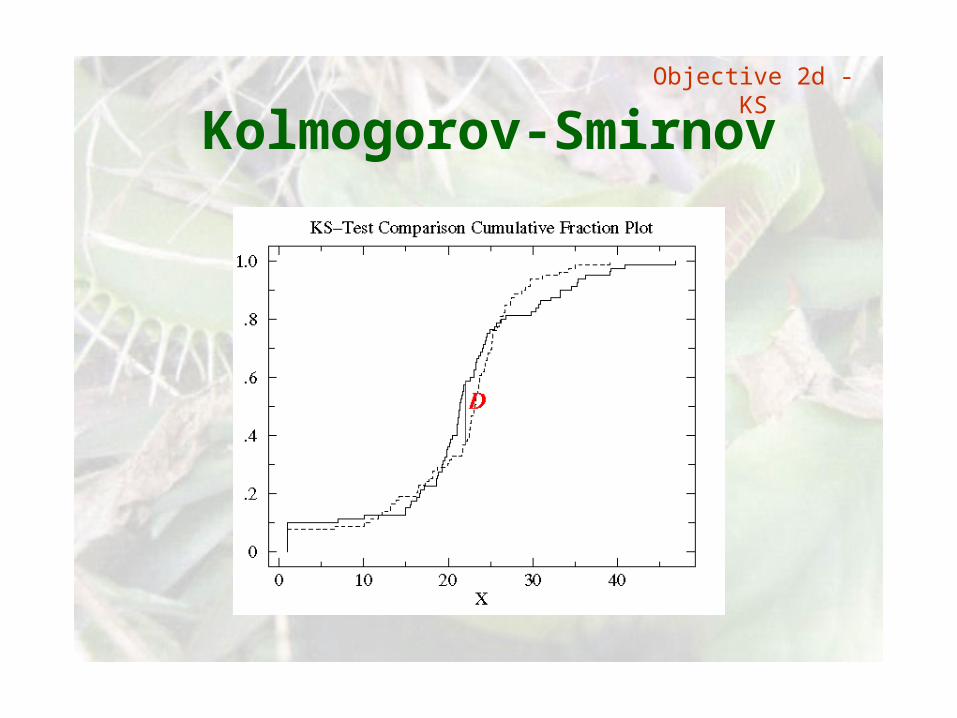
Kolmogorov-Smirnov
• Two Russian mathematicians
• Comparison of distributions• Metric is the “d-statistic”
Objective 2d

Slide 45Joint meeting of the RDU IIA and ISACA chaptersNovember 11, 2008, Capitol Club, Raleigh, NC
How is K-S test done?
• Four step process1. For each cluster element
determine percentage2. Then calculate cumulative
percentage3. Compare the differences in
cumulative percentages4. Identify the largest difference
Objective 2d
Slide 46Joint meeting of the RDU IIA and ISACA chaptersNovember 11, 2008, Capitol Club, Raleigh, NC
Kolmogorov-SmirnovObjective 2d - KS

Slide 47Joint meeting of the RDU IIA and ISACA chaptersNovember 11, 2008, Capitol Club, Raleigh, NC
Classification by metrics• Stratification• Day of week• Happens on holiday• Round numbers• Variability• Benford’s Law• Trend lines• Relationships (market basket)• Gaps• Duplicates
Objective 2e

Slide 48Joint meeting of the RDU IIA and ISACA chaptersNovember 11, 2008, Capitol Club, Raleigh, NC
Fraud Pattern Detection
Market Basket
Stratification
Trend Line
Holiday
Day of Week
Duplicates
Univariate
Gaps
Benford’s Law
Round Numbers
Target Group
Objective 3
Slide 49Joint meeting of the RDU IIA and ISACA chaptersNovember 11, 2008, Capitol Club, Raleigh, NC
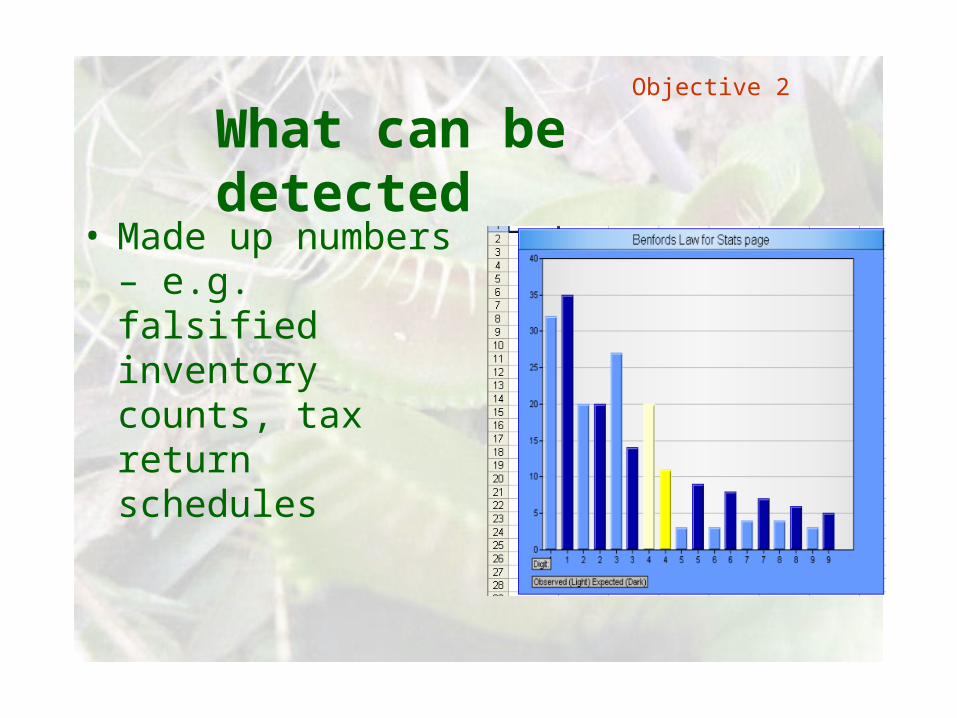
What can be detected• Made up numbers
– e.g. falsified inventory counts, tax return schedules
Objective 2

Slide 50Joint meeting of the RDU IIA and ISACA chaptersNovember 11, 2008, Capitol Club, Raleigh, NC
Benford’s Law using Excel• Basic formula is “=log(1+(1/N))”• Workbook with formulae available
at http://tinyurl.com/4vmcfs
• Obtain leading digits using “Left” function, e.g. left(Cell,1)
Objective 2

Slide 51Joint meeting of the RDU IIA and ISACA chaptersNovember 11, 2008, Capitol Club, Raleigh, NC
Made up numbers• Benford’s Law• Check Chi Square and d-statistic• First 1,2,3 digits• Last 1,2 digits• Second digit• Sources for more info

Slide 52Joint meeting of the RDU IIA and ISACA chaptersNovember 11, 2008, Capitol Club, Raleigh, NC
How is it done?• Decide type of test – (first 1-3 digits,
last 1-2 digit etc)• For each group, count number of
observations for each digit pattern• Prepare histogram• Based on total count, compute
expected values• For the group, compute Chi Square
and d-stat• Sort descending by metric (chi
square/d-stat)
Objective 2

Slide 53Joint meeting of the RDU IIA and ISACA chaptersNovember 11, 2008, Capitol Club, Raleigh, NC
Invoice Amounts tested with Benford’s law - Example Results
During tests of invoices by store, two stores, 324 and 563 have significantly more differences than any other store as measured by Benford’s Law.
Store Hi Digit Chi Sq D-stat
324 79 5,234 0.9802
563 89 4,735 0.97023
432 23 476 0.321
217 74 312 0.2189
Objective 2

Slide 54Joint meeting of the RDU IIA and ISACA chaptersNovember 11, 2008, Capitol Club, Raleigh, NC
Next Metric1. Outliers2. Stratification3. Day of Week4. Round Numbers5. Made Up Numbers6. Market basket7. Trends8. Gaps9. Duplicates10. Dates
Objective 2

Slide 55Joint meeting of the RDU IIA and ISACA chaptersNovember 11, 2008, Capitol Club, Raleigh, NC
Duplicates
Why is there more than one?
Same, Same, Same, and
Same, Same, Different
Objective 2

Slide 56Joint meeting of the RDU IIA and ISACA chaptersNovember 11, 2008, Capitol Club, Raleigh, NC
Two types of (related) tests• Same items – same vendor,
same invoice number, same invoice date, same amount
• Different items – same employee name, same city, different social security number
Objective 2
Slide 57Joint meeting of the RDU IIA and ISACA chaptersNovember 11, 2008, Capitol Club, Raleigh, NC
Duplicate Payments
• High payback area
•“Fuzzy” logic• Overriding
software controls
Objective 2

Slide 58Joint meeting of the RDU IIA and ISACA chaptersNovember 11, 2008, Capitol Club, Raleigh, NC
Fuzzy matching with software
• Levenshtein distance• Soundex• “Like” clause in SQL• Regular expression
testing in SQL• Vendor/employee
situations
Russian physicist
Objective 2

Slide 59Joint meeting of the RDU IIA and ISACA chaptersNovember 11, 2008, Capitol Club, Raleigh, NC
How is it done?
• First, sort file in sequence for testing
• Compare items in consecutive rows
• Extract exceptions for follow-up
Objective 2

Slide 60Joint meeting of the RDU IIA and ISACA chaptersNovember 11, 2008, Capitol Club, Raleigh, NC
Possible Duplicates - Example Results
Five invoices may be duplicates.
VendorInvoice
DateInvoice Amount Count
10245 6/15/2007 3,544.78 4
10245 8/31/2007 2,010.37 2
17546 2/12/2007 1,500.00 2
Objective 2

Slide 61Joint meeting of the RDU IIA and ISACA chaptersNovember 11, 2008, Capitol Club, Raleigh, NC
Next Metric1. Outliers2. Stratification3. Day of Week4. Round Numbers5. Made Up Numbers6. Market basket7. Trends8. Gaps9. Duplicates10. Dates
Objective 2

Slide 62Joint meeting of the RDU IIA and ISACA chaptersNovember 11, 2008, Capitol Club, Raleigh, NC
Holiday Date Testing• Red Flag indicator
Objective 2

Slide 63Joint meeting of the RDU IIA and ISACA chaptersNovember 11, 2008, Capitol Club, Raleigh, NC
Typical audit areas
• Invoices• Receiving reports• Purchase orders
Objective 2

Slide 64Joint meeting of the RDU IIA and ISACA chaptersNovember 11, 2008, Capitol Club, Raleigh, NC
Federal Holidays
• Established by Law• Ten dates• Specific date (unless
weekend), OR• Floating holiday
Objective 2

Slide 65Joint meeting of the RDU IIA and ISACA chaptersNovember 11, 2008, Capitol Club, Raleigh, NC
Understanding the Basis
• Quantified Approach• Population vs. Groups• Measuring the Difference• Stat 101 – Counts, Totals, Chi
Square and K-S• The metrics used
Objective 2

Slide 66Joint meeting of the RDU IIA and ISACA chaptersNovember 11, 2008, Capitol Club, Raleigh, NC
Objective 2 - Summarized
1. Understand why and how 2. Understand statistical basis for
quantifying differences3. Procurement cards4. Understand examples done
using Excel
Next up: p-cards …
Objective 2

Slide 67Joint meeting of the RDU IIA and ISACA chaptersNovember 11, 2008, Capitol Club, Raleigh, NC
Testing Procurement Card Transactions
1. Understand Merchant Charge Codes (MCC)2. Understand common policies3. Test procurement card transactions contained on
worksheets using VBA4. Ability to test procurement card transactions in a file
using VBA5. Perform an audit of procurement card transactions in a
more efficient and effective manner using the concepts and techniques presented
Objective 3

Slide 68Joint meeting of the RDU IIA and ISACA chaptersNovember 11, 2008, Capitol Club, Raleigh, NC
Audit Benefits(How this test supports the audit) • Test compliance with policy on an
account by account basis• Test compliance with policies on
account limits• Enable 100% testing of transactions• Audit process which can be tailored for
policy changes• Repeatable audit process
Objective 3

Slide 69Joint meeting of the RDU IIA and ISACA chaptersNovember 11, 2008, Capitol Club, Raleigh, NC
MCC Structure
• Major Categories• Airlines 30XX – 32XX• Car Rental 33XX, 34XX• Hotels 35XX – 37XX• All Other
Objective 3

Slide 70Joint meeting of the RDU IIA and ISACA chaptersNovember 11, 2008, Capitol Club, Raleigh, NC
Policy Structure
• Prohibited Codes• Codes allowed with a
monthly limit• Codes allowed without limit• Overall card limit
Objective 3

Slide 71Joint meeting of the RDU IIA and ISACA chaptersNovember 11, 2008, Capitol Club, Raleigh, NC
Summary and Wrap Up
1. Understand Merchant Charge Codes (MCC)2. Understand common policies3. Test procurement card transactions contained
on worksheets using VBA4. Ability to test procurement card transactions in
a file using VBA5. Perform an audit of procurement card
transactions in a more efficient and effective manner using the concepts and techniques presented
Objective 3

Slide 72Joint meeting of the RDU IIA and ISACA chaptersNovember 11, 2008, Capitol Club, Raleigh, NC
Objective 3 - Summarized
1. Understand why and how 2. Understand statistical basis for
quantifying differences3. Procurement cards4. Understand examples done
using Excel
Next up: Excel …

Slide 73Joint meeting of the RDU IIA and ISACA chaptersNovember 11, 2008, Capitol Club, Raleigh, NC
Use of Excel• Built-in functions• Add-ins• Macros• Database access
Objective 4

Slide 74Joint meeting of the RDU IIA and ISACA chaptersNovember 11, 2008, Capitol Club, Raleigh, NC
Excel – Univariate statistics• Work with Ranges• =sum, =average, =stdevp• =largest(Range,1),
=smallest(Range,1)• =min, =max, =count• Tools | Data Analysis |
Descriptive Statistics
Objective 4

Slide 75Joint meeting of the RDU IIA and ISACA chaptersNovember 11, 2008, Capitol Club, Raleigh, NC
Excel Histograms
• Tools | Data Analysis | Histogram
• Bin Range• Data Range
Objective 4

Slide 76Joint meeting of the RDU IIA and ISACA chaptersNovember 11, 2008, Capitol Club, Raleigh, NC
Excel Gaps testing• Sort by sequential
value• =if(thiscell-lastcell <>
1,thiscell-lastcell,0)• Copy/paste special• Sort
Objective 4

Slide 77Joint meeting of the RDU IIA and ISACA chaptersNovember 11, 2008, Capitol Club, Raleigh, NC
Detecting duplicates with Excel
• Sort by sort values• =if testing• =if(=and(thiscell=l
astcell, etc.))
Objective 4

Slide 78Joint meeting of the RDU IIA and ISACA chaptersNovember 11, 2008, Capitol Club, Raleigh, NC
Performing audit tests with macros
• Repeatable process• Audit standardization• Learning curve• Streamlining of tests• Examples -
http://tinyurl.com/576tp8
Objective 4

Slide 79Joint meeting of the RDU IIA and ISACA chaptersNovember 11, 2008, Capitol Club, Raleigh, NC
Use of Excel
• Built-in functions• Add-ins• Macros
Objective 4

Slide 80Joint meeting of the RDU IIA and ISACA chaptersNovember 11, 2008, Capitol Club, Raleigh, NC
Objective 4 - Summarized
1. Understand why and how 2. Understand statistical basis for
quantifying differences3. Identify ten general tools and
techniques4. Understand examples done using
Excel

Slide 81Joint meeting of the RDU IIA and ISACA chaptersNovember 11, 2008, Capitol Club, Raleigh, NC
Questions?

Slide 82Joint meeting of the RDU IIA and ISACA chaptersNovember 11, 2008, Capitol Club, Raleigh, NC
Links for more information• Kolmogorov-Smirnov • http://tinyurl.com/y49sec• Benford’s Law
http://tinyurl.com/3qapzu• Chi Square tests
http://tinyurl.com/43nkdh• Continuous monitoring
http://tinyurl.com/3pltdl

Slide 83Joint meeting of the RDU IIA and ISACA chaptersNovember 11, 2008, Capitol Club, Raleigh, NC
Excel macros used in auditing
• Excel as an audit software http://tinyurl.com/6h3ye7
• Selected macros - http://tinyurl.com/576tp8
• Spreadsheets forever - http://tinyurl.com/5ppl7t

Slide 84Joint meeting of the RDU IIA and ISACA chaptersNovember 11, 2008, Capitol Club, Raleigh, NC
Contact info
• E-mail: [email protected]
• Web: http://ezrstats.com