Embed Size (px)
Citation preview

Journal of Engineering Science and Technology Vol. 11, No. 7 (2016) 1041 - 1055 © School of Engineering, Taylor’s University
1041
JOINT ECONOMIC AND ENVIRONMENTAL OPTIMIZATION OF HYBRID POWER SUPPLY FOR LARGE SCALE RO-DESALINATION
PLANT: WITH AND WITHOUT CO2 SEQUESTRATION
EMAN A. TORA
Department of Chemical Engineering & Pilot Plant, Division of Engineering,
National Research Centre, 12311, El Dokki, Cairo, Egypt
E-mail:[email protected]
Abstract
In this paper, a multi- objective optimization approach is introduced to define a
hybrid power supply system for a large scale RO- desalination plant. The target
is to integrate a number of locally available energy resources to generate the
electricity demand of the RO- desalination plant with minimizing both the
electricity generation cost and the greenhouse gas emissions whereby carbon
dioxide sequestration may be an option. The considered energy resources and
technologies are wind turbines, solar PV, combined cycles with natural gas
turbines, combined cycles with coal gasification, pulverized coal with flue gas
desulfurization, and biomass combined heat and power CHP. These variable
energy resources are investigated under different constraints on the renewable
energy contribution. Likewise, the effect of carbon dioxide sequestration is
included. Accordingly, five scenarios have been analyzed. Trade- offs between
the minimum electricity generation cost and the minimum greenhouse gas
emissions have been determined and represented in Pareto curves using the
constraint method (). The results highlight that among the studied fossil fuel
technologies, the integrated combined cycle natural gas turbines can provide
considerable fraction of the needed power supply. Likewise, wind turbines are
the most effective technology among renewable energy options. When CO2
sequestration applied, the costs increase and significant changes in the optimum
combination of renewable energy resources have been monitored. In that case,
solar PV starts to appreciably compete. The optimum mix of energy resources
extends to include biomass CHP as well.
Keywords: Hybrid energy system, Desalination, Optimization, CO2 sequestration.
1. Introduction
Fresh water resources are limited in some countries. Water poverty becomes a risk
that threatens many countries overall the world. To cope with this severe shortage

1042 E. A. Tora
Journal of Engineering Science and Technology July 2016, Vol. 11(7)
Nomenclatures
C Electricity generated by combined cycle gas turbines, kWh
CCGT Combined cycle gas turbines
CHP Combined heat and power, cogeneration
E Electricity generated by PV, kWe
G GHGE,g C/ kWh
GHG Greenhouse gas emissions
IGCC Integrated gasification combined cycle
PF FGD Pulverized fuel with flue gas desulfurization
PV Solar photovoltaic cells
RO Reverse osmosis desalination
W Electricity generated by wind turbines, kWh
Greek Symbols
The constraint Method, a method to solve multi-objective
optimization problems
Abbreviations
i Energy resource number, index
and overcomes its adverse effects, desalination of sea and brackish water has been
considered intensively to a level that gulf countries become fully depending on
water desalination as its water resource [1]. Worldwide, there are 16 000
desalination plants with typically 70 million m3/day capacity [2] and it's anticipated
to have more desalinated water production motivated by the relatively reduced
capital cost of the desalination systems [3], but the intensive energy consumption by
desalination systems is still a challenge, about 75.2 TWh per year.
Thermal desalination and reverse osmosis (RO) based desalination are two
well-known and- developed technologies whereby they have been used widely.
Nonetheless, typically 70% of the thermal plants globally have shifted to RO for
being lower energy consuming [4] and now RO is the most used desalination
technology [5]. There are other advantages of RO; these include simple operation,
modular design, compact and scalable, fast installation, and easy maintenance
[6,7]. Furthermore, RO is flexible as it is able to handle dynamic profile feed and
throughput in terms of quantity and quality. Likewise, RO can run under different
operating conditions and employ variable types of membranes which make it well
fit the requirements of different sectors: industrial processes, domestic drinking
water, commercial applications, etc. [8-10].
Concert efforts have been made to optimize the design, structure and operation
of RO- desalination. Nonetheless, most of them directed the optimization toward
the early stage- before installation. As far as the author knows, it is rare to find a
study dealing with the problems countering the RO- units during the operation
and define solutions. In this study, an approach is developed to address this issue
as a step toward empower RO- operators to quickly overcome any emerging
problems. The optimum operating conditions that favour minimizing the energy
consumption and retain the productivity to its original value or the highest likely
value are identified.

Joint Economic and Environmental Optimization of Hybrid Power Supply . . . . 1043
Journal of Engineering Science and Technology July 2016, Vol. 11(7)
The target of the model herein is to predict precisely the flow rate of water
through the RO-membrane, likewise the salt rejection. There are currently a
considerable number of good models; Marcovecchio et al. [11] reported that
Kimura-Sourirajan model is the most used one for its validated and proved
prediction accuracy. Therefore, this model is selected here to underlie the
proposed optimization approach. Nonetheless, another model is needed altogether
to describe the solute concentration on membrane surface, especially in view of
the concentration polarization on the cross linked membrane surface. For this
issue (concentration polarization prediction) Sassi and Mujtaba [12] proposed
successfully applying the film theory model developed by Michaels in 1968 [13].
Kimura-Sourirajan model and the film theory act herein as the basis to build up of
it the optimization model.
Many researchers have conducted studies to optimize the RO- desalination. A
number of different objective functions were targeted which included minimizing
the total cost [11], minimizing the specific energy [12], minimizing the total
annualized cost [14-16], and maximizing the energy recovery [17].
2. Problem Definition and Objective
Renewable energy resources include hydropower, geothermal energy, solar
energy, wind energy, etc. Solar energy and wind energy may be the most
abundant. The availability of these two sources varies from place to place; some
places are rich in both but others have some limitations. Both are intermittent
resources, but solar energy is available during the morning and wind energy
becomes more intense at night [18]. The worldwide distribution of solar energy
and wind energy indicates the high potential to integrate both of them in favour of
getting stable power supply, especially when integrated with other energy sources
such as biomass, process waste heat, and fossil fuels [19-21].
Not only because of this availability feature, but there is another factor
motivating this integration: the technical and environmental characteristics. Each
energy source has its own advantages and disadvantages. For instance, solar PV
has low capital cost relative to other energy sources, but high operating cost [22].
Table 1 lists the capital cost, operating cost of the renewable energy sources
considered in this study.
The third difference distinguishing the different prime energy resources is
the amount of GHG emission that may be produced. GHG emissions include
CO2, NOx, and CH4. In 2012, electricity and heat generation sector produced the
largest share of CO2 worldwide as shown in Fig. 1. Typically 42% of CO2
emissions released from electricity generation plants, and that flowed by the
transportation sector.
Thus concert effort has been made to reduce GHGE releasing from electricity
generation plants. That target is tackled through different routes such as
increasing the efficiency of the fuel utilization through replacing separate
generation plants with co-generation plants [24] that have much higher efficiency.
Another method is to replace fossil fuels, even partially, with renewable cleaner
energies. These two approaches succeeded in reducing the GHG emissions to a
considerable extent as IEA reports documented [25]. Table 2 lists how much CO2
reductions occurred and gives objection how much is anticipated soon.

1044 E. A. Tora
Journal of Engineering Science and Technology July 2016, Vol. 11(7)
In this work, a combination of renewable energy resources and fossil fuels is
investigated as a hybrid energy system for large scale RO- desalination plant. The
objective is to determine the optimum energy mix suitable for a desalination
plant. These plants usually exist in sunny areas, therefore solar energy is
available. Other local renewable energy resources and fossil fuels may be
available. Renewable energies are favoured concerning the environment, but
their costs are still high. Conversely are the fossil fuels. Generalization cannot be
applied here for the feasibility of using specific type of energy resources as it is a
site- specific decision. Thus a suitable methodology is needed to address this
problematic issue along with these opposing factors, and a systematic approach is
needed to solve the problem and define the optimum hybrid energy systems.
Table 1. Costs of electricity generation from renewable energy [22].
Technology Capacity
(kWe)
Capital
cost
($)
Operating
Cost ($/kWe) Life
Fixed Variable
Solar - PV <10
10- 100
100- 1000
1000-10, 000
3910
3819
3344
2667
20
18
15
10
33
33
33
33
Wind <10
10- 100
100- 1000
1000-10, 000
7859
6389
4019
2644
28
38
33
36
14
19
16
20
Biomass CHP 6067 91 0.02 28
Fig. 1. CO2 production by different sectors [23].
Table 2. GHG emissions [25].
Year 1971 1995 2000 2010 2020
Average GHGE,
g C/kWh 00 158 157 151 147
Joint Economic and Environmental Optimization of Hybrid Power Supply . . . . 1045
Journal of Engineering Science and Technology July 2016, Vol. 11(7)
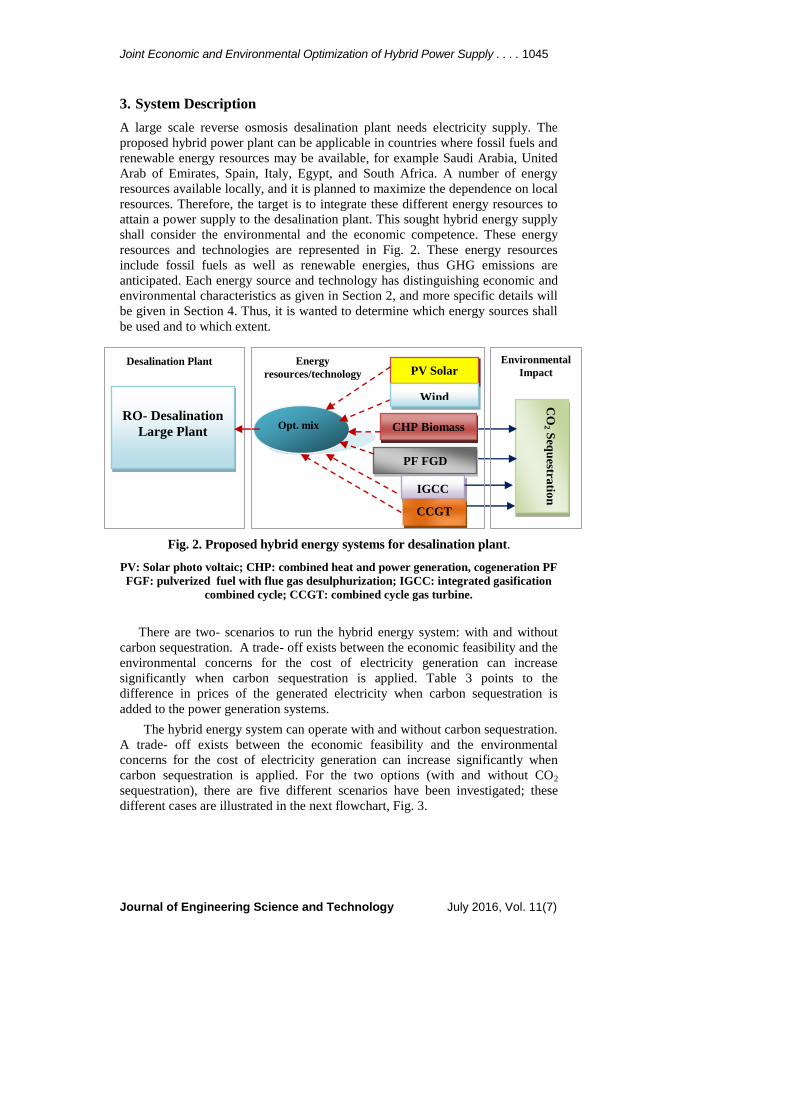
3. System Description
A large scale reverse osmosis desalination plant needs electricity supply. The
proposed hybrid power plant can be applicable in countries where fossil fuels and
renewable energy resources may be available, for example Saudi Arabia, United
Arab of Emirates, Spain, Italy, Egypt, and South Africa. A number of energy
resources available locally, and it is planned to maximize the dependence on local
resources. Therefore, the target is to integrate these different energy resources to
attain a power supply to the desalination plant. This sought hybrid energy supply
shall consider the environmental and the economic competence. These energy
resources and technologies are represented in Fig. 2. These energy resources
include fossil fuels as well as renewable energies, thus GHG emissions are
anticipated. Each energy source and technology has distinguishing economic and
environmental characteristics as given in Section 2, and more specific details will
be given in Section 4. Thus, it is wanted to determine which energy sources shall
be used and to which extent.
Fig. 2. Proposed hybrid energy systems for desalination plant.
PV: Solar photo voltaic; CHP: combined heat and power generation, cogeneration PF
FGF: pulverized fuel with flue gas desulphurization; IGCC: integrated gasification
combined cycle; CCGT: combined cycle gas turbine.
There are two- scenarios to run the hybrid energy system: with and without
carbon sequestration. A trade- off exists between the economic feasibility and the
environmental concerns for the cost of electricity generation can increase
significantly when carbon sequestration is applied. Table 3 points to the
difference in prices of the generated electricity when carbon sequestration is
added to the power generation systems.
The hybrid energy system can operate with and without carbon sequestration.
A trade- off exists between the economic feasibility and the environmental
concerns for the cost of electricity generation can increase significantly when
carbon sequestration is applied. For the two options (with and without CO2
sequestration), there are five different scenarios have been investigated; these
different cases are illustrated in the next flowchart, Fig. 3.
RO- Desalination
Large Plant
PV Solar
CHP Biomass
PF FGD
IGCC
CCGT
Opt. mix
CO
2 Seq
uestra
tion
Wind
Energy
resources/technology
Environmental
Impact Desalination Plant

1046 E. A. Tora
Journal of Engineering Science and Technology July 2016, Vol. 11(7)
Fig. 3. The investigated scenarios.
4. Methodology and Solution Approach
4.1. Optimization methodology
The pre-scribed system and the targeted hybrid energy supply problem is
mathematically formulated herein as a multi- objective optimization. This is
attributed to having two contrasting objectives: minimization the electricity
generation cost and minimization the greenhouse gas emissions GHGE. Most
often reducing the GHGE is accompanied with padding extra expenses and
consequently increases the cost of electricity generation. The optimization
problem is formulated as follows:
The objective function is to minimize the electricity generation cost f1 and the
greenhouse gas emissions f2:
)},(2),(1{. GEfECfMinFunObj (1)
where f1 is the cost of electricity generation, and f2 is the greenhouse gas
emissions GHGE generated during the electricity generation. The symbols are as
follows: C denotes the cost of electricity generation from particular energy
resource in US dollars and via specific technology i; E is the electricity generated
in kWh; G is the GHGE in g C/kWh. The values of these variables have been
given in Table 3.
i
NE
ii ECf .
11
(2)
i
NE
ii EGf .
12
(3)
Subject to:
RODesRO
NE
ii EQETE
1
(4)
Upper
ii
Lower
i EEE },..1{ NEi (5)

Joint Economic and Environmental Optimization of Hybrid Power Supply . . . . 1047
Journal of Engineering Science and Technology July 2016, Vol. 11(7)
The total power demand TE is the sum of the power attained from the
different energy resources and technologies is determined by capacity of the RO-
desalination plant. The overall energy consumption for whole sea water RO-
desalination plant is typically 3- 4 kWh/m3, ROE [26]. The term DesROQ stands
to the capacity of the RO- desalination plant, and it refers to how many cubic
meters of desalinated water produced daily by the RO plant.
In order to numerically describe the different scenarios, for each scenario an extra
equation is written as follows.
For scenario I all the energy resources are available, and from each energy
source, the whole energy demand can be obtained if the optimization code selects
that. Thus the upper limit of the energy source availability is higher than the entire
energy demand:
ETEUpper
i },..1{ NEi (6)
Scenario I is similar to scenario II, except there is extra cost in scenario II.
This extra expense is due to CO2 sequestration:
For Scenario I, the cost Ci refers only to the electricity generation cost (Cg):
gii CC },..1{ NEi (7)
For Scenario II, the cost Ci consists of the electricity generation cost in
addition to the cost of the CO2 sequestration (Cseq):
seqigii CCC },..1{ NEi (8)
Scenarios III and IV contain one restriction which is the availability of
renewable energy resources (Ei|RE); this is expressed as:
ETE REi )3/2(| },..1{ NEi (9)
The difference between the two scenarios (III and IV) is whether CO2
sequestration takes place or not.
An opposed case is assumed in Scenario V as the availability of renewable
energy resources can be more than two thirds of the total energy demand:
ETE REi )3/2(| },..1{ NEi (10)
4.2. Solution approach
The constraint method is used to solve the optimization problem through three
steps using LINGO software package; a screenshot of the software is given in
Appendix A. This constraint method is selected for its simplicity. The solution
is determined through three steps as follows:
First, solve the optimization problem only considering minimizing the
electricity generation cost; the results represent the maximum possible
GHGE along with the minimum electricity generation cost.
Second, solve the problem accounting for minimizing the GHGE only; the results
are the maximum likely electricity generation cost and minimum GHGE.

1048 E. A. Tora
Journal of Engineering Science and Technology July 2016, Vol. 11(7)
Third solve the problem considering minimizing the electricity generation
cost with setting the GHGE at several values between the maximum and
minimum values of GHGE attained in the first and second steps.
Draw a Pareto curve for different values of between zero and one.
5. Results and Discussion
The problem is solved for five scenarios based on renewable energy allowed
contribution. Also, these scenarios accounted for CO2 sequestration. The model is
solved for a large RO - desalination plant of 300, 000 m3/day.
5.1. Input Data
The environmental impact of each energy source is described via CO2 emissions
in g C/kWh. The economic aspect is represented through the power generation
cost in c/kWh. Both CO2 emissions and sequestration cost have been attained
from the available literature [27-30]. Accordingly, Table 3 points to the
difference in prices of the generated electricity when carbon sequestration is
added to the power generation systems.
Table 3. Cost of electricity generation and GHG emissions.
5.2. Results
5.2.1. Scenario I
In this scenario, there are no restrictions put on the availability of energy
resources. This is to allow the optimization program select the optimum energy
mix in terms of the electricity generation cost and GHGE. There is CO2
sequestration. The candidate energy resources include fossil fuels (combined
cycle gas turbines, pulverized coal, and coal gasification combined cycle) and
renewable energies (solar PV, wind, CHB biomass).
The results of scenario I, which is looking for the optimum hybrid power
supply from the different energy resources given in Table 3, are represented in
Fig. 4 and listed in Table 4.
In Fig. 4, the blue solid line is the Pareto curve which indicates the trade- off
between the minimum electricity generation cost and the minimum GHGE. With
the current conditions, minimum cost can be attained through getting 90% of the
Energy
Technology
(i)
Pulverized
fuel
Integrate
gasification
combined
cycle
Combined
cycle gas
turbine
CHP PV
Wind
turbines
With CO2 Sequestration
Energy
source Coal Coal NG Biomass
Solar
energy Wind
Generation
cost Ci
c/kWh
3.3 6.3 3.2 5.7 2.9 4.4 7 8.5 5 3.5
Emissions
Gi g
C/kWh
247 40 190 37 102 17 100 15 0 0
Joint Economic and Environmental Optimization of Hybrid Power Supply . . . . 1049
Journal of Engineering Science and Technology July 2016, Vol. 11(7)
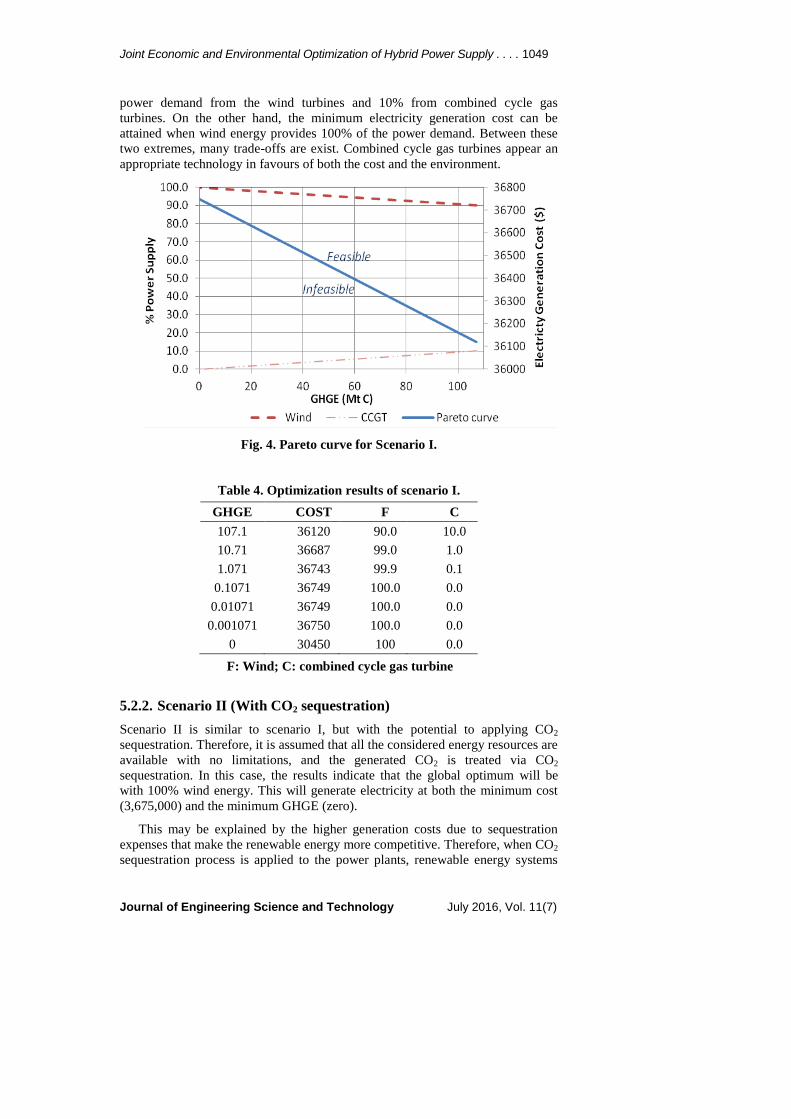
power demand from the wind turbines and 10% from combined cycle gas
turbines. On the other hand, the minimum electricity generation cost can be
attained when wind energy provides 100% of the power demand. Between these
two extremes, many trade-offs are exist. Combined cycle gas turbines appear an
appropriate technology in favours of both the cost and the environment.
Fig. 4. Pareto curve for Scenario I.
Table 4. Optimization results of scenario I.
GHGE COST F C
107.1 36120 90.0 10.0
10.71 36687 99.0 1.0
1.071 36743 99.9 0.1
0.1071 36749 100.0 0.0
0.01071 36749 100.0 0.0
0.001071 36750 100.0 0.0
0 30450 100 0.0
F: Wind; C: combined cycle gas turbine
5.2.2. Scenario II (With CO2 sequestration)
Scenario II is similar to scenario I, but with the potential to applying CO2
sequestration. Therefore, it is assumed that all the considered energy resources are
available with no limitations, and the generated CO2 is treated via CO2
sequestration. In this case, the results indicate that the global optimum will be
with 100% wind energy. This will generate electricity at both the minimum cost
(3,675,000) and the minimum GHGE (zero).
This may be explained by the higher generation costs due to sequestration
expenses that make the renewable energy more competitive. Therefore, when CO2
sequestration process is applied to the power plants, renewable energy systems

1050 E. A. Tora
Journal of Engineering Science and Technology July 2016, Vol. 11(7)
may become more attractive and become competitive to fossil fuels. Also, wind
energy has the highest potential as a competitor for the fossil fuels.
5.2.3. Scenario III (Renewable energy less than 2/3 total power supply)
with no CO2 sequestration)
In this scenario, a different case has been investigated via putting limitations on
the availability of the renewable energy resources. The restriction is less than two-
thirds of the power supply can be attained from renewable energy resources. This
limitation is assumed for in many locations, there may be availability of either
wind energy or solar energy, but not both. Also, some locations are poor in
renewable energy resources and these resources may not be available adequately
to reply on them as the main power supply.
Figure 5 shows the changes in the optimum hybrid power supply due to
setting a restriction on the availability of renewable energy resources. For
instance, Pareto curve indicates that zero GHGE is not possible in the current
case. Another change is represented by the dash lines; this is the optimum
combination of energy resources have been changed. In Scenario I, the optimum
combination was using wind turbines along with combined cycle natural gas
turbines. Nonetheless, in Scenario III, the optimum combination includes four
energy resources and technologies instead of two; these four technologies are gas
turbines, combined heat and power of biomass, wind turbines, and solar
photovoltaic, see Table 5. It is clear that combined cycle gas turbines has a
significant share in the two scenarios, and that can be illustrated by using natural
gas which is the cleanest fossil fuel.
Fig. 5. Results of Scenario III.
5.2.4. Scenario IV (Renewable energy less than 2/3 total power supply)
with CO2 sequestration
This case is similar to Scenario III but with applying CO2 sequestration. Costs of
capturing, transporting, and storing CO2 released from the fossil fuel power
supply is added to the electricity generation from these resources which rises its

Joint Economic and Environmental Optimization of Hybrid Power Supply . . . . 1051
Journal of Engineering Science and Technology July 2016, Vol. 11(7)
generation cost. On the other hand, the GHGE release to atmosphere decreases.
Therefore, a completely different Pareto curve is obtained as represented in Fig. 6.
The most important characteristic of the new curve is the range of the cost; the
cost of electricity generation becomes higher than the foregoing scenarios.
Table 5. Results of optimization of Scenario III.
COST GHGE C D F E
305 0.1071 100 0 0 0
306 0.105 100 0 0 0
307 0.103 96.2 0 3.8 0
309 0.1 93.4 0 6.6 0
309 0.09 84.0 0 16.0 0
320 0.08 74.7 0 25.3 0
788 0.07 50 50 25 25
C: combined cycle gas turbine; D: combined heat and power; F: wind energy;
E: solar photo voltaic
Another difference is the optimum energy mix. All the available wind energy
is used, but no solar energy. Wind turbines and combined cycles gas turbines are
certain competitor for solar energy, see Table 6.
Fig. 6. Results of Scenario IV.
5.2.5. Scenario V (Renewable energy provides more than 2/3 total
power supply) with CO2 sequestration
Here there is higher contribution from renewable energy which relatively has
higher electricity generation along with the extra expense of CO2 sequestration.
Thus as it is very clear from the Pareto curve, the optimum system has the highest
cost, and the reduction in the cost with changing the amount of allowed GHGE is
considerably small - Pareto is almost horizontal as given in Fig. 7.

1052 E. A. Tora
Journal of Engineering Science and Technology July 2016, Vol. 11(7)
Table 6. Results of Scenario IV.
Cost GHGE C D F
43.05 0.119 66.67 0 33.3
47.15 0.117 57.14 9.5 33.3
51.25 0.115 47.62 19.0 33.3
55.35 0.113 38.10 28.6 33.3
59.45 0.113 28.57 38.1 33.3
63.55 0.109 19.05 47.6 33.3
67.65 0.107 9.52 57.1 33.3
71.75 0.105 0 66.7 33.3
The dash lines referring to the employed energy resources and their
contribution fraction have highly fluctuated profile; the values are listed in Table
6. This indicates that under the current scenarios, defining the optimum hybrid
system has huge variety and several options. Furthermore, the solar PV line
appears in all the possible trade-offs. Hence solar PV shall have higher
contribution when environment protection policies such as imposing CO2
sequestration implemented.
Table 7. Results of Scenario IV.
COST GHGE C D E F
574 5.95 25 0 25 50
604.7 5.8 13.4 36.2 16.9 33.81643
625.25 5.7 49.5 27.5 7.7 15.38462
666.25 5.4 27.5 49.5 7.7 15.38462
686.75 5.3 36.1 13.3 16.9 33.73494
717.5 5.25 0 25 25 50
C: combined cycle gas turbine; D: combined heat and power; F: wind
energy; E: solar photo voltaic
Fig. 7. Results of Scenario IV.

Joint Economic and Environmental Optimization of Hybrid Power Supply . . . . 1053
Journal of Engineering Science and Technology July 2016, Vol. 11(7)
6. Conclusion
A hybrid power supply for a large scale RO- desalination plant is proposed and
optimized considering the joint environmental and economic aspects. Several
scenarios are considered based on the maximum allowed or available renewable
energy resources. Likewise, the optimization is conducted with and without CO2
sequestration. There is no unique optimum hybrid power supply for desalination
system as the economic value of each energy resource is site- specific. So no
generalization can be done, but there are clear trends that cannot be dismissed.
When analyzing different scenarios, some particular trends appear as follows:
Wind energy has the highest potential as energy source among the studied
cases herein; this is in terms of both the cost and the impact on the
environment. Integrated combined gas turbine is one of the most attractive
energy systems. Solar PV will have higher contribution if fossil fuel power
plants are imposed to apply CO2 sequestration.
Applying CO2 sequestration will increase the electricity generation from
fossil fuel plants, even the ones using cheap fuels such as coal. In this case,
renewable energies especially wind turbines - followed by solar PV - will
compete strongly and become competitive.
With no CO2 sequestration, the optimum hybrid power supply integrates the
wind turbines with the natural gas turbines. With CO2 sequestration, the
optimum hybrid power supply integrates the wind turbines, the solar PV, the
gas turbines, and the biomass combined heat and power. There are several
combinations and trade- offs according to the allowed GHGE. All are
optimum trade-offs yet which one to be applied is to be selected by the
decision maker.
References
1. Sassi, K.M.; and Iqbal, M. M. (2011). Optimal design and operation of
reverse osmosis desalination process with membrane fouling. Chemical
Engineering Journal, 171, 582- 593.
2. United Nation (UN) Water (2014). Retrieved January 21, 2015, from
http://www.unwater.org/statistics/statistics-detail/fi/c/211827/
3. Wilf, M. (2015). Fundamentals of RO-NF technology. Retrieved January 21,
2016, from http://www.membranes.com.
4. Greenlee, L.F. (2009). Reverse osmosis desalination: Water sources,
technology, and today’s challenges. Water Research, 43(9), 2317-2348.
5. Fritzmann, C.; Lowenberg, G.; Wintgens, T.; and Melin, T. (2007). State-of-
the-art of reverse osmosis desalination. Desalination, 216, 1-76.
6. Marcovecchio, M.G.; Aguirre, P.A.; and Scenna, N. G. (2005). Global
optimal design of reverse osmosis networks for seawater desalination:
modeling and algorithm. Desalination, 184, 259-271.
7. Abbas, A.; and Al-Bastaki,N. M. (2005). Modeling of an RO water desalination
unit using neural networks. Chemical Engineering Journal, 114, 139-143.
8. Redondo, J.A.; and Casanas, A. (2001). Designing seawater RO for clean and
fouling RO feed. Desalination experiences with the FilmTec SW30HR-380

1054 E. A. Tora
Journal of Engineering Science and Technology July 2016, Vol. 11(7)
and SW30HR-320 elements - technical - economic review. Desalination,
134, 83-92.
9. Busch, M; and Mickols W.E. (2004), Reducing energy consumption in
seawater desalination, Desalination, 165, 299-312.
10. Membrane Technical Information (2015). Retrieved January 21, 2016, from
http://www.dow.com/liquidseps/service/lm techinfo.htm.
11. Marcovecchio,M.G; Aguirre,P.A; and Scenna,N.J. (2005). Global optimal
design of reverse osmosis networks for seawater desalination: modeling and
algorithm. Desalination, 184, 259-271.
12. Sassi, K.M.; and Iqbal, M.M. (2011). Optimal design and operation of
reverse osmosis desalination process with membrane fouling. Chemical
Engineering Journal, 171, 582- 593.
13. Michaels, A.S. (1968). New separation technique for the chemical process
industries. Chemical Engineering Progress, 64, 31-43.
14. Zhu, M.J.; El Halwagi, M.M.; and AlAhmad, M. (1997). Optimal design and
scheduling of flexible reverse osmosis networks. Journal of Membrane
Science, 129, 161-174.
15. Lu, Y.Y; Hu, Y.D.; Zhang, X.L.; Wu, L.Y.; and Liu, Q.Z. (2007). Optimum
design of reverse osmosis system under different feed concentration and
product specification. Journal of Membrane Science, 287, 219-229.
16. Sassi, K.M.; and Mujtaba,I.M. (2011). Optimal design and operation of
reverse osmosis desalination process with membrane fouling. Chemical
Engineering Journal, 171, 582- 593.
17. Villafafila, A.; and Mujtaba, I.M. (2003). Fresh water by reverse osmosis
based desalination: simulation and optimization. Desalination, 155, 1-13.
18. Tora, E.A.; Wikus, N.; Foucher, E.; and Brent, A. (2015). State of the art on
modelling techniques for renewable energy integration into the energy mix.
International Journal of Advanced Information Science and Technology,
40(40), 204- 215.
19. Puig-Arnavat, M.; Tora, E.A.; Bruno, J.C.; and Coronas, A. (2013). State of
the art on reactor designs for solar gasification of carbonaceous feedstock.
Solar Energy, 97, 67- 84.
20. Tora, E.A.; and El-Halwagi, M.M. (2009). Optimal design and integration of
solar systems and fossil fuels for sustainable and stable power supply. Clean
Technology and Environment Policy, 11, 401- 407.
21. Tora, E.A.; and El-Halwagi, M.M. (2011). Integrated conceptual design of
solar- assisted tri generation systems. Computers and Chemical Engineering,
35, 1807- 1814.
22. National Renewable Energy Laboratory (2015). Retrieved January 21, 2016,
from http://www.nrel.gov/analysis/tech_lcoe_re_cost_est.html
23. IEA (2014). CO2 Emission from fuel combustion high lightenings,
International Energy Agency IEA, Paris. Retrieved January 21, 2016, from
https://www.iea.org/publications/freepublications/publication/CO2Emissions
FromFuelCombustionHighlights2014.pdf
24. Ponce-Ortega, J.M.; Tora, E.A.; and Gonzalez- Campos, J.B.; El-Halwagi,
M.M. (2011). Integration of renewable energy with industrial absorption

Joint Economic and Environmental Optimization of Hybrid Power Supply . . . . 1055
Journal of Engineering Science and Technology July 2016, Vol. 11(7)
refrigeration systems: systematic design and operation with technical,
economic, and environmental objectives. Industrial and Engineering
Chemistry Research, 50 (16), 9667- 9684.
25. IEA Energy Technology Essentials (2007). Biomass for power generation
and CHP. Retrieved February 16, 2016, from https://www.iea.org/
publications/freepublications/publication/essentials3.pdf
26. Elimelech, M. (2012). Seawater desalination. NWRI Clarke Prize
Conference, Newport Beach, California, USA.
27. Sims, R.E.H.; Rogner, H.; and Gregory, K. (2003). Carbon emission and
mitigation cost comparisons between fossil fuel, nuclear and renewable
energy resources for electricity generation. Energy Policy, 31, 1315- 1326.
28. US Environmental Protection Agency, EPA (2007). Retrieved January 21,
2016, from http://www3.epa.gov/chp/documents/biomass_chp_catalog.pdf
29. Environment Agency (2015). Retrieved January 21, 2016, from
http://www.globalbioenergy.org/uploads/media/0904_Environment_Agency_
Minimising_greenhouse_gas_emissions_from_biomass_energy_generation.pdf
30. Parkinson, G. (2015). Solar at 2c/kWh- the cheapest source of electricity.
Renew Economy. Retrieved January 201, 2016, from http://reneweconomy.
com.au/2015/solar-2ckwh-cheapest-source-electricity-47282
Appendix A A screenshot of the Optimization Program, LINGO.
In the present work LINGO software package has been used for the calculation of the
optimum energy mix based on their economic and environmental characteristics. A
screenshot of the optimization program, LINGO, is given in Fig. A-1.
Fig. A-1. Screenshot of the Basic LINGO Program Used in this Study.


