Embed Size (px)
Citation preview

Joint Delivery ReportJuly 2006
Joint Delivery ReportJuly 2006

If you would like this information in a different format,for example Braille, audiotape, large print or computerdisc, or community languages, please contact:Joint Local Transport Plan TeamWilder HouseWilder StreetBristolBS2 8PHtel: 0117 922 4921email: [email protected]
All maps are reproduced from Ordnance Survey material with thepermission of Ordnance Survey on behalf of the Controller of HerMajesty’s Stationery Office Crown copyright. Unauthorised reproductioninfringes Crown copyright and may lead to prosecution or civilproceedings. Bristol City Council Licence No. 100023406 2006.

i
Contents Page
1. Introduction 1Setting the Scene 1
Joint Arrangements 3
The First Round of Local Transport Plans 3
Delivery of the First Local Transport Plans 4
Joint Delivery Report 5
2. Impact of the First Local Transport Plans 7Overview 7
What Difference Has the First LTP Made? 7
What Are the key Achievements of the First LTP? 8
Have the Key Aims and Objectives of the LTP Been Achieved? 11
Changes to Key Aims and Objectives Since the First LTP 21
What Has Worked Well and What Can Be Improved? 23
What Foundations For the Longer Term Have Been Put in Place? 26
3. Contribution to Wider Objectives 29Housing and Economic Development 29
Community Strategies, Corporate Plans 30and Partnership Working
Chosen Themes 30
City and Town Centre Vitality and Viability 30
• Background 30
• Changing the Face of Bristol 30
• Conserving Bath as a World Heritage Site 32
• Regenerating The Resort of Weston-super-Mare 34
• Strengthening Other Town Centres 34
• Supporting Our District Centres 35
Social Inclusion 36
• Background 36
• Getting Around by Bus 36
• Making Buses More Accessible 37
• Better Information 38
• Expanding The Role of Community Transport 38
• Other Ways We Have Aided Social Inclusion 39
Joint Delivery Report

ii
4. Progress towards Targets 41Overall progress on Core Targets 41
Intergrated Transport 42
• Bus Patronage and Satisfaction 42
• Remedial Action for Buses 43
• Road Casualties 43
• Road Safety Remedial Action 44
• Child Road Casualties 45
• Cycling 45
• Remedial Action for Cycling 46
• Rural Accessibility 46
Highway Maintenance 47
• Background 47
• Condition of Principal Roads 47
• Condition of Non-Principal Roads 48
• Condition of Unclassified Roads 49
• Footways 49
• Bridges and Structures 49
• Capital Spending 51
• Revenue Spending 51
Progress on Local Targets 51
Summary 51
5. Delivery of LTP Strategies 53Introduction 53
Table 5.1 - Public Transport 54
Table 5.2 - Road Safety 66
Table 5.3 - Sustainable Transport 71
Table 5.4 - Cycling 79
Table 5.5 - Travel Plans 83
6. Conclusion 89Table 6.1 - Our Archievements 89
Proforma A Tables 93
Glossary of Terms 103
Finance Forms are available separately on request

1
Joint Delivery Report
BRISTOL
Bath
Yate
Kingswood
Keynsham
Saltford
Thornbury
Winterbourne/FramptonCotterell
ChippingSodbury
NorthFringe
CribbsCauseway
Avonmouth/Severnside
Weston super Mare
Portishead
Clevedon
Nailsea
Yatton Backwell
South Bristol
NortonRadstock
SOUTHGLOUCESTERSHIRE
BATH AND NORTHEAST SOMERSET
NORTH SOMERSET
SOMERSET
WILTSHIRE
GLOUCESTERSHIRE
Severn
Estuary
BristolInternationalAirport
Motorway and Interchange
Main road
Railway line and station
Local Authority boundary
Green Belt
N0 5km
© Crown Copyright. All rights reserved. Bristol City Council. Licence No. 100023406 2006
1. Introduction
Setting the Scene1.1 Welcome to our Joint Delivery Report. We
are the Councils of Bath and North EastSomerset, Bristol City, North Somersetand South Gloucestershire (go to Figure1.1 and Box 1A) and we have cometogether to report on how much we haveachieved during our first Local TransportPlans over the years 2001 to 2006.
1.2 Our achievements are across the board.An extra 1.2 million people now travel bybus, cycling has gone up 26% and ourtarget to reduce the number of childrenkilled and seriously injured on our roads isbeing met. On schemes, to name just afew, we have delivered the A38 showcasebus corridor, A4 Portway park and ride,
74km of cycle lanes and tracks, 84 20mphzones, 7 Home Zones, 3 High OccupancyVehicle Lanes and innovative publictransport schemes such as the ChewValley Explorer.
1.3 We are continuing this success into theJoint Local Transport Plan (JLTP) 2006 to2011. In recognition of this newpartnership and our close working inimplementing schemes over the last fiveyears we are reviewing our progresstogether through this Joint DeliveryReport. For the purposes of this JointDelivery Report we refer to our area asGreater Bristol. Equally, for simplicity, thefour Councils will be referred to as ‘we’and our first Local Transport Plans referredto as ‘the LTP’.
Figure 1.1 - The Greater Bristol Local Transport Plan Area

2
1.4 Work on the Shared PrioritiesDevelopment Plan with the DfT in 2004showed that more than £300m is requiredto address the under investment intransport that has occurred over the last20 years and lay the foundation for futuregrowth.
1.5 We have faced major challenges over thelife of the LTP. Our area suffers problemswith severe traffic congestion and, insome parts of Bristol and Bath, poor airquality. Problems have been made worseby large scale housing growth andeconomic development, particularly in thenorthern and eastern fringes of the Bristolbuilt up area, that have not beenaccompanied by sufficient investment intransport infrastructure.
1.6 Traffic levels have grown at up to threetimes the national average and place hugepressures on existing infrastructure andservices. Average peak hour traffic speedsin Bristol are down to 16 mph making itone of the most congested cities outsideLondon. 23% of travelling time is spentstationary in traffic queues.
1.7 In Weston-super-Mare growth in housing,a decline in local jobs and access to theM5 has led to high levels of commuting bycar across the Greater Bristol area.
Weston-super-Mare also suffers severecongestion during weekends and seasonalperiods due to high levels of car-bornetourists accessing the town via the M5.
1.8 Clevedon, Nailsea, Portishead, Thornbury,Keynsham, Norton-Radstock and Yatehave also attracted considerableresidential expansion. This has not beenmatched by employment growth withsignificant proportions of the risingpopulations of these towns nowcommuting to jobs in the Bristol area.
1.9 Whilst far less new development hastaken place in the wider rural areas, therehave been significant changes to theireconomic role. This has resulted in muchgreater dependence on the towns andcities. Access to jobs and services hasbecome increasingly difficult with thedispersed nature of jobs, loss of localservices and general lack of publictransport. Some villages suffer fromsignificant through traffic.
1.10 Despite regeneration initiatives, thereremain substantial problems ofdeprivation. There are 35 areas in Bristoland 6 in Weston-super-Mare that areamongst the 10% most deprivedcommunities in England (Index ofMultiple Deprivation, 2004). There are also
Box 1A
The Greater Bristol Local Transport Plan Area
Our area has around 1 million residents and provides around 500,000 jobs. Most people live in thethree principal urban areas and seven towns but 16% live in villages and the wider countryside.The area provides services for a wide hinterland stretching into the neighbouring counties ofGloucestershire, Monmouthshire, Somerset and Wiltshire and is the main focus for shopping,cultural activities and education in the South West.
The area is vital to the economy of the South West and the United Kingdom with BristolInternational Airport and the Port of Bristol acting as gateways for the region. The Greater Bristolarea also contributes to the national economy in a more direct way. Bristol is one of 8 Core Cities,comprising the main urban centres outside London and is the major city in the South West. TheGreater Bristol area’s economy makes up 26% of regional Gross Value Added (GVA).
Bath is a significant sub-regional centre and is designated as a World Heritage Site, reflecting itsinternational importance for its architecture, town planning, landscape, archaeological remainsand social history. The traditional seaside resort of Weston-super-Mare has expanded to becomethe area’s third urban centre.

3
other pockets of deprivation in other partsof our urban and rural areas. Roadaccident levels in all these deprived areasare high, particularly involving children.
Joint Arrangements1.11 In 2000 we produced our own Local
Transport Plans for the period 2001 to2006. Since then we have joined forces tosubmit to the Government in March 2006a Joint Local Transport Plan (JLTP) for theperiod 2006 to 2011. We believe jointworking brings with it many benefits forthose living and working in the area:
• Problems and issues are not confinedto local authority boundaries.
• Opportunity for a strategic approachto plan solutions that suit the complexnature of trips across our area.
• Seek to build on existing joint workingand achieve improved value for moneyin procurement and delivery.
• Through joint working we have astronger voice when seeking funding.
• Harnesses local knowledge and theopportunity to roll out Best Practice.
1.12 In this same spirit of co-operation we havecome together to prepare this JointDelivery Report which looks back over thefirst round of the LTP and highlightsachievements throughout the GreaterBristol area.
The First Round of Local Transport Plans
1.13 The submission of the first round of theLTP was the culmination of several years’work, building on the Provisional plansproduced in 1999. The overall policyframework was set by national policy,Regional Planning Guidance (RPG10) andthe Joint Replacement Structure Planadopted in 2002. Each Council strove toidentify problems and opportunities,
Joint Delivery Report
LTP2001 - 2006
LTP2001 - 2006
LTP2001 - 2006
LTP2001 - 2006
Local PolicyRegional PolicyNational PolicyConsultation
Close working to implement LTP 2001 - 2006 objectives leadsto a partnership to produce the Joint Local Transport Plan
and a Joint Delivery Report for LTP 2001 - 2006
Greater BristolJoint Local Transport Plan
for 2006 - 2011
LTP 2001 - 2006Joint Delivery Report
AnnualProgressReports
AnnualProgressReports
AnnualProgressReports
AnnualProgressReports
Figure 1.2 - How the Local Transport Plan evolved

4
agree visions and objectives and comeforward with well rounded, integratedtransport strategies and implementationprogrammes. Wide public participationwas key and we all recognised thattransport policy was not an end in itselfbut closely related to, and influenced by, arange of other initiatives. The wholeprocess we went through from the LTP tothe JLTP is shown in Figure 1.2.
1.14 We defined our visions and objectives toreflect local needs whilst taking forwardthe transport aims of the JointReplacement Structure Plan (go toBox 1B). Our plans shared the followingstrategic objectives:
• Enhance the quality of life forresidents and those working in orvisiting the Greater Bristol area,including improvements in health, airquality and the built and naturalenvironment.
• Integrate the LTP with other areas ofpolicy; work towards an integratedand efficient transport system.
• Support a vibrant economy andregeneration; enhance the viabilityand vitality of city and town centres.
• Reduce traffic growth and reduce thenegative impacts of traffic;
• Promote access to everyday facilitiesfor all; recognise cultural diversity,serve local communities.
• Encourage people to change the waythey travel; improve travel choice andpromote attractive alternatives to thecar.
• Reduce road casualties for all roadusers and improve personal safety andsecurity.
Delivery of the First Local Transport Plans
1.15 During the last five years we have carriedout programmes of schemes andmeasures to deliver our strategic and localobjectives and address identifiedproblems and issues. These have includednot only a range of infrastructureimprovements but also ‘smart’ measuresthat seek to encourage behaviouralchange, such as awareness raisingthrough promotional literature andevents, and working with employers topromote sustainable transport for theiremployees. We have encounteredobstacles on the way but also graspednew opportunities (go to Box 1C). Valuefor money has been a key priority alongwith a recognition that transport is closelyintegrated with wider policies andprogrammes (go to Chapter 3).
1.16 Capital allocations from LTP funding havebeen crucial to delivering ourprogrammes, both integrated transportand maintenance. We have investedsubstantial amounts of both capital andrevenue funding from our own resources.We have also attracted significant fundingfrom Government agencies, developersand others.
Box 1B
Joint Replacement Structure Plan Transport Objective
“To establish a transportation pattern whichenables convenience of access, and safe andefficient movement where necessary,particularly through seeking to minimise theneed to travel by car; encouraging publictransport, cycling and walking; and reducingroad traffic”.
(Policy E of Joint Replacement Structure Planadopted 2002)
First round of Local Transport Plans

5
Joint Delivery Report1.17 This Joint Delivery Report charts the
progress we have made in the five years2001 to 2006 through our LTP. It aims toinform not only the Department forTransport (DfT) but also local stakeholdersof our achievements during that time. Butwe are not complacent. There are thingsthat we could have done better and
through our joint working on the JLTP weaim to learn from our experiences.
1.18 The remainder of the report contains:
• Chapter 2 analyses the overall impacton the Greater Bristol area of the firstLTP, key achievements and lessons forthe JLTP.
• Chapter 3 looks at how the LTP hascontributed to wider objectives.
• Chapter 4 charts progress on coretargets and highway maintenanceduring the five years 2001-2006.
• Chapter 5 demonstrates how we havedelivered our strategies for publictransport, road safety, sustainabletransport, travel plans and cycling.
• Chapter 6 provides the summary ofthe story so far.
Joint Delivery Report
Box 1C
Delivery and Continuous Improvement
Prior to the start of the Joint LTP process thefour Councils were already engaged on workto improve their Local Transport Plans. BristolCity Council’s Integrated Transport Best ValueReview is one example. Through acomprehensive round of conferences andworkshops with interested bodies andorganisations, ways to enhance schemedelivery were identified.
South Gloucestershire Council undertook aFundamental Service Review on Congestion.Extensive research over an 18 month periodproduced a ‘Framework for Dealing withTackling Congestion’. In effect this is a toolkit,a set of measures to choose from, dependingon the congestion problem.
North Somerset Council’s LTP performance hasimproved greatly following an AuditCommission inspection rating as “Fair” with“Promising prospects for improvement.” Sincethen the Council has since developed andimplemented an improvement planidentifying opportunities to enhanceengagement with stakeholders, consider moreeffective procurement approaches anddevelop a more effective road safety plan.
This drive for continued improvements isbased on a proven track record in projectmanagement and delivery. We havecoordinated complex multi-million poundEuropean Commission supported projects thatare subject to rigorous scrutiny in project andfinancial management. Progress made bySouth Gloucestershire has been recognisedthrough its award as Centre of Excellence forscheme delivery.

7
2. Impact of the First LocalTransport Plans
Overview2.1 This chapter sets out the LTP
achievements and impacts. It looks at thedifference implementing the LTP hasmade against the plan’s original aims andobjectives. What worked well and indeedless well are highlighted, as are thefoundations we have put in place for theJoint Local Transport Plan.
What Difference Has the First LTP Made?
2.2 Our area is a safer and easier place to getaround as a result of the LTP.
2.3 Whether it is delivering 12% growth inbus patronage on the A38 showcasecorridor or the very popular A4 Portwaypark and ride or the 10% cut in traffic inthe central area of Bristol or the 40%increase in people cycling or our HighOccupancy Vehicle lanes making journeys21% quicker for car sharers and taking1,000 cars a day off the A4174, the LTP hasprovided the focus and the foundation forturning our aspirations into reality.
2.4 We have met our objectives (go to Table2.2) and tackled the problems ofcongestion, traffic growth at up to threetimes national levels, massive growth inhousing and rural accessibility outlined inChapter 1.
2.5 More local impacts have been keenly feltby residents. Dedicated School Travel Planofficers developing School Travel Planshave led to reductions in traffic at peaktimes, reducing congestion and easingparking problems. Then there are theadditional benefits of making thesurrounding roads safer for childrenwalking or cycling to school.
2.6 Community transport has beenrevolutionised with a fast developingnetwork of services and record numbersof passengers carried. Without theseservices many residents would not be ableto make the journeys they do. Shopping
trips, health trips or simply trips to seefriends are now much easier, especiallyfor the elderly and less mobile.
2.7 Accident levels, particularly for childrenkilled and seriously injured, have fallen totheir lowest levels since 1996. The roadstoo have improved. More funding formaintenance has cut the backlog for partsof the network.
2.8 We have established a set of transportuser priorities. This helps us to targetinvestment, reallocate road space andensure good design in new developmentsfor our priority modes of transport.Pedestrians, cyclists, public transport anddisabled people come at the top of our listwith the single occupant private car usertowards the bottom.
2.9 The LTP has provided the impetus to workalongside other areas of policy, planningand implementation. This has enabledthe delivery of large-scale projects thatimpact not only on transport but on areassuch as improving the town centreenvironment and stimulating economicregeneration. Pooling resources has meantsubstantial projects can be implementedto a greater combined impact than justtransport schemes alone. Schemes suchas the new bus and coach station, £500mregeneration of the Broadmead shoppingcentre and redevelopment of Harboursideand Queen Square in Bristol, Big LampCorner in Weston-super-Mare, KingswoodTown Centre and Walcot Street in Bathhave all delivered greatly enhanced localenvironments and stimulated localbusiness.
Joint Delivery Report
Bradley Stoke secondary school cycle racks

8
2.10 Co-ordination and working closely withthe bus industry has led to improvedservice provision, investment in staff, newlow emission, and easy access buses.Costing £13.5m, 116 new buses are on thestreets in Bath greatly improvingreliability and service frequencies andraising bus patronage.
2.11 Without the LTP traffic levels would havegrown unchecked. Cycle use would havestayed static at best. Bus passengerswould not have grown by over a million.Accidents would have still fallen due toour long track record in road safety but ata slower rate. The road maintenancebacklog would have taken longer totackle. People are healthier. Thepercentage of residents taking exercise,walking/cycling, five times a week hasincreased by 30% over the LTP (BristolQuality of Life Survey, 2005). In short theLTP has made a difference.
What are the Key Achievements of The First LTP?
2.12 The achievements of the LTP can besummarised as:
• Innovation
• Integration
• Investment
• Delivery
• Meeting Targets
Innovation2.13 Whilst our LTP had a strong focus on tried
and tested, value for money schemes wehave had to be equally innovative in our
approach in tackling our congestion,traffic growth and accessibility problems.Innovation has been encouragedthroughout the LTP, introducing a FreightConsolidation Centre, hospital servingpark and ride, High Occupancy VehicleLanes, www.2carshare.com, ferries, taxisharing, the first purpose built CycleResource Centre in the UK, electric poolcars for staff, Clear Zone trailblazer andthe now nationally adopted ‘Walk onWednesdays’ school travel initiative. Wehave tackled problems and issues ratherthan simply focusing on trying toimplement schemes.
2.14 Our LTP presided over the shift from‘output’ to ‘outcome’ targets. We met thischallenge developing and refining ourapproaches and targets. In 2003 forexample South Gloucestershire was facedwith more than 50 local targets, manybased around scheme numbers. Anextensive public consultation exercisetrimmed these back to 31 enhancedoutcome based targets.
2.15 North Somerset Council’s cycling targetswere adjusted in 2004. The LTP set anumber of targets (including output ones)for the LTP period and up to 2012 for eachof the main towns in the district. In 2004the Council adjusted this by setting asingle target for the whole district anddropping the output targets.
Integration2.16 We have worked at every level, internally
and externally, locally, regionally,nationally and internationally to integratethe LTP into the wider picture. We have
New bus fleet
HOV Lane

9
built on the relationship betweentransport demand and land-use planningin our Local Plans and emerging LocalDevelopment Frameworks.
2.17 We have worked with statutory andvoluntary service providers to deliver ourCommunity Strategies’ transportobjectives (go to Chapter 3). Our Qualityof Life indicators for improving transportand accessibility are being met throughthe Bristol Neighbourhood RenewalStrategy, Weston Vision, the Mendip andCotswolds Areas of Outstanding NaturalBeauty management plans, the Forest ofAvon Plan, Primary Care Trusts actionplans, Crime and Disorder Partnershipsand Active for Life initiatives.
2.18 Internally we have set up new structuresto deal with the changing transportenvironment integrating social services,education and public transport. Acrossthe South West we have linked into theRegional Spatial Strategy and helped steerits Transport Strategy. Nationally andinternationally we have taken part in theVIVALDI (Visionary and Visible Actionsthrough Local Transport DemonstrationInitiatives) clean urban transportstrategies and the PRoGRESS (PriorityRoad Use for Greater Responsibilities,Efficiency and Sustainability in Cities)urban transport pricing schemes projects.
Investment2.19 We have invested heavily in our LTP. Not
just with LTP integrated transportallocation but also with our own capitaland revenue resources. We have alsoattracted over £40m of externalinvestment from Government, Europeanand private sector funds and bids. Table2.1 lists the range of successful funding.
2.20 Bidding for recycled Supplementary CreditApproval (SCA) has been just assuccessful. SCA funding for theemergency slope stabilisation work atHinton Hill, completion of the Rural BusInterchange Hub programme andresolving roadside hazards caused by deadelms are all good examples of how we can
bid for and spend funding efficiently andeffectively.
2.21 Cultivating partnerships, meeting ourjoint aspirations and promoting commonunderstanding are all positive outcomesfrom this investment.
Joint Delivery Report
Table 2.1: Successful TransportFunding outside the LTP
European Projects (VIVALDI, PRoGRESS) £2.7m
South West Regional Development Agency £5m
Department of Environment Food and £0.6mRural Affairs
Objective 2, Single Regeneration Budget, £0.21m URBAN
Aggregate Fund Levy £0.01m
Sustrans £0.11m
Developer contributions £14.1m
New Deal funding £0.51m
New Opportunities Fund £0.25m
Public Service Agreements £1.7m
Child Pedestrian Training Scheme grants £0.16m
Child Pedestrian Casualty Reduction grants £0.1m
School Travel Plan bursaries £0.28m
Voluntary Travel Plan bursaries £0.28m
Urban Bus challenge £1.68m
Rural Bus Challenge £1.23m
Rural Bus Subsidy Grant £3.3m
Home Zone Challenge £0.6m
LTP supplementary bids £4.7m (including Vivaldi, A4174 Ring Road)
LTP Exceptional Maintenance Bids £4.72m
Personalised Travel Planning grants £0.05m
CCTV in Public Car Parks award £0.25m
TOTAL £42.34m

10
Delivery2.22 Effective delivery of the LTP programme
over the last five years has been at theheart of the progress made towardsachieving our key aims and objectives.Each year of the plan LTP resources havebeen fully utilised.
2.23 Nearly £75m has been spent on deliveringintegrated transport schemes over the LTPperiod. Figure 2.1 shows how we havespent LTP funding on meeting ourobjectives and Figure 2.2 shows how thishas been broken down by mode.
2.24 In terms of scheme numbers Figure 2.3shows just how many schemes have beendelivered on the ground.
Meeting Targets2.25 Delivering schemes has helped us deliver
on targets. Focussing on outcomes wehave delivered on:
Local Bus Patronage Increased
• Bus Patronage up by 12% on routestargeted with LTP investment(compared with decrease nationally).
• Park and ride patronage up 28% inBath (local target met) and 21% inBristol.
• Community Transport patronage up316% in South Gloucestershire (localtarget met), 70% in Bristol, 42% inBath and North East Somerset and43% in North Somerset.
• 6.4% growth in bus patronage inNorth Somerset in 2003/04 due inpart to the introduction of a ‘flat fare’of £1 on town centre services inpartnership with service 7 showcaseroute investment.
Local Rail Use Increased
• The number of passengers using thelocal rail network up 41%.
Other 11%
Alternative modes and
Accessibility 39%
Reducing Traffic 27%
Road Safety 23%
Figure 2.1 - LTP Funding by Objectives
Other10.7%
Local Roads2.2%
Bus Schemes16.8%
P&R /MMI 8.3%
Cycle Schemes5.4%
Walking Schemes8.5%Safety
20.7%
Crossings2.2%
Traffic Management25.3%
Figure 2.2 - LTP Expenditure - £75m by mode
Note: Spending on AirQuality and EconomicVitality Objectives isincluded under the otherobjectives.

11
Levels of Cycling Increased
• Cycling up 26% across the GreaterBristol area.
Levels of Walking Increased
• 14% increase in walking in Bristol as awhole and 24% increase in the CityCentre.
• Pedestrians in North Somersetincreased by 22%.
Traffic Levels Reduced
• Traffic in the Central Area of Bristol cutby 10% (local target met).
• 1,000 fewer vehicles a day using theA4174 Avon Ring Road.
• Number of children being driven toschool in North Somerset reduced by6%.
• Traffic levels in Bath down 11%,Midsomer Norton and Radstock down1%.
Road Safety Improved
• Lowest ever children killed andseriously injured figures in SouthGloucestershire.
• North Somerset target to reducechildren killed and seriously injured ontrack.
• Killed and seriously injured figuresreduced by 28% 2004 to 2005 in NorthSomerset.
Have the Key Aims andObjectives of the LTP BeenAchieved?
2.26 As discussed we have made substantialimprovements in the LTP period. Theobjectives of the LTP were closely linkedwith the policy aims of the Government’s1998 White Paper. Broadly each of us hasfollowed the same objectives. Table 2.2sets out our collective objectives with ashort statement on progress and how theobjective has been achieved. The focus ison good performance, targets met andsuccessful schemes delivered. Figure 2.4illustrates where some of the schemes areand summarises our achievements.
Joint Delivery Report
Maintenance (1360)
Miscellaneous (86)
Local Road (31)
Traffic Management (596)
Road Crossings (222)
Local Safety Schemes (500)
Travel Plans (352)
Walking Schemes (198)
Cycling Schemes (345)
P&R (7)
Public Transport Interchanges (31)
Bus Priority (40)
Bus Infrastructure (929)
Figure 2.3 - LTP Schemes Delivered

12
Figu
re 2
.4 -
Key
Ach
ieve
men
ts o
f the
LTP

13
Joint Delivery Report
Improved air quality is an outcome from reducing congestion,enhancing public transport and encouraging sustainable andbehavioural change. Success in all areas has meant:
• South Gloucestershire local target to reduce the number of ‘PoorAir Quality’ days when air pollution exceeds National Air QualityStandards has been met. Down from 81 days in 2000/01 to 13 in2005/06.
• Kingswood Town Centre scheme (go to Ch 5 Wider Impacts)continues to show a drop in Nitrogen Dioxide (NO2) levelscompared to before the scheme went in.
• North Somerset met its local air quality targets for Banwell withBenzene and NO2 both below the capping target levels of 16.25and 40 ug/m3 respectively.
• Bristol’s Air Quality Action Plan (AQAP) adopted. Progress madein retrofitting cleaner exhaust emissions technology to the olderpart of the bus fleet.
• Bristol through its Centre of Excellence status organised a BestPractice seminar on air quality. Now an annual event.
• Bath’s Air Quality Action Plan for the A4 London Road has beenadopted.
• Local targets for Benzene, NO2, PM10 and National Air QualityStandards all on track in Bath and North East Somerset.
• 116 new easy access, low emission buses introduced in Bath byFirst.
• Bath and Bristol participated in the DTI Foresight programme forClear Zones (Trailblazer in 2001).
• NO2 levels in Bristol down on 2000/01 baseline.
44 For more on air quality go to Table 5.3.
Travel Plans
We have targeted resources at working with employers on travelplans for existing and new developments. This helps to reduceoverall travel and impact upon single occupancy car use.Achievements include:
• Working with Weston General Hospital, North Somerset PrimaryCare Trust, Royal United and St Martins Hospitals in Bath, WessexWater, Bath University, Ministry of Defence, Orange, Rolls Royceand Weston College on their Travel Plans.
• Close working with Bristol International Airport (BIA) on theirsurface access strategy - of increasing importance in the light ofthe BIA’s intention to expand substantially following the 2003 AirTransport White Paper.
To improve the local air quality
To reduce the growth of roadtraffic and need to travel,develop and implement travelplans and reduce car journeysto school
Table 2.2: Key Aims and Objectives
LTP Objective Achievement/Progress

14
• Innovative schemes such as the car share multi occupancyparking bays in Bath and penalty based targets.
• Active Green Commuter Clubs and Travel Forums.
• Eye catching and successful campaigns such as ‘Jam BustingJune.’
• Avonwide Travel Award scheme - nine of the recent winnersachieved 7% or more reductions in single car occupancy.
School Travel Plans
School travel plans are starting to make a real impact.
• School trips by car in South Gloucestershire fallen from 39% in2000/01 to 33% in 2005/06. 90 schools now have School TravelPlans and 60 safer routes to school schemes implemented.41 schools have been successful in reaching the requiredstandard to be awarded the Government Capital Grant.
• 63% of pupils in Bath and North East Somerset are now coveredby School Travel Plans. This has reduced car travel by 2% andincreased the number of children walking to school by 6%.
• Travel to school by non car modes in Bath and North EastSomerset has risen from 52% in 2002 to 59% in 2005. 69% ofschools now have School Travel Plans.
• In North Somerset 41% of pupils now travel to school by carcompared to 47% in 2003. 75% of all schools now have SchoolTravel Plans.
• In Bristol, cycling to secondary schools increased towards the endof the LTP after an initial fall.
Car Sharing and HOV lanes
Car-sharing has been encouraged through the joint promotion of thecar sharing database www.2carshare.com, now with over 4,000members, and by implementing the High Occupancy Vehicle (HOV)lanes on the A4174 and A370 (go to Box 2B). For North Somerset thishas also helped the Council meet its local target of limiting cargrowth to less than 3% per annum.
Traffic Growth and Congestion
In the central area of Bristol traffic levels have been cut by animpressive 10% (local target met).
In South Gloucestershire it is encouraging that the growth of roadtraffic is continuing to reduce where:
• Over the LTP period traffic growth was 7% in line with thepublished trajectory.
• Annual mode share surveys showing fewer car journeys to workwhen compared to 2001/02.
• Cycling and walking to work has doubled over the LTP period.
Table 2.2: Key Aims and Objectives
LTP Objective Achievement/Progress

15
Joint Delivery Report
• Proportion of commuters car sharing has risen from 8.8% in2000/01 to 13.1% in 2005/06.
• % of visitors to town centres using non car modes has risen from32.8% to 37.4% over the same period.
In Bath and North East Somerset:
• 11% fall in traffic levels in central Bath.
• 1% falls in Midsomer Norton and Radstock.
• 2 to 3% falls across most key corridors.
• Phased introduction of Urban Traffic Management Controlimproved traffic flows in Bath providing new bus prioritymeasures and pedestrian crossings.
Parking
Decriminalisation of parking in Bath and Bristol has led to improvedenforcement and movement of traffic. Buses have benefited frombetter access to bus stops. Residents’ parking zones in Bath, on-street pay and display and increased park and ride provision havereduced the number of commuter journeys in the City.
Parking standards have been applied to new developmentsparticularly in the central areas helping to reduce car use forcommuting.
As a result of all these initiatives commuters are increasingly usingmore sustainable alternatives in their journey to work.
44 For more on travel plans go to Table 5.5.
Considerable resources have been invested through the LTP inaddressing road safety.
There is, however, concern over the data. There is evidence that basedata for 1994-98 significantly under-recorded injury accidents, andfor the period 2002-04 new police guidance on data recording meantthat a number of slight injuries were inconsistently reported asserious. Together these two factors have masked improvement inperformance.
Nonetheless results include:
• The number of children Killed and Seriously Injured (KSI) in SouthGloucestershire has fallen by 68% (from 19 in 2001 to 6 in 2005).This is the lowest level ever recorded in South Gloucestershireand means the 2010 target has been met six years ahead of time.
• North Somerset’s target to reduce child KSI accidents is on trackand there have been no child fatalities since July 2001. This isdue to the large amount of resources deployed across the LTP,and justifies the strong road safety focus of the LTPimplementation programmes.
To reduce road accidents for all road users (especiallychildren, cyclists, pedestriansand mobility impaired)
Table 2.2: Key Aims and Objectives
LTP Objective Achievement/Progress

16
• Bath and North East Somerset have exceeded the 2010 target toreduce child KSI.
• For Bristol progress has been made with child KSI figures. Theconsiderable work on road safety measures and safer routes toschool in particular achieving a 17% decrease in Bristol over thefive years.
• KSIs in North Somerset have been reduced from the 1994-98baseline of 98, down to just 80.
• In South Gloucestershire there has been a general trenddownwards in KSI, with some fluctuations. By 2005 accidentnumbers were at their lowest ever.
• For Bristol overall totals for KSI casualties have fluctuated overthe plan period, but in 2005 are still at the same level as that ofthe original.
• In Bath and North East Somerset the KSI numbers have continuedto fall but the 2010 target is not on track.
Examples of successful measures include:
• Avon and Somerset Safety Camera Partnership with a 10%reduction in road accidents at sites in the Bristol area.
• Road safety campaigns featured heavily from the nationallyrecognised Kingswood Road Safety Project to successfulmotorcycle campaigns to promoting the road safety message infront of 200,000 people at the Badminton Horse Trials.
• 9 urban and 9 rural 20mph zones, 1 Home Zone and one QuietLane scheme implemented in Bath and North East Somerset.
• Child Pedestrian Training for 2,500 pupils a year, Kerbcrafttraining, driver training, Over 50s Safer Driving with Age,Bikesafe, Ride to Arrive and Health and Well Being Dayscampaigns and promotions in Bath and North East Somerset.
• Improved personal security replacing pedestrian underpassessuch as Easton Way in Bristol with new surface-level crossings.
• The Night Bus service (Bristol and South Gloucestershire) withon-board marshals, and the enhanced taxi ranks in the centre ofBristol have improved security for evening travellers.
• Cyclist security improved with more secure parking spacesleading to a 30% fall in cycle thefts in Bristol.
44 For more on road safety go to Table 5.2.
Table 2.2: Key Aims and Objectives
LTP Objective Achievement/Progress

17
Joint Delivery Report
Bus
Over the last five years an extra 1.2 million passengers have beencarried on our bus services. Clearly this demonstrates the benefits ofour approach to public transport making the bus a more attractivealternative through delivering bus priority measures, new sheltersand boarders (raised pavements), concessionary travel, bus serviceenhancements and information. Specific measures include:
• Weston-super-Mare - Council/bus operator partnership with newbuses, bus priority and upgraded infrastructure on the X1 and 7routes. Reliability up from 38% to 74% and from 72% to 80%respectively.
• Bristol A38 showcase bus route increased patronage by 12%. Thiscompares with little change in overall patronage across the city.
• New Portway park and ride service.
• New supported bus routes such as the 500 service in Bristolintroduced to link bus and rail interchanges and car parks withkey commercial and tourist destinations.
• Bus passenger numbers up 13% on 2001/02 in Bath and NorthEast Somerset. Park and ride use in Bath up 28% since 1998/99.
• Odd Down park and ride to the Royal United Hospital, passengersup 50% in 2004/05 improving accessibility for a significantnumber of residents whilst helping to reduce congestion andimprove air quality in Bath. 100% user satisfaction in 2005.
• Chew Valley Explorer service introduced linking 14 rural parishesin Bath and North East Somerset and North Somerset withBristol. Daily frequency with new low floor, easy access vehicles.
• Showcase corridor on the Bristol to Wells route in partnershipwith Somerset County Council and First. 2.7% growth inpassengers in first year.
• Local target to reduce the age of buses in Bath to 8 years morethan met (now 5.7). 60% of vehicles are now low floor easyaccess buses.
• In 2004 we combined our individual concessionary travelschemes to allow bus pass holders to travel at half fare anywherewithin Greater Bristol. Now developed into the new jointDiamond Travelcard free fare bus pass.
Partnerships
We have a good record of partnership working with bus operatorsthroughout the LTP:
• Bus Quality Partnership in Bath with First achieved Northgatebus gate and 116 new low-emission easy-access buses, £500,000spent on new/upgraded bus stops and £160,000 on publicity.
To provide quality alternativemodes to the private carincluding public transport,information, cycling andwalking integration of services
Table 2.2: Key Aims and Objectives
LTP Objective Achievement/Progress

18
• Punctuality Improvement Partnerships being progressed by NorthSomerset, Bath and North East Somerset.
• South West Passenger Transport Information (SWPTI) Travelinetelephone information services set up with all the other SouthWest Councils and bus operators.
Promotions
Getting key messages across to the travelling public has helpedpeople to reduce their car use by providing better information andenhancing the attractiveness of alternatives. Initiatives include:
• Transport Promotions Officer appointed by South Gloucestershireto spearhead bus promotions.
• Innovative campaigns and a colourful and easy to use range oftravel guides have helped raise awareness, satisfaction with anduse of buses.
• Traveline service with JLTP target to improve accuracy.
• Bristol’s TravelSmart® programme in Bishopston achievedreduction in car trips of 11%, car distances travelled down 13%(net saving of 1.7 million car km p.a.) and increases in cycling,walking and bus use.
Cycling and Walking
Significant progress has been made on delivering cycle and walkingschemes and promoting their use. The widespread implementationof measures, the filling in of ‘missing gaps’ in the network,promotion of travel plans, innovative cycle training, active CycleForums and extensive, eye catching publicity and new maps are allplaying their part. Outcomes include:
• 26% growth in cycling across Greater Bristol.
• 14% increase in walking in Bristol.
This is one of the highest growth rates in cycling in the South West.This is against a background of vehicular traffic growth at twice thenational average and a legacy of development designed more aroundthe needs of the car than the cyclist and pedestrian.
For cycling and walking significant lengths of new, mainly traffic freeroutes, have been opened and pedestrianisation extended. Schemessuch as:
• 19 mile Colliers Way National Cycle Network (NCN) Route 24between Radstock and Frome.
• 2 mile section on the Chew Valley Lake Cycle Route (NCN 3)providing links to rural communities.
• Clevedon Pedestrian Strategy 2002 set out a range of walkingmeasures. Walking in the town increased by 24.3%.
Table 2.2: Key Aims and Objectives
LTP Objective Achievement/Progress

19
Joint Delivery Report
• Increased pedestrian facilities in Nailsea High Street has seen thepedestrian numbers rise by 31%.
• We are now working on a Joint Public Rights of WayImprovement Plan.
Interchanges
Integration of transport services was seen as a key issue indeveloping the LTP. Working with private sector partners, newinterchanges have been built, and existing areas enhanced.
• New Broadmead bus and coach station in Bristol, in conjunctionwith redevelopment, now provides far better, modern, clean,comfortable interchange facilities for the public accessing centralBristol.
• Major investment in the forecourt at Weston-super-Mare stationhas created a new travel interchange.
• Plans for new bus station adjacent to Bath Spa railway station.
• Rural Interchange Hubs provided in Almondsbury, Pucklechurch,Wick and Alveston.
• Bristol Parkway station interchange improvements and new busconnecting bus services.
• £300,000 capital investment used in partnership with local trainoperators to enhance the interchange facilities at stations acrossBristol.
• Investment, promotion and support for local rail has seenpatronage increase by 41%.
Summary
Providing better alternatives to the private car has given thetravelling public a wider choice, particularly during peak periodswhen congestion and delay to private car users is highest. This isbest seen in Bristol meeting its stretching local target to reduceprivate car traffic entering the city centre by 10% by 2005.
44 For more on cycling go to Table 5.4 and for public transport Table 5.1.
As described in the Wider Impact Chapter 3 significant progress hasbeen made on addressing the issues of social exclusion.
Community Transport
The community transport network has grown substantially over theLTP period. Outcomes include:
• 6,000 passengers a month in South Gloucestershire, a 316%increase on 2000/01.
• 70% rise in passengers in Bristol.
• 43% rise in passengers in North Somerset.
To promote access to everydayfacilities for all, address theneeds of disabled people andprovide a socially inclusivetransport network
Table 2.2: Key Aims and Objectives
LTP Objective Achievement/Progress

20
• 42% rise in passengers in Bath and North East Somerset.
• ‘Fare Car’ and Dial-a-Ride schemes now reach 75% of the ruralpopulation in Bath and North East Somerset. To be extended tocover all rural parishes.
• Taxi sharing schemes in Barton Hill, St Phillips and St Anne’s.
• Car Clubs introduced across 15 areas of Bristol and in Bath.Bristol Car Clubs now have 26 cars with 470 members.
Regeneration
Regeneration has taken place both in the city centres and localcommunities. The showcase bus scheme in Bristol was specificallyaimed at improving transport links between isolated and deprivedcommunities and job opportunities.
The Dings Home Zone in inner Bristol was a key catalyst forregeneration linking the isolated Dings Community with the newTemple Quay development and community.
Provision for Disabled People
Measures include:
• Number of bus stops equipped for low floor use increased by140% (from 175 to 422) meeting the local target.
• 60% of the bus fleet in Bath is now wheelchair accessible (localtarget on track).
• Number of disabled person’s parking bays has nearly doubled.
• Raised platforms and dropped kerbs programme to ensure allstops are Disability Discrimination Act (DDA) compliant by2015/16.
• 19% of bus stops in North Somerset are DDA compliant (localtarget on track) up from just 5% five years ago.
• Continued prioritisation of footway maintenance, and theenhancement of crossings have significantly improved thepedestrian environment for disabled people.
• 100% of controlled pedestrian crossings in North Somerset nowincorporate facilities for disabled people.
• 90% of pedestrian crossings in Bristol incorporate facilities fordisabled people up from 48% (local target met).
44 For more on accessibility and social inclusion go to Chapter 3.
The Civic Pride project in Weston-super-Mare has seen over £11mcommitted to a package of schemes to improve the town centrethrough upgraded junctions, urban design layouts, landscaping andcycling and pedestrian facilities. This includes a £0.77m contributionfrom the LTP, a £5m contribution from the South West RegionalDevelopment Agency (SWRDA) and £2m from the Council.
To maintain and enhance theeconomic vitality of existingcentres, promote and developa successful economy
Table 2.2: Key Aims and Objectives
LTP Objective Achievement/Progress

21
Joint Delivery Report
Nailsea has benefited from significant improvements to its highstreet including enhanced pedestrian facilities, as well as upgradingthe car park to improve access and combat anti-social behaviour.
The central area environment in Bristol has been transformed overthe Plan period. Redevelopment projects assisted with LTP transportinvestment include:
• New pedestrian areas and environmental enhancements.
• Centre Project with the enhancement of Queen Square, and
• Support for the ongoing Harbourside and Broadmead expansionschemes.
• Broadmead freight consolidation scheme serving 46 city centreretailers from the consolidation centre at Emersons Green.
• Publication of a Commercial Vehicle Drivers’ Atlas.
• A38 showcase bus route increasing access to employment fromthe deprived areas of South Bristol, with patronage up 12%.
• New park and ride site opened on the A4 Portway corridorproviding not only express services to improve commuter tripsinto central Bristol but also a new bus service for areas of the citypreviously poorly served.
• New Broadmead central bus and coach station opened inconjunction with redevelopment of the former site.
In Bath footway widening on Walcot Street enhanced the walkingroute to the Artisan quarter. Revised goods vehicle signing hashelped protect historic buildings as has the ‘Clear Zone’demonstration project.
Kingswood, Staple Hill and Downend town centres have all benefitedfrom schemes to enhance the local environment and strengthenretail performance.
44 For more on economic vitality go to Chapter 3.
Note: These objectives are an amalgamation of those for Bath and North East Somerset, Bristol City,North Somerset and South Gloucestershire Councils.
Changes to Key Aims andObjectives Since the First LTP
2.27 The key objectives of all four LocalTransport Plans have remained the samethroughout the Plan Period and this hasprovided a consistent policy backgroundand focus to the implementation ofmeasures in support of the Plans. Wehave had to be flexible as the changesoutlined below illustrate.
2.28 A key element of two of the Plans was theintroduction of Line 1 of the Bristol andSouth Gloucestershire Light Rapid Transit(LRT) tram network. Extensiveconsultation revealed a rapid transitsystem as the single most popular issuewith 90% of people stating that theywished to see its introduction in the city.Exhaustive testing of appropriatetechnologies, and their comparativebenefits carried out in the development of
Table 2.2: Key Aims and Objectives
LTP Objective Achievement/Progress

22
the LTP indicated that light rail technologycould provide a step change in publictransport provision in the area.
2.29 Bristol and South Gloucestershireallocated significant resources toprogressing these proposals during theLTP. In particular, the two Councils workedin partnership to progress theimplementation of Line 1, betweenAlmondsbury and Bristol City Centre.
2.30 In March 2001, the government acceptedthe economic case for Line 1 and gave aprovisional commitment to fund asubstantial proportion of theimplementation costs. This endorsementwas dependent on the resolution of anumber of outstanding issues, and inparticular agreement with the HighwaysAgency on the operation of the schemeand its impact in the vicinity of Junction16 of the M5 at Almondsbury.
2.31 Subsequent consultancy studies raisedsignificant doubts about the practicalityof terminating Line 1 at a park and ridesite at Almondsbury. Parallel work wasundertaken on the potential for a newnorthern terminus at either ParkwayStation or Cribbs Causeway. The results ofthis appraisal showed the Parkway optionto be economically viable.
2.32 Consequently, an Annex E schemeappraisal was submitted to DfT inDecember 2003 for the City Centre toParkway LRT Route. This was thendeveloped further, incorporating emerginggovernment guidance on LRT schemes.Work also commenced on an AlternativeRapid Transit Strategy to investigatealternative solutions for the 'North Fringe'area if Line 1 terminated at Parkway.
2.33 The Government's Local TransportSettlement letter in December 2003 gavea clear indication Line 1 was unlikely toreceive national funding. There was littleoption but to suspend the promotion ofthe Line 1 LRT proposal. Both Councilshave continued to safeguard, for potentialpublic transport routes, all the routesidentified in the LTP, Local Plans andStructure Plan.
2.34 In the short term, with support from theGovernment, we have progressed with abus based strategy to promote highquality public transport. It must be notedthat the results of GBSTS indicate that aform of Rapid Transit should be a key partof the strategy for transport in this area.These proposals have been taken forwardin the JLTP on the basis of Bus RapidTransit in the medium term. A future LRTnetwork, however, is still essential to meetthe longer term needs of the area andfacilitate the potential housing andemployment growth set out in theRegional Spatial Strategy.
2.35 One change that occurred in NorthSomerset was the delay to the plannedimplementation of Decriminalised ParkingEnforcement (DPE). This was originallyintended to be rolled out within the LTPperiod, but was postponed due to capacityissues and the need to refocus prioritieson successfully improving assessmentscores in 2004 and 2005. DPE is now likelyto be brought forward in late 2007. Onepositive aspect, however, is that it hasallowed a greater element of partnershipworking and sharing of knowledge andexperience with South Gloucestershirewho are also looking to implement DPE toa similar timescale (as set out in the JLTP).
2.36 In Bath the Lambridge park and ride sitehas been delayed due to planning issuesregarding the relocation of Bath RugbyClub from the site and proposed floodmitigation measures. Plans for theWestern Riverside and Southgate
Greater Bristol Strategic Transport Study

23
regeneration sites in Bath have also beendelayed. All the transport proposalsassociated with these developments andthe park and ride site are now in the BathPackage major scheme bid submitted inJuly 2006.
What has Worked Well andWhat can be ImprovedWorked WellAlternatives to the car
2.37 Our LTP strategy was based on lesseningdependence on the car by developing andpromoting alternatives. There has beenstrong progress on providing significantlybetter alternatives to the private car andby the number of people takingadvantage of them as part of their travelchoices.
2.38 The implementation of the cyclingstrategies has been very successful in bothproviding enhanced alternatives but alsoencouraging their use. Over the LTP,cycling levels across Greater Bristol haveincreased by 26%. This can be set againstthe national trend of decreasing levels ofcycling (National Travel Survey, DfT July2005). This trend is also very significant inthat Bristol already had higher thanaverage cycling levels before the Planperiod and was starting from an alreadyhigh base.
2.39 These increases, as set out in Table 5.4Cycling Plan Strategy, are mainly down to:
• Infrastructure - specific cyclingschemes have demonstrated greaterthan anticipated benefits, for examplethe Bristol to Bath Railway Path hasseen a 33% increase in cycling on thisalready very popular route.
• Bringing cycling to the centre of publicpolicy – transport schemes are auditedto ensure that their design contributesto improving the environment. 28%increase in cycling on the northernsection of the A38 showcase route.
Joint Delivery Report
Box 2A
A38 Showcase Bus Route
The implementation of Bristol’s first showcasebus route for services 75, 76 and 77, along theA38 corridor between Cribbs Causeway andHenbury in the North and Hartcliffe in theSouth, has delivered excellent resultsfollowing its launch in December 2003.
The project itself was a good example ofpartnership working with the main busoperator First, local residents along the route,local business groups, trader organisationsand the emergency services, closely co-ordinated between Bristol and SouthGloucestershire Councils. Through detailedpublic participation initial designs were variedand differing solutions explored.
In the Gloucester Road shopping area, forexample, fears over a possible loss of tradefrom losing parking spaces to bus prioritymeasures led to a new high quality short stayshoppers’ car park serving around 200motorists per day.
The scheme also including enhancements tothe walking and cycling environment, throughcomprehensive pedestrian improvements atkey junctions and cycle lanes and advancedstop lines for cyclists along the route.
Some key facts and figures:
• £3.5million spent on delivering redesignedjunctions, bus lanes, raised kerbs along thelength of the route and improved shelterswith Real Time Information.
• £2.5m dedicated fleet of low-floor, modernclean vehicles provided by First.
• 12% increase in bus patronage.
• 28% increase in cycling on the northernsection of the route.
• 1,200 vehicle journeys per week removedfrom this route.
Experience learnt from the project is nowbeing taken forward and developed as for thenext showcase route on the A420 / A431corridor, which is progressing well.

24
• Promotional work - Annualprogramme of 2,000 personalisedtravel plans shown increasing cyclinglevels along with decreased car use.Targeted areas have achieved up to40% increases in cycling. Major eventssuch as the Big Bike Ride attract muchpublicity.
• Cycling strategy success recognisednationally, with the Local AuthorityCycling Assessment from the EnglishRegional Cycling Development Team(ERCDT) giving Bristol a bell score of 4out of 5, North Somerset and SouthGloucestershire 3 out of 5 and Bathand North East Somerset 2 out of 5.
2.40 Bus priority measures and new servicesand facilities for passengers have also hadan impact as Box 2A shows.
2.41 The Urban Bus Challenge Odd Down parkand ride service 42 to the Royal UnitedHospital in Bath provides an essential linkto the local hospital for commuters,patients and visitors from the surroundingrural areas and the two most deprivedareas within the City.
2.42 Recognising areas where we were weak,for example on Bus Passenger Satisfactionand passengers, led to direct action inSouth Gloucestershire with theappointment of a Transport PromotionsOfficer. The innovative campaigns thathave followed and the steadily increasinglevels of bus use, up 5.6% in 2005/06, arewitness to the success of this approach.As is bus passenger satisfaction, measuredas a local target in 2004/05, up from 40%in 2003/04 to 47%.
2.43 The www.2carshare.com initiative goesfrom strength to strength, its successrecognised in the expansion covering thewhole of the Joint Local Transport Planarea in 2005 (go to Box 2B). Odd Down Park and Ride - service 42
Box 2B
Car Sharing
Since its launch in 2001, membership of ourcar sharing scheme www.2carshare.com hascontinued to grow. The scheme now coversthe whole of the Greater Bristol area and over20 major employers now sponsor the scheme.Membership in 2005/06 reached 4,000 withover 60% of users finding a car share match.
Extensive promotional activities include:
• Road signs advertising the website locatedon the 2+ lanes of the A4174 Avon RingRoad and at congestion hotspots.
• Green Travel Roadshows at employer sites.
• Radio advertising, petrol pumppromotions and sponsorship campaigns.
• 2+ parking provided for major employerssuch as Rolls Royce, WS Atkins andTelewest.
Bristol’s Biggest Bike Ride
Petrol pump promotions

25
Funding, Resources and Joint Working
2.44 Attracting additional funding has beenhighly successful. Developercontributions through S106 agreementshave generated £14.1m for transportmeasures across our area. For the CivicPride Initiative in Weston-super-Mare £5mwas secured from the South WestRegional Development Agency (SWRDA)and £0.6m from the Department ofEnvironment Food and Rural Affairs(DEFRA).
2.45 Successful bids for Urban and Rural BusChallenge funding and Public Service LevelAgreements (for example for buspatronage in South Gloucestershire) haveled to a wider range of schemes thanwould otherwise have been achieved.£3.3m of Supplementary Bid money forthe A4174 Avon Ring Road enabledsignificant progress to be made ontackling congestion on this highlyimportant part of the network.
2.46 Over the LTP we have committedconsiderable extra resources to improvingtransport across the area. This hasinvolved the creation of the SustainableTravel Team in North Somerset and aSustainable Transport Service in SouthGloucestershire.
2.47 For North Somerset this includes officerscovering public transport, concessionaryfares, school travel, cycling, workplacetravel plans, and walking. This was as adirect result of performance assessmentsearly in the LTP which showed the Councilneeded to do more to deliver its LTPobjectives. This recognised lack of capacityinstigated a restructure and recruitmentto bring extra officer capacity on board.Results are already being seen withgreater delivery, impact and increasingperformance assessments from the DfT.
2.48 In South Gloucestershire creating aSustainable Transport Service broughttogether Transport Policy, a newIntegrated Transport Unit, Public Rights ofWay and Highway Development Control
and has provided greater integration forthe delivery of Local Transport Planobjectives. The Integrated Transport Unit,made up of Public, Education and SocialServices transport, has greatly assisted theco-ordination of transport services, busaccessibility improvements and promotedcommunity transport.
2.49 In Bristol a new department of Planning,Transport and Sustainable Developmentwas created in 2005. This has provided aclearer focus on planning and deliveryincluding for the first time all thetransport functions in one department.
2.50 Joint working between us was greatlyassisted through our work on the SharedPriorities Development Plan submitted tothe Department for Transport in May2004. Based around the four sharedpriorities of congestion, accessibility, roadsafety and air quality the Plan laid thefoundation for the Joint Local TransportPlan. It demonstrated we could addresscommon transport issues across our areaand come up with workable solutions.
2.51 The Traffic Management Act 2004 placeda new duty on local authorities to managetheir networks to secure the expeditiousmovement of people and goods. TrafficManagers have now been appointed by allfour of us. A Greater Bristol TrafficManagers Liaison Group now meetsmonthly to co-ordinate our approach andassists the development andimplementation of congestion policies,road hierarchy review and NetworkManagement Strategy.
Can Be Improved2.52 Not everything has quite gone to plan.
Aspects Park and Share, a bold attempt toestablish the first car sharing multi modalinterchange site in Great Britain on theA4174 was less successful thananticipated. Despite extensive marketingthe expected demand did not materialiseand the site was discontinued in 2005.Nonetheless valuable lessons have beenlearnt about how future sites should belocated, developed and marketed.
Joint Delivery Report

26
2.53 Through the LTP and a specific grant fromthe DfT’s Home Zone ChallengeProgramme, and European Commissionfunding, several retro-fit Home Zoneshave been developed in various areas ofBristol. The projects have proved verypopular with the local residents and haveimproved the local environmentimmensely. Through consultation withresidents the original designs have beenaltered and in some cases grew from theoriginal costed proposals. Because of this,additional LTP and Bristol City Councilresources were needed diverting thisinvestment away from other areas of thePlan.
2.54 The Home Zones have proved verysuccessful in terms of their environmentalimpact. It is more difficult, however, tomeasure their impacts on the transportobjectives of the LTP and the sharedpriorities for transport that now underpinthe overall strategy. The high cost ofthese retrofit schemes means that thestrategy being taken forward in the JLTPfocuses on new-build Home Zonesimplemented with development.
2.55 The Home Zone schemes could be said tohave become a victim of their ownsuccess, as there are currently 15outstanding requests for retro-fit HomeZones. Unfortunately if these are to betaken forward this would have to be doneoutside of the LTP programme, as theircost effectiveness makes it difficult tojustify inclusion in the core programmecontaining many competing transportpriorities. Experiences gained from thesuccessful projects that wereimplemented can help to achieve betterdesign solutions for development relatedprojects and other road calming schemes.
2.56 Planned reduction in casualties has notbeen achieved. A review of road safetyconcluded that further reductions to helpreduce single vehicles accidents andchange road user behaviour requirecontinued and new revenue support forroad safety education, training andpublicity. Nonetheless we have as Tables2.1 and 5.2 show made considerableprogress in bringing down casualtynumbers. For the JLTP we have chosen a2001-2004 average as a baseline as thisaddresses previous concerns about underreporting. A linear trajectory has beenused to reflect the sustained investmentof the JLTP road safety programme.
2.57 Performance with our highwaymaintenance targets has fluctuated overthe LTP period with the move fromdeflectograph to Scanner surveys. Theemerging Transport Asset ManagementPlan, however, will see substantialprogress across all our maintenancetargets during the JLTP period.
What Foundations for the LongerTerm Have Been Put in Place?
2.58 The LTP has helped change attitudes.Internally this is recognising thattransport is not an isolated issue.Externally the general public arebecoming more aware of the impact oftheir transport choices, the need toconsider alternatives and the widerbenefits of non-motorised travel.
The Dings Home Zones, before and afterimplementation

27
2.59 As already mentioned the creation of newteams and structures at our Councils haslead to a greater focus on co-ordinationand delivery. This experience andexpertise will be invaluable in taking theJoint Local Transport (JLTP) forward. InBath the creation of a new City Strategywill enable the better planning ahead ofprojects and delivery of the Bath Package.
2.60 Two of the four Councils achieved Centreof Excellence status during the LTP period.Bristol for the quality of its Plan and SouthGloucestershire on delivery. We aredelivering schemes on the ground, hittingtargets and providing genuine alternativesto getting around.
2.61 On a delivery level, the LTP and SharedPriorities Development Plan work has putin place the foundations to build upon aswe move into the JLTP era. Thefoundations to move forward withimproving and completing our cycling andpedestrian networks, the foundations toaddress road safety at targeted areas andthe foundations on which to build oureducation, training and publicityprogrammes aiming to change ideas,attitudes and, ultimately, behaviour.
2.62 Throughout the LTP we have deliveredcost effective and value for moneyschemes. Our schemes are frequentlybased on best practice from both withinand outside the Greater Bristol JLTP area.Many of the examples quoted in thisDelivery Report illustrate how we havemade best use of resources andprocurement and achieved high benefits.The lessons learnt have been influential inshaping the JLTP programme.
2.63 The JLTP’s Network Management Strategyfor example focuses on value for moneyand making the best use of the existinghighway network. Equally the emergingTransport Asset Management Plan wouldnot have been possible withoutexperience gained over the last five years.
2.64 By close management of the capitalprogramme in the first five years of theLTP, the allocations provided to each of us
were fully spent. We intend to build onthis experience to ensure that theprogramme of works set out in the JLTP isdelivered on time and within budget.
2.65 We already have a wide range of expertisein delivering challenging projects andprogrammes. These have included EU-funded demonstration projects such asthe PROGRESS road pricing study. We willcontinue to engage in best practicenetworks both within the UK and Europe.Through the Transport Innovation Fund,Road Pricing Local Liaison Group andassociated development work we will seekto bring in further expertise atappropriate stages.
2.66 As we move into the JLTP we are buildingon our successes with the submission ofthe Greater Bristol Bus Network and BathPackage major scheme bids. If approvedthe Greater Bristol Bus Network willdeliver a huge investment in bus servicesin the area including a commitment fromthe main operator, First, for a £20 millioninvestment in new buses.
2.67 We look forward to removing cross-boundary barriers to movement,continuing to challenge ourselves withambitious targets, and delivering areliable, safe and efficient transportnetwork for the years to come.
Joint Delivery Report
New bus fleet

29
3. Contribution to Wider Objectives
Housing and EconomicDevelopment
3.1 The regional policy framework for the firstLTP was the Regional Planning Guidance(RPG10) approved by the Government in2001. In policy SS1 RPG10 foresaw theGreater Bristol area continuing to be themain focus for growth in the region andthe need to maintain and enhance itsstrong economic role. In the last five yearswe have helped take forward the spatialstrategy through the Joint Structure Plan.Transport issues have strongly influencedthe Joint Structure Plan and our LocalPlans in setting the framework for majorhousing and economic development. LTPinvestment has gone hand in hand withfunding from developers and othersources in delivering sustainabledevelopment on the ground, for example:
• North Fringe transport package todirect £18.4m of developer fundingtowards highway and public transportinfrastructure enhancements.
• Securing of £4m of developer fundingfor transport schemes to supportmajor developments at LockingCastle/West Wick in Weston-super-Mare and at Portishead.
• Ground breaking ‘New Build HomeZone Design Guidelines’ to guide newresidential developments in Bristol.
• Increasing the role of bus services aspart of travel plans linked to theUniversity of Bath and Wessex Wateroffice headquarters development.
3.2 Our contribution towards the policies setout in the Regional Transport Strategy hasincluded:
• Range of ‘soft’ measures andmarketing aimed at reducing the needto travel (policy TRAN 1) – go to Tables2.2, 5.3 and 5.5.
• Integrated packages of schemes andmeasures in the principal urban areas
of Bath, Bristol and Weston-super-Mare including Urban TrafficManagement and Control, busshowcases, park and ride, improvedwalking and cycling networks andenhanced passenger interchanges andinformation (TRAN 3, 4 and 10) – go toTables 2.2, 5.1, 5.3, 5.4 and 5.5; also goto ‘City and Town Centre Vitality andViability’ in Chapter 3.
• Parking management and re-allocation of roadspace; road usercharging studies (TRAN 5) – go toTables 2.2, 5.1 and 5.3; also go to 2.65.
• Freight Quality Partnership, lorry routemanagement and pilot freightdistribution centre (TRAN 6) – go toTable 5.3.
• Support for rural buses andcommunity transport, countryside andvillage traffic management (TRAN 7) –go to Tables 2.2, 5.1 and 5.3; also go to‘Social Inclusion’ in Chapter 3.
• Working with Bristol InternationalAirport and Port of Bristol on accessimprovements (TRAN 8, 9) – go toTable 5.3.
3.3 Growth over the LTP period together withour role as the road, rail and air gatewayto the South West has generated hugepressures. The LTP has played a major partin accommodating these pressures butour transport infrastructure is beingpushed to the limit. Furthermore theRegional Spatial Strategy is suggesting ahundred thousand new homes and asmany jobs, may need to be provided to
Joint Delivery Report
Freight Consolidation Centre

30
achieve sustainable economic growth.Transport is vital for our area’s continuedeconomic and social success.
3.4 We fully recognise, therefore, theresponsibility we have in our area fordelivering the regional agenda. Work onthe Joint Local Transport Plan 2006-2011has gone hand-in-hand with thepreparation of the new Regional SpatialStrategy, informed by the Greater BristolStrategic Transport Study.
Community Strategies,Corporate Plans and Partnership Working
3.5 The community strategies and corporateplans of our four local authority areashave common priorities (go to Box 3A)and these have heavily influenced ourtransport investment decisions. Our workwith the Local Strategic Partnerships andothers is continuing into our JLTP.
Chosen Themes3.6 The DfT asks us to comment on two
examples of wider policy aims or deliverythemes. We have chosen the followingwhich embrace most of the wider policypriorities in Box 3A:
• Encouraging and supporting city andtown centre vitality and viability.
• Tackling social exclusion.
City and Town Centre Vitalityand ViabilityBackground
3.7 Greater Bristol has two city centres inBath and Bristol that are focal points foremployment, retailing, recreation andother services and facilities and servewide catchment areas. Weston-super-Mare has a dual role as a service centreand holiday resort. There is also a range oftown centres and district centres thatprovide more localised services.
3.8 We have used investment in transport asa way of underpinning other initiatives.We recognise that improvements to
transport infrastructure give the privatesector the confidence to invest inregeneration and this can help lever infunding from a variety of other sources.Transport plays a key role in improvingaccessibility and meeting an increasinglywide range of needs throughout the dayand night. The key objective is to see thevitality and viability of these centres beingmaintained and enhanced and deliver onthe ground the qualitative improvementsrecommended by the Government inPPG6 Town Centres and RetailDevelopments.
3.9 This work is continuing in our JLTP in linewith the advice of the new PPS6 Planningfor Town Centres and the many otherGovernment initiatives revolving around‘liveability’ and the provision of highquality and safe public spaces.
Changing the Face of Bristol
Economic Development & Regeneration
3.10 In the 1990s many businesses relocated toout-of-centre locations accessible mainlyby car. During the LTP period we havetransformed the environment of central
Box 3A Corporate and Community Strategy PrioritiesWell-being/Communities - address challengesfaced by new and growing communities;needs of older people; local housing.
Health - improve the health of people andreduce inequalities in health.
Environment - take responsibility for ourenvironment and natural resources.
Safer communities - reduce crime and the fearof crime, reduce violence, and improve roadsafety.
Education - improve life chances and ensureall children and young people are givenencouragement and opportunities to learn.
Increasing prosperity/regeneration - increaselocal job opportunities and share the benefitsof prosperity across the whole of the JLTP area.
Continuous improvement - achieve more withthe same resources.

31
Bristol and attracted large scaleinvestment in office, residential andleisure developments. Transportinvestment has focussed on supportingdevelopment and regeneration, providingnew pedestrian areas and public spaces;better provision for cyclists; refurbishmentof car parks; and better arrangements fordeliveries.
3.11 Schemes have included
• Remodelling of The Centre.
• Award winning restoration of thehistoric Queen Square.
• Support for the ongoing Harboursideand Broadmead expansion schemes.
• Broadmead Freight Consolidationscheme (see Table 5.3).
• Freight Quality Partnership of the‘Commercial Vehicle Drivers’ Atlas (seeTable 5.3).
• Trenchard Street multi-storey car parkrefurbishment.
Improved access to the city centre
3.12 By encouraging bus and rail travel wehave reduced the need to drive into thecity centre. We achieved Local Target 23(Bristol) of reducing total car traffic in thecentral area by 10% by 2005. There hasalso been a 7% increase in bus trips to thecentral area (Local target 24). We highlightour public transport schemes in Table 5.1.These include:
• A38 bus showcase route providingaccess to the city centre from both thenorth and south of Bristol.
• New park and ride site on the A4Portway corridor.
• Existing park and ride facilitiesenhanced with real-time information,improved security including CCTV, andimproved service information.
• New Marlborough Street bus andcoach station serving Broadmead.
• New supported bus routes such as thecity centre loop service 500 linking busand rail interchanges and car parkswith the key commercial and touristdestinations in central Bristol.
3.13 The development of Temple Quay, a majornew office quarter near Temple Meadsrailway station, has helped to boost railpatronage and been a catalyst forincreased bus services. We have workedclosely with developers in securingsignificantly improved linkages forpedestrians and cyclists between TempleMeads and the rest of the city centre.
Joint Delivery Report
Queen Square restoration
New Bus and Coach Station
Temple Quay

32
3.14 Walking trips to the central area haveincreased by 24% and cycling by over 60%.Cycling has been enhanced throughimproved facilities, particularly along theA38 showcase route, which has seen awhole-route improvement for cyclists.
3.15 There has been investment in ferryservices in Bristol Harbour. New landingstages have been provided including oneto serve Temple Meads station and TempleQuay. The EC VIVALDI project funds theoperation of a cross-harbour ferry linkbetween areas such as Southville and thecity centre. The service operates duringpeak hours on weekdays and all day onweekends carrying up to 3,900 passengersper month.
24-Hour Economy
3.16 Activity occurs increasingly around theclock and the transport network hasadapted to meet the needs of the nighttime economy. We have invested over£1 million of revenue funding to supportthe introduction of night bus services on10 routes. These services have helpedsupport activity away from traditionallybusy periods and increasing the overallvitality of the central area.
Enhanced Visitor Information
3.17 The award winning Legible City projecthas sought to improve people’sunderstanding and experience of Bristolby integrating the provision ofinformation. The pedestrian signingsystem helps visitors find their wayaround the city centre and encouragesthem to explore on foot or by publictransport. Bristol now has direction signs,on-street information panels, printedwalking maps, on-street informationkiosks and arts projects that are boundtogether by a consistent visual languageand mapping system. These have provideda sense of welcome for visitors and abetter understanding of Bristol’sattractions.
Conserving Bath as a World Heritage Site
3.18 Bath’s status as a World Heritage Site andmajor tourist destination, over 4 millionvisitors a year of which almost 80% areday visitors (Economic Impact Survey 2003South West Tourism), combined with itsrole as a sub-regional service centre, putsgreat strains on the historic streets of thecity centre. The aim has been to tacklecongestion and make the city centre morepedestrian friendly. We see environmentalenhancement going hand in hand withmaintaining access to the city centre andbringing benefits to the local economy bymaximising footfall and improving the‘visitor experience’.
3.19 Traffic in the city centre was reducedsignificantly when we introduced theNorthgate Street ‘Priority Access Point’
Legible City Signage
Roman Baths

33
(PAP) for a trial period in 2001. It seversthe north-south route through the citycentre for general traffic but maintainsaccess for buses, taxis and other essentialvehicles. During the trial period, traffic inthe northern part of the city centrereduced by between 18 and 70% and busjourney times became more reliable. ThePAP, which was made permanent in 2002,was a controversial measuredemonstrating our determination to takeradical action to meet our transportobjectives.
3.20 Introduction of the PAP was boosted bymajor investment in new buses by Firstgiving Bath a modern fleet of low floorvehicles. We have also made the park andride services more attractive by extendingthe operating times from 0800-1930 to0600- 2030.
3.21 With traffic in the important MilsomStreet shopping area reduced as a resultof the PAP we carried out public realmenhancements. In Walcot Street we havewidened footways and made otherenhancements to provide an enhancedwalking route from the city centre to the‘Artisans’ Quarter’.
3.22 Parking spaces in and around the historiccity centre are valuable and we havemanaged this asset to favour shoppers,business visitors and tourists- all peopleessential for the local economy. We haveenhanced on-street parking by physicalmeasures and by bringing in ‘pay anddisplay’ to replace the unpopular scratchcard system. Residents are also essentialfor the city centre’s vitality and viabilityand we have looked after their intereststhrough our programme of residents’
parking zones. This scheme covers over3,000 households and was completedwithin 18 months involving completeconsultation with, and involvement of thelocal community.
3.23 We have improved Council-owned carparks, for example safety andenvironmental enhancements atCharlotte Street. These were under theumbrella of the PSA initiative ‘car parkingfear of crime’ and won the 2004 LocalGovernment News Street Design Award.
3.24 To make best use of Bath’s historic streetsystem we have implemented furtherphases of our Urban Traffic Managementand Control system. This has helpedimprove traffic flow on main routes, suchas the A36, provided bus priority,pedestrian crossings, and effectivemonitoring and fault reporting. Thesystem now has 28 nodes and 21pedestrian crossings. Remodelling of theSydney Gardens junction and installationof new traffic signals on the A36,completed in 2004/05, have improvedtraffic circulation in the city centre andreduced congestion in Queens Square,George Street, Gay Street and LansdownRoad.
3.25 Our transport schemes and measureshave resulted in:
• 11% decrease in traffic entering Bath’sinner cordon (exceeding 10% localtarget T1).
• 13% growth in bus patronage in Bathand North East Somerset .
• 17% growth in park and ridepassengers, now almost 816,000 peryear.
Joint Delivery Report
Priority Access Point, Bath
Bath City Centre

34
Regenerating the Resort of Weston-super-Mare
3.26 Weston-super-Mare has a dual role as aservice centre with a catchment of about80,000 people and as a seaside resort. In2005 the town attracted almost 6 millionvisitors and tourists, up from 4 million in2000. This growth has contributedtowards an increase in retail expenditureby visitors from £21.9m in 2001 to£48.7m in 2004. In partnership with theSouth West Regional DevelopmentAgency (SWRDA) and others, we haveconcentrated substantial resources onrevitalising the centre. Through the CivicPride programme we have seen over£11m of investment, including £5m fromthe SWRDA, as well as £2m from localauthority capital funds. A key aim is tolever in private investment.
3.27 Civic Pride comprises packages of works toenhance and redevelop specific areas. Ourtransport investment has focused on:
• Improved signage and information;
• Traffic management to improve safetyand provide better linkages throughpedestrian focused streetenhancements;
• Better pedestrian access to existingpublic spaces and the creation of newones capable of hosting performancesand public events, increasingeconomic vibrancy and activity levels;
• Upgraded lighting to pedestrian areasto establish safer, more attractive anduseable routes after dark, maximisingopportunities for ‘designing outcrime’;
• New street furniture to helpemphasise arrival at key public spacesand to encourage use by pedestrians,build upon plans for providing‘gateways’ into Weston-super-Mare forthose travelling by car, train, bus orcoach;
• High quality streetscape through theuse of a selected and limited palate ofmaterials to ensure consistency ofspecification and quality thresholds;
• Introduction of public art to addinterest and help orientation.
3.28 The measurable outcomes of Civic Prideare becoming clear. Pedestrianmovements in the town centre haveincreased by 11% over the LTP period. Inthe three years of the project so far thevisitor numbers to the town are up 20%(from 4.92m to 5.89m) and total visitorspend is up by 8% (from £217m to£268m).
Strengthening Other Town Centres3.29 We have also invested in measures to
increase the attractiveness of our smallertown centres and facilitate economicregeneration in partnership with Parishand Town Councils, local businesses andother stakeholders.
3.30 In North Somerset the ClevedonPedestrian Strategy, designed inpartnership with the Town Council, setout a programme of highwayimprovements that have aided pedestrianmovements within the town centre. Theschemes have contributed to a 32%growth in pedestrian activity in Clevedonbetween 2002 and 2005.
Weston-super-Mare Town Centre
Big Lamp Corner

35
3.31 In Keynsham town centre environmentalimprovements have secured easier accessand greater allocation of road space forpedestrian movement. Mini-roundaboutshave reduced congestion at key junctionsand directed traffic away from the HighStreet. Supporting initiatives haveincluded safer routes to school projects,enhanced passenger facilities at the busstops and railway station, andimprovements to the cycle network andcar parks. Similar proposals have comeforward in the centres of MidsomerNorton and Radstock.
3.32 By far the biggest initiative in SouthGloucestershire was the Kingswood TownCentre scheme. Over £1.33m was spenton revitalising this important traditionalretail centre in one of the most deprivedparts of the district providing:
• Enhanced diversionary route and oneway traffic flow through the coreshopping area to relieve congestion inthe High Street;
• Pavement widening to benefitpedestrian safety and circulation;
• 20mph zone throughout the towncentre to improve road safety;
• New taxi bays, new bus lay-bys andshelters, new cycle stands;
• Contra flow bus and cycle lanes tomaintain access for non car modes tothe town centre;
• New street lighting and introductionof CCTV cameras.
3.33 We have also significantly improvedNailsea town centre by narrowing theHigh Street to enhance pedestrianfacilities, installing new street lightingand improving pedestrian crossing pointsand signing. These have contributed to anincrease of 31% in pedestrian activity. Tocombat late night anti-social behaviour,works were carried out to the ClevedonRoad car park involving extra lighting,raised kerbing and speed humps, aredesigned entrance and improvedpedestrian access.
Supporting Our District Centres3.34 Neighbourhood Renewal Funding was
awarded to Bristol in 2001 for a five yearperiod to tackle problems indisadvantaged neighbourhoods. At Eastonan action plan was developed through thecommunity partnership focussed heavilyon transport and community safety.Through Neighbourhood Renewalfunding, LTP funds and our own resources,new pedestrian and cycle facilities wereimplemented. This included replacementof the pedestrian underpass on EastonWay with at grade crossing facilities,tackling an identified community safetyand severance problem.
3.35 The Staple Hill Regeneration Partnershipinitiative was aimed at improving thephysical fabric and environment of a rundown commercial centre in SouthGloucestershire. As part of a majormaintenance scheme for the town centre£0.4m was spent on a number ofcomplementary measures including newpedestrian crossings, widened footways,disabled parking bays, advanced stop linesfor cyclists and bus boarders. The elderly,young and mobility impaired haveparticularly benefited from the scheme.
3.36 The Staple Hill experience has beenfurther extended for similar enhancementschemes in Downend and Filton. At Filtonthe scheme included landscaping for thelocal car park and upgraded streetlighting.
Joint Delivery Report
Kingswood High Street
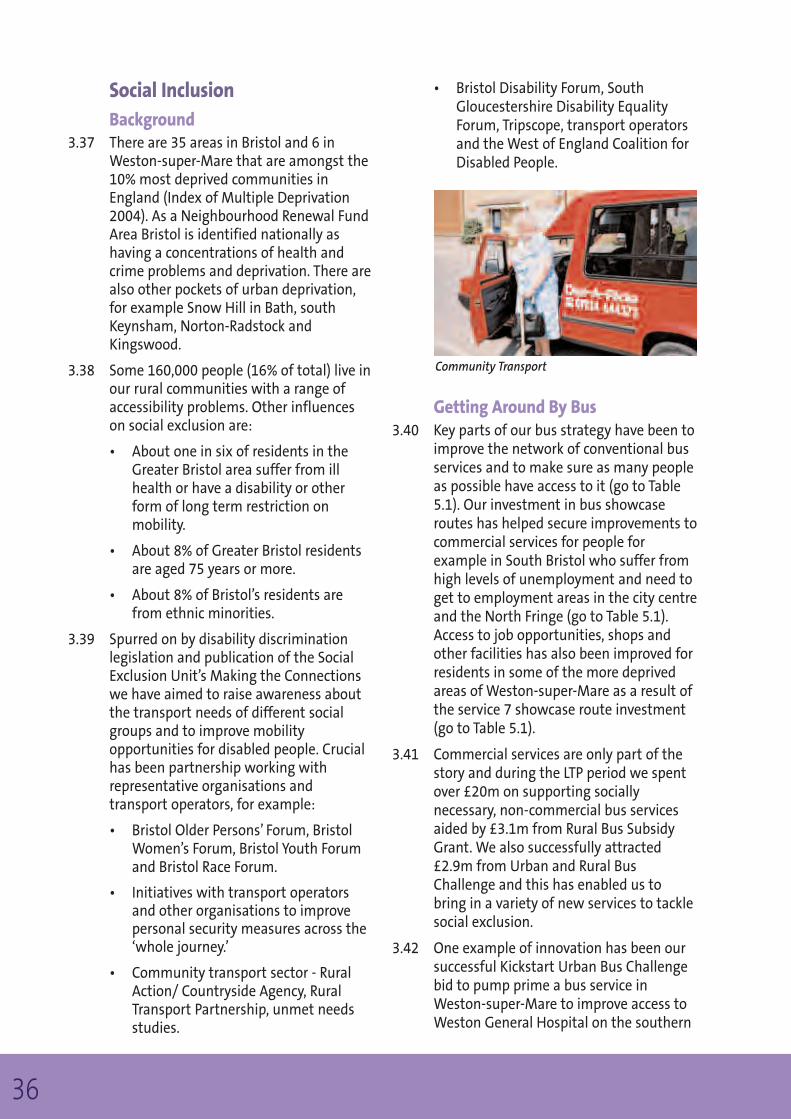
36
Social InclusionBackground
3.37 There are 35 areas in Bristol and 6 inWeston-super-Mare that are amongst the10% most deprived communities inEngland (Index of Multiple Deprivation2004). As a Neighbourhood Renewal FundArea Bristol is identified nationally ashaving a concentrations of health andcrime problems and deprivation. There arealso other pockets of urban deprivation,for example Snow Hill in Bath, southKeynsham, Norton-Radstock andKingswood.
3.38 Some 160,000 people (16% of total) live inour rural communities with a range ofaccessibility problems. Other influenceson social exclusion are:
• About one in six of residents in theGreater Bristol area suffer from illhealth or have a disability or otherform of long term restriction onmobility.
• About 8% of Greater Bristol residentsare aged 75 years or more.
• About 8% of Bristol’s residents arefrom ethnic minorities.
3.39 Spurred on by disability discriminationlegislation and publication of the SocialExclusion Unit’s Making the Connectionswe have aimed to raise awareness aboutthe transport needs of different socialgroups and to improve mobilityopportunities for disabled people. Crucialhas been partnership working withrepresentative organisations andtransport operators, for example:
• Bristol Older Persons’ Forum, BristolWomen’s Forum, Bristol Youth Forumand Bristol Race Forum.
• Initiatives with transport operatorsand other organisations to improvepersonal security measures across the‘whole journey.’
• Community transport sector - RuralAction/ Countryside Agency, RuralTransport Partnership, unmet needsstudies.
• Bristol Disability Forum, SouthGloucestershire Disability EqualityForum, Tripscope, transport operatorsand the West of England Coalition forDisabled People.
Getting Around By Bus3.40 Key parts of our bus strategy have been to
improve the network of conventional busservices and to make sure as many peopleas possible have access to it (go to Table5.1). Our investment in bus showcaseroutes has helped secure improvements tocommercial services for people forexample in South Bristol who suffer fromhigh levels of unemployment and need toget to employment areas in the city centreand the North Fringe (go to Table 5.1).Access to job opportunities, shops andother facilities has also been improved forresidents in some of the more deprivedareas of Weston-super-Mare as a result ofthe service 7 showcase route investment(go to Table 5.1).
3.41 Commercial services are only part of thestory and during the LTP period we spentover £20m on supporting sociallynecessary, non-commercial bus servicesaided by £3.1m from Rural Bus SubsidyGrant. We also successfully attracted£2.9m from Urban and Rural BusChallenge and this has enabled us tobring in a variety of new services to tacklesocial exclusion.
3.42 One example of innovation has been oursuccessful Kickstart Urban Bus Challengebid to pump prime a bus service inWeston-super-Mare to improve access toWeston General Hospital on the southern
Community Transport

37
outskirts of the town (go to Table 5.1).This resulted in new, higher frequency lowfloor bus services with less need tochange buses to get to the hospital.Another hospital to benefit from a newbus service has been the Royal United inBath. Service 42, backed by Urban BusChallenge funding, links the hospital toareas of deprivation in the south of Bath(go to Table 5.1). For part of the route inBath it operates as a demand-responsiveservice. Passenger numbers have risensteadily since its introduction in June2003 and it now carries over 5,000passengers a month.
3.43 The Chew Valley Explorer is an example ofa rural bus service where Rural BusChallenge funding of over £640,000 hasgiven us the opportunity to add to ourown revenue support and enhance aservice that serves 14 rural parishes (go toTable 5.1). Apart from enhancingaccessibility for rural communities southof Bristol the Explorer provides a linkbetween Bristol, including disadvantagedareas in south Bristol, to the surroundingcountryside. The service has carried290,772 passengers since 2001.
3.44 Even greater focus has been put on busaccessibility in our JLTP. Mapping withAccession software and close work withour partners has highlighted problemareas and we have a programme ofAccessibility Action Plans to follow up inthe next five years.
Making Buses More Accessible3.45 Partnership working with First has seen
major investment in new, low floor busesand our work on showcase bus routes has
included provision of raised and droppedkerbs at bus stops to make it easier for theless mobile to get to the stop and enterand leave the bus. Similar improvementshave been delivered on different routesacross the Greater Bristol area and goodprogress has been towards making ourstops fully accessible:
• Bath and North East Somerset: 131stops with raised kerbs, 11% of totalcompared to 5% in 2002/03 (localtarget T21).
• Bristol: 247 stops with raised kerbs.Now 22% of all stops.
• North Somerset: 212 stops with raisedkerbs, 19% of total compared to 5% in2000/01.
• South Gloucestershire: 125 stops withraised kerbs.
3.46 In the rural areas north and east of Bristolwe made successful bids for Rural BusChallenge funding to carry out aprogramme of Rural Interchange Hubs atAlmondsbury, Wick, Pucklechurch andAlveston. These Hubs included new highquality bus shelters, raised kerbs,improved pedestrian crossings andfootways, cycle storage facilities and largelay-bys for buses, community transportand taxis. Rural Bus Subsidy Grantfunding helps provide 18 new andimproved services linking in with some ofthese interchanges. 75,000 extrapassengers journeys a year are now madeas a result of these measures to tacklesocial inclusion.
Joint Delivery Report
Chew Valley Explorer Service
Raised Kerb

38
Better Information3.47 Through our Bus Quality Partnerships and
Bus Information Strategies we havesought to promote the whole network ofcommercial and supported buses. This hasbeen through door-to-door publicity,roadside displays at stops, leaflets andmaps and our involvement with traveline.One example is the 100,000 maps in ahandy fold out credit card size coverdistributed in South Gloucestershire tocover locations such as Frenchay andSouthmead Hospitals. In Bath and NorthEast Somerset all households havereceived a public transport map and newstyle bus stop displays have beenproduced, tailored for individual stops andwith improved legibility.
Expanding the Role of Community transport
3.48 Many people cannot get to key facilitiesand services because they have difficultyusing conventional public transport orthere are no buses where they live.Disabled people, elderly people, people
with learning disabilities and many othergroups can have particular difficulty. Inresponse we have made a big effort toexpand community transport to enhanceaccessibility for both urban and ruralresidents.
3.49 In the Greater Bristol area we had by2004/05:
• 11 Dial-a-ride schemes carrying123,000 passengers.
• 19 minibus schemes carrying 205,000passengers.
• 2 taxi buses started.
• 19 community/ social car schemescarrying 14,000 passengers.
3.50 Bristol Community Transport and BristolDial-a-Ride have expanded theiroperations significantly in the last fiveyears. Dial-a-ride has expanded to coverthe whole of the city and 12 new vehicleshave been provided as part of partnershipagreements to assist with fleetmaintenance and vehicle replacement.Patronage in the city has gone up by over70% in the last five years.
3.51 New community transport services havecommenced in Lawrence Weston, KnowleWest, Ashley/Easton and south Bristol inconjunction with the Hartcliffe andWithywood Community Partnership. TheDial-a-Ride Health Matters servicecommenced in 2004, delivering patientsto health centres in the deprived areas ofSouthmead and Lawrence Hill. Theassociated Life Opportunities projectstarted in 2005, taking disabled studentsto training centres in the same areas.
Improved Bus Timetables
Travel Information Centre
Fare Car

39
3.52 In the urban areas, towns and ruralcommunities north and east of Bristol wehave worked closely with the communitytransport sector in developing new andexisting schemes and ways to generaterevenue. With substantial help from RuralBus Challenge funding we have supportedthe merger of 4 Towns Transport with ValeLink Community Transport creating asingle organisation delivering accessibletransport throughout the Severn Valearea. The merger reduced the number ofduplicated journeys and created a singlecentre for co-ordinating trips. A newtrading arm, Severnside Transport Limited,will deliver commercial services with allthe profits used to support communitytransport. There are now more than 6,000passenger journeys a month in theseareas- 6,000 journeys that might nototherwise have been made.
3.53 Rural Bus Challenge Kickstart funding wascrucial in expanding Dial-a-Ride servicesin the towns and villages to the south andwest of Bristol. Through a partnershipwith Nailsea & District CommunityTransport, this funding, supplemented byRural Transport Partnership and ParishTransport Grant funding, has been used topay for extra vehicles and drivers. This hasallowed coverage of the service to beextended to the towns of Clevedon andPortishead as well as many villages.Passenger numbers have gone up by137,000 between 2000/01 and 2005/06,an 11% increase.
3.54 New demand responsive services havealso been introduced in Weston-super-Mare, Keynsham and Norton-Radstock.Weston-super-Mare’s town scheme beganin 2001 with support from SRB andLottery funding and was extended tonearby rural areas in 2004 with RuralTransport Partnership funding. Keynsham& District Dial-a-Ride, launched in 2003with support from Bath and North EastSomerset Council and the Town Council,carried 7035 passengers in 2005/06. TheNorton-Radstock area scheme waslaunched in 2004 with local authority,
Town Council and Countryside Agencyfunding and attracted 7,134 passengers in2005/06.
3.55 During the life of the LTP we havecontributed over £5m towards therunning costs of community transport inthe Greater Bristol area. Successful Ruraland Urban Bus Challenge and EC fundingbids has provided substantial capitalinvestment. There has been a substantialgrowth in patronage since 2001:
• 6,000 passengers a month in SouthGloucestershire, a 316% increase on2000/01.
• 70% rise in passengers in Bristol.
• 43% rise in passengers in NorthSomerset up from 28,424 in 1999 to40,773 in 2005/06 substantiallyexceeding the local target of 39,794.
• 42% rise in passengers in Bath andNorth East Somerset, 58,931 in2004/05, compared to a 2001/02baseline of 41,392 (Local target T25).
Other Ways We Have Aided Social Inclusion
Concessionary Travel
3.56 In 2004 we combined our individualconcessionary travel schemes to allow buspass holders to travel at half fareanywhere within the Greater Bristol area.This has since been progressed to the newjoint Diamond Travelcard schemeintroduced in 2006 providing free bustravel from 9am on any weekday journey.
Joint Delivery Report
Midsomer Norton Dial a Rire

40
Taxi Sharing
3.57 A new taxi-sharing service has beenintroduced for residents of Barton Hill, StPhillips and St Annes, areas of Bristol withrelatively low levels of car ownership andnot well served by conventional publictransport. This scheme is run on behalf ofthe Council by a local operator whohandles bookings and matches residents’trip requests to enable people to sharetheir journeys. This keeps travel costs toonly 50p per person. Launched in Spring2005 the scheme already has almost 150members. Early indications are that theyare accessing a wide range of services,including shopping, education andemployment for trips that they wereotherwise unable to make.
3.58 A similar concept in a rural context is theFare Car scheme introduced for residentsin small communities north of Bath. Apartnership between Bath and North EastSomerset Council and a local taxi firm,this scheme provides a vital link to BathCity Centre and replaces a conventionalbus service. It operates two days per weekat fixed times, providing two journeys ineither direction for a fixed fare.Membership of the scheme is free andtravel into the City must be booked inadvance. In the first 11 months it carried1435 passengers.
Blue Badge Parking
3.59 We have ensured that disabled motoristsare not disadvantaged by trafficmanagement or parking measures bysubstantially increasing the number ofdisabled persons’ parking bays in the lastfive years. In South Gloucestershire for
example the number has nearly doubled.For North Somerset the number ofdisabled persons’ bays located at keylocations has been increased from 47 in2000 to 154 in 2005, up 228%.
Dropped Kerbs
3.60 Continued prioritisation of footwaymaintenance, and the enhancement ofcrossings have significantly improved thepedestrian environment for disabledpeople. Progress includes:
• 100% of controlled pedestriancrossings in North Somerset nowincorporate facilities for disabledpeople.
• 100% of pedestrian crossings in Bristolincorporate facilities for disabledpeople up from 48% (Local Targetmet).
New Disabled Parking Bays
Making Use of Dropped Kerbs
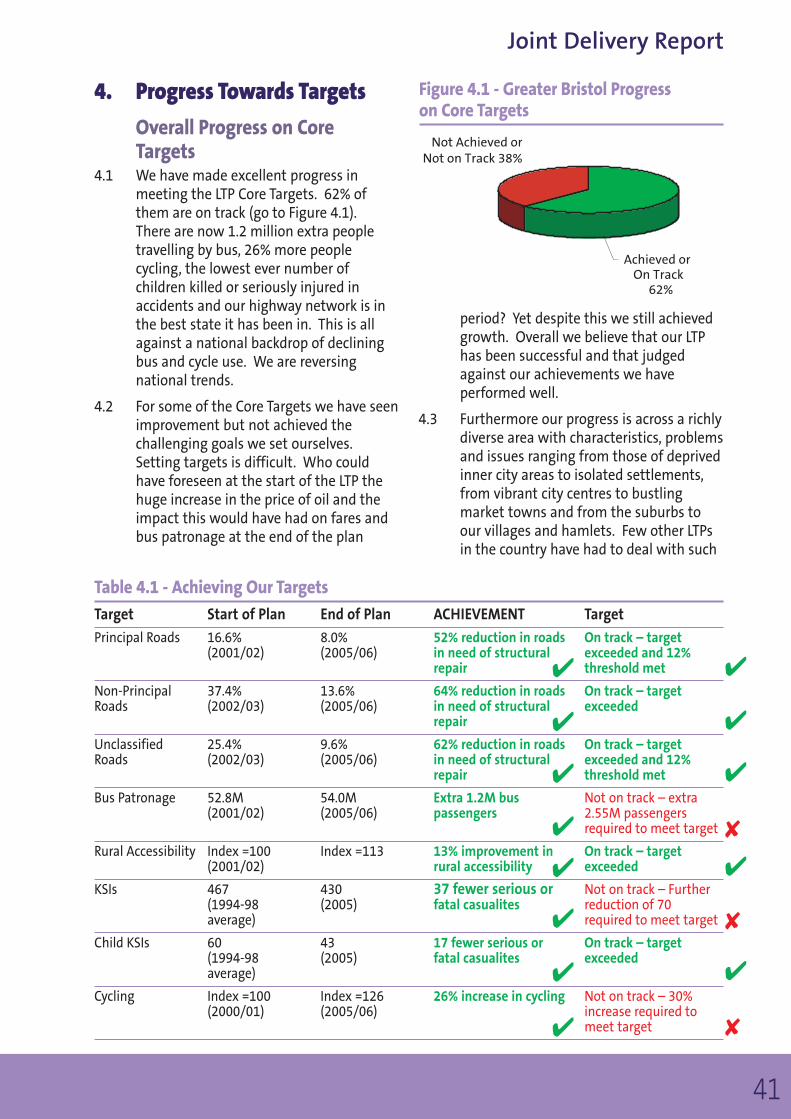
41
4. Progress Towards Targets
Overall Progress on CoreTargets
4.1 We have made excellent progress inmeeting the LTP Core Targets. 62% ofthem are on track (go to Figure 4.1).There are now 1.2 million extra peopletravelling by bus, 26% more peoplecycling, the lowest ever number ofchildren killed or seriously injured inaccidents and our highway network is inthe best state it has been in. This is allagainst a national backdrop of decliningbus and cycle use. We are reversingnational trends.
4.2 For some of the Core Targets we have seenimprovement but not achieved thechallenging goals we set ourselves.Setting targets is difficult. Who couldhave foreseen at the start of the LTP thehuge increase in the price of oil and theimpact this would have had on fares andbus patronage at the end of the plan
period? Yet despite this we still achievedgrowth. Overall we believe that our LTPhas been successful and that judgedagainst our achievements we haveperformed well.
4.3 Furthermore our progress is across a richlydiverse area with characteristics, problemsand issues ranging from those of deprivedinner city areas to isolated settlements,from vibrant city centres to bustlingmarket towns and from the suburbs toour villages and hamlets. Few other LTPsin the country have had to deal with such
Joint Delivery Report
Achieved or On Track
62%
Not Achieved or Not on Track 38%
Figure 4.1 - Greater Bristol Progress on Core Targets
Table 4.1 - Achieving Our Targets
Target Start of Plan End of Plan ACHIEVEMENT Target
Principal Roads 16.6% 8.0% 52% reduction in roads On track – target(2001/02) (2005/06) in need of structural exceeded and 12%
repair threshold met
Non-Principal 37.4% 13.6% 64% reduction in roads On track – targetRoads (2002/03) (2005/06) in need of structural exceeded
repair
Unclassified 25.4% 9.6% 62% reduction in roads On track – targetRoads (2002/03) (2005/06) in need of structural exceeded and 12%
repair threshold met
Bus Patronage 52.8M 54.0M Extra 1.2M bus Not on track – extra(2001/02) (2005/06) passengers 2.55M passengers
required to meet target
Rural Accessibility Index =100 Index =113 13% improvement in On track – target(2001/02) rural accessibility exceeded
KSIs 467 430 37 fewer serious or Not on track – Further(1994-98 (2005) fatal casualites reduction of 70average) required to meet target
Child KSIs 60 43 17 fewer serious or On track – target(1994-98 (2005) fatal casualites exceeded average)
Cycling Index =100 Index =126 26% increase in cycling Not on track – 30% (2000/01) (2005/06) increase required to
meet target
f
f
f
g
g
g
g
g
g
g
g
g
g
g
g
g

42
diversity. We have done so successfully asTable 4.1 shows. More detail can be foundin the four Proforma A tables at the end ofthe Delivery Report.
4.4 We recognise when judged against someof our targets we have not always beensuccessful but we believe that narrowlyfailing an ambitious target like cycling isbetter than succeeding against a very easytarget. Achieving bus patronage growth,when most of the rest of England outsideLondon is experiencing decline, is again atremendous achievement.
4.5 Our greatest disappointment is our slowprogress towards reducing the numbers ofpeople killed and seriously injured in roadaccidents. Notwithstanding our concernsabout the baseline, which DfT and thePolice have acknowledged under-recording accidents by up to 40%, we hadplanned a more significant reduction.Looking ahead the JLTP puts in placemeasures to improve our road safetyperformance and indeed the most recentaccident figures show that these arehaving success.
Integrated TransportBus Patronage and Satisfaction
4.6 In the five years an extra 1.2m passengerswere carried on Greater Bristol busservices (go to Figure 4.2). Althoughgrowth was not as much as we had hopedit is a creditable performance seen againstthe general decline in national buspatronage outside London. (In the firstfour years we had growth of almost 3%compared to a decrease of 4.5% inpassenger journeys in English non-Passenger Transport Executive areas).Where we have worked with theoperators on showcase routes there hasbeen substantial patronage growth (12%on A38 Bristol/Cribbs Causeway route inthe first year; almost 10% on service 13 inBath in twelve months; 20% on service 7in Weston-super-Mare in two years). By2003/04 we were on track to meet ourGreater Bristol target (go to Figure 4.2).
4.7 We are disappointed that the last twoyears has seen a drop in patronage,notably in Bristol. The reasons are thoughtto include shortages of bus drivers andfare increases due to higher fuel andinsurance costs. (Fares went up on threeoccasions in 2005). Another factor is the
50
51
52
53
54
55
56
57
2001/02 2002/03 2003/04 2004/05 2005/06
Nu
mb
er o
f p
asse
nge
rs p
er a
nn
um
(mill
ion
)
LTP TargetActual
Figure 4.2 - Bus Passengers in Greater BristolNot on track but 1.2m extra passengers

43
short term adverse effect of theBroadmead shopping redevelopmentalthough when the new shopping centreopens in 2008 large increases inpassengers are expected.
4.8 Outside Bristol the renewal of the Bathbus fleet by First and the introduction of aflat fare system in Weston-super-Marehave helped boost passenger numbers.The rise in South Gloucestershire in2005/06 is at least in part attributable tothe Bus Service Review carried out in2004/05. This led to the introduction ofnew and enhanced services and improvedbus rail links to Bristol Parkway andKeynsham stations. In Bath and NorthEast Somerset and South Gloucestershirewe have achieved our 2005 targets andNorth Somerset is well on the way toachieving its 10 year target. We expectedto achieve 1.1m extra passengers outsideBristol in the five years but actual growthwas 2.1m (go to Figure 4.2a).
4.9 Surveys in 2003/04 showed that 38% ofpeople were satisfied with bus services.Our next survey is in 2006/07 when weexpect the rating will have improved.
Remedial Action for Buses4.10 In partnership with the operators we have
continued to deliver a range of integratedtransport measures to foster bus use andwe intend to accelerate this programme(go to Table 5.1). The TravelBristol Info
Centre has been set up to enhance businformation in the city and we haveworked together to bring in the area-wideDiamond concessionary travel scheme. Wehave reviewed and updated our busstrategy as part of our new Joint LTP. Asshown by the Greater Bristol StrategicTransport Study we will rely on thesuccess of our Greater Bristol Bus Networkand Bath Package major schemeinvestments to really give an impetus toupgrading services and achievingpassenger growth. In 2005 we signed aConcordat with First to implement theGreater Bristol Bus Network scheme. BusPunctuality Improvement Partnerships arealso being formed to tackle problems ofunreliability.
Road Casualties4.11 In the last five years the number of people
in the Greater Bristol area killed orseriously injured has decreased by almost7% (go to Figure 4.3). The figure of 430 for2005/06 was significantly down on theprevious year and we see this trendcontinuing. Measured against the 1994-98 baseline both the SouthGloucestershire and North Somersettargets are on track to be met. SouthGloucestershire’s 2005 figure was thelowest since 1996 despite traffic andpopulation growth at above nationalaverage rates. This success lies in a fiveyear programme of active and targetedlocal safety and engineering schemesbacked up by major and innovativeeducation and training campaigns (go toChapter 5 Road Safety Plan Strategy). Thecasualty figure in North Somersetdropped by 28% over the last year from111 to 80 and this begins to reflect theamount of funding that has beenallocated to road safety projects.
4.12 Targets in Bristol and Bath and North EastSomerset are not on track but we believeprogress is better than the figures suggestas the 1994-98 baseline is low, perhaps byup to 40%, due to the under- reporting ofserious casualties in that period.
Joint Delivery Report
Nu
mb
er o
f p
asse
nge
rs p
er a
nn
um
(m
illio
n)
20
20
21
21
22
22
23
23
2001/02 2002/03 2003/04 2004/05 2005/06
LTP TargetActual
Figure 4.2a - Bus Passengers Outside BristolOn track, patronage up by 2.1m
Note: Outside Bristol refers to the areas of Bath & NorthEast Somerset, North Somerset and SouthGloucestershire.

44
4.13 Whilst there are encouraging trends in thecasualty figures for pedestrians and caroccupants, accident trends among cyclistsand powered two wheeler (PTW) ridersare disappointing.
Road Safety Remedial Action 4.14 In North Somerset a Road Safety Action
Plan was produced identifying the mostvulnerable road users. This has assisted inrefining the types of schemes andeducational/publicity work undertaken sothat the greatest benefit can be achievedfor the amount of investment available.
4.15 To address higher than average accidentrates in disadvantaged areas theKingswood Road Safety Project targetedall age ranges with roadshows, activitycompetitions, driver training and talks anda ‘Road Safety Day.’ David Jamieson, thethen Minister for Transport, praised thecampaign for providing local people withhelpful advice about how to stay safe onthe roads. The project has been repeatedwith similar success in Yate.
4.16 In Bath and North East Somersetsuccessful reductions have been achievedby comprehensive and collaborativeinitiatives such as Safer Routes to Schooland safety cameras. ‘Road Safety- The WayForward’ was published in 2005
promoting a range of measures, includingengineering, education and enforcementand partnership working.
4.17 In our JLTP we have set out acomprehensive Road Safety Action Planwith measures directed at both urban andrural areas and extending beyond thetraditional ‘Education, Engineering,Enforcement’. Speed management andenforcement will play their part and welook forward to making good use of theextra resources coming through changesin camera safety partnership funding.
4.18 We intend to establish an area-wideprogramme of road safety education,training and publicity initiatives for PTWriders and other road users and focusengineering on sites with highproportions of PTW casualties. If ourGreater Bristol Bus Network majorscheme goes ahead there is also scope toopen up more bus lanes for PTW riders.
Hutton Traffic Calming
Figure 4.3 - Killed or Seriously Injured Casualties in Greater Bristol areaCasualties down 8% on 1994-98 average but not yet on track
0
100
200
300
400
500
600
1999
94-98 A
ve2000
20012002
20032004
20052006
20072008
20092010
Nu
mb
er o
f ki
lled
or
seri
ousl
y in
jure
d
LTP TargetActual

45
4.19 For cyclists we will enhance our trainingprogrammes and implement a range ofmeasures to improve safety, as outlined inour JLTP Cycling Action Plan.
Child Road Casualties4.20 Tackling child casualties is a success story.
The number killed or seriously injuredfluctuates because of the relatively smallnumbers. But taking our area as a whole,total child casualties have fallensubstantially and we are on track to meetour overall target (Figure 4.4).
Cycling4.21 Cycling in the Greater Bristol area has
grown by 26% since 2000/01 in sharpcontrast to the downward trendnationally (go to Figure 4.5). (Between2000 and 2004 cycling in our area wentup by 22% compared to a 7% dropnationally: DfT Transport Trends 2005,based on vehicle kilometres). We areproud of our achievements and havechosen to report in detail on the successof our cycling strategy in Chapter 5.
4.22 We set our sights very high and althoughexceptional progress has been made, ithas not been possible to meet ourambitious target. In Bristol the figureshave fluctuated and, whilst 3% below the
trajectory in 2005/06, cycle usage isexpected to recover. The complementarylocal indicator measuring cycling flowsinto the central area of Bristol has showngreat success, with a 60% increase. This iseven more significant bearing in mindthat this growth is additional to analready high base.
4.23 There has been a sustained increase inBath and North East Somerset, one of thehighest across the South West authorities.Because of significant growth in the earlyyears of the period a more stretching, 5-year target was adopted in 2003. The finalfigure for 2005 was below the target butonly by 2%.
4.24 Over the LTP period cycling has increasedby 28% in South Gloucestershire and the
Joint Delivery Report
1999
94-98 A
ve2000
20012002
20032004
20052006
20072008
20092010
Nu
mb
er o
f C
hild
KSI
Cas
ual
ties
0
10
20
30
40
50
60
70
80
LTP TargetActual
Figure 4.4 - Child Killed and Seriously Injured (KSI) Casualties in Greater Bristol areaOn track
New Cycle Parking Facilities

46
target has been achieved. The widespreadimplementation of measures (go to Table5.4 Cycling Plan Strategy), the filling in of‘missing gaps’, promotion of Travel Plans(go to Table 5.5 Travel Plan Strategy) andextensive publicity have all helpedmaximise the role of cycling.
4.25 North Somerset has seen an encouragingincrease in cycling over the five yearperiod although the increase has not beenin line with our trajectory. From abaseline of 4919 in 1999/00 cycling in thedistrict grew to 5230 by 2005/06, anincrease of 6.3%.
Remedial Action for Cycling4.26 Our JLTP Cycling Action Plan is an essential
part of our strategies for tacklingcongestion and improving accessibility.We will be working with our partners tofurther promote cycling, for example byincreasing travel plan activities andsecuring more infrastructure through landuse planning. Provision of traffic freeroutes and convenient and safe on-roadfacilities will continue to be key featuresin our implementation programme.
4.27 Education, training, publicity andpromotion will continue to back up ourcapital investment in infrastructure.Expansion of bus lanes through ourGreater Bristol Bus Network majorscheme would also give a fillip to cycling,as shown with the A38 showcase busroute in Bristol.
Rural Accessibility4.28 There are about 15000 households who
live in small villages, hamlets or scatteredrural communities. They represent only4% of the Greater Bristol area’s populationand providing them with even a minimalconventional bus service has been a realchallenge. Nevertheless we are on trackoverall to meet our targets, assisted byRural Bus Subsidy Grant and Rural BusChallenge funding as well as our ownrevenue support.
80
90
100
110
120
130
140
150
2000/01
2001/02
2002/03
2003/04
2004/05
2005/06
Leve
l of
cycl
ing.
Bas
e
ind
ex o
f 10
0
LTP TargetActual
Figure 4.5 - Growth in Cycling in Greater Bristol areaGrowth but 2005/06 target not quite met
Cycling Publicity and Promotion Event

47
4.29 In South Gloucestershire 4 new busservices were introduced in 2004augmented by a further 27 peak hourrural buses and enhanced hourly serviceson 8 key routes in 2005. The result: theten year target met in five years. NorthSomerset is also on track to meet its 2010target with the filling in of gaps in busservice provision planned from 2006/07onwards. We have found in Bath andNorth East Somerset that the dispersedpattern of many small communities isespecially suited to community transportrather than mainstream bus services.There the 2005 figure for bus serviceaccess is slightly below the trajectory butcommunity transport patronage has goneup to compensate.
Highway MaintenanceBackground
4.30 We look after almost 5000 km of roadsand through our substantial capital andrevenue programmes we have made greatstrides in improving their condition.
Overall, we are satisfied that we are ontrack to meet our targets. Key challengesin the last five years have included thedifficulty in monitoring highway conditionbecause of changes in survey methodsand the exceptional weather in winter2000/01. We have carried out 337maintenance schemes involving 205km of carriageways.
4.31 Bristol City Council has developed its ownhighway network management plan toaddress local conditions and provide awider assessment of the highway. Whilstthis approach did not include trajectories,making it difficult to show combinedtrajectories and targets, Figures 4.6, 4.7and 4.8 do indicate Bristol’s 2005/06performances.
Condition of Principal Roads
4.32 Monitoring the condition of the GreaterBristol area’s 400km of ‘A’ roads changedfrom deflectograph to SCANNER surveysso it is difficult to compare recent figureswith those in the early LTP years. Based onthe most up-to-date figures we aresatisfied that we have achieved ourindividual targets. In 2005/06 weestimate that only 33km of our principalroad network were in need of structuralrepair. This represents 8%, much betterthan the DfT’s benchmark of 12% for goodcondition (go to Table 4.2). Figure 4.6compares performance across the LTPperiod outside Bristol (areas of Bath andNorth East Somerset, North Somerset and
Joint Delivery Report
Table 4.2 - Proportion of Principal Road Network in Need of Structural Repair (actual %)Year Bristol Outside Greater Bristol
Bristol Area Total
2000/01 0.3 17.9 13.9
2001/02 7.0 19.5 16.6
2002/03 14.7 17.2 16.6
2003/04 14.7 16.4 16.0
2004/05 42.8 25.9 29.8
2005/06 11.1 7.1 8.0
Note: Outside Bristol refers to the areas of Bath & North East Somerset, North Somerset and South Gloucestershire.
Rural Bus Use
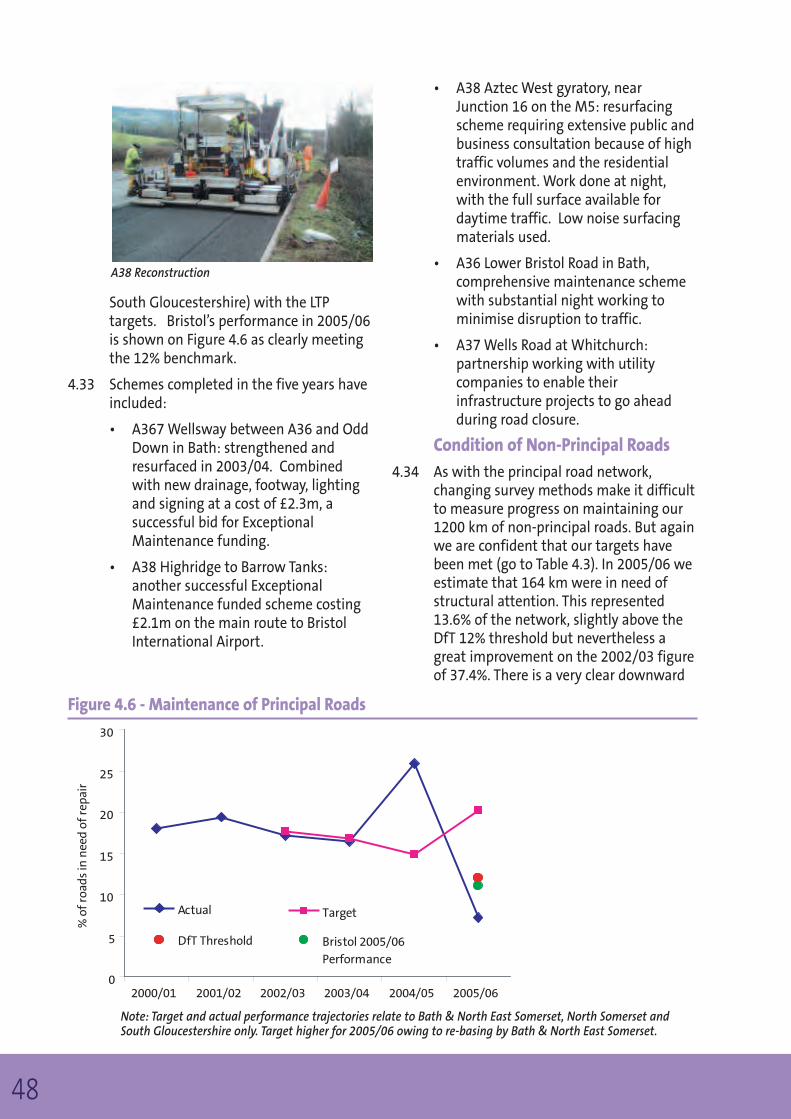
48
South Gloucestershire) with the LTPtargets. Bristol’s performance in 2005/06is shown on Figure 4.6 as clearly meetingthe 12% benchmark.
4.33 Schemes completed in the five years haveincluded:
• A367 Wellsway between A36 and OddDown in Bath: strengthened andresurfaced in 2003/04. Combinedwith new drainage, footway, lightingand signing at a cost of £2.3m, asuccessful bid for ExceptionalMaintenance funding.
• A38 Highridge to Barrow Tanks:another successful ExceptionalMaintenance funded scheme costing£2.1m on the main route to BristolInternational Airport.
• A38 Aztec West gyratory, nearJunction 16 on the M5: resurfacingscheme requiring extensive public andbusiness consultation because of hightraffic volumes and the residentialenvironment. Work done at night,with the full surface available fordaytime traffic. Low noise surfacingmaterials used.
• A36 Lower Bristol Road in Bath,comprehensive maintenance schemewith substantial night working tominimise disruption to traffic.
• A37 Wells Road at Whitchurch:partnership working with utilitycompanies to enable theirinfrastructure projects to go aheadduring road closure.
Condition of Non-Principal Roads
4.34 As with the principal road network,changing survey methods make it difficultto measure progress on maintaining our1200 km of non-principal roads. But againwe are confident that our targets havebeen met (go to Table 4.3). In 2005/06 weestimate that 164 km were in need ofstructural attention. This represented13.6% of the network, slightly above theDfT 12% threshold but nevertheless agreat improvement on the 2002/03 figureof 37.4%. There is a very clear downward
0
5
10
15
20
25
30
2000/01 2001/02 2002/03 2003/04 2004/05 2005/06
% o
f ro
ads
in n
eed
of r
epai
r
Actual
DfT Threshold
Target
Bristol 2005/06Performance
Figure 4.6 - Maintenance of Principal Roads
Note: Target and actual performance trajectories relate to Bath & North East Somerset, North Somerset andSouth Gloucestershire only. Target higher for 2005/06 owing to re-basing by Bath & North East Somerset.
A38 Reconstruction

49
trend here and building on this successand our experience we are confident the12% DfT threshold will be soon be reachedin the JLTP period. Figure 4.7 comparesperformance Outside Bristol with the LTPtargets. Bristol’s final year performance in2005/06 is also shown with the 12%benchmark being met.
Condition of Unclassified Roads4.35 We have over 3200km of unclassified
roads to maintain. Progress on improvingthe condition of the network has beengood. By 2005/06 we estimate that only9.6% of these roads are in need ofstructural repair (go to Table 4.4). In Bathand North East Somerset, North Somersetand South Gloucestershire we are wellbelow our own targets and the 12% DfTthreshold. The proportion of unclassifiedroads in Bristol needing work is above theDfT threshold but we consider that wehave arrested the deterioration in thecity’s network and it is now in reasonablysound condition. Figure 4.10 comparesperformance outside Bristol with the LTPtargets. Bristol’s 2005/06 performance isshown.
Footways4.36 In 2005/06 20.3% of our 6000km of Group
1 and 2 footways were in need of repair.This is below the DfT threshold of 25%and a great improvement on the 29.5%registered in 2003/04. We spent £7.9m onfootway maintenance capital schemes inthe five year period.
Bridges and Structures4.37 We implemented 51 bridge schemes at a
cost of £7.6m and 65 other structuralmaintenance projects at a cost of £6.6m.Schemes have included:
• Bristol Bridge: £1.3m project tostrengthen city centre crossing of theFloating Harbour.
• Yanley Viaduct on A370, replacementof bearings on main commuter routeinto Bristol.
• Somervale Road (East) on A362between Radstock and MidsomerNorton, reinforced concrete stressrelieving slab above existing archbarrel.
Joint Delivery Report
Table 4.4 - Proportion of Unclassified Road Network in Need of Structural Repair (actual %)Year Bristol Outside Greater Bristol
Bristol Area Total
22002/03 15.9 29.4 25.4
2003/04 7.0 15.9 13.3
2004/05 4.6 13.8 11.1
2005/06 18.3 5.9 9.6Note: Outside Bristol refers to the areas of Bath & North East Somerset, North Somerset and South Gloucestershire.
Table 4.3 - Proportion of Non- Principal Road Network in Need of Structural Repair (actual %)Year Bristol Outside Greater Bristol
Bristol Area Total
2002/03 26.8 38.6 37.4
2003/04 26.8 23.4 23.7
2004/05 2.2 17.2 15.6
2005/06 9.0 14.2 13.6Note: Outside Bristol refers to the areas of Bath & North East Somerset, North Somerset and South Gloucestershire..

50
0
5
10
15
20
25
30
35
2002/03 2003/04 2004/05 2005/06
% in
nee
d of
rep
air
Actual
DfT Threshold
Target
Bristol 2005/06Performance
Figure 4.8 - Maintenance of Unclassified Roads
Note: Target and actual performance trajectories relate to Bath & North East Somerset,North Somerset and South Gloucestershire only.
0
5
10
15
20
25
30
35
40
2002/03 2003/04 2004/05 2005/06
% o
f ro
ads
in n
eed
of r
epai
r
Actual
DfT Threshold
Target
Bristol 2005/06Performance
Figure 4.7 - Maintenance of Non-Principal Roads
Note: Target and actual performance trajectories relate to Bath & North East Somerset,North Somerset and South Gloucestershire only.

51
Capital Spending
4.38 We spent some £67m of mainstream LTPfunding on maintenance schemes. Inaddition we have deployed additionalfunding from other sources, including:
• DfT Exceptional Maintenance funding(£4.717m for A367 and A38 schemes).
• Local Public Service Agreements (forexample North Somerset’s £1m in2004/05).
• Funding of £1.15m for street lightingin South Gloucestershire in 2004-2006from Council’s own resources.
• £4.4m spent on highway maintenancefrom Bristol City Council’s ownresources reflecting the high prioritygiven to maintaining and improvingthe highway fabric.
• £1.6m additional spending by Bathand North East Somerset on highwaymaintenance.
• Additional SCA (for exampleemergency funding of £0.49m forHinton Hill slope stabilisation nearWellow, south of Bath; funding of£0.14m to remove highway elms inSouth Gloucestershire).
Revenue Spending
4.39 In the LTP period we spent of the order of£90m of revenue funding on assetmanagement including:
• Carriageways.
• Footways.
• Drainage.
• Winter maintenance.
• Hedges and verges.
• Street lighting.
• Bridges.
• Public Rights of Way.
• Cycling.
• Traffic signals.
• Signs and lines.
Progress on Local Targets4.40 In the LTP we all had a wide range of local
targets both outcome and output based.Relevant targets, particularly outcomebased ones, have been drawn uponthroughout this Delivery Report.
Summary4.41 Table 4.5 provides a useful summary of
our overall progress towards meeting LTPcore targets.
Joint Delivery Report
Bridge maintenance, before and after

52
Table 4.5: Summary of Performance on Core TargetsCore Indicator Bath & North Bristol North South Greater
East Somerset Somerset Gloucester- Bristolshire
Principal Roads BV223 achieved achieved achieved achieved achieved
Non Principal Roads BV224a achieved achieved achieved achieved achieved
Unclassified Roads BV224b achieved not achieved achieved achieved achieved
Bus passenger journeys achieved not on track not on track achieved not on track
Access to rural bus services not on track * on track on track on track
Deaths and serious injuries not on track not on track on track on track not on track
Children killed and on track not on track on track on track on trackseriously injured
Cycling not achieved not on track not on track achieved not on track
Note: Columns 2 to 5 reflect the data in Proforma A. Column 6 is our
average performance taking the Greater Bristol area as a whole.
* Not applicable

53
5. Delivery of LTP Strategies(Proforma B)
Introduction5.1 This chapter summarises our LTP
achievements over the last five years inthree key delivery areas:
• Public Transport.
• Road Safety.
• Sustainability.
5.2 In line with the Delivery Report Guidance(2006) we have chosen two furtherstrategies where we have successfullydelivered right across our area:
• Cycling.
• Travel Plans.
5.3 We chose cycling because against anational decline we have delivered a 26%growth in the number of people going bybike. Our Core Target may not be on trackbut we are making a difference. TravelPlans was chosen because we have beenboth innovative, with our car sharingscheme, and active in meeting localtargets and helping to deliver recordnumbers of travel plans.
5.4 For each of the strategies we report onwhat we planned to do, based around theoriginal LTP requirements for a good plan,what we did and an explanation for anychanges to what was planned. Whereverrelevant, Core Indicators and local targetsare used as supporting evidence.Examples of best practice are frequentlygiven. A summary headline for each partof the strategies is provided based on:
• Strategy implementation hasexceeded expectations.
• Strategy broadly implemented asplanned.
• Some elements of the Strategy notdelivered.
5.5 Figure 5.1 provides the overall picture ofour success.
Joint Delivery Report
Elements not delivered 3% Number of plan
strategy elementsexceeded
expectations 13%
Broadly implemented as planned 84%
Figure 5.1 - Delivery of LTP Strategies

54
Tabl
e 5.
1 –
Impl
emen
tati
on o
f Pub
lic T
rans
port
Stra
tegy
(Pro
form
a B)
Tabl
e 5.
1 –
Impl
emen
tati
on o
f Pub
lic T
rans
port
Stra
tegy
(Pro
form
a B)
Del
iver
y Be
nchm
ark
(wha
tw
e pl
anne
d to
do)
Wha
tha
s be
en d
one
Expl
anat
ions
for c
hang
es to
wha
tw
as p
lann
ed
Stra
tegy
Bro
adly
Impl
emen
ted
as P
lann
ed
We
spen
t£1
8.8m
over
the
LTP
perio
d on
sup
port
ing
204
serv
ices
acr
oss
the
area
per
yea
r. O
ver
4.5
mill
ion
pass
enge
rs w
ere
carr
ied
on th
ese
serv
ices
eac
h ye
ar. W
itho
utou
r sup
port
they
wou
ldei
ther
run
in a
redu
ced
form
or n
otat
all.
The
y pr
ovid
e va
luab
le s
ervi
ces
to a
reas
oth
erw
ise
poor
ly s
erve
d by
pub
lic tr
ansp
ort.
Rura
l Bus
Sub
sidy
Gra
ntto
talli
ng £
3.3m
has
been
spe
nton
sup
port
ing
35ru
ral b
us s
ervi
ces
acro
ss th
e th
ree
rura
l aut
horit
ies.
The
se s
ervi
ces
carr
ied
225,
000
pass
enge
rs in
200
5/06
and
hav
ebe
com
e an
ess
enti
al m
eans
of a
cces
sing
the
publ
ic tr
ansp
ort
netw
ork
for r
ural
resi
dent
s. In
2005
/06
the
auth
orit
ies
spen
t£7
.5m
on tr
avel
con
cess
ions
for o
ver 1
58,8
00re
side
nts.
Aro
lling
pro
gram
me
of b
us b
oard
ers
(rai
sed
kerb
s) a
nd w
heel
chai
r acc
essi
ble
shel
ters
has
bee
nim
plem
ente
d ac
ross
the
area
gre
atly
ass
isti
ng th
e m
obili
ty im
paire
d in
get
ting
aro
und.
Dur
ing
the
plan
per
iod
664
rais
ed k
erbs
and
327
new
she
lter
s ha
ve b
een
deliv
ered
.
Anu
mbe
r of i
nnov
ativ
ebu
s se
rvic
es h
ave
been
intr
oduc
ed in
clud
ing
the
Chew
Val
ley
Expl
orer
serv
ice
whi
ch li
nks
14 ru
ral p
aris
hes
to jo
bs in
Bris
tol a
nd p
rovi
des
acce
ss to
the
coun
trys
ide
for
urba
n re
side
nts.
We
wer
eaw
arde
d £1
88,0
00in
200
3 to
kic
k st
art
aco
mm
erci
al b
us s
ervi
ce s
ervi
ng a
maj
or n
ewho
usin
g ar
ea in
Wes
ton-
supe
r-M
are
(Urb
an B
us C
halle
nge
fund
ing)
and
this
has
resu
lted
in th
efo
llow
ing
key
impr
ovem
ents
:
•6
new
low
floo
r bus
es s
ervi
ng ro
utes
5/1
3 an
d 14
in W
esto
n-su
per-
Mar
e.
•Ex
tens
ion
of s
ervi
ces
13 a
nd 1
4.
•Pa
rtne
rshi
p w
orki
ng w
ith
Uph
ill H
ospi
tal r
esul
ting
in n
ew tr
affic
man
agem
ent
arra
ngem
ents
and
join
tin
fras
truc
ture
inve
stm
ent
on s
ite.
•N
ew ra
ised
ker
bs a
nd s
helt
ers
atke
y lo
cati
ons
alon
g th
e ro
ute.
•D
oor t
o do
or p
ublic
ity
to p
rom
ote
the
serv
ices
and
add
itio
nal r
oads
ide
publ
icit
y at
stop
s.
The
deliv
ery
of th
is s
trat
egy
has
been
acce
lera
ted
thro
ugh
extr
a fu
ndin
g in
the
form
of R
ural
Bus
Sub
sidy
Gra
nt, U
rban
Bus
Chal
leng
e, R
ural
Bus
Cha
lleng
e an
dKi
ckst
art
fund
ing
com
peti
tion
s.
Sout
h G
louc
este
rshi
re’s
Bus
Serv
ice
Revi
ew in
200
4/05
led
to th
ein
trod
ucti
on o
f 27
new
pea
k ti
me
serv
ices
in ru
ral a
reas
, enh
ance
d ho
urly
serv
ices
on
8 ke
y ro
utes
and
impr
oved
bus
rail
links
. The
se s
ervi
ce a
lter
atio
nsha
vebr
ough
tw
ith
them
an
incr
ease
inpa
ssen
ger l
evel
s up
5.6
% in
200
5/06
.
a)Su
bsta
ntia
lIm
prov
emen
ts to
serv
ices
and
netw
orks
acr
oss
the
area
.
1. B
us S
trat
egy

55
Joint Delivery Report
Del
iver
y Be
nchm
ark
(wha
tw
e pl
anne
d to
do)
Wha
tha
s be
en d
one
Expl
anat
ions
for c
hang
es to
wha
tw
as p
lann
ed
b)Su
bsta
ntia
lin
tegr
atio
n of
conv
enti
onal
bus
serv
ices
wit
h he
alth
and
com
mun
ity
tran
spor
tan
d th
evo
lunt
ary
sect
or
c) A
chie
vem
ent
ofta
rget
s
Stra
tegy
Impl
emen
tati
on h
as E
xcee
ded
Expe
ctat
ions
We
have
wor
ked
cont
inuo
usly
and
clo
sely
wit
h th
e co
mm
unit
y tr
ansp
ort
sect
or in
dev
elop
ing
new
and
exi
stin
g sc
hem
es.
All c
omm
unit
y tr
ansp
ort
min
ibus
es a
re n
ow w
heel
chai
r acc
essi
ble.
Com
mun
ity
tran
spor
tno
w p
rovi
des
on a
vera
ge 2
4,00
0jo
urne
ys a
mon
th th
is is
an
over
all
incr
ease
of 6
3%ov
er th
e fiv
e ye
ars
of LT
P.
Dur
ing
the
last
five
year
s a
num
ber o
f not
able
mile
ston
es h
ave
been
ach
ieve
d, e
xam
ples
of
whi
ch a
re a
s fo
llow
s:
•Th
e in
trod
ucti
on o
f 2 n
ew D
ial-a
-Rid
e sc
hem
es in
Key
nsha
m a
nd N
orto
n-Ra
dsto
ck b
roug
htab
out
over
14,
000
com
mun
ity
tran
spor
ttr
ips
in 2
005/
06.
•In
Bris
tol t
he e
xpan
sion
of t
he 2
mai
n co
mm
unit
y tr
ansp
ort
oper
ator
s re
sult
ed in
the
who
le o
fth
e ci
ty n
ow b
eing
cov
ered
by
Dia
l-a-R
ide.
12
new
veh
icle
s ha
ve b
een
deliv
ered
. Thi
s w
asfu
nded
thro
ugh
a su
cces
sful
Urb
an B
us C
halle
nge
Bid
and
loca
l aut
horit
y fu
ndin
g.
•A
new
fare
car
sch
eme
was
intr
oduc
ed in
Bat
h in
200
5 se
rvin
g 1,
435
pass
enge
rs in
10
mon
ths.
•Th
e RU
H p
ark
and
ride
serv
ice
was
intr
oduc
ed in
200
4 an
d lin
ks th
e Ro
yal U
nite
d H
ospi
tal t
oth
e O
dd D
own
Park
and
Rid
e si
te.T
he s
ervi
ce o
ffer
s fle
xibl
e ro
utin
g al
low
ing
the
serv
ice
todi
vert
to m
eet
dem
and.
Thi
s se
rvic
e ca
rrie
d 10
2,95
4 pa
ssen
gers
in 2
005/
06.
•4
rura
l int
erch
ange
hub
s ha
ve b
een
deliv
ered
in P
uckl
echu
rch,
Wic
k, A
lves
ton
and
Alm
onds
bury
pro
vidi
ng fa
cilit
ies
for c
omm
unit
y tr
ansp
ort
to li
nk w
ith
conv
enti
onal
bus
serv
ices
.
•N
ew a
cces
sibl
e bu
s se
rvic
e lin
king
Chi
ppin
g So
dbur
y, Y
ate
and
Fram
pton
Cot
tere
ll w
ith
Fren
chay
Hos
pita
l.
Stra
tegy
Bro
adly
Impl
emen
ted
as P
lann
ed
In th
e la
stfiv
eye
ars
an e
xtra
1.2
mill
ion
pass
enge
rs h
ave
been
car
ried
by o
ur b
us s
ervi
ces
whi
chag
ains
tth
e ge
nera
l dec
line
in b
us p
atro
nage
out
side
Lon
don
is a
pos
itiv
e re
sult
.
In B
ath
and
Nor
th E
ast
Som
erse
tan
d So
uth
Glo
uces
ters
hire
we
have
ach
ieve
d ou
r 200
5 ta
rget
san
d N
orth
Som
erse
tis
on
trac
k to
mee
tit
s 10
yea
r tar
get.
Bris
tol’s
targ
etha
s pr
oved
to b
e ve
rych
alle
ngin
g an
d, d
espi
te a
larg
e am
ount
of e
ffor
t, is
not
on tr
ack.
Sout
h G
louc
este
rshi
re s
uppo
rted
the
mer
ger o
f 4 T
owns
Tra
nspo
rtw
ith
Vale
Link
Com
mun
ity
Tran
spor
tcr
eati
ng a
sing
le o
rgan
isat
ion
deliv
erin
g ac
cess
ible
tran
spor
tth
roug
hout
the
Seve
rn V
ale
area
. Th
e m
erge
r red
uces
the
num
ber o
fdu
plic
ated
jour
neys
and
cre
ated
a s
ingl
ece
ntre
for c
o-or
dina
ting
trip
s. A
new
trad
ing
arm
, Sev
erns
ide
Tran
spor
tLi
mit
ed, w
ill d
eliv
er c
omm
erci
al s
ervi
ces
wit
h al
l the
pro
fits
used
to s
uppo
rtco
mm
unit
y tr
ansp
ort.
Succ
essf
ul U
rban
and
Rur
al B
usCh
alle
nge
Bids
ena
bled
acc
eler
ated
deliv
ery
of th
is s
trat
egy.
Subs
tant
ial p
atro
nage
grow
th h
as b
een
deliv
ered
on
show
case
rout
es in
our
are
a.
Rene
wal
of t
he B
ath
bus
fleet
by F
irst
and
the
intr
oduc
tion
of a
flat
fare
sch
eme
inW
esto
n-su
per-
Mar
e ha
ve a
ll he
lped
boo
stpa
ssen
ger n
umbe
rs.
Shor
tage
s of
bus
driv
ers
and
huge
fare
Tabl
e 5.
1 –
Impl
emen
tati
on o
f Pub
lic T
rans
port
Stra
tegy
(Pro
form
a B)

56
Del
iver
y Be
nchm
ark
(wha
tw
e pl
anne
d to
do)
Wha
tha
s be
en d
one
Expl
anat
ions
for c
hang
es to
wha
tw
as p
lann
ed
d) M
ajor
out
puts
deliv
ered
by
part
ners
hips
, suc
h as
subs
tant
ial s
how
case
rout
es
Stra
tegy
Bro
adly
Impl
emen
ted
as P
lann
ed
We
have
all
iden
tifie
d sh
owca
se b
us ro
utes
and
ass
ocia
ted
part
ners
hip
wor
king
wit
h op
erat
ors
as a
maj
or p
riorit
y in
the
deliv
ery
of p
ublic
tran
spor
tst
rate
gies
. N
ew Q
ualit
y Bu
s Pa
rtne
rshi
psha
ve b
een
sign
ed in
the
last
5 ye
ars
betw
een
the
auth
orit
ies
and
maj
or b
us o
pera
tors
to s
how
com
mit
men
tto
par
tner
ship
wor
king
.
We
have
impl
emen
ted
a ta
rget
ed p
rogr
amm
e of
wor
ks a
long
11
show
case
bus
rout
es in
part
ners
hip
wit
h Fi
rst
Bus
the
maj
or lo
cal o
pera
tor.
Thes
e sh
owca
se ro
utes
incl
ude:
•Se
rvic
es 7
5, 7
6 an
d 77
, alo
ng th
e A3
8 co
rrid
or b
etw
een
Crib
bs C
ause
way
and
Har
tclif
fe;
•X1
Bris
tol t
o W
esto
n-su
per-
Mar
e, 7
Wes
ton-
supe
r-M
are
tow
n se
rvic
e, 1
3/14
Wes
ton-
supe
r-M
are
tow
n se
rvic
e se
rvin
g th
e ne
w h
ousi
ng e
stat
es a
tLo
ckin
g Ca
stle
, 13
Bath
cro
ss c
ity
serv
ice.
•Se
rvic
e 37
5/6
Wel
ls to
Bris
tol.
We
have
spe
ntov
er £
8mon
impr
ovem
ents
to th
ese
corr
idor
s in
clud
ing:
•Ra
ised
ker
bs a
tbu
s st
ops
and
drop
ped
kerb
s on
the
appr
oach
es to
sto
ps to
ena
ble
impr
oved
acce
ss o
nto
low
floo
r bus
es.
•Ad
diti
onal
bus
sto
ps a
tke
y lo
cati
ons
on th
e ro
ute
and
relo
cati
ng o
ther
sto
ps in
poo
r loc
atio
ns.
Bus
stop
mar
king
s on
the
road
to re
duce
par
king
on
the
appr
oach
to s
tops
.
•N
ew b
us te
rmin
als
atW
orle
and
Old
mix
on o
n th
e se
rvic
e 7
rout
e.
•N
ew b
us s
top
pole
s, fl
ags
and
tim
etab
le c
ases
at
all s
tops
whi
ch a
re in
divi
dual
ly n
amed
and
bran
ded
wit
h Tr
avel
ine
logo
det
ails
.
•Ad
diti
onal
tim
etab
le c
ases
at
bus
stop
s, a
nd d
oor t
o do
or ti
met
able
dis
trib
utio
n on
cer
tain
rout
es.
incr
ease
s in
this
are
a ha
ve p
reve
nted
the
incr
ease
in p
atro
nage
taki
ng p
lace
inBr
isto
l. A
3% in
crea
se in
pat
rona
ge w
asse
en o
ver t
he fi
rst
4 ye
ars
but
halt
ed in
year
5 fo
llow
ing
3 fa
re in
crea
ses.
Init
ial p
repa
rato
ry w
orks
for B
risto
l’sse
cond
sho
wca
se b
us ro
ute
on A
420
/A4
31 c
orrid
or (B
risto
l Cit
y Ce
ntre
toKi
ngsw
ood)
wer
e un
dert
aken
dur
ing
the
LTP.
Thi
s ha
s in
clud
ed c
ompl
etin
g th
ein
itia
l des
ign
for t
he s
chem
e; n
on-
stat
utor
y co
nsul
tati
on w
ith
loca
lbu
sine
sses
, res
iden
ts a
nd o
ther
stak
ehol
ders
; the
com
mis
sion
ing
ofco
nsul
tant
s to
com
plet
e a
com
preh
ensi
vem
icro
-sim
ulat
ion
traf
fic m
odel
of t
heco
rrid
or;a
nd th
e up
grad
e of
a n
umbe
r of
bus
stop
s al
ong
the
rout
e to
pro
vide
leve
lac
cess
to b
uses
.
Itw
as o
rigin
ally
env
isag
ed th
atth
isse
cond
sho
wca
se w
ould
be
impl
emen
ted
durin
g th
e LT
P pe
riod,
but
the
exte
nsiv
eco
nsul
tati
on u
nder
take
n du
ring
the
first
A38
Show
case
rout
e, a
nd s
ubse
quen
tam
endm
ents
(suc
h as
the
incl
usio
n of
ash
oppe
rs c
ar p
ark)
, cau
sed
som
e de
lays
to it
s im
plem
enta
tion
. It
also
em
phas
ised
the
impo
rtan
ce o
f wid
e-ra
ngin
gco
nsul
tati
on to
ach
ieve
max
imum
bene
fits
on th
e se
cond
Sho
wca
se ro
ute.
Tabl
e 5.
1 –
Impl
emen
tati
on o
f Pub
lic T
rans
port
Stra
tegy
(Pro
form
a B)
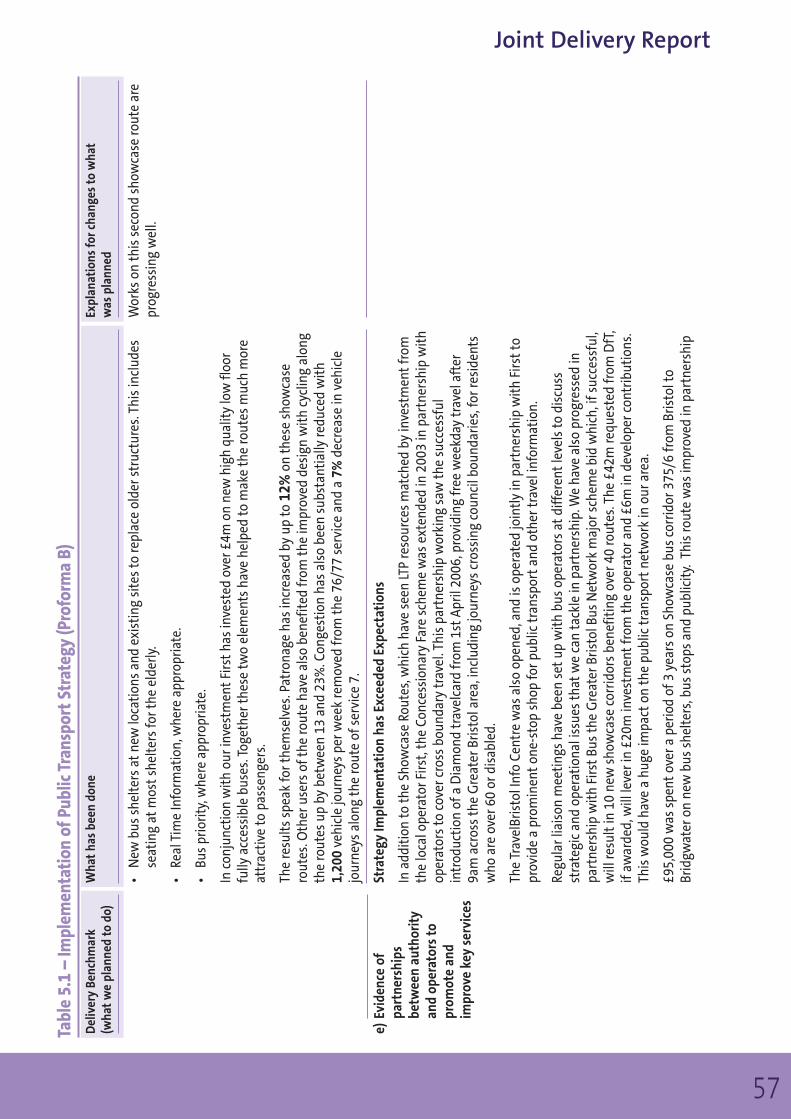
57
Joint Delivery Report
Del
iver
y Be
nchm
ark
(wha
tw
e pl
anne
d to
do)
Wha
tha
s be
en d
one
Expl
anat
ions
for c
hang
es to
wha
tw
as p
lann
ed
e)Ev
iden
ce o
fpa
rtne
rshi
psbe
twee
n au
thor
ity
and
oper
ator
s to
prom
ote
and
impr
ove
key
serv
ices
•N
ew b
us s
helt
ers
atne
w lo
cati
ons
and
exis
ting
sit
es to
repl
ace
olde
r str
uctu
res.
Thi
s in
clud
esse
atin
g at
mos
tsh
elte
rs fo
r the
eld
erly
.
•Re
al T
ime
Info
rmat
ion,
whe
re a
ppro
pria
te.
•Bu
s pr
iorit
y, w
here
app
ropr
iate
.
In c
onju
ncti
on w
ith
our i
nves
tmen
tFi
rst
has
inve
sted
ove
r £4m
on
new
hig
h qu
alit
y lo
w fl
oor
fully
acc
essi
ble
buse
s. T
oget
her t
hese
two
elem
ents
hav
e he
lped
to m
ake
the
rout
es m
uch
mor
eat
trac
tive
to p
asse
nger
s.
The
resu
lts
spea
k fo
r the
mse
lves
. Pat
rona
ge h
as in
crea
sed
by u
p to
12%
on th
ese
show
case
rout
es. O
ther
use
rs o
f the
rout
e ha
ve a
lso
bene
fited
from
the
impr
oved
des
ign
wit
h cy
clin
g al
ong
the
rout
es u
p by
bet
wee
n 13
and
23%
. Con
gest
ion
has
also
bee
n su
bsta
ntia
lly re
duce
d w
ith
1,20
0ve
hicl
e jo
urne
ys p
er w
eek
rem
oved
from
the
76/7
7 se
rvic
e an
d a
7%de
crea
se in
veh
icle
jour
neys
alo
ng th
e ro
ute
of s
ervi
ce 7
.
Stra
tegy
Impl
emen
tati
on h
as E
xcee
ded
Expe
ctat
ions
In a
ddit
ion
to th
e Sh
owca
se R
oute
s, w
hich
hav
e se
en LT
P re
sour
ces
mat
ched
by
inve
stm
ent
from
the
loca
l ope
rato
r Firs
t, th
e Co
nces
sion
ary
Fare
sche
me
was
ext
ende
d in
200
3 in
par
tner
ship
wit
hop
erat
ors
to c
over
cro
ss b
ound
ary
trav
el. T
his
part
ners
hip
wor
king
saw
the
succ
essf
ulin
trod
ucti
on o
f a D
iam
ond
trav
elca
rd fr
om 1
stAp
ril 2
006,
pro
vidi
ng fr
ee w
eekd
ay tr
avel
aft
er9a
m a
cros
s th
e G
reat
er B
risto
l are
a, in
clud
ing
jour
neys
cro
ssin
g co
unci
l bou
ndar
ies,
for r
esid
ents
who
are
ove
r 60
or d
isab
led.
The
Trav
elBr
isto
l Inf
o Ce
ntre
was
als
o op
ened
, and
is o
pera
ted
join
tly
in p
artn
ersh
ip w
ith
Firs
tto
prov
ide
a pr
omin
ent
one-
stop
sho
p fo
r pub
lic tr
ansp
ort
and
othe
r tra
vel i
nfor
mat
ion.
Regu
lar l
iais
on m
eeti
ngs
have
bee
n se
tup
wit
h bu
s op
erat
ors
atdi
ffer
ent
leve
ls to
dis
cuss
stra
tegi
c an
d op
erat
iona
l iss
ues
that
we
can
tack
le in
par
tner
ship
. We
have
als
o pr
ogre
ssed
inpa
rtne
rshi
p w
ith
Firs
tBu
s th
e G
reat
er B
risto
l Bus
Net
wor
k m
ajor
sch
eme
bid
whi
ch, i
f suc
cess
ful,
will
resu
ltin
10
new
sho
wca
se c
orrid
ors
bene
fitin
g ov
er 4
0 ro
utes
. The
£42
m re
ques
ted
from
DfT
,if
awar
ded,
will
leve
r in
£20m
inve
stm
ent
from
the
oper
ator
and
£6m
in d
evel
oper
con
trib
utio
ns.
This
wou
ld h
ave
a hu
ge im
pact
on th
e pu
blic
tran
spor
tne
twor
k in
our
are
a.
£95,
000
was
spe
ntov
er a
per
iod
of 3
yea
rs o
n Sh
owca
se b
us c
orrid
or 3
75/6
from
Bris
tol t
oBr
idgw
ater
on
new
bus
she
lter
s, b
us s
tops
and
pub
licit
y. T
his
rout
e w
as im
prov
ed in
par
tner
ship
Wor
ks o
n th
is s
econ
d sh
owca
se ro
ute
are
prog
ress
ing
wel
l.
Tabl
e 5.
1 –
Impl
emen
tati
on o
f Pub
lic T
rans
port
Stra
tegy
(Pro
form
a B)

58
Del
iver
y Be
nchm
ark
(wha
tw
e pl
anne
d to
do)
Wha
tha
s be
en d
one
Expl
anat
ions
for c
hang
es to
wha
tw
as p
lann
ed
f)Ev
iden
ce o
f the
LTP
inve
stm
ent
mad
e in
bus
prio
rity
mea
sure
s an
din
fras
truc
ture
deliv
erin
g m
onit
ored
bene
fits
to b
uspa
ssen
gers
cos
tef
fect
ivel
y
wit
h So
mer
set
Coun
ty C
ounc
il, w
ho in
vest
ed in
road
side
infr
astr
uctu
re a
nd F
irst
who
inve
sted
inne
w v
ehic
les
for t
he s
ervi
ce in
Janu
ary
2005
. It
prov
ided
an
enha
nced
freq
uenc
y fr
om e
very
60
min
utes
to e
very
30
min
utes
in M
ay 2
005.
Pas
seng
er n
umbe
rs o
n th
ese
serv
ices
gre
w b
y 2.
7%w
hen
the
init
ial w
ork
was
car
ried
out.
We
have
all
succ
essf
ully
wor
ked
in p
artn
ersh
ip w
ith
all o
f the
oth
er S
outh
Wes
tau
thor
itie
s an
dbu
s op
erat
ors
as p
art
of th
e SW
PTI p
roje
ctto
set
up th
e Tr
avel
ine
publ
ic tr
ansp
ort
tele
phon
e an
din
tern
etin
form
atio
n se
rvic
es.
Stra
tegy
Bro
adly
Impl
emen
ted
as P
lann
ed
Dur
ing
the
plan
per
iod
we
have
spe
nt£1
2.5m
on b
us p
riorit
y an
d in
fras
truc
ture
mea
sure
s an
dha
ve d
eliv
ered
:
•11
sho
wca
se ro
ute
sche
mes
.
•12
bus
lane
s.
•2
Hig
h O
ccup
ancy
Veh
icle
(HO
V) la
nes.
•11
oth
er b
us p
riorit
y sc
hem
es.
•68
new
bus
sto
ps.
•83
bus
sto
ps w
ith
tim
etab
le d
ispl
ays.
•70
3 im
prov
emen
ts to
exi
stin
g st
ops.
•23
oth
er b
us in
fras
truc
ture
sch
emes
.
•66
4 ra
ised
ker
bs.
•32
7 bu
s sh
elte
rs.
The
Pars
on S
tree
tG
yrat
ory
sche
me
in s
outh
Bris
tol i
s a
good
exa
mpl
e of
the
intr
oduc
tion
of b
uspr
iorit
y an
d it
s m
easu
rabl
e be
nefit
s. T
rans
port
mod
ellin
g in
dica
ted
that
such
a s
chem
e co
uld
besu
cces
sful
and
brin
g co
nsid
erab
le b
enef
its.
The
sch
eme
inco
rpor
ates
new
con
tra-
flow
bus
and
cycl
e la
nes.
Thi
s en
able
d in
boun
d bu
ses
to re
duce
thei
r jou
rney
dis
tanc
e by
0.5
km, d
eliv
erin
g an
aver
age
jour
ney
tim
e sa
ving
of 2
min
utes
per
veh
icle
. In
addi
tion
this
sch
eme
upgr
aded
traf
ficsi
gnal
con
trol
ove
r the
who
le g
yrat
ory,
and
pro
vide
d 8
new
ped
estr
ian
cros
sing
s an
d a
new
hig
hqu
alit
y bu
s st
op o
n th
e co
ntra
-flo
w s
ecti
on.
Tabl
e 5.
1 –
Impl
emen
tati
on o
f Pub
lic T
rans
port
Stra
tegy
(Pro
form
a B)

59
Joint Delivery Report
Del
iver
y Be
nchm
ark
(wha
tw
e pl
anne
d to
do)
Wha
tha
s be
en d
one
Expl
anat
ions
for c
hang
es to
wha
tw
as p
lann
ed
a)A
chie
vem
ent
ofst
retc
hing
loca
lou
tcom
e in
dica
tors
b)D
eliv
ery
ofsu
bsta
ntia
l inc
reas
esin
Par
k an
d Ri
de a
ndin
terc
hang
e fa
cilit
ies.
The
inst
alla
tion
of S
elec
tive
Veh
icle
Det
ecti
on a
ttr
affic
sig
nals
and
a H
igh
Occ
upan
cy V
ehic
lela
ne a
long
the
serv
ice
X1 ro
ute
has
resu
lted
in a
n in
crea
se in
ser
vice
pun
ctua
lity
from
57%
in20
01 to
74%
in 2
005.
The
HO
V la
ne h
as d
ecre
ased
jour
ney
tim
es fo
r veh
icle
s ca
rryi
ng m
ore
than
2pe
ople
by
21%
.
In 2
001,
Bat
h &
Nor
th E
ast
Som
erse
tCo
unci
l int
rodu
ced
the
Prio
rity
Acce
ss P
oint
(bus
gat
e) in
Nor
thga
te S
tree
t, Ba
th u
sing
Sel
ecte
d Ve
hicl
e D
etec
tion
to re
duce
thro
ugh
traf
fic in
the
area
tobu
ses,
taxi
s an
d em
erge
ncy
vehi
cles
ther
eby
impr
ovin
g bu
s re
liabi
lity
and
redu
cing
traf
fic le
vels
by 7
0%
Stra
tegy
Bro
adly
Impl
emen
ted
as P
lann
ed
Our
are
a ha
s se
en a
19%
rise
in p
ark
and
ride
patr
onag
e ov
er th
e fir
stLT
P pe
riod,
whi
ch is
part
icul
arly
impr
essi
ve, g
iven
the
over
all d
eclin
e in
bus
pas
seng
ers
in th
e ar
ea.
An a
mbi
tiou
s ta
rget
of a
25%
incr
ease
in p
asse
nger
num
bers
on
the
Bath
par
k an
d rid
e ne
twor
kw
as s
etin
200
0. T
his
targ
etha
s be
en m
etw
ith
pass
enge
r num
bers
risi
ng fr
om 6
35,6
15 in
1998
/9 to
815
,648
in 2
005,
an
incr
ease
of 2
8%.
Stra
tegy
Bro
adly
Impl
emen
ted
as P
lann
ed
Sinc
e op
enin
g in
200
3, p
atro
nage
on th
is n
ew p
ark
and
ride
serv
ice
on th
e A4
Por
tway
to th
eno
rth
wes
tof
Bris
tol c
ity
cent
re h
as g
row
n st
eadi
ly. I
n 20
04/0
5 th
e se
rvic
e ca
rrie
d ov
er 2
40,0
00pa
ssen
gers
, a 2
8% in
crea
se in
pat
rona
ge in
the
prev
ious
yea
r. Th
roug
h th
e pr
ovis
ion
of s
ever
alin
term
edia
te s
tops
, the
ser
vice
als
o pr
ovid
es a
ver
y us
eful
loca
l bus
ser
vice
to a
reas
that
are
not
serv
ed b
y co
nven
tion
al b
us s
ervi
ces
alon
g th
e A4
Por
tway
.
A4 B
ath
Road
par
k an
d rid
e se
rvic
e ha
s be
en e
nhan
ced
incl
udin
g Re
al T
ime
Info
rmat
ion
alon
g th
ero
ute,
impr
oved
ser
vice
info
rmat
ion,
etc
. D
urin
g th
e fir
stLT
P pe
riod,
use
of t
his
1300
spa
ce s
ite
has
grow
n to
cap
acit
y.N
egot
iati
ons
to e
xpan
d th
is s
ite
are
now
und
erw
ay, f
ollo
win
g a
capa
city
and
expa
nsio
n st
udy
unde
rtak
en in
200
4. T
he L
ong
Asht
on P
ark
and
Ride
ser
vice
has
bee
nen
hanc
ed in
clud
ing
the
prov
isio
n of
Rea
l Tim
e In
form
atio
n al
ong
the
rout
e an
d im
prov
ed s
ervi
cein
form
atio
n.
Prog
ress
wit
h so
me
of th
e pr
opos
ed P
ark
and
Ride
sit
es h
as b
een
slow
er th
anex
pect
ed.
Neg
otia
tion
s w
ith
deve
lope
rsov
er th
e Em
erso
ns G
reen
sit
e ar
eco
ntin
uing
. La
nd is
sues
at
the
Park
way
Nor
th (a
djac
ent
to B
risto
l Par
kway
stat
ion)
hav
ede
laye
d it
s im
plem
enta
tion
.
The
deliv
ery
of L
ambr
idge
park
and
ride
has
been
del
ayed
by
plan
ning
issu
esre
gard
ing
the
relo
cati
on o
f Bat
h Ru
gby
Club
from
the
iden
tifie
d pa
rk a
nd ri
desi
te a
nd fl
ood
mit
igat
ion
prop
osal
s.
Tabl
e 5.
1 –
Impl
emen
tati
on o
f Pub
lic T
rans
port
Stra
tegy
(Pro
form
a B)
2. P
ublic
Tra
nspo
rtIn
terc
hang
e

60
Del
iver
y Be
nchm
ark
(wha
tw
e pl
anne
d to
do)
Wha
tha
s be
en d
one
Expl
anat
ions
for c
hang
es to
wha
tw
as p
lann
ed
In 2
002/
03 th
e op
erat
ing
tim
es o
f the
thre
e pa
rk a
nd ri
de ro
utes
ser
ving
Bat
h Ci
ty C
entr
e w
ere
exte
nded
from
080
0-19
30 to
060
0-20
30 o
n M
onda
ys to
Sat
urda
ys.
In 2
004
plan
ning
per
mis
sion
was
gra
nted
to o
pera
te th
e th
ree
site
s on
a s
elec
ted
num
ber o
f Sun
days
and
Ban
k H
olid
ays
each
year
.
Ane
w p
ark
and
ride
serv
ice
linki
ng T
he R
oyal
Uni
ted
Hos
pita
l wit
h th
e O
dd D
own
park
and
ride
site
, ser
vice
42,
was
intr
oduc
ed in
ear
ly 2
004
usin
g ne
w lo
w-f
loor
eas
y ac
cess
bus
es.
This
ser
vice
prov
ides
an
esse
ntia
l lin
k to
the
loca
l hos
pita
l for
com
mut
ers,
pat
ient
s an
d vi
sito
rs fr
om th
esu
rrou
ndin
g ru
ral a
reas
out
side
Bat
h Ci
ty a
nd th
e tw
o m
ost
depr
ived
are
as w
ithi
n Ba
th a
nd is
aco
re e
lem
ent
of th
e Ro
yal U
nite
d H
ospi
tal’s
em
ploy
er’s
trav
el p
lan,
and
man
agem
ent
of tr
avel
dem
ands
on
the
site
.
We
all r
ecog
nise
d in
the
LTP
the
impo
rtan
ce o
f im
prov
ing
inte
rcha
nge
faci
litie
s in
ord
er to
mak
eth
e pu
blic
tran
spor
tne
twor
k m
ore
acce
ssib
le fo
r res
iden
ts o
f the
are
a. A
num
ber o
f sch
emes
have
bee
n de
velo
ped
and
deliv
ered
dur
ing
LTP1
incl
udin
g:
•Th
e fir
stPa
rk a
nd S
hare
sit
e in
Gre
atBr
itai
n at
Aspe
cts
Leis
ure
just
off t
he A
4174
Avo
n Ri
ngRo
ad w
as o
pene
d in
200
4.
•A
site
at
Nib
ley
on th
e ou
tski
rts
of Y
ate
is a
tth
e pl
anni
ng c
onse
ntst
age.
Det
aile
d de
sign
sha
vebe
en p
rodu
ced
and
cons
ulte
d on
. Co
nstr
ucti
on is
to
com
men
ce in
200
7.
•A
succ
essf
ul R
ural
Bus
Cha
lleng
e bi
d en
able
d th
e Ru
ral I
nter
chan
ge H
ubs
atAl
mon
dsbu
ry,
Wic
k, P
uckl
echu
rch
and
Alve
ston
to b
e bu
ilt(g
o to
Cha
pter
3).
The
se H
ubs
incl
uded
new
hig
hqu
alit
y bu
s sh
elte
rs, r
aise
d ke
rbs,
impr
oved
ped
estr
ian
cros
sing
s an
d fo
otw
ays,
cyc
le s
tora
gefa
cilit
ies
and
larg
e la
y-by
s fo
r bus
es, c
omm
unit
y tr
ansp
ort
and
taxi
s.
•Co
ntrib
utio
n to
the
new
inte
rcha
nge
faci
litie
s at
Bris
tol P
arkw
ay s
tati
on.
•Th
e ne
w b
us a
nd c
oach
sta
tion
bui
ltne
ar B
road
mea
d, in
con
junc
tion
wit
h re
deve
lopm
ent,
now
pro
vide
s fa
r bet
ter i
nter
chan
ge fa
cilit
ies
for t
he p
ublic
acc
essi
ng c
entr
al B
risto
l.
•£3
00,0
00 o
f cap
ital
inve
stm
ent
has
been
use
d in
par
tner
ship
wit
h lo
cal t
rain
ope
rato
rs to
enha
nce
the
inte
rcha
nge
faci
litie
s at
stat
ions
acr
oss
Bris
tol.
•N
ew s
uppo
rted
bus
rout
es s
uch
as th
e 50
0 se
rvic
e ha
ve b
een
intr
oduc
ed th
roug
h th
e LT
P to
link
bus
and
rail
inte
rcha
nges
and
car
par
ksw
ith
the
key
com
mer
cial
and
tour
ist
dest
inat
ions
in c
entr
al B
risto
l. Th
is h
as c
onsi
dera
bly
impr
oved
inte
rcha
nge
wit
hin
the
cent
ral a
rea
and
has
been
furt
her e
nhan
ced
to p
rovi
de a
20
min
ute
freq
uenc
y
Des
pite
ext
ensi
vem
arke
ting
of t
he fi
rst
Park
and
Sha
resi
te o
ffth
e A4
174
Avon
Ring
Roa
d, t
he e
xpec
ted
dem
and
did
not
mat
eria
lise
and
the
site
was
dis
cont
inue
din
200
5. N
onet
hele
ss v
alua
ble
less
ons
have
bee
n le
arnt
abou
tho
w fu
ture
sit
essh
ould
be
loca
ted,
dev
elop
ed a
ndm
arke
ted.
Tabl
e 5.
1 –
Impl
emen
tati
on o
f Pub
lic T
rans
port
Stra
tegy
(Pro
form
a B)

61
Joint Delivery Report
Del
iver
y Be
nchm
ark
(wha
tw
e pl
anne
d to
do)
Wha
tha
s be
en d
one
Expl
anat
ions
for c
hang
es to
wha
tw
as p
lann
ed
a)D
eliv
ery
ofsu
bsta
ntia
llyim
prov
edin
tegr
atio
n, in
whi
chth
e LA
is a
key
part
ner
b)D
eliv
ery
ofsu
bsta
ntia
l out
puts
by
the
LA a
ta
leve
lat
leas
tco
nsis
tent
wit
h it
s LT
P st
rate
gy
As p
art
of th
e So
uthg
ate
deve
lopm
ent
in B
ath
the
bus
stat
ion
is b
eing
mov
ed n
ext
to th
e ra
ilway
stat
ion
to p
rovi
de im
prov
ed in
terc
hang
e fa
cilit
ies.
Ext
ensi
ve p
repa
rato
ry w
ork
has
been
unde
rtak
en.
Stra
tegy
Bro
adly
Impl
emen
ted
as P
lann
ed
Ove
r the
per
iod
of th
e fir
stLT
P, ra
il pa
ssen
ger n
umbe
rs a
tlo
cal s
tati
ons
in th
e ar
ea g
rew
by
mor
eth
an 4
1%.
Whi
lst
we
have
a li
mit
ed ro
le in
rail
infr
astr
uctu
re p
roje
cts,
an
ongo
ing
prog
ram
me
ofen
hanc
emen
ts to
exi
stin
g se
rvic
es a
nd fa
cilit
ies,
and
pro
mot
iona
l ini
tiat
ives
in p
artn
ersh
ip w
ith
rail
oper
ator
s ha
s be
en u
nder
take
n, in
clud
ing:
•St
atio
n en
hanc
emen
ts a
tke
y lo
cati
ons
in re
lati
on to
Sho
wca
se b
us ro
utes
, to
impr
ove
inte
rcha
nge
pote
ntia
l.
•N
ew 3
12 b
us s
ervi
ce p
rovi
ded
betw
een
Thor
nbur
y an
d Br
isto
l Par
kway
sta
tion
pro
vidi
ng a
bus/
rail
link
for T
horn
bury
resi
dent
s fo
r the
firs
tti
me.
•Im
prov
ed b
us li
nks
to K
eyns
ham
railw
ay s
tati
on fo
r Old
land
and
Lon
gwel
l Gre
en re
side
nts.
•N
ew e
asy
to u
se ti
met
able
s fo
r Yat
e, P
atch
way
, Filt
on a
nd S
ever
n Be
ach
stat
ions
.
•N
ew p
oste
r cas
es a
tYat
e, P
atch
way
and
Sev
ern
Beac
h st
atio
ns.
•M
atch
fund
ing
for i
mpr
ovem
ents
to K
eyns
ham
sta
tion
and
bet
ter c
yclin
g fa
cilit
ies
incl
udin
gcy
cle
lock
ers
atO
ldfie
ld P
ark
stat
ion.
•M
ajor
inve
stm
ent
in th
e fo
reco
urt
atW
esto
n-su
per-
Mar
e ha
s cr
eate
d a
new
trav
el in
terc
hang
ew
ith
cycl
e an
d ta
xi p
arki
ng. N
ew p
edes
tria
n ar
eas
and
zebr
a cr
ossi
ngs
have
impr
oved
pede
stria
n lin
kage
s be
twee
n th
e st
atio
n an
d to
wn
cent
re. N
ew tr
ee p
lant
ing
and
use
ofqu
alit
y su
rfac
e m
ater
ials
hav
ecr
eate
d a
plea
sant
pede
stria
n en
viro
nmen
tan
d im
prov
edpa
ssen
ger e
xper
ienc
e.
Stra
tegy
Bro
adly
Impl
emen
ted
as P
lann
ed
•Co
ntin
ued
reve
nue
supp
ort
for t
he B
risto
l to
Seve
rn B
each
line
to m
aint
ain
an h
ourly
freq
uenc
y th
roug
hout
the
day,
am
ount
ing
to £
133,
000
per y
ear p
lus
£51,
000
on s
uppo
rtin
gco
nnec
ting
bus
es fr
om A
vonm
outh
to S
ever
n Be
ach
in th
e of
f pea
k.
Dur
ing
the
LTP,
par
king
cha
rges
wer
ein
trod
uced
at
cert
ain
railw
ay s
tati
ons
inth
e ar
ea, w
hich
was
at
odds
wit
h ou
rob
ject
ive
to in
crea
se th
e us
e of
this
mod
e
Tabl
e 5.
1 –
Impl
emen
tati
on o
f Pub
lic T
rans
port
Stra
tegy
(Pro
form
a B)
3. R
ail S
trat
egy

62
Del
iver
y Be
nchm
ark
(wha
tw
e pl
anne
d to
do)
Wha
tha
s be
en d
one
Expl
anat
ions
for c
hang
es to
wha
tw
as p
lann
ed
•£8
5,00
0 pe
r ann
um fi
nanc
ial s
uppo
rtfo
r add
itio
nal p
eak
hour
ser
vice
s to
Filt
on A
bbey
Woo
dst
atio
n. T
his
prov
ides
a v
alua
ble
serv
ice
for s
taff
at
the
adja
cent
Min
istr
y of
Def
ence
head
quar
ters
com
plex
and
oth
er la
rge
com
pani
es in
the
Nor
th F
ringe
.
•Ti
met
able
s an
d pr
omot
iona
l lit
erat
ure
prod
uced
in p
artn
ersh
ip w
ith
Wes
sex
Trai
ns to
pro
mot
eth
e Br
isto
l to
Seve
rn B
each
line
incl
udin
g ne
w d
isti
ncti
ve lo
go o
n al
l sta
tion
s.
•Lo
cal r
ail u
se s
tudi
es to
info
rm fu
ture
inve
stm
ent
prio
ritie
s an
d th
e fe
asib
ility
of R
ail P
asse
nger
Part
ners
hip
bids
und
erta
ken
on th
e Ya
te to
Wes
ton
line,
and
the
Bris
tol t
o Se
vern
Bea
ch li
ne.
•Fo
llow
ing
repr
esen
tati
ons
mad
e to
Wes
sex
Trai
ns a
nd th
e th
en S
trat
egic
Rai
l Aut
horit
y (S
RA)
trai
ns s
topp
ing
atPa
rson
s St
reet
stat
ion
have
dou
bled
and
pas
seng
ers
treb
led.
•So
uth
Glo
uces
ters
hire
Cou
ncil
wor
ked
wit
h N
etw
ork
Rail
to s
ecur
e m
ajor
impr
ovem
ents
at
Filt
on A
bbey
Woo
d st
atio
n in
clud
ing
exte
nded
car
par
king
wit
h CC
TV, a
n ad
diti
onal
pla
tfor
mto
cat
er fo
r gro
win
g pa
ssen
ger n
umbe
rs a
nd n
ew in
form
atio
n sy
stem
s.
•O
ngoi
ng p
rogr
amm
e of
impr
ovem
ents
to lo
cal s
tati
ons
in p
artn
ersh
ip w
ith
Wes
sex
Trai
ns,
cove
ring
11 lo
cal s
tati
ons
in B
risto
l dur
ing
the
first
LTP
perio
d. W
orks
hav
e in
clud
ed n
eww
aiti
ng s
helt
ers,
stai
rway
impr
ovem
ents
, sea
ting
, sig
nage
, rep
aint
ing
and
inno
vati
ve u
se o
fm
ural
s in
par
tner
ship
wit
h lo
cal g
roup
s to
com
bat
graf
fiti a
nd v
anda
lism
.
•Si
gnag
ere
new
al a
tal
l loc
al s
tati
ons
in B
risto
l.
•Co
ntin
ued
liais
on b
etw
een
loca
l cou
ncils
and
trai
n op
erat
ing
com
pani
es, t
he S
RA a
ndG
over
nmen
tin
rela
tion
to fr
eque
ncy
and
tim
etab
ling
of lo
cal a
nd re
gion
al s
ervi
ces,
nat
iona
lan
d tr
ain
com
pany
polic
y m
atte
rs a
nd a
s ac
tive
con
trib
utor
s to
the
new
loca
l rai
l fra
nchi
seco
nsul
tati
ons.
•Se
vern
side
Rai
l Par
tner
ship
, of w
hich
we
are
all m
embe
rs, p
rom
otio
ns in
clud
e Tr
easu
re T
rain
,Sa
nta
Expr
ess,
Day
Trip
s fr
om S
outh
Glo
uces
ters
hire
sen
tto
eve
ry p
rimar
y sc
hool
chi
ld, b
ustr
ain
conn
ecti
ons
to B
erke
ley
Cast
le Jo
ust.
•W
ear
eal
so p
artn
ers
in th
e H
eart
of W
esse
x Ra
il Pa
rtne
rshi
p. I
tha
s lo
bbie
d to
pro
duce
an
hour
ly M
onda
yto
Sat
urda
y da
ytim
e he
adw
ay o
n th
e Ba
th –
Old
field
Par
k –
Keyn
sham
– B
risto
lTe
mpl
e M
eads
rail
serv
ice.
and
enco
urag
e ac
cess
. Th
is im
pact
ed o
nlo
cal r
esid
ents
as
driv
ers
park
ed in
adja
cent
area
s to
avo
id th
e ch
arge
s. I
nN
orth
Som
erse
tth
is w
as p
artl
y re
solv
edjo
intl
y w
ith
the
Seve
rnsi
de C
omm
unit
yRa
il Pa
rtne
rshi
p an
d le
d to
aco
mm
itm
ent
by th
e Tr
ain
Ope
rati
ngCo
mpa
ny (T
OC)
to k
eep
the
char
ges
unde
r rev
iew
. At
Keyn
sham
Sta
tion
, the
char
ges
intr
oduc
ed w
ere
high
er th
anth
ose
in lo
cal c
ounc
il ca
r par
ks a
ndre
sult
ed in
a d
ispl
acem
ent
of p
arki
ng to
othe
r sit
es.
Follo
win
g di
scus
sion
s w
ith
the
TOCs
, the
cha
rges
wer
e re
duce
d.
Plan
s to
enc
oura
ge th
e ru
nnin
g of
long
ertr
ains
to a
ddre
ss d
eman
d/ov
ercr
owdi
ngha
ve h
ad li
mit
ed s
ucce
ss.
Redo
ublin
g of
the
line
betw
een
Wes
ton-
supe
r-M
are
and
Wor
le h
as n
otta
ken
plac
e. N
etw
ork
Rail
are
plan
ning
toun
dert
ake
wor
ks in
sta
ges
that
will
see
part
of th
is w
ork
star
ted
in 2
008.
Port
ishe
ad to
Bris
tol p
asse
nger
line
will
not
be re
open
ed to
pas
seng
ers
in th
efo
rese
eabl
e fu
ture
.
Tabl
e 5.
1 –
Impl
emen
tati
on o
f Pub
lic T
rans
port
Stra
tegy
(Pro
form
a B)

63
Joint Delivery Report
Del
iver
y Be
nchm
ark
(wha
tw
e pl
anne
d to
do)
Wha
tha
s be
en d
one
Expl
anat
ions
for c
hang
es to
wha
tw
as p
lann
ed
a)Su
bsta
ntia
lin
nova
tive
use
of
taxi
s a
s pa
rtof
the
wid
er tr
ansp
ort
syst
em a
ndsu
bsta
ntia
lin
tegr
atio
n of
polic
ies
for t
axis
into
othe
r tra
nspo
rtpo
licie
s
•W
ork
was
car
ried
out
by N
etw
ork
Rail
atFr
eshf
ord
Stat
ion
(par
tfu
nded
by
Bath
& N
orth
Eas
tSo
mer
set
Coun
cil a
nd th
e H
eart
of W
esse
x Ra
il Pa
rtne
rshi
p) a
djus
ted
heig
htof
eas
tbou
ndpl
atfo
rm, i
mpr
ovin
g ac
cess
to tr
ains
, pro
vide
new
pas
seng
er s
helt
er, i
mpr
ove
light
ing,
info
rmat
ion
and
sign
age.
Stra
tegy
Bro
adly
Impl
emen
ted
as P
lann
ed
Taxi
s an
d Pr
ivat
e H
ire V
ehic
les
(PH
Vs) h
ave
cont
inue
d to
be
seen
as
an in
tegr
al p
art
of th
e pu
blic
tran
spor
tne
twor
k, c
ompl
emen
ting
oth
er fo
rms
of p
ublic
tran
spor
t, an
d pl
ayin
g a
key
soci
alin
clus
ion
role
.
Bris
tol:
Taxi
s an
d PH
Vs b
enef
itfr
om b
eing
per
mit
ted
to u
se b
us p
riorit
y fa
cilit
ies.
The
pos
itiv
eim
pact
incr
ease
d du
ring
the
first
LTP
perio
d as
bus
prio
rity
faci
litie
s ha
ve b
een
expa
nded
, for
exam
ple
the
A38
Show
case
Bus
Cor
ridor
.
Addi
tion
al ta
xi p
arki
ng p
rovi
sion
and
enh
ance
d w
aiti
ng fa
cilit
ies
in B
risto
l cit
y ce
ntre
wer
ein
clud
ed a
s pa
rtof
the
Bris
tol C
entr
e pr
ojec
t.
An ‘u
nmet
dem
and’
surv
eyw
asun
dert
aken
whi
ch le
d to
a c
ompl
ete
revi
ew o
f ran
k pr
ovis
ion
inBr
isto
l in
cons
ulta
tion
wit
h tr
ade
orga
nisa
tion
s, p
olic
e an
d di
sabi
lity
grou
ps.
This
resu
lted
inm
ore
than
50%
of e
xist
ing
rank
s be
ing
refu
rbis
hed,
3 n
ew ra
nks
impl
emen
ted
in th
e Cl
ifton
are
a,an
d op
erat
ing
hour
s ex
tend
ed o
n a
furt
her 2
rank
s. 4
new
exp
erim
enta
l tax
i hai
ling
poin
tsin
trod
uced
in th
e ci
ty c
entr
e.
Bath
: The
num
ber o
f lic
ence
s fo
r bot
h H
ackn
eys
and
PHV’
s, in
clud
ing
a ho
rse
draw
n ta
xi in
Bat
h,ha
s gr
own
by 1
6% in
the
last
five
year
s. A
Tax
i str
ateg
y w
as a
dopt
ed in
200
5 to
mee
t13
key
obje
ctiv
es b
y 20
11.
Prog
ress
tow
ards
thes
e ke
y ob
ject
ives
is a
s fo
llow
s:
•Li
aiso
n m
eeti
ngs
inst
igat
ed a
nd o
ccur
twic
e ye
arly
.
•Pr
omot
ion
of in
-veh
icle
saf
ety.
•Co
mpl
etio
n of
an
unm
etde
man
d st
udy.
•Fe
brua
ry 2
006
mod
ifica
tion
to te
rms
and
cond
itio
ns o
f ope
rati
on to
allo
w C
CTV
in c
abs
topr
omot
e dr
iver
and
pas
seng
er s
ecur
ity.
Tabl
e 5.
1 –
Impl
emen
tati
on o
f Pub
lic T
rans
port
Stra
tegy
(Pro
form
a B)
4. T
axi S
trat
egy

64
Del
iver
y Be
nchm
ark
(wha
tw
e pl
anne
d to
do)
Wha
tha
s be
en d
one
Expl
anat
ions
for c
hang
es to
wha
tw
as p
lann
ed
a)Ev
iden
ce o
f str
ong
and
sust
aine
dpa
rtne
rshi
ps a
ndco
mm
itm
ent
topr
omot
e an
dim
prov
e pu
blic
tran
spor
tin
form
atio
n
•Re
view
of d
isab
ility
issu
es is
und
erw
ay to
bet
ter i
nfor
m a
cces
sibi
lity.
•Re
view
of d
river
trai
ning
in re
lati
on to
the
Dis
abili
ty D
iscr
imin
atio
n Ac
t(D
DA)
.
•As
par
tof
com
mun
ity
safe
ty in
itia
tive
s ta
xi ra
nk lo
cati
ons
wer
e re
view
ed a
nd a
lter
ed to
impr
ove
pers
onal
sec
urit
y.
Taxi
Sha
ring:
A n
ew ta
xi-s
harin
g se
rvic
e ha
s be
en in
trod
uced
for r
esid
ents
of B
arto
n H
ill, S
tPh
illip
s an
d St
Anne
s, a
reas
of B
risto
l wit
h re
lati
vely
low
leve
ls o
f car
ow
ners
hip
and
not
wel
lse
rved
by
conv
enti
onal
pub
lic tr
ansp
ort.
This
taxi
-sha
ring
sche
me
is ru
n on
beh
alf o
f the
cou
ncil
by a
loca
l ope
rato
r, w
ho h
andl
es b
ooki
ngs
and
mat
ches
resi
dent
s’tr
ip re
ques
ts to
ena
ble
peop
leto
sha
re th
eir j
ourn
eys.
Thi
s ke
eps
trav
el c
osts
to o
nly
50p
per p
erso
n, a
nd e
nabl
es re
side
nts
toac
cess
key
loca
l ser
vice
s in
clud
ing
heal
th c
entr
es, e
duca
tion
, lei
sure
and
pla
ces
of w
ork
ata
low
cost
. A s
econ
d ‘F
are
Car’,
sha
red
taxi
sch
eme,
was
intr
oduc
ed in
the
rura
l are
a to
the
nort
h of
Bath
incl
udin
g La
mbr
idge
and
Nor
then
d.
Stra
tegy
Bro
adly
Impl
emen
ted
as P
lann
ed
We
have
all a
dopt
ed P
ublic
Tra
nspo
rtIn
form
atio
n St
rate
gies
that
shap
e th
e w
ay in
whi
chpr
omot
ion
of p
ublic
tran
spor
tin
form
atio
n is
app
roac
hed.
•W
eha
vepl
ayed
an
acti
ve ro
le in
the
esta
blis
hmen
tan
d on
goin
g op
erat
ion
of th
e So
uth
Wes
tTr
avel
ine
publ
ic tr
ansp
ort
tele
phon
e en
quiry
ser
vice
sin
ce 2
000.
•N
ew s
tyle
bus
sto
p ti
met
able
dis
play
sta
ilore
d to
indi
vidu
al s
tops
, in
full
colo
ur, u
tilis
ing
the
Trav
elin
e da
taba
se h
ave
been
ado
pted
in s
ome
area
s w
ith
this
bei
ng ro
lled
out
acro
ss o
ur a
rea
as B
est
Prac
tice
.
•Pu
blic
tran
spor
tm
aps
are
prod
uced
ann
ually
, som
e in
Par
tner
ship
wit
h Fi
rst.
In s
ome
area
sth
ese
map
s ha
vebe
en d
eliv
ered
doo
r-to
-doo
r.
•N
ew ti
met
able
leaf
lets
cov
erin
g al
l our
sup
port
ed s
ervi
ces.
•N
ew e
asy
to u
se ti
met
able
leaf
lets
and
info
rmat
ion
boar
ds p
rodu
ced
in p
artn
ersh
ip w
ith
Wes
sex
Trai
ns.
•Te
mpl
e M
eads
to S
ever
n Be
ach
rail
line
info
rmat
ion
and
prom
otio
n.
•Al
l con
cess
iona
rypa
ss h
olde
rs in
Nor
th S
omer
set
rece
ive
tim
etab
le in
form
atio
n w
ith
thei
rpa
sses
.
Sout
h G
louc
este
rshi
reCo
unci
l hav
eem
ploy
ed a
full
tim
e Tr
ansp
ort
Prom
otio
ns O
ffic
er to
spe
arhe
adin
crea
sed
bus
use
and
high
qua
lity
easy
to u
se in
form
atio
n.
Tabl
e 5.
1 –
Impl
emen
tati
on o
f Pub
lic T
rans
port
Stra
tegy
(Pro
form
a B)
5. P
ublic
Tra
nspo
rtIn
form
atio
n St
rate
gy

65
Joint Delivery Report
Del
iver
y Be
nchm
ark
(wha
tw
e pl
anne
d to
do)
Wha
tha
s be
en d
one
Expl
anat
ions
for c
hang
es to
wha
tw
as p
lann
ed
b)D
eliv
ery
of lo
cal
outc
ome
indi
cato
rsfo
r pub
lic tr
ansp
ort
info
rmat
ion
c)St
rong
or i
mpr
oved
perf
orm
ance
as
mon
itor
ed b
y BV
PI10
3
Stra
tegy
Bro
adly
Impl
emen
ted
as P
lann
ed
•So
uth
Glo
uces
ters
hire
hav
e in
crea
sed
the
avai
labi
lity
of ti
met
able
/rou
te in
form
atio
n at
bus
stop
s fr
om 2
5% to
60%
.
•Ra
il in
form
atio
n sa
tisf
acti
on h
as in
crea
sed
by 4
8.4%
ove
r 5 y
ears
in B
ath
and
Nor
th E
ast
Som
erse
t.
Stra
tegy
Bro
adly
Impl
emen
ted
as P
lann
ed
Bath
and
Nor
th E
ast
Som
erse
tha
ve s
een
an in
crea
se fr
om 3
0% to
49%
sat
isfa
ctio
n w
ith
bus
info
rmat
ion
from
200
3 to
200
5.
The
mos
tre
cent
surv
eys
in B
risto
l, N
orth
Som
erse
tan
d So
uth
Glo
uces
ters
hire
took
pla
ce in
2003
/04
whe
n 52
%, 6
1% a
nd 5
2% re
spec
tive
ly o
f peo
ple
wer
e sa
tisf
ied
wit
h pu
blic
tran
spor
tin
form
atio
n. T
he n
ext
surv
ey is
due
in 2
006/
07 b
y w
hich
tim
e w
e ar
e co
nfid
ent
sati
sfac
tion
will
have
incr
ease
d.
Tabl
e 5.
1 –
Impl
emen
tati
on o
f Pub
lic T
rans
port
Stra
tegy
(Pro
form
a B)

66
Del
iver
y Be
nchm
ark
(wha
tw
e pl
anne
d to
do)
Wha
tha
s be
en d
one
Expl
anat
ions
for c
hang
es to
wha
tw
as p
lann
ed
1.Im
plem
ent
a fi
veye
ar p
rogr
amm
e of
loca
l saf
ety
sche
mes
Stra
tegy
Bro
adly
Impl
emen
ted
as P
lann
ed
The
auth
orit
ies
have
del
iver
ed 2
72lo
cal s
afet
y sc
hem
es a
nd 1
94sa
fer r
oute
s to
sch
ools
sch
emes
.At
a co
stof
£15
.3m
.
The
LTP1
per
iod
has
also
see
n th
e de
liver
y of
222
cros
sing
s at
a co
stof
£1.
6m.
Ato
tal o
f £10
.7m
has
been
spe
ntto
del
iver
313
traf
fic c
alm
ing
sche
mes
incl
udin
g:
•7
hom
e zo
nes.
•1
quie
tla
ne.
•67
urb
an 2
0mph
zon
es.
•17
rura
l 20
mph
zon
es.
•13
3 ot
her u
rban
sch
emes
.
•84
oth
er ru
ral s
chem
es.
Des
ign
chan
ges
follo
win
g lo
cal
cons
ulta
tion
hav
e of
ten
led
to a
nnua
lva
rianc
es in
pro
gram
min
g an
d co
sts.
Addi
tion
al m
oney
allo
cate
d to
road
safe
ty h
as e
nabl
ed th
e pr
ogra
mm
e to
be
broa
dly
deliv
ered
as
plan
ned.
Tabl
e 5.
2 –
Impl
emen
tati
on o
f Roa
d Sa
fety
Str
ateg
y (P
rofo
rma
B)
Year
No.
of
Tota
l Cos
tN
o of
Acc
iden
ts
No
ofSc
hem
es(£
)3
Year
s Be
fore
Acc
iden
ts
save
d
2001
/02
2994
977
41
2002
/03
631,
376
150
75
2003
/04
4573
492
41
2004
/05
701,
465
131
41*
2005
/06
581,
472
9739
*
*=fo
reca
stfig
ures
Not
e:Th
is ta
ble
does
not
incl
ude
data
for B
ath
and
Nor
th E
ast
Som
erse
tCo
unci
l as
they
do
not
colle
ctco
mpa
rabl
e da
ta. I
nclu
des
som
e sc
hem
es fu
nded
from
oth
er LT
P bu
dget
s

67
Joint Delivery Report
Del
iver
y Be
nchm
ark
(wha
tw
e pl
anne
d to
do)
Wha
tha
s be
en d
one
Expl
anat
ions
for c
hang
es to
wha
tw
as p
lann
ed
2.Re
duce
acc
iden
tsth
roug
h a
five
yea
rpr
ogra
mm
e of
road
safe
ty e
ngin
eeri
ngm
easu
re.
Stra
tegy
Bro
adly
Impl
emen
ted
as P
lann
ed
Dur
ing
the
LTP
perio
d w
e ha
ve ta
rget
ed s
igni
fican
tre
sour
ces
atro
ad s
afet
y is
sues
, rec
ogni
sing
thei
r sig
nific
ance
. Ove
r the
5 y
ears
a to
tal o
f £35
mill
ion
has
been
spe
nton
road
saf
ety
deliv
erin
ga
wid
e ra
nge
of s
chem
es. R
oad
safe
ty is
a k
ey fe
atur
e in
all
of th
e 27
7tr
affic
man
agem
ent
init
iati
ves
impl
emen
ted
that
have
als
o he
lped
to ta
ckle
con
gest
ion
and
impr
ove
traf
ficm
ovem
ents
.
Mea
sure
s su
ch a
s 67
urba
n an
d 17
rura
l 20m
ph z
ones
, 60
puff
in a
nd to
ucan
s, 5
0ot
her s
igna
lised
cros
sing
s, a
nd 1
09ze
bra
and
othe
r uns
igna
lled
cont
rolle
d ju
ncti
ons,
new
cyc
le tr
acks
and
lane
sha
ve a
ll he
lped
to ta
ckle
acc
iden
tfig
ures
for c
yclis
ts a
nd p
edes
tria
ns.
194
safe
r rou
tes
to s
choo
l sch
emes
hav
e be
en im
plem
ente
d. S
choo
l Tra
vel P
lans
are
use
d to
iden
tify
and
prio
ritis
e sc
hem
es to
enc
oura
ge c
yclin
g an
d w
alki
ng.
272
loca
l saf
ety
sche
mes
hav
e be
en d
eliv
ered
alo
ngsi
de 3
12tr
affic
cal
min
g sc
hem
es in
clud
ing
7ho
me
zone
s an
d 1
quie
tla
ne a
cros
s th
e G
reat
er B
risto
l are
a.
Ove
r 160
acci
dent
clus
ter s
ites
hav
e be
en tr
eate
d th
roug
h hi
gh-f
ricti
on s
urfa
cing
sch
emes
prio
ritis
ed o
n th
e nu
mbe
r and
type
of a
ccid
ents
that
have
take
n pl
ace.
Tem
pora
ry s
igns
ere
cted
at
mot
orcy
cle
acci
dent
conc
entr
atio
n si
tes
in S
outh
Glo
uces
ters
hire
as
part
of a
new
init
iati
ve a
skin
g dr
iver
s to
wat
ch o
utfo
r mot
orcy
cles
hav
e re
duce
d th
e nu
mbe
r of
acci
dent
s by
44%
.In
a re
side
nts
surv
ey51
%sa
id th
e si
gns
had
mad
e th
em m
ore
awar
eof
mot
orcy
clis
ts.
The
colo
urfu
l SM
IDSY
(Sor
ry M
ate
I Did
n’t
See
You)
web
site
ww
w.s
mid
sy.c
o.uk
has
also
hel
ped
to ra
ise
mot
orcy
le a
war
enes
s am
ongs
tca
r driv
ers
back
ed u
p w
ith
road
side
sig
ns.
Sout
h G
louc
este
rshi
re n
ow h
ave
an A
ssis
tant
Road
Saf
ety
Off
icer
wit
h re
spon
sibl
itly
for
mot
orcy
clin
g.
Bris
tol C
ity
took
par
tin
a tr
ial t
o as
sess
the
impa
cts
of p
ower
ed tw
ow
heel
ers
usin
g bu
s la
nes.
This
is b
eing
con
side
red
thro
ugh
the
JLTP
for i
ntro
duct
ion
acro
ss o
ur a
rea.
Vehi
cle
acti
vate
d si
gns
have
pla
yed
an im
port
ant
part
in im
plem
enti
ng o
ur s
peed
man
agem
ent
stra
tegi
es.
Ther
e ar
e no
w 1
09 p
erm
anen
tsi
tes
(exc
ludi
ng B
risto
l). M
onit
orin
g ha
s sh
own
that
atso
me
site
s th
e nu
mbe
r of v
ehic
les
trav
ellin
g ab
ove
the
spee
d lim
itha
s re
duce
d by
21%
(wit
hav
erag
e sp
eeds
dow
n by
4m
ph.
Del
iver
y ha
s be
en in
acc
orda
nce
wit
h th
eLT
P an
d ha
s in
corp
orat
ed e
mer
ging
bes
tpr
acti
ce.
Tigh
ter c
oord
inat
ion
has
allo
wed
mor
e pr
ogre
ss to
be
mad
e in
this
area
as
safe
ty m
easu
res
have
bee
nin
corp
orat
ed in
to o
ther
traf
ficm
anag
emen
tsc
hem
es a
s st
anda
rd a
ndec
onom
ies
of s
cale
s ha
ve b
een
real
ised
.
Nor
th S
omer
set
have
use
d a
digi
tal
map
ping
bas
e to
reco
rd a
ccid
ent
loca
tion
s. T
his
allo
ws
easy
iden
tific
atio
nof
acc
iden
tho
tspo
ts a
nd d
etai
ls o
f the
acci
dent
s th
atha
ve o
ccur
red.
Thi
s ha
spr
oved
inva
luab
le in
the
prio
ritis
atio
n of
sche
mes
and
the
allo
cati
on o
f res
ourc
es.
This
has
bee
n de
velo
ped
to in
clud
ede
tails
of p
ropo
sed
wor
kssu
ch a
sm
aint
enan
ce, S
choo
l Tra
vel P
lans
and
bus
infr
astr
uctu
re to
ena
ble
sche
mes
to b
eco
mbi
ned
enab
ling
best
valu
e to
be
achi
eved
wit
h LT
P an
d re
venu
e fu
ndin
g.
Dev
elop
er fu
ndin
g of
£2m
del
iver
edex
tens
ive
traf
fic c
alm
ing
and
traf
ficm
anag
emen
tm
easu
res
in B
radl
ey S
toke
.
Bris
tol C
ity
and
Sout
h G
louc
este
rshi
reha
ve a
lloca
ted
extr
a re
sour
ces
over
wha
tw
as o
rigin
ally
pla
nned
to ro
ad s
afet
y.Br
isto
l has
sho
wn
furt
her c
omm
itm
ent
to th
is a
rea
by s
tret
chin
g ro
ad s
afet
yta
rget
s in
a P
ublic
Ser
vice
Agr
eem
ent
(PSA
) wit
h G
over
nmen
t.
Tabl
e 5.
2 –
Impl
emen
tati
on o
f Roa
d Sa
fety
Str
ateg
y (P
rofo
rma
B)

68
Del
iver
y Be
nchm
ark
(wha
tw
e pl
anne
d to
do)
Wha
tha
s be
en d
one
Expl
anat
ions
for c
hang
es to
wha
tw
as p
lann
ed
3.Ed
ucat
ion,
Tra
inin
gan
d Pu
blic
ity
mea
sure
s de
velo
ped
and
impl
emen
ted
Stra
tegy
Impl
emen
tati
on h
as E
xcee
ded
Expe
ctat
ions
The
focu
s of
Edu
cati
on, T
rain
ing
and
Publ
icit
y (E
TP) m
easu
res
has
been
tow
ards
vul
nera
ble
road
user
s es
peci
ally
chi
ldre
n, c
yclis
ts a
nd m
otor
cycl
ists
.
Exam
ples
of o
ur d
eliv
ery
are:
•Pr
e-sc
hool
gro
ups
and
scho
ols,
e.g
. Be
Safe
and
Be
Seen
; sch
ool g
ate
park
ing
cam
paig
ns.
•D
edic
ated
Sch
ool T
rave
l Pla
n of
ficer
s ha
ve b
een
appo
inte
d w
orki
ng w
ith
scho
ols
in d
evel
opin
gth
eir t
rave
l pla
ns. I
niti
ativ
es s
uch
as w
alki
ng b
uses
and
wal
k to
sch
ool e
vent
s ha
ve ta
ken
plac
eac
ross
the
area
. The
‘Wal
k on
Wed
nesd
ay’a
nd ‘G
oing
for G
old’
wal
k to
sch
ool p
roje
cts
have
also
gai
ned
nati
onal
reco
gnit
ion
whi
lst
a pr
e-sc
hool
reso
urce
box
was
laun
ched
to g
reat
popu
lar a
ccla
im a
nd u
se.
•Th
e ‘W
alk
on W
edne
sday
’(W
oW) w
alk
to s
choo
l eve
ntor
gani
sed
in p
artn
ersh
ip b
etw
een
Bris
tol a
nd N
orth
Som
erse
tw
as a
hug
e su
cces
s w
ith
over
7,0
00 p
upils
and
thei
r fam
ilies
taki
ng p
art,
tota
lling
14,
000
peop
le o
vera
ll. T
he e
vent
cam
e ve
ry c
lose
to b
reak
ing
the
Gui
nnes
s W
orld
Rec
ord
for t
he n
umbe
r of p
eopl
e w
alki
ng to
sch
ool.
•M
otor
cycl
e aw
aren
ess
cam
paig
ns h
ave
redu
ced
acci
dent
s in
volv
ing
mot
orcy
cles
at
key
site
s in
Sout
h G
louc
este
rshi
re b
y 44
%. T
his
cam
paig
n w
as d
escr
ibed
as
an ‘e
nlig
hten
ed a
ppro
ach’
byM
otor
cycl
e N
ews.
Nor
th S
omer
set
Coun
cil t
ake
part
in B
ikes
afe
and
Ride
to A
rriv
e ca
mpa
igns
.
•Cy
cle
trai
ning
in s
choo
ls: n
early
4,0
00 p
upils
rece
ive
trai
ning
to N
atio
nal C
ycle
Tra
inin
gSt
anda
rds
acro
ss th
e ar
ea.
•3
Scho
ols
in S
outh
Glo
uces
ters
hire
hav
e ta
ken
part
in S
ustr
ans
nati
onw
ide
‘Bik
e It
’pro
ject
tohe
lp s
choo
ls a
chie
ve la
rge
num
bers
of p
upils
cyc
ling.
•Bo
th N
orth
Som
erse
tCo
unci
l and
Bris
tol C
ity
Coun
cil w
ere
succ
essf
ul in
bid
s fo
r the
‘Ker
bcra
ft’
child
ped
estr
ian
trai
ning
sch
eme
and
wer
eaw
arde
d £1
65,2
65.
Child
ren
as y
oung
as
5 ye
ars
old
wer
e ta
ught
atth
e ro
adsi
de in
sm
all g
roup
s, tr
aine
d by
adu
ltvo
lunt
eers
. Th
e fir
sttr
anch
eof
the
sche
me
enab
led
trai
ning
to b
e un
dert
aken
in 1
4 sc
hool
s in
Bris
tol,
wit
h pr
iorit
y be
ing
give
nto
chi
ldre
n in
mor
e de
priv
ed a
reas
and
thos
e w
ith
high
er a
ccid
ent
rate
s. T
ranc
he 2
enab
led
9 sc
hool
s in
Nor
th S
omer
set
to p
rovi
de tr
aini
ng fo
r 300
chi
ldre
n pe
r ann
um. T
his
also
fund
ed th
e em
ploy
men
tof
a C
hild
Ped
estr
ian
Trai
ning
Co-
ordi
nato
r. O
vera
ll th
e ch
ildpe
dest
rian
casu
alti
es in
war
ds w
here
Ker
bcra
fttr
aini
ng h
as ta
ken
plac
e ha
s re
duce
d.
Del
iver
y ha
s be
en in
acc
orda
nce
wit
hem
ergi
ng b
est
prac
tice
leav
ing
orig
inal
LTPs
slig
htly
out
date
d. In
latt
er y
ears
deliv
ery
has
been
in a
ccor
danc
e w
ith
our
Road
Saf
ety
Acti
on P
lans
.
Bris
tol C
ity
Coun
cil i
ncre
ased
reve
nue
reso
urce
s al
loca
ted
for t
his
over
the
plan
perio
d to
sup
port
thes
e in
itia
tive
s.
Tabl
e 5.
2 –
Impl
emen
tati
on o
f Roa
d Sa
fety
Str
ateg
y (P
rofo
rma
B)

69
Joint Delivery Report
Del
iver
y Be
nchm
ark
(wha
tw
e pl
anne
d to
do)
Wha
tha
s be
en d
one
Expl
anat
ions
for c
hang
es to
wha
tw
as p
lann
ed
4.Pr
ogre
ss o
n lo
cal
road
cas
ualt
yre
duct
ion
targ
ets
•A
Yello
w S
choo
l Bus
Pro
ject
has
been
init
iate
d, in
par
tner
ship
wit
h th
e bu
s op
erat
or, s
ervi
ngH
enbu
ry S
choo
l in
Bris
tol.
Pass
enge
r Jou
rney
s ha
ve in
crea
sed
by 5
0% p
er y
ear a
nd h
ave
brou
ght
wit
h it
safe
ty b
enef
its
and
have
incr
ease
d at
tend
ance
leve
ls.
Som
e El
emen
ts o
f Str
ateg
y no
tD
eliv
ered
Child
Kill
ed a
nd S
erio
usly
Inju
red
Targ
et
LTP
has
seen
a re
duct
ion
in th
e nu
mbe
r of c
hild
KSI
s ac
ross
the
Gre
ater
Bris
tol a
rea.
The
num
ber
ofki
lled
or s
erio
usly
inju
red
child
ren
fluct
uate
s be
caus
e of
the
rela
tive
ly lo
w n
umbe
rs b
utde
spit
e th
is o
ur a
rea
as a
who
le is
on
trac
k to
mee
tou
r ove
rall
targ
et.
Tota
l Kill
ed a
nd S
erio
usly
Inju
red
(KSI
) Tar
gets
In th
e la
stfiv
e ye
ars
the
num
ber o
f peo
ple
kille
d or
ser
ious
ly in
jure
d ha
s de
crea
sed
by 7
%. T
hefig
ure
of 4
30fo
r 200
5/06
was
sig
nific
antl
y do
wn
on th
e pr
evio
us y
ear a
nd w
e se
e th
is tr
end
cont
inui
ng. M
easu
red
agai
nst
the
1994
-98
base
line
both
Sou
th G
louc
este
rshi
re a
nd N
orth
Som
erse
tta
rget
s ar
e on
trac
k to
be
met
. Sou
th G
louc
este
rshi
re’s
2005
figu
re w
as th
e lo
wes
tsi
nce
1996
des
pite
traf
fic a
nd p
opul
atio
n gr
owth
at
abov
e na
tion
al a
vera
ge ra
tes.
Tar
gets
inBr
isto
l and
Bat
h an
d N
orth
Eas
tSo
mer
set
are
not
on tr
ack
but
we
belie
ve p
rogr
ess
is b
ette
r tha
nth
e fig
ures
sug
gest
as th
e 19
94-9
8 ba
selin
e is
up
to 4
0% u
nder
-rep
orte
d du
e to
cha
nges
in p
olic
ere
port
ing
met
hods
.
Slig
htIn
juri
es T
arge
ts
The
leve
l of s
light
inju
ry a
ccid
ents
rem
ains
a c
once
rn.
Whi
lst
the
tren
d ac
ross
our
are
a is
gene
rally
dow
nwar
d th
e ta
rget
for s
light
inju
ries
is s
till
off t
raje
ctor
y.
Vuln
erab
le U
sers
Sta
tist
ics.
Dur
ing
the
LTP
perio
d Br
isto
l Cit
y Co
unci
l set
a lo
cal t
arge
tfo
r Cyc
ling
KSIs
. Thi
s in
dica
tor h
asre
mai
ned
just
abov
eth
e ta
rget
leve
l thr
ough
out
the
plan
per
iod.
How
ever
whe
n co
mpa
red
toth
e 40
% in
crea
se in
cyc
ling
itis
app
aren
tth
atth
e ac
cide
ntra
te h
as re
duce
d co
nsid
erab
ly o
ver t
heLT
Ppe
riod.
In 2
004
Nor
th S
omer
set’s
reco
rds
show
a re
duct
ion
in c
yclin
g KS
Is o
f 25%
and
a re
duct
ion
of12
.5%
in p
edes
tria
n KS
Is.
We
expe
rienc
ed la
rge
incr
ease
s in
tota
lKS
I fig
ures
in 2
002
whe
n th
ere
was
ach
ange
in re
cord
ing
proc
edur
es u
sed
byth
e Po
lice.
Thi
s ca
used
an
incr
ease
into
tal K
SIs
of b
etw
een
30 a
nd 4
0% p
utti
ngus
wel
l off
trac
k to
mee
tth
ese
targ
ets.
Sinc
e th
is ti
me
we
have
focu
sed
reso
urce
s on
this
issu
e an
d ha
ve a
ll se
endo
wnw
ard
tren
ds in
the
num
bers
of t
otal
KSIs
.
Tabl
e 5.
2 –
Impl
emen
tati
on o
f Roa
d Sa
fety
Str
ateg
y (P
rofo
rma
B)

70
Del
iver
y Be
nchm
ark
(wha
tw
e pl
anne
d to
do)
Wha
tha
s be
en d
one
Expl
anat
ions
for c
hang
es to
wha
tw
as p
lann
ed
5.Co
ntri
buti
on o
fPa
rtne
rs to
del
iver
ySt
rate
gy B
road
ly Im
plem
ente
d as
Pla
nned
We
are
all p
art
of th
e Av
on a
nd S
omer
set
Safe
ty C
amer
a Pa
rtne
rshi
p w
hich
was
form
ed in
Apr
il20
02 b
y lo
cal a
utho
ritie
s, h
ealt
h au
thor
itie
s, p
olic
e, M
agis
trat
e’s
Cour
tSe
rvic
e, C
row
nPr
osec
utio
n Se
rvic
e an
d H
ighw
ays
Agen
cy.
The
Part
ners
hip
aim
s to
redu
ce d
eath
s an
d in
jurie
s on
road
s th
roug
h en
forc
emen
tof
spe
ed li
mit
s an
d ed
ucat
ion.
Itha
s se
en a
10%
redu
ctio
n in
road
acci
dent
s at
safe
ty c
amer
a si
tes
in th
e Br
isto
l are
a. D
urin
g th
e fir
stLT
P pe
riod,
wor
ks h
ave
been
unde
rtak
en w
ith
the
Part
ners
hip
to in
stal
l new
red
light
spee
d ca
mer
as a
nd re
plac
e m
ost
of th
eex
isti
ng c
amer
as in
Bris
tol w
ith
new
dig
ital
tech
nolo
gy.
Ther
e ar
e cu
rren
tly
95fix
ed ro
adsi
desa
fety
cam
eras
in G
reat
er B
risto
l, w
ith
mob
ile s
peed
det
ecti
on c
amer
as b
eing
use
d at
anot
her 9
5lo
cati
ons.
A to
tal o
f 14
red
light
cam
eras
hav
e al
so b
een
deliv
ered
in th
e la
st5
year
s.
We
have
wor
ked
clos
ely
wit
h lo
cal s
choo
ls to
intr
oduc
e 19
4sa
fer r
oute
s to
sch
ools
sch
emes
.
The
rela
tion
ship
bet
wee
n so
cial
dis
adva
ntag
e an
d ro
ad s
afet
y is
a k
ey is
sue
and
a nu
mbe
r of c
o-or
dina
ted
init
iati
ves
have
bee
n pr
ogre
ssed
. M
any
of th
e w
ards
wit
hin
the
20%
mos
tde
priv
edw
ards
in B
risto
l hav
e be
en ta
rget
ed in
reco
gnit
ion
of th
e di
spro
port
iona
te n
umbe
rs o
f roa
dac
cide
nts
rela
ted
to d
epriv
atio
n. B
risto
l has
bee
n su
cces
sful
in o
btai
ning
gra
nts
such
as
Obj
ecti
ve2,
SRB
6, U
RBAN
and
othe
r fun
ding
aim
ed a
tur
ban
rege
nera
tion
. We
have
bee
n w
orki
ng w
ith
anu
mbe
r of p
artn
ers
to b
ring
abou
tro
ad s
afet
y ou
tcom
es a
s pa
rtof
this
bro
ader
str
ateg
y of
soc
ial
incl
usio
n pr
ojec
ts.
Stra
tegi
c D
evel
opm
entT
eam
Roa
d Sa
fety
set
up u
nder
the
Dru
gs a
nd C
omm
unit
y Sa
fety
Part
ners
hip
– jo
int
wor
king
opp
ortu
niti
es w
ith
Polic
e, L
ivin
g St
reet
s, D
rivin
g Sc
hool
s an
d lo
cal
coun
cillo
rs. R
ecen
tre
crui
ts to
the
grou
p ha
ve in
clud
ed A
von
Fire
and
Res
cue,
Roa
d H
aula
geAs
soci
atio
n, A
von
and
Som
erse
tCo
nsta
bula
ry L
ocal
Act
ion
Team
Co-
ordi
nato
r, Av
on L
ocal
Coun
cils
Ass
ocia
tion
.
We
have
sup
port
ed th
e S
afet
y Zo
ne a
nd L
ifesk
ills
Inte
ract
ive
Educ
atio
n Ce
ntre
s. S
afet
y Zo
ne w
asor
igin
ally
set
up b
y th
e Ro
tary
Club
in W
esto
n-su
per-
Mar
e bu
tis
now
a li
mit
ed c
ompa
ny a
ndof
fers
a ra
nge
of s
afet
y ed
ucat
ion
for c
hild
ren
in K
eyst
age
1. R
oad
Safe
ty is
one
of t
he s
etpr
ovid
ers
– ot
her p
artn
ers
incl
ude
the
Polic
e, S
ains
bury
s, B
ritis
h Tr
ansp
ort
Polic
e, N
orth
Som
erse
tPr
imar
y Ca
re T
rust
, Avo
n Fi
re a
nd R
escu
e, C
o-op
and
Asd
a. A
ppro
xim
atel
y 65
% o
f all
Nor
thSo
mer
setY
ear 6
chi
ldre
n vi
sit
the
cent
re a
nnua
lly.
Road
Saf
ety
is a
key
com
pone
ntof
the
Hea
lthy
Sch
ool I
niti
ativ
e. T
he L
EA, S
choo
l Tra
vel A
dvis
ers
and
Road
Saf
ety
Off
icer
s w
ork
clos
ely
to h
elp
scho
ols
mee
tth
e co
mpo
nent
whi
lst
deve
lopi
ngth
eir s
choo
l tra
vel p
lan.
Stra
tegy
was
impl
emen
ted
as s
etou
tin
LTP
taki
ng in
to a
ccou
ntBe
stPr
acti
seex
ampl
es w
here
app
ropr
iate
.
Tabl
e 5.
2 –
Impl
emen
tati
on o
f Roa
d Sa
fety
Str
ateg
y (P
rofo
rma
B)
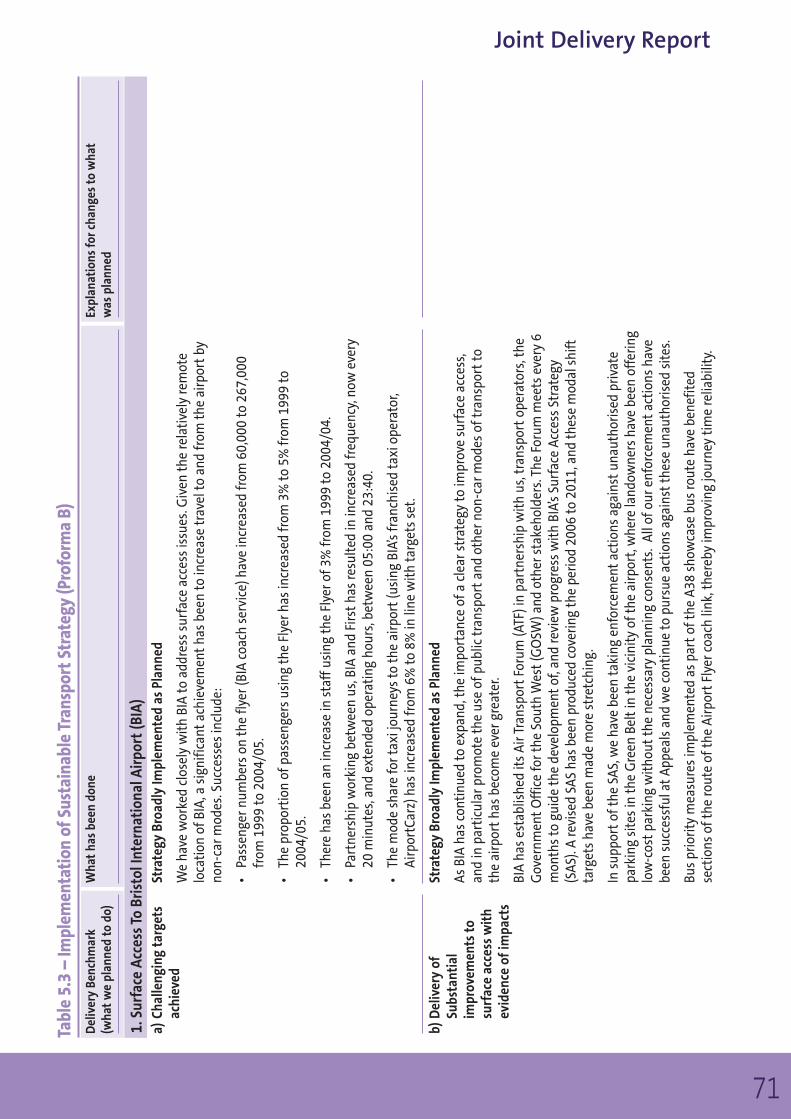
71
Joint Delivery Report
Del
iver
y Be
nchm
ark
(wha
tw
e pl
anne
d to
do)
Wha
tha
s be
en d
one
Expl
anat
ions
for c
hang
es to
wha
tw
as p
lann
ed
a)Ch
alle
ngin
g ta
rget
sac
hiev
ed
b)D
eliv
ery
ofSu
bsta
ntia
lim
prov
emen
ts to
surf
ace
acce
ss w
ith
evid
ence
ofim
pact
s
Stra
tegy
Bro
adly
Impl
emen
ted
as P
lann
ed
We
have
wor
ked
clos
ely
wit
h BI
A to
add
ress
sur
face
acc
ess
issu
es. G
iven
the
rela
tive
ly re
mot
elo
cati
on o
f BIA
, a s
igni
fican
tac
hiev
emen
tha
s be
en to
incr
ease
trav
el to
and
from
the
airp
ort
byno
n-ca
r mod
es. S
ucce
sses
incl
ude:
•Pa
ssen
ger n
umbe
rs o
n th
e fly
er (B
IA c
oach
ser
vice
) hav
e in
crea
sed
from
60,
000
to 2
67,0
00fr
om 1
999
to 2
004/
05.
•Th
e pr
opor
tion
of p
asse
nger
s us
ing
the
Flye
r has
incr
ease
d fr
om 3
% to
5%
from
199
9 to
2004
/05.
•Th
ere
has
been
an
incr
ease
in s
taff
usi
ng th
e Fl
yer o
f 3%
from
199
9 to
200
4/04
.
•Pa
rtne
rshi
p w
orki
ng b
etw
een
us, B
IA a
nd F
irst
has
resu
lted
in in
crea
sed
freq
uenc
y, n
ow e
very
20 m
inut
es,a
nd e
xten
ded
oper
atin
g ho
urs,
bet
wee
n 05
:00
and
23:4
0.
•Th
e m
ode
shar
e fo
r tax
i jou
rney
s to
the
airp
ort
(usi
ng B
IA’s
fran
chis
ed ta
xi o
pera
tor,
Airp
ortC
arz)
has
incr
ease
d fr
om 6
% to
8%
in li
ne w
ith
targ
ets
set.
Stra
tegy
Bro
adly
Impl
emen
ted
as P
lann
ed
As B
IA h
as c
onti
nued
to e
xpan
d, th
e im
port
ance
of a
cle
ar s
trat
egy
to im
prov
e su
rfac
e ac
cess
,an
d in
par
ticu
lar p
rom
ote
the
use
of p
ublic
tran
spor
tan
d ot
her n
on-c
ar m
odes
of t
rans
port
toth
e ai
rpor
tha
s be
com
e ev
er g
reat
er.
BIA
has
esta
blis
hed
its
Air T
rans
port
Foru
m (A
TF) i
n pa
rtne
rshi
p w
ith
us, t
rans
port
oper
ator
s, th
eG
over
nmen
tO
ffic
e fo
r the
Sou
th W
est
(GO
SW) a
nd o
ther
sta
keho
lder
s. T
he F
orum
mee
ts e
very
6m
onth
s to
gui
de th
e de
velo
pmen
tof
, and
revi
ew p
rogr
ess
wit
h BI
A’s
Surf
ace
Acce
ss S
trat
egy
(SAS
). A
revi
sed
SAS
has
been
pro
duce
d co
verin
g th
e pe
riod
2006
to 2
011,
and
thes
e m
odal
shi
ftta
rget
s ha
ve b
een
mad
e m
ore
stre
tchi
ng.
In s
uppo
rtof
the
SAS,
we
have
bee
n ta
king
enf
orce
men
tac
tion
s ag
ains
tun
auth
oris
ed p
rivat
epa
rkin
g si
tes
in th
e G
reen
Bel
tin
the
vici
nity
of t
he a
irpor
t, w
here
land
owne
rs h
ave
been
off
erin
glo
w-c
ost
park
ing
wit
hout
the
nece
ssar
y pl
anni
ng c
onse
nts.
All
of o
ur e
nfor
cem
ent
acti
ons
have
been
suc
cess
ful a
tAp
peal
s an
d w
e co
ntin
ue to
pur
sue
acti
ons
agai
nst
thes
e un
auth
oris
ed s
ites
.
Bus
prio
rity
mea
sure
s im
plem
ente
d as
par
tof
the
A38
show
case
bus
rout
e ha
ve b
enef
ited
sect
ions
of t
he ro
ute
of th
e Ai
rpor
tFl
yer c
oach
link
, the
reby
impr
ovin
g jo
urne
y ti
me
relia
bilit
y.
Tabl
e 5.
3 –
Impl
emen
tati
on o
f Sus
tain
able
Tra
nspo
rtSt
rate
gy (P
rofo
rma
B)
1. S
urfa
ce A
cces
s To
Bri
stol
Inte
rnat
iona
l Air
port
(BIA
)

72
Del
iver
y Be
nchm
ark
(wha
tw
e pl
anne
d to
do)
Wha
tha
s be
en d
one
Expl
anat
ions
for c
hang
es to
wha
tw
as p
lann
ed
a)Si
gnif
ican
tre
duct
ions
inco
ntri
buti
on o
f roa
dtr
ansp
ort
topo
lluti
on p
robl
ems
BIA
has
been
dev
elop
ing
a M
aste
r Pla
n to
out
line
its
prop
osal
s fo
r dev
elop
men
tan
d as
sess
the
pote
ntia
l im
pact
s of
furt
her e
xpan
sion
. W
e ha
ve b
een
wor
king
in c
lose
co-
oper
atio
n w
ith
the
airp
ort
in th
e de
velo
pmen
tof
this
Mas
ter P
lan
and
its
impl
icat
ions
for s
urfa
ce a
cces
s in
the
futu
re.
Stra
tegy
Impl
emen
ted
Broa
dly
as P
lann
ed
Ther
e ar
e tw
o Ai
r Qua
lity
Man
agem
ent
Area
s (A
QM
As) i
n ou
r are
a. T
hese
con
sist
of B
ath’
sLo
ndon
Roa
d co
rrid
or a
nd a
larg
e pa
rtof
the
Bris
tol u
rban
con
urba
tion
. In
resp
onse
to th
isde
taile
d Ai
r Qua
lity
Acti
on P
lans
(AQ
APs)
hav
e be
en d
evel
oped
focu
sing
spe
cific
ally
on
addr
essi
ng th
e ai
r qua
lity
issu
es e
xper
ienc
ed in
thes
e ar
eas.
Cons
ulta
tion
is c
urre
ntly
und
erw
ay o
n po
ssib
le A
QM
As in
oth
er p
arts
of B
ath
city
cen
tre,
whe
reth
e m
icro
clim
ate
prod
uced
by
the
hist
oric
str
eet
patt
ern
and
terr
ain
caus
es p
oore
r air
qual
ity.
Loca
l ind
icat
ors
mea
surin
g O
zone
, Ben
zene
, NO
2 ,an
d PM
10s
are
all o
n tr
ack
in B
ath
and
Nor
thEa
stSo
mer
set.
Nit
roge
n di
oxid
e (N
O2 )
leve
ls in
Bris
tol h
ave
impr
oved
dur
ing
the
first
LTP
but,
whi
lst
the
leve
l has
mov
ed c
lose
ly in
line
wit
h th
e ta
rget
traj
ecto
ry, t
he ta
rget
has
not
been
met
.
Alth
ough
ther
ear
ecu
rren
tly
no A
QM
As in
Sou
th G
louc
este
rshi
re o
r Nor
th S
omer
set,
ther
e ha
sbe
en re
cogn
itio
n ov
er th
e la
st5
year
s of
the
impo
rtan
ce o
f mai
ntai
ning
this
pos
itio
n. M
easu
res
to ta
ckle
air
qual
ity
in a
mor
e ge
nera
l fas
hion
acr
oss
our a
rea
has
seen
the
acco
mpl
ishm
ent
ofSo
uth
Glo
uces
ters
hire
’s lo
cal i
ndic
ator
to re
duce
the
num
ber o
f ‘Po
or A
ir Q
ualit
y’da
ys w
hen
air
pollu
tion
exc
eeds
Nat
iona
l Air
Qua
lity
Stan
dard
s. T
here
wer
e 81
day
s in
200
0/01
whi
ch w
ere
redu
ced
to 1
3 in
200
5/06
. NO
2le
vels
in N
orth
Som
erse
tha
ve re
mai
ned
on tr
ack
thro
ugho
utth
eLT
Ppe
riod
and
redu
ctio
ns h
ave
been
obs
erve
d du
ring
the
last
thre
e ye
ars.
Anu
mbe
r of i
niti
ativ
es h
ave
been
del
iver
ed a
imed
at
redu
cing
the
cont
ribut
ion
of ro
ad tr
ansp
ort
to p
ollu
tion
pro
blem
s,in
clud
ing:
•Re
trof
itti
ng c
lean
er e
xhau
stem
issi
ons
tech
nolo
gy to
the
olde
r par
tof
the
bus
fleet
.
•Su
cces
sful
sch
ool a
nd e
mpl
oyer
trav
el p
lans
(e.g
. tra
vel t
o sc
hool
by
non-
car m
odes
in N
orth
Som
erse
tro
se fr
om 5
3% in
200
2 to
59%
in 2
005)
, hav
ing
a bi
g im
pact
on c
onge
stio
n in
pea
kti
mes
, the
reby
redu
cing
pol
luti
on.
Annu
al m
ode
shar
e su
rvey
s un
dert
aken
in S
outh
Glo
uces
ters
hire
sho
w a
redu
ctio
n in
car
jour
neys
to w
ork
durin
g th
e LT
P.
Exte
nsiv
e re
sear
ch h
as d
emon
stra
ted
that
in o
rder
to a
chie
ve th
e na
tion
alta
rget
s fo
r air
qual
ity
in A
QM
Asad
diti
onal
mea
sure
s ab
ove
and
beyo
ndth
e pr
ogra
mm
e or
igin
ally
iden
tifie
d in
the
LTP
wou
ld b
e re
quire
d. W
e ar
ese
ekin
g ad
diti
onal
fund
ing
in a
n at
tem
ptto
mee
tth
e na
tion
al ta
rget
s.
Sout
h G
louc
este
rshi
reor
igin
ally
dec
lare
dan
AQ
MA
alon
g th
e M
4, M
5, M
32 a
ndM
49 m
otor
way
s. A
Sta
ge 4
Rev
iew
conc
lude
d th
atth
e m
otor
way
s w
ould
not
caus
e th
e po
lluti
on p
robl
em p
revi
ousl
ypr
edic
ted.
In li
ght
of th
is th
ese
AQM
Asha
ve b
een
revo
ked.
Tabl
e 5.
3 –
Impl
emen
tati
on o
f Sus
tain
able
Tra
nspo
rtSt
rate
gy (P
rofo
rma
B)
2. C
o-or
dina
tion
wit
h A
ir Q
ualit
y A
ctio
n Pl
an (A
QA
P) a
nd a
ctio
n on
noi
se

73
Joint Delivery Report
Del
iver
y Be
nchm
ark
(wha
tw
e pl
anne
d to
do)
Wha
tha
s be
en d
one
Expl
anat
ions
for c
hang
es to
wha
tw
as p
lann
ed
b) D
eliv
ery
of T
raff
icM
anag
emen
tm
easu
res
dire
ctly
rela
ted
to im
prov
ing
air q
ualit
y
•Co
ntin
ued
expa
nsio
n of
our
alt
erna
tive
fuel
flee
tto
LPG
veh
icle
s an
d el
ectr
ic v
ehic
les.
•Cl
ean
Vehi
cle
Supp
ort
Net
wor
k es
tabl
ishe
d as
sist
ing
taxi
s, lo
cal b
usin
esse
s, c
ounc
il em
ploy
ees
and
the
publ
ic to
con
vert
to a
lter
nati
ve fu
els.
•Th
e Ki
ngsw
ood
Tow
n Ce
ntre
sch
eme
(go
to C
h 3
Wid
er Im
pact
s) w
as d
esig
ned
to a
ddre
ss a
num
ber o
f iss
ues
incl
udin
g ai
r qua
lity.
Mon
itor
ing
show
s a
43%
redu
ctio
n in
NO
2le
vels
follo
win
g im
plem
enta
tion
of t
he s
chem
e.
•In
200
2 w
e to
ok p
art
in a
DfT
Em
issi
ons
Test
ing
Init
iati
ve P
ilot.
Vehi
cles
wer
e st
oppe
dra
ndom
ly, e
mis
sion
s te
sted
and
, whe
re a
ppro
pria
te, d
river
s w
ere
fined
. Thi
s w
as n
otro
lled
out
acro
ss o
ur a
rea
as g
ood
prac
tice
follo
win
g co
ncer
ns th
atth
e sc
hem
e co
uld
be p
erce
ived
as
disc
rimin
ator
y ag
ains
tth
ose
wit
h lo
wer
inco
mes
.
Stra
tegy
bro
adly
impl
emen
ted
as p
lann
ed
Anu
mbe
r of t
raff
ic m
anag
emen
tm
easu
res
have
bee
n im
plem
ente
d w
hich
hav
e he
lped
toim
prov
e ai
r qua
lity,
suc
h as
:
•Tr
affic
cal
min
g m
easu
res
impl
emen
ted
aim
ed a
tco
mba
ting
con
gest
ion
and
pollu
tion
inBa
nwel
l, a
pollu
tion
‘hot
spot
’,whi
ch h
ave
succ
essf
ully
redu
ced
the
amou
ntof
traf
fic tr
avel
ling
thro
ugh
the
villa
ge.
•Im
plem
enta
tion
of b
us p
riorit
y m
easu
res
acro
ss th
e ar
ea re
allo
cati
ng ro
ad s
pace
to b
uses
and
high
occ
upan
cy v
ehic
les.
(go
to P
ublic
Tra
nspo
rtSt
rate
gy)
•Sa
fer R
oute
s to
Sch
ools
sch
emes
hav
e ad
dres
sed
traf
fic m
anag
emen
ton
a lo
cal l
evel
and
hav
epr
omot
ed th
e im
port
ance
of s
usta
inab
le m
odes
and
mad
e ac
cess
ing
scho
ols
easi
er b
y us
ers
ofth
ese
mod
es. (
go to
Roa
d Sa
fety
Str
ateg
y)
•O
ther
str
etch
es o
f bus
lane
and
road
net
wor
k m
anag
emen
tai
med
at
redu
cing
traf
fic s
peed
.
•H
igh
Occ
upan
cy V
ehic
le (H
OV)
lane
s in
trod
uced
on
the
A370
and
A41
74 A
von
Ring
Roa
d,gi
ving
prio
rity
to b
uses
and
car
sha
rers
.
•Th
e tr
affic
man
agem
ent
mea
sure
s in
Kin
gsw
ood
dire
ctly
resu
lted
in a
redu
ctio
n in
NO
2of
43%
.
•Th
e Pr
iorit
y Ac
cess
Poi
ntin
Bat
h ha
s re
duce
d tr
affic
leve
ls in
par
ts o
f Bat
h Ci
ty C
entr
e by
70%
brin
ging
wit
h it
the
asso
ciat
ed a
ir qu
alit
y be
nefit
s.
Tabl
e 5.
3 –
Impl
emen
tati
on o
f Sus
tain
able
Tra
nspo
rtSt
rate
gy (P
rofo
rma
B)

74
Del
iver
y Be
nchm
ark
(wha
tw
e pl
anne
d to
do)
Wha
tha
s be
en d
one
Expl
anat
ions
for c
hang
es to
wha
tw
as p
lann
ed
c) R
educ
tion
s in
noi
seex
posu
re
a) S
ubst
anti
al s
usta
ined
deliv
ery
of tr
avel
awar
enes
sca
mpa
igns
Stra
tegy
Bro
adly
Impl
emen
ted
as P
lann
ed
In p
ursu
itof
impr
ovin
g qu
alit
y of
life
, low
noi
se s
urfa
cing
mat
eria
ls h
ave
been
use
d on
all
maj
orre
surf
acin
g sc
hem
es in
Sou
th G
louc
este
rshi
re a
nd N
orth
Som
erse
t. A
goo
d ex
ampl
e is
the
low
nois
e re
surf
acin
g of
the
A38
Azte
c W
est
gyra
tory
nea
r Jun
ctio
n 16
on
the
M5.
Tra
ffic
vol
ume
and
the
resi
dent
ial e
nviro
nmen
tre
quire
d ex
tens
ive
publ
ic a
nd b
usin
ess
cons
ulta
tion
, res
ulti
ng in
wor
k be
ing
done
at
nigh
tw
ith
the
full
surf
ace
avai
labl
e fo
r day
tim
e tr
affic
. In
all,
247
nois
ere
duci
ng ro
ad s
urfa
cing
sch
emes
hav
e be
en im
plem
ente
d ov
er th
e la
stfiv
e ye
ars
in o
ur a
rea.
As p
art
of th
e co
mpl
etio
n of
the
A417
4 Av
on R
ing
Road
ext
ensi
ve p
lant
ing
and
land
scap
ing
was
unde
rtak
en to
redu
ce th
e im
pact
of n
oise
. N
oise
insu
lati
on h
as b
een
offe
red
to re
side
nts
who
are
deem
ed e
ligib
le.
Stra
tegy
has
Exc
eede
d Ex
pect
atio
ns
Awar
enes
s ra
isin
g ha
s pl
ayed
an
impo
rtan
tro
le in
pro
mot
ing
sust
aina
ble
tran
spor
tov
er th
eG
reat
er B
risto
l are
a du
ring
the
first
LTP
in th
e fo
rm o
f ong
oing
init
iati
ves
and
one-
off e
vent
s. T
his
has
incl
uded
pro
duci
ng li
tera
ture
to h
elp
info
rm th
e pu
blic
of a
vaila
ble
trav
el o
ptio
ns, w
orki
ngw
ith
empl
oyer
s to
pro
mot
e su
stai
nabl
e tr
ansp
ort
for t
heir
empl
oyee
s, p
rom
otin
g ev
ents
and
atte
ndin
g pu
blic
eve
nts.
Whe
re p
ossi
ble
info
rmat
ion
has
been
ava
ilabl
e on
Cou
ncil
web
sit
es,
incl
udin
g lin
ks to
trip
pla
nner
s to
hel
p th
e pu
blic
mak
e su
stai
nabl
e tr
avel
cho
ices
. Th
e ra
nge
ofin
itia
tive
s un
dert
aken
incl
udes
:
•w
ww
.2ca
rsha
re.c
om –
an
inte
rnet
base
d ca
r sha
ring
sche
me
esta
blis
hed
in 2
001,
run
by a
ndlin
ked
into
lift
shar
e.co
m, t
he c
ount
ry’s
larg
est
car-
shar
ing
sche
me
prov
ider
. The
sch
eme
has
rece
ntly
wel
com
ed it
s 40
00th
mem
ber.
•‘P
erso
nalis
ed T
rave
l Pla
nnin
g’–
proj
ect
to in
fluen
ce d
river
beh
avio
ur th
roug
h w
orki
ng c
lose
lyw
ith
com
mun
itie
s in
pro
vidi
ng ta
ilore
d tr
avel
info
rmat
ion
to m
eet
indi
vidu
al n
eed.
An
exam
ple
of th
is is
a p
roje
ctco
mpl
eted
in th
e Ea
ston
are
a of
Bris
tol (
wit
hin
the
Air Q
ualit
yM
anag
emen
tAr
ea) c
over
ing
1500
hou
seho
lds.
Ear
ly m
onit
orin
g su
gges
ts 1
0% d
ecre
ase
in c
artr
ips
in th
atar
ea.
•Ca
r Clu
bs –
ong
oing
pro
mot
ion
of th
e co
ntin
ually
gro
win
g Ca
r Clu
b sc
hem
e cu
rren
tly
wit
h 40
0m
embe
rs.
Tabl
e 5.
3 –
Impl
emen
tati
on o
f Sus
tain
able
Tra
nspo
rtSt
rate
gy (P
rofo
rma
B)
3. A
ctio
n on
Clim
ate
Chan
ge

75
Joint Delivery Report
Del
iver
y Be
nchm
ark
(wha
tw
e pl
anne
d to
do)
Wha
tha
s be
en d
one
Expl
anat
ions
for c
hang
es to
wha
tw
as p
lann
ed
•Pr
omot
ion
of ‘S
wit
ch O
ff’c
ampa
ign
in B
risto
l to
enco
urag
e dr
iver
s to
turn
off
thei
r eng
ine
whe
n st
atio
nary
in h
eavy
traf
fic a
tpo
lluti
on ‘h
otsp
ots’.
•Re
al-t
ime
pollu
tion
info
rmat
ion
adde
d to
our
web
sit
e.
•‘B
risto
l’s B
igge
stBi
ke R
ide’
– an
ann
ual f
amily
eve
ntto
pro
mot
e cy
clin
g in
the
area
wit
h a
rang
e of
cyc
ling
rout
es a
cros
s Br
isto
l and
Nor
th S
omer
set.
The
even
tha
s co
ntin
ued
to g
row
durin
g th
e fir
stLT
P w
ith
wel
l ove
r 4,0
00 p
eopl
e ta
king
par
tin
200
5.
•‘Ja
m B
usti
ng Ju
ne’–
eve
ntw
as o
rgan
ised
join
tly
to p
rovi
de e
ncou
rage
men
tfo
r peo
ple
toch
ange
the
way
they
trav
el to
wor
k, h
eld
for t
he fi
rst
tim
e in
200
5 an
d no
w a
n an
nual
eve
nt.
The
even
tge
nera
ted
a lo
tof
inte
rest
from
em
ploy
ers
wit
h ov
er 5
7 w
orkp
lace
s ta
king
up
the
chal
leng
e, to
talli
ng o
ver 1
6000
par
tici
pant
s. (g
o to
Tab
le 5
.5 T
rave
l Pla
ns)
•Pr
omot
iona
l lit
erat
ure
such
as
the
‘Driv
e D
own
Pollu
tion
’lea
flet
supp
orti
ng ‘e
co-d
rivin
g’an
d‘D
on’t
Chok
e Br
isto
l’, a
sus
tain
able
tran
spor
tin
form
atio
n ha
ndbo
ok d
istr
ibut
ed th
roug
h lo
cal
empl
oyer
s, s
choo
ls a
nd o
ther
mem
bers
of t
he p
ublic
(now
repl
aced
by
the
‘Tra
vel B
ette
r, Li
veBe
tter
’han
dboo
k pr
oduc
ed u
nder
the
JLTP
).
•Tr
avel
info
rmat
ion
prom
oted
at
all o
ur m
ajor
eve
nts.
•Co
mm
unit
y ba
sed
sust
aina
ble
tran
spor
tpr
ojec
ts s
uppo
rted
thro
ugh
the
Bris
tol
‘Nei
ghbo
urho
od T
rans
port
Init
iati
ves’
sche
me.
•Ad
diti
onal
reso
urce
s pr
ovid
ed to
sch
ools
wit
hin
Air Q
ualit
y M
anag
emen
tAr
eas
to p
ilot
proj
ects
to a
ssis
tpr
omot
ing
wal
king
to s
choo
l as
part
of s
choo
l tra
vel p
lans
.
Init
iati
ves
aim
ed a
tre
duci
ng p
rivat
e ca
r tra
ffic
hel
p to
redu
ce th
e im
pact
of tr
ansp
ort
on c
limat
ech
ange
.
Car t
raff
ic in
cen
tral
Bris
tol h
as fa
llen
durin
g th
e la
st5
year
s, a
chie
ving
the
very
str
etch
ing
loca
lta
rget
to re
duce
car
traf
fic b
y 10
% b
etw
een
1996
and
200
5. C
yclin
g tr
ips
have
inc
reas
ed b
y 26
%.
The
rate
of r
oad
traf
fic g
row
th in
Sou
th G
louc
este
rshi
re is
als
o co
ntin
uing
to re
duce
, bei
nglim
ited
to 7
% o
ver t
he LT
P pe
riod,
in li
ne w
ith
the
loca
l tar
get.
The
impl
emen
tati
on o
f Hig
h O
ccup
ancy
Veh
icle
lane
s ha
ve h
elpe
d to
incr
ease
car
sha
ring,
as
driv
ers
are
enco
urag
ed b
y th
e pr
ospe
ctof
bei
ng a
ble
to u
tilis
e m
ore
free
-flo
win
g ro
ad s
pace
. Th
isis
illu
stra
ted
by s
urve
ys c
arrie
d ou
ton
use
rs o
f Nor
th S
omer
set’s
car
-sha
ring
data
base
, wit
h 40
%of
them
hav
ing
hear
d ab
out
the
data
base
from
the
road
side
sig
ns a
long
the
Hig
h O
ccup
ancy
Vehi
cle
lane
.
Tabl
e 5.
3 –
Impl
emen
tati
on o
f Sus
tain
able
Tra
nspo
rtSt
rate
gy (P
rofo
rma
B)

76
Del
iver
y Be
nchm
ark
(wha
tw
e pl
anne
d to
do)
Wha
tha
s be
en d
one
Expl
anat
ions
for c
hang
es to
wha
tw
as p
lann
ed
a) A
chie
vem
ent
ofst
retc
hing
leve
ls o
fim
prov
emen
ts to
rura
l acc
essi
bilit
y
b) D
eliv
ery
ofsu
bsta
ntia
l rur
altr
ansp
ort
outp
uts
In Ja
nuar
y 20
06 N
orth
Som
erse
tad
opte
d th
e ‘M
ains
trea
min
g Su
stai
nabi
lity
Acti
on P
lan
2006
/200
9’to
ens
ure
that
sust
aina
ble
prin
cipl
es w
ere
key
to fu
ture
pol
icie
s an
d fu
ndin
gde
cisi
ons.
Wit
hin
this
doc
umen
tw
as a
com
mit
men
tto
furt
her d
evel
op th
e Co
unci
l’s tr
avel
pla
n.It
also
hig
hlig
hted
oth
er a
reas
of a
chie
vem
ent
such
as
The
Cam
pus
deve
lopm
ent
atLo
ckin
gCa
stle
whi
ch b
rings
toge
ther
a w
hole
rang
e of
key
ser
vice
s cl
ose
to re
side
ntia
l are
as a
nd a
railw
ay s
tati
on. I
tis
by
build
ing
on th
ese
non-
tran
spor
tac
hiev
emen
ts th
atsu
bsta
ntia
l im
pact
sca
n be
mad
e on
con
gest
ion
and
othe
r tra
nspo
rtta
rget
s.
Bath
and
Bris
tol p
arti
cipa
ted
in th
e go
vern
men
t’s C
lear
Zon
es in
itia
tive
to in
vest
igat
e pu
blic
tran
spor
tan
d tr
affic
man
agem
ent
impr
ovem
ents
in u
rban
are
as th
roug
h th
e us
e of
tech
nolo
gy.
Bath
was
dec
lare
d a
Clea
r Zon
e ‘tr
ailb
laze
r’in
200
1, a
nd d
isse
min
ated
the
expe
rienc
e ga
ined
thro
ugh
the
Nor
thga
te S
tree
t‘B
us-G
ate’
proj
ect.
Und
er th
e ‘P
ower
shift
’pro
gram
me,
120
new
eas
y ac
cess
Eur
o III
sta
ndar
d ve
hicl
es h
ave
been
intr
oduc
ed b
y bu
s op
erat
ors,
in p
artn
ersh
ip w
ith
Bath
and
Nor
th E
ast
Som
erse
t. T
he m
ajor
ity,
116
buse
s, b
elon
g to
Firs
tgr
oup,
repr
esen
ting
a £
13.5
m in
vest
men
tan
d re
duci
ng th
e le
vel o
fem
issi
ons
for t
he b
enef
itof
the
com
mun
ity.
Stra
tegy
Impl
emen
ted
Broa
dly
as P
lann
ed
In S
outh
Glo
uces
ters
hire
4 n
ew b
us s
ervi
ces
wer
e in
trod
uced
in 2
004
augm
ente
d by
a fu
rthe
r 27
peak
hou
r rur
al b
uses
and
enh
ance
d ho
urly
ser
vice
s on
8 k
ey ro
utes
in 2
005.
The
resu
lt: t
he te
nye
ar ta
rget
met
in fi
ve y
ears
. Nor
th S
omer
set
is a
lso
on tr
ack
to m
eet
its
2010
targ
etw
ith
the
fillin
g in
of g
aps
in b
us s
ervi
ce p
rovi
sion
pla
nned
from
200
6/07
onw
ards
. W
e ha
ve fo
und
in B
ath
and
Nor
th E
ast
Som
erse
tth
atth
e di
sper
sed
patt
ern
of m
any
smal
l com
mun
itie
s is
esp
ecia
llysu
ited
to c
omm
unit
y tr
ansp
ort,
rath
er th
an m
ains
trea
m b
us s
ervi
ces,
wit
h 75
% o
f rur
alho
useh
olds
in B
ath
and
Nor
th E
ast
Som
erse
tno
w b
eing
ser
ved
by c
omm
unit
y tr
ansp
ort
sche
mes
. The
200
5 fig
ure
for b
us s
ervi
ce a
cces
s is
slig
htly
bel
ow th
e tr
ajec
tory
but
com
mun
ity
tran
spor
tpa
tron
age
has
gone
up
to c
ompe
nsat
e. O
vera
ll w
e ar
e on
trac
k to
mee
tth
is ta
rget
.
Stra
tegy
Impl
emen
ted
Broa
dly
as P
lann
ed
Nor
th S
omer
set
and
Bath
and
Nor
th E
ast
Som
erse
tha
ve b
een
part
of th
e M
endi
p H
ills
Stra
tegi
cAc
tion
Tra
ffic
Gro
up (S
TAG
), w
hich
was
con
vene
d to
look
at
way
s to
redu
ce tr
affic
(par
ticu
larly
frei
ght)
trav
ellin
g ac
ross
the
Men
dip
Hill
s Ar
ea o
f Out
stan
ding
Nat
ural
Bea
uty.
Thi
s br
ings
Tabl
e 5.
3 –
Impl
emen
tati
on o
f Sus
tain
able
Tra
nspo
rtSt
rate
gy (P
rofo
rma
B)
3. R
ecog
nise
the
part
icul
ar n
eeds
and
spe
cial
cha
ract
er o
f the
cou
ntry
side

77
Joint Delivery Report
Del
iver
y Be
nchm
ark
(wha
tw
e pl
anne
d to
do)
Wha
tha
s be
en d
one
Expl
anat
ions
for c
hang
es to
wha
tw
as p
lann
ed
a)Es
tabl
ishm
ent
offr
eigh
tqu
alit
ypa
rtne
rshi
ps,
deliv
erin
g si
gnif
ican
tou
tput
s an
dou
tcom
es
toge
ther
repr
esen
tati
ves
from
rura
l par
ishe
s an
d lo
cal i
nter
est
grou
ps a
s w
ell a
s th
e AO
NB
man
agem
ent
team
and
the
Coun
cils
.
ARu
ral T
rans
port
Part
ners
hip
has
been
dev
elop
ed in
our
are
a. Jo
int
wor
king
wit
h th
is R
TP h
asen
able
d th
e pr
omot
ion
of ru
ral t
rans
port
need
s an
d ha
s pl
ayed
a p
osit
ive
role
in in
vest
igat
ing
rura
l tra
nspo
rtis
sues
in o
ur a
rea.
The
RTP
has
pro
vide
d fu
ndin
g to
enh
ance
the
dial
-a-r
ide
book
ing
serv
ice
for N
ails
ea &
Dis
tric
tCo
mm
unit
y Tr
ansp
ort
and
assi
sted
the
Mid
som
er N
orto
nD
ial-a
-Rid
e se
rvic
e. T
hese
are
bot
h su
stai
nabl
e al
tern
ativ
es to
the
priv
ate
car.
The
RTP
has
also
awar
ded
smal
l gra
nts
to v
olun
tary
gro
ups,
em
ploy
ers
and
scho
ols
to fu
nd s
usta
inab
le tr
avel
educ
atio
n an
d in
fras
truc
ture
.
Subs
tant
ial i
nves
tmen
tha
s be
en m
ade
durin
g th
e pl
an p
erio
d in
pro
vidi
ng tr
ansp
ort
in ru
ral
area
s th
roug
h co
mm
unit
y tr
ansp
ort
init
iati
ves.
The
se e
nhan
ce a
cces
sibi
lity
whe
re c
omm
erci
alse
rvic
es a
re li
mit
ed a
nd re
duce
relia
nce
on th
e pr
ivat
e ca
r. Th
e le
vel o
f com
mun
ity
tran
spor
tpr
ovis
ion
in o
ur a
rea
has
incr
ease
d by
an
impr
essi
ve 6
7% o
ver t
he la
st5
year
s. T
arge
ts fo
rco
mm
unit
y tr
ansp
ort
patr
onag
e gr
owth
hav
e be
en s
tret
ched
and
met
in S
outh
Glo
uces
ters
hire
.(g
oto
Cha
pter
3 S
ocia
l Inc
lusi
on a
nd T
able
5.1
Pub
lic T
rans
port
Plan
Str
ateg
y)
In ru
ral p
arts
of o
ur a
rea
ther
ear
ea
num
ber o
f loc
atio
ns w
here
brid
lew
ays
mee
tan
d cr
oss
the
high
way
, and
a n
umbe
r of r
oads
are
use
d ex
tens
ivel
y by
wal
kers
, cyc
lists
and
hor
se ri
ders
and
subj
ect
to s
peed
rest
ricti
ons.
In
2004
/05,
‘Qui
etLa
nes’
proj
ects
cam
e fo
rwar
d fo
r a n
etw
ork
ofro
ads
and
Gre
en L
anes
in th
e vi
llage
of W
ello
w a
nd s
ettl
emen
ts in
the
Chew
Val
ley.
Wor
ksin
volv
ed re
visi
ons
to s
igns
and
line
s, a
nd fu
rthe
r red
ucti
ons
in s
peed
lim
its.
Ther
eha
ve b
een
4ru
ral t
rans
port
inte
rcha
nge
hubs
del
iver
ed th
roug
hout
Sout
h G
louc
este
rshi
redu
ring
the
last
five
year
s w
hich
hav
e br
ough
tw
ith
them
incr
ease
d ac
cess
for r
ural
resi
dent
s to
the
publ
ic tr
ansp
ort
netw
ork.
Stra
tegy
Impl
emen
ted
has
Exce
eded
Exp
ecta
tion
s
The
Bris
tol a
nd N
eigh
bour
ing
Auth
orit
ies
Frei
ght
Qua
lity
Part
ners
hip
(BAN
A FQ
P) b
rings
us
toge
ther
wit
h bu
sine
sses
, env
ironm
enta
l gro
ups,
com
mun
itie
s, p
olic
e, ra
il fr
eigh
top
erat
ors,
the
Hig
hway
s Ag
ency
and
the
Gov
ernm
ent
Off
ice
for t
he S
outh
Wes
t. T
he G
roup
mee
ts re
gula
rlyan
d ai
ms
to p
rom
ote
mor
e su
stai
nabl
e di
strib
utio
n of
frei
ght.
Tabl
e 5.
3 –
Impl
emen
tati
on o
f Sus
tain
able
Tra
nspo
rtSt
rate
gy (P
rofo
rma
B)
5. S
usta
inab
le D
istr
ibut
ion

78
Del
iver
y Be
nchm
ark
(wha
tw
e pl
anne
d to
do)
Wha
tha
s be
en d
one
Expl
anat
ions
for c
hang
es to
wha
tw
as p
lann
ed
b) E
ffec
tive
impl
emen
tati
on o
fsu
bsta
ntia
l lor
ryro
utin
g st
rate
gies
or
stra
tegi
es to
tran
sfer
flow
sto
oth
er m
odes
Am
ajor
suc
cess
of t
he F
QP
was
to d
eliv
er th
e pi
lot
edit
ion
of th
e Co
mm
erci
al V
ehic
le D
river
sAt
las,
hig
hlig
htin
g ap
prop
riate
frei
ght
dist
ribut
ion
rout
es in
Bris
tol a
nd th
e su
rrou
ndin
g ar
ea.
This
was
intr
oduc
ed in
200
4 an
d ha
s be
en w
ell r
ecei
ved
by th
e fr
eigh
tin
dust
ry. F
urth
er w
ork
isno
w b
eing
car
ried
out
to e
xten
d th
e At
las
to c
over
mor
e of
Bat
h an
d N
orth
Eas
tSo
mer
set,
Nor
thSo
mer
set
and
rura
l are
as o
f Sou
th G
louc
este
rshi
re.
We
are
also
mem
bers
of t
he S
outh
Wes
tRe
gion
al F
reig
htFo
rum
(RFF
), w
hich
has
pro
duce
d a
regi
onal
frei
ght
map
for t
he w
hole
of t
he S
outh
Wes
tRe
gion
. Thi
s w
as a
gree
d in
Janu
ary
2006
and
will
be
incl
uded
wit
hin
the
Regi
onal
Tra
nspo
rtSt
rate
gy a
s pa
rtof
the
over
-arc
hing
Reg
iona
lSp
atia
l Str
ateg
y fo
r the
Sou
th W
est
of E
ngla
nd.
Broa
dly
Impl
emen
ted
as P
lann
ed
Furt
her s
ubst
anti
al p
artn
ersh
ip w
orki
ng w
ith
busi
ness
es h
as s
een
the
intr
oduc
tion
of v
ario
ussc
hem
es to
impr
ove
tran
spor
tef
ficie
ncy
incl
udin
g th
e gr
ound
brea
king
Bro
adm
ead
Frei
ght
Cons
olid
atio
n Sc
hem
e. T
he in
itia
tive
ser
ves
over
50
Bris
tol c
ity
cent
re re
taile
rs fr
om a
cons
olid
atio
n ce
ntre
at
Emer
sons
Gre
en.
Init
ial r
esul
ts h
ave
show
n a
70%
redu
ctio
n in
frei
ght
mov
emen
ts (a
roun
d 75
,000
km) a
mon
g pa
rtic
ipat
ing
reta
ilers
. Th
is h
as re
duce
d th
e ne
ed fo
rlo
rrie
s to
com
e in
to th
e ci
ty c
entr
e.
The
Com
mer
cial
Veh
icle
Driv
ers
Atla
s m
enti
oned
abo
ve h
as a
cted
as
a su
cces
sful
mea
ns to
influ
ence
lorr
yro
utin
g m
akin
g us
e of
the
mos
tap
prop
riate
road
s an
d av
oidi
ng a
reas
of
sens
itiv
ity.
We
have
bee
n ke
en to
wor
k w
ith
the
frei
ght
indu
stry
as
part
of th
e im
prov
emen
ts to
tran
spor
tac
ross
the
JLTP
are
a. A
s w
ell a
s lis
teni
ng to
, and
lear
ning
from
the
oper
ator
s th
roug
h th
e ar
ea-
wid
e fr
eigh
tqu
alit
y pa
rtne
rshi
p (F
QP)
, we
have
bee
n w
orki
ng c
lose
ly w
ith
our n
eigh
bour
s an
din
dust
ryre
pres
enta
tive
s on
the
prod
ucti
on o
f the
sou
th w
est
regi
onal
frei
ght
map
(RFM
) whi
chai
ms
to p
rom
ote
the
mos
tap
prop
riate
rout
es fo
r HG
Vs a
cros
s th
e re
gion
. The
eff
ecti
ve ro
utin
g of
HG
Vsis
a k
ey a
spec
tin
our
ove
rall
aim
to m
inim
ise
nois
e an
d ai
r qua
lity
impa
cts
from
HG
Vsw
hich
aff
ect
qual
ity
of li
fe.T
his
also
ens
ures
that
cong
esti
on is
redu
ced
and
larg
e ve
hicl
esun
fam
iliar
wit
h th
e ar
ea h
ave
the
nece
ssar
y in
form
atio
n to
mak
e in
form
ed c
hoic
es a
bout
thei
rro
ute.
Build
ing
on th
is,t
here
is fu
rthe
r wor
k be
ing
plan
ned
to id
enti
fy lo
cal f
reig
htro
utes
(in
addi
tion
to th
e na
tion
al, r
egio
nal a
nd c
ount
y ro
utes
set
out
in th
e RF
M),
and
this
wor
k w
ill ti
e in
wit
h th
ere
view
of t
he ro
ad h
iera
rchy
that
is p
lann
ed to
take
pla
ce in
the
JLTP
per
iod.
Tabl
e 5.
3 –
Impl
emen
tati
on o
f Sus
tain
able
Tra
nspo
rtSt
rate
gy (P
rofo
rma
B)

79
Joint Delivery Report
Del
iver
y Be
nchm
ark
(wha
tw
e pl
anne
d to
do)
Wha
tha
s be
en d
one
Expl
anat
ions
for c
hang
es to
wha
tw
as p
lann
ed
1.M
axim
ise
the
role
of
cycl
ing
as a
tran
spor
tm
ode
2. T
o im
prov
e Q
ualit
y of
Life
and
sust
aina
bilit
y by
incr
easi
ng le
vels
of
cycl
ing
Stra
tegy
Bro
adly
Impl
emen
ted
as P
lann
ed
Max
imis
ing
the
role
of c
yclin
g ha
s be
en a
key
ele
men
tof
the
first
LTP
and
one
that
has
been
ver
ysu
cces
sful
wit
h an
ove
rall
26%
incr
ease
in c
yclin
g ac
ross
the
Gre
ater
Bris
tol a
rea.
The
wid
espr
ead
and
varie
d im
plem
enta
tion
of c
yclin
g m
easu
res
(list
ed b
elow
in th
is ta
ble)
, the
filli
ng in
of
‘mis
sing
gap
s’in
the
cycl
ing
netw
ork,
pro
mot
ion
of c
yclin
g th
roug
h Tr
avel
Pla
ns (g
o to
Tab
le 5
.5Tr
avel
Pla
n St
rate
gy) a
nd e
xten
sive
pub
licit
y ha
ve a
ll he
lped
max
imis
e th
e ro
le o
f cyc
ling.
The
sem
easu
res
have
all
cont
ribut
ed to
our
impr
essi
ve in
crea
ses
in c
yclin
g.
The
rang
e of
mea
sure
s im
plem
ente
d to
ben
efit
and
enco
urag
e cy
clis
ts in
clud
e th
e co
ntin
ued
expa
nsio
n of
the
cycl
ing
netw
ork,
cyc
le p
arki
ng fa
cilit
ies,
on-
road
faci
litie
s to
ben
efit
cycl
ists
suc
has
adv
ance
d st
op li
nes,
and
gen
eral
on-
road
enh
ance
men
ts to
ben
efit
cycl
ists
ass
ocia
ted
wit
hbu
s pr
iorit
y m
easu
res.
On
the
nort
hern
sec
tion
of t
he A
38 S
how
case
Bus
Cor
ridor
, the
sem
easu
res
have
led
to a
13%
incr
ease
in c
yclin
g.
The
area
now
hos
ts a
num
ber o
f cyc
ling
even
ts a
nd th
ere
has
been
a s
igni
fican
tin
crea
se in
the
num
ber o
f cyc
lists
taki
ng p
art.
The
num
ber o
f cyc
lists
taki
ng p
art
in B
risto
l’s B
igge
stBi
ke R
ide,
for e
xam
ple,
has
qua
drup
led
betw
een
1996
and
200
5, w
ith
wel
l ove
r 4,0
00 p
arti
cipa
nts
in 2
005.
Inno
vati
ve c
ycle
trai
ning
is in
crea
sing
ly im
port
ant.
The
new
Nat
iona
l Sta
ndar
d fo
r Cyc
le T
rain
ing
has
been
intr
oduc
ed in
Sou
th G
louc
este
rshi
reem
ploy
ing
six
Accr
edit
ed C
ycle
Inst
ruct
ors.
Sou
thG
louc
este
rshi
rew
as o
ne o
f the
firs
tau
thor
itie
s in
the
coun
try
to a
dopt
this
new
sta
ndar
d. I
nBr
isto
l som
e cy
clin
g in
stru
ctor
s ha
ve b
een
retr
aine
d in
pre
para
tion
for f
ully
ado
ptin
g th
e ne
wN
atio
nal S
tand
ard
of 2
005.
Scho
ol c
ycle
trai
ning
has
incr
ease
d th
roug
hout
the
LTP,
wit
h al
mos
t4,
000
child
ren
rece
ivin
gtr
aini
ng a
cros
s G
reat
er B
risto
l in
2005
. Th
is h
as e
nabl
ed B
ath
and
Nor
th E
ast
Som
erse
tto
com
fort
ably
mee
tit
s lo
cal t
arge
tto
incr
ease
the
num
ber o
f chi
ldre
n re
ceiv
ing
cycl
e tr
aini
ng to
750
by th
e en
d of
the
LTP.
Stra
tegy
Bro
adly
Impl
emen
ted
as P
lann
ed
Incr
easi
ng c
yclin
g ca
n le
ad to
an
impr
oved
qua
lity
of li
fe fo
r cyc
lists
thro
ugh
impr
oved
fitn
ess
and
impr
oved
env
ironm
enta
l sus
tain
abili
ty a
s a
mod
e of
tran
spor
t.
As m
enti
oned
abo
ve, d
urin
g th
e LT
P th
ere
have
bee
n im
pres
sive
incr
ease
s in
cyc
ling
acro
ss th
ear
ea.
The
patt
erns
of t
hese
incr
ease
d cy
clin
g le
vels
sug
gest
that
peop
le a
re in
crea
sing
ly c
yclin
gas
a m
ode
of tr
ansp
ort,
as w
ell a
s fo
r lei
sure
. Fo
r exa
mpl
e, c
yclin
g tr
ips
to c
entr
al B
risto
l hav
e
Nor
th S
omer
set
Coun
cil’s
Tar
get
was
adju
sted
in 2
004.
Its
LTP
set
a nu
mbe
r of
targ
ets
(incl
udin
g ou
tput
targ
ets)
for t
heLT
P pe
riod
and
beyo
nd (u
p to
201
2) fo
rea
ch o
f the
mai
n to
wns
in th
e di
stric
t. In
2004
the
Coun
cil a
djus
ted
this
by
sett
ing
asi
ngle
targ
etfo
r the
who
le d
istr
ict,
and
drop
ping
the
outp
utta
rget
s, in
acco
rdan
ce w
ith
guid
ance
.
Tabl
e 5.
4 –
Impl
emen
tati
on o
f Cyc
ling
Stra
tegy
(Pro
form
a B)

80
Del
iver
y Be
nchm
ark
(wha
tw
e pl
anne
d to
do)
Wha
tha
s be
en d
one
Expl
anat
ions
for c
hang
es to
wha
tw
as p
lann
ed
3.To
bri
ng c
yclin
gpo
licy
to th
efo
refr
ont
of th
eCo
unci
ls’t
rans
port
polic
ies
incr
ease
d by
60%
ove
r the
LTP,
and
in th
e ar
ea’s
Nor
th F
ringe
, cyc
ling
has
been
am
ong
the
high
est
in th
e So
uth
Wes
t, de
spit
e a
lega
cy o
f dev
elop
men
tde
sign
ed a
roun
d th
e ne
eds
of th
e ca
r.
Trav
el a
war
enes
s ca
mpa
igns
and
cyc
ling
even
ts h
ave
play
ed a
n im
port
ant
role
in p
rom
otin
gcy
clin
g an
d in
par
ticu
lar r
aisi
ng a
war
enes
s of
the
pers
onal
hea
lth
bene
fits
of c
yclin
g, b
uild
ing
upon
the
orig
inal
‘Act
ive
for L
ife’a
war
enes
s ca
mpa
ign.
The
‘Don
’tCh
oke
Bris
tol’
sust
aina
ble
tran
spor
tin
form
atio
n ha
ndbo
ok d
istr
ibut
ed th
roug
h lo
cal e
mpl
oyer
s, s
choo
ls a
nd o
ther
mem
bers
of t
he p
ublic
incl
uded
info
rmat
ion
on th
e qu
alit
y of
life
ben
efit
s of
cyc
ling
(now
repl
aced
by
the
‘Tra
vel B
ette
r, Li
ve B
ette
r’jo
intl
y pr
oduc
ed h
andb
ook)
.
The
‘Jam
Bus
ting
June
’eve
nten
cour
ages
peo
ple
to c
hang
e th
e w
ay th
ey tr
avel
to w
ork,
by
invi
ting
com
mut
ers
to ta
ke u
p th
e ch
alle
nge
and
offe
rs p
rizes
as
ince
ntiv
es. I
tis
des
igne
d to
be
the
perf
ect
oppo
rtun
ity
for p
arti
cipa
nts
to fi
nd a
che
aper
, gre
ener
and
hea
lthi
er w
ay o
f tra
velli
ngto
wor
k, s
uch
as c
yclin
g (g
o to
Tab
le 5
.3).
Stra
tegy
Bro
adly
Impl
emen
ted
as P
lann
ed
Cycl
ing
is a
n in
tegr
al p
art
of a
ll of
our
tran
spor
tati
on p
olic
ies,
as
set
out
in th
e LT
P. T
he R
oad
Safe
ty S
trat
egie
s id
enti
fy c
yclis
ts a
s a
vuln
erab
le u
ser g
roup
. The
str
ateg
ies
iden
tify
the
need
toad
dres
s lo
calis
ed re
peat
ed a
ccid
ent
loca
tion
s w
ith
safe
ty im
prov
emen
ts.
Two
of th
e co
unci
ls a
dopt
ed ro
ad u
ser h
iera
rchi
es, r
anki
ng th
e pr
iorit
y th
atsh
ould
be
give
n to
each
road
use
r, w
hich
pla
ce p
edes
tria
ns a
nd p
erso
ns w
ith
mob
ility
diff
icul
ties
at
the
top
follo
wed
by c
yclis
ts.
This
prin
cipl
e no
w fo
rms
part
of th
e Jo
int
Loca
l Tra
nspo
rtPl
an.
Prio
ritis
atio
n of
the
need
s of
cyc
lists
has
rem
aine
d a
key
cons
ider
atio
n in
det
erm
inin
g ne
wpl
anni
ng a
pplic
atio
ns a
nd h
as b
een
give
n co
ntin
ued
grea
ter e
mph
asis
dur
ing
the
LTP.
Nor
thSo
mer
set’s
Rep
lace
men
tLo
cal P
lan
and
Bris
tol’s
Loc
al P
lan
Prop
osed
Alt
erat
ions
for t
he fi
rst
tim
edi
stin
guis
hed
betw
een
long
and
sho
rtte
rm c
ycle
par
king
to e
nsur
eth
atth
e ap
prop
riate
type
of
cycl
ing
park
ing
is p
rovi
ded.
In
200
5 Br
isto
l pro
duce
d ‘A
Gui
de T
oCy
cle
Park
ing
Prov
isio
n’,
supp
lem
enti
ng th
e cy
clin
g se
ctio
ns o
f the
Loc
al P
lan.
Our
cyc
ling
stra
tegi
es h
ave
enab
led
cycl
ing
to b
e ab
sorb
ed in
to th
e w
ider
pol
icy
cont
ext.
This
incl
uded
alt
erat
ions
to th
e Lo
cal P
lan
(and
the
emer
ging
Loc
al D
evel
opm
ent
Fram
ewor
k),
stra
tegi
es to
pro
mot
e ph
ysic
al a
ctiv
ity,
pre
pare
d jo
intl
y w
ith
the
loca
l Prim
ary
Care
Tru
sts
such
as
Obe
sity
Str
ateg
y, A
ctiv
e Fo
r Life
, Phy
sica
l Act
ivit
y St
rate
gy, t
he R
oad
Safe
ty S
trat
egie
s an
dAc
cess
ibili
ty P
lann
ing
wor
k. T
his
reco
gnit
ion
of th
e ro
le o
f cyc
ling
and
the
prio
ritis
atio
n of
the
Impl
emen
tati
on h
as b
een
in a
ccor
danc
ew
ith
the
LTP
and
subs
eque
ntgu
idan
ce.
Tabl
e 5.
4 –
Impl
emen
tati
on o
f Cyc
ling
Stra
tegy
(Pro
form
a B)
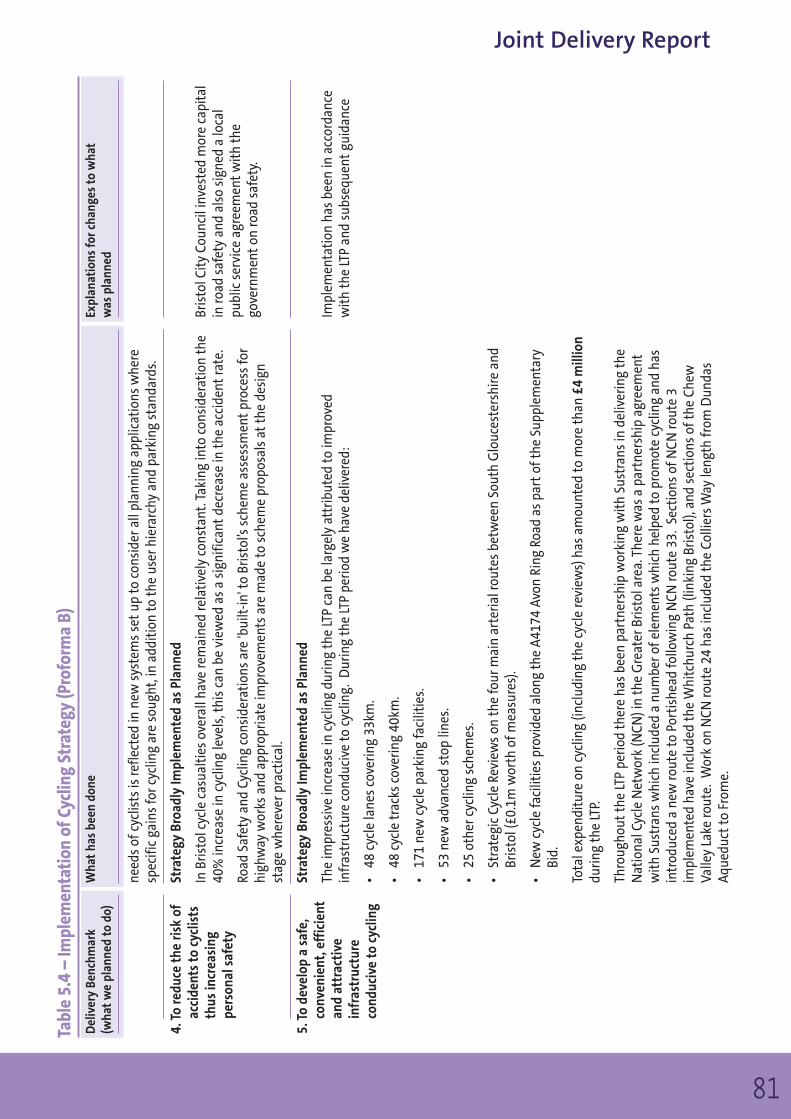
81
Joint Delivery Report
Del
iver
y Be
nchm
ark
(wha
tw
e pl
anne
d to
do)
Wha
tha
s be
en d
one
Expl
anat
ions
for c
hang
es to
wha
tw
as p
lann
ed
4. T
o re
duce
the
risk
of
acci
dent
s to
cyc
lists
thus
incr
easi
ngpe
rson
al s
afet
y
5. T
o de
velo
p a
safe
,co
nven
ient
, eff
icie
ntan
d at
trac
tive
infr
astr
uctu
reco
nduc
ive
to c
yclin
g
need
s of
cyc
lists
is re
flect
ed in
new
sys
tem
s se
tup
to c
onsi
der a
ll pl
anni
ng a
pplic
atio
ns w
here
spec
ific
gain
s fo
r cyc
ling
are
soug
ht, i
n ad
diti
on to
the
user
hie
rarc
hy a
nd p
arki
ng s
tand
ards
.
Stra
tegy
Bro
adly
Impl
emen
ted
as P
lann
ed
In B
risto
l cyc
le c
asua
ltie
s ov
eral
l hav
e re
mai
ned
rela
tive
ly c
onst
ant.
Taki
ng in
to c
onsi
dera
tion
the
40%
incr
ease
in c
yclin
g le
vels
, thi
s ca
n be
vie
wed
as
a si
gnifi
cant
decr
ease
in th
e ac
cide
ntra
te.
Road
Saf
ety
and
Cycl
ing
cons
ider
atio
ns a
re 'b
uilt-
in' t
o Br
isto
l’s s
chem
e as
sess
men
tpr
oces
s fo
rhi
ghw
ay w
orks
and
app
ropr
iate
impr
ovem
ents
are
mad
e to
sch
eme
prop
osal
s at
the
desi
gnst
age
whe
reve
r pra
ctic
al.
Stra
tegy
Bro
adly
Impl
emen
ted
as P
lann
ed
The
impr
essi
ve in
crea
se in
cyc
ling
durin
g th
e LT
P ca
n be
larg
ely
attr
ibut
ed to
impr
oved
infr
astr
uctu
re c
ondu
cive
to c
yclin
g. D
urin
g th
e LT
P pe
riod
we
have
del
iver
ed:
•48
cyc
le la
nes
cove
ring
33km
.
•48
cyc
le tr
acks
cov
erin
g 40
km.
•17
1 ne
w c
ycle
par
king
faci
litie
s.
•53
new
adv
ance
d st
op li
nes.
•25
oth
er c
yclin
g sc
hem
es.
•St
rate
gic
Cycl
e Re
view
s on
the
four
mai
n ar
teria
l rou
tes
betw
een
Sout
h G
louc
este
rshi
re a
ndBr
isto
l (£0
.1m
wor
th o
f mea
sure
s).
•N
ew c
ycle
faci
litie
s pr
ovid
ed a
long
the
A417
4 Av
on R
ing
Road
as
part
of th
e Su
pple
men
tary
Bid.
Tota
l exp
endi
ture
on
cycl
ing
(incl
udin
g th
e cy
cle
revi
ews)
has
am
ount
ed to
mor
e th
an £
4 m
illio
ndu
ring
the
LTP.
Thro
ugho
utth
e LT
P pe
riod
ther
e ha
s be
en p
artn
ersh
ip w
orki
ng w
ith
Sust
rans
in d
eliv
erin
g th
eN
atio
nal C
ycle
Net
wor
k (N
CN) i
n th
e G
reat
er B
risto
l are
a. T
here
was
a p
artn
ersh
ip a
gree
men
tw
ith
Sust
rans
whi
ch in
clud
ed a
num
ber o
f ele
men
ts w
hich
hel
ped
to p
rom
ote
cycl
ing
and
has
intr
oduc
ed a
new
rout
e to
Por
tish
ead
follo
win
g N
CN ro
ute
33.
Sect
ions
of N
CN ro
ute
3im
plem
ente
d ha
ve in
clud
ed th
e W
hitc
hurc
h Pa
th (l
inki
ng B
risto
l), a
nd s
ecti
ons
of th
e Ch
ewVa
lley
Lake
rout
e. W
ork
on N
CN ro
ute
24 h
as in
clud
ed th
e Co
llier
s W
ay le
ngth
from
Dun
das
Aque
duct
to F
rom
e.
Bris
tol C
ity
Coun
cil i
nves
ted
mor
e ca
pita
lin
road
saf
ety
and
also
sig
ned
a lo
cal
publ
ic s
ervi
ce a
gree
men
tw
ith
the
gove
rnm
ent
on ro
ad s
afet
y.
Impl
emen
tati
on h
as b
een
in a
ccor
danc
ew
ith
the
LTP
and
subs
eque
ntgu
idan
ce
Tabl
e 5.
4 –
Impl
emen
tati
on o
f Cyc
ling
Stra
tegy
(Pro
form
a B)

82
Del
iver
y Be
nchm
ark
(wha
tw
e pl
anne
d to
do)
Wha
tha
s be
en d
one
Expl
anat
ions
for c
hang
es to
wha
tw
as p
lann
ed
6.To
impr
ove
inte
rcha
nges
and
incr
ease
oppo
rtun
itie
s fo
rco
mbi
ned
cycl
e an
dpu
blic
tran
spor
tjo
urne
ys
7.To
wid
ely
prom
ote
cycl
ing
and
it’s
cont
ribu
tion
s to
wid
er C
ounc
ilob
ject
ives
Stra
tegy
Bro
adly
Impl
emen
ted
as P
lann
ed
Cycl
e pa
rkin
g ha
s be
en in
stal
led
atev
ery
rail
stat
ion
in N
orth
Som
erse
t. T
his
is re
flect
ed in
perf
orm
ance
of t
he lo
cal t
arge
tto
incr
ease
non
-car
mod
es o
f tra
vel t
o ra
il st
atio
ns, w
hich
is n
owab
ove
traj
ecto
ry, i
ncre
asin
g by
27%
sin
ce 2
001.
Bris
tol T
empl
e M
eads
Sta
tion
now
has
250
spa
ces
for c
ycle
par
king
on
the
mai
n pl
atfo
rm, a
ndYa
te ra
il st
atio
n ha
s ha
d cy
cle
lock
ers
inst
alle
d. C
ycle
par
king
has
als
o be
en d
eliv
ered
at
othe
rm
ajor
inte
rcha
nges
suc
h as
the
new
Bus
Sta
tion
at
St. J
ames
Bar
ton
and
the
Trav
el In
form
atio
nCe
ntre
loca
ted
in B
risto
l Cit
y Ce
ntre
.
Dur
ing
the
LTP
perio
d w
e ha
ve c
onti
nued
a ro
lling
pro
gram
me
of in
stal
ling
cycl
e pa
rkin
g at
dest
inat
ions
acr
oss
the
area
. As
wel
l as
publ
ic b
uild
ing,
sho
ppin
g ar
eas
and
scho
ols
this
has
incl
uded
a n
umbe
r of k
ey b
us s
tops
on
the
prin
cipa
l bus
rout
es.
Stra
tegy
Bro
adly
Impl
emen
ted
as P
lann
ed
We
have
pub
lishe
d a
set
of fo
ur in
terlo
ckin
g cy
clin
g m
aps,
sho
win
g on
and
off
-roa
d cy
cle
rout
es,
cycl
e fa
cilit
ies
such
as
Adva
nced
Sto
p Li
nes,
cyc
list
exem
ptno
-ent
ries
and
cycl
e sh
ops.
In 2
005
40,0
00 m
aps
wer
edi
strib
uted
acr
oss
the
Gre
ater
Bris
tol a
rea.
We
have
wor
ked
clos
ely
both
inte
rnal
ly a
nd w
ith
exte
rnal
par
tner
s to
rais
e th
e pr
ofile
and
leve
lsof
cyc
ling.
Regu
lar m
eeti
ngs
of C
ycle
For
ums
have
kep
tth
e pu
blic
clo
sely
invo
lved
and
info
rmed
on c
ycle
mat
ters
. Ex
tens
ive
cycl
e ca
mpa
igns
incl
udin
g an
nual
‘Bik
e W
eek’
and
new
cyc
le m
aps
wit
h ne
ighb
ourin
g Co
unci
ls h
ave
also
hel
ped.
A la
rge
perc
enta
ge o
f Gre
en C
omm
uter
Clu
bm
embe
rs (g
o to
Tab
le 5
.5) n
ow h
ave
Bicy
cle
Use
r Gro
ups.
Nor
th S
omer
set
Coun
cil h
as tr
ialle
d an
inno
vati
ve s
chem
e th
atof
fers
two
swim
s fo
r the
pric
e of
one
for a
nyon
e w
ho c
ycle
s to
Por
tish
ead
Swim
min
g Po
ol. I
n 20
05 s
ome
200
peop
le re
gist
ered
tota
kead
vant
age
of th
e sc
hem
e an
d th
is s
ucce
ss h
as s
een
the
sche
me
bein
g re
peat
ed in
200
6.
The
prof
ile o
f cyc
ling
has
also
bee
n ra
ised
thro
ugh
even
ts s
uch
as B
risto
l’s B
igge
stBi
ke R
ide
whi
ch la
stye
ar a
ttra
cted
ove
r 4,0
00 p
arti
cipa
nts.
Itis
est
imat
ed th
at15
,000
indi
vidu
als
took
par
tdu
ring
the
LTP
perio
d.
Mod
e sh
are
on th
e jo
urne
y to
railw
ayst
atio
ns, w
as a
targ
etin
Nor
th S
omer
set
Coun
cil’s
LTP,
whi
ch b
ecam
e a
Loca
lTa
rget
in th
e co
unci
ls re
view
of t
arge
ts in
2004
in a
ccor
danc
e w
ith
guid
ance
.
Impl
emen
tati
on h
as b
een
in a
ccor
danc
ew
ith
the
LTP
and
subs
eque
ntgu
idan
ce.
Revi
ews
in N
orth
Som
erse
tha
vehi
ghlig
hted
the
need
for t
he c
ounc
il to
incr
ease
its
staf
fing
com
mit
men
tto
cycl
ing.
In 2
005
the
coun
cil c
reat
ed a
new
post
of C
yclin
g O
ffic
er w
hich
has
now
been
fille
d. A
ltho
ugh
only
in p
ost
for t
hela
tter
per
iod
of th
e LT
P su
bsta
ntia
lpr
ogre
ss h
as b
een
mad
e, s
ecur
ing
exte
rnal
fund
ing
and
incr
easi
ng p
ublic
ity
and
awar
enes
s th
roug
h th
e cr
eati
on o
f aCy
cle
Foru
m.
Tabl
e 5.
4 –
Impl
emen
tati
on o
f Cyc
ling
Stra
tegy
(Pro
form
a B)

83
Joint Delivery Report
Del
iver
y Be
nchm
ark
(wha
tw
e pl
anne
d to
do)
Wha
tha
s be
en d
one
Expl
anat
ions
for c
hang
es to
wha
tw
as p
lann
ed
1.A
chie
vem
ent
ofTa
rget
sSt
rate
gy B
road
ly Im
plem
ente
d as
Pla
nned
.
Stra
tegy
We
adop
ted
a ph
ased
str
ateg
y th
atta
rget
ed m
ajor
sit
es a
nd p
artn
ersh
ip w
orki
ng w
ith
bigg
est
empl
oyer
s/ o
rgan
isat
ions
. Thi
s ac
ted
as a
spr
ingb
oard
for t
he p
rom
otio
n of
trav
el p
lans
tosm
alle
r em
ploy
ers/
sit
es.
Num
ber o
f tra
vel p
lans
•Tr
avel
pla
ns h
ave
been
impl
emen
ted
by 1
32m
ajor
em
ploy
ers.
•Ba
th a
nd N
orth
Eas
tSo
mer
set
loca
l tar
getT
11 to
ach
ieve
10
trav
el p
lans
by
2005
/06
met
risin
g fr
om a
bas
elin
e of
4 in
200
0 to
13
in 2
006.
•Br
isto
l loc
al ta
rget
14 to
incr
ease
% o
f new
bus
ines
s de
velo
pmen
tpl
anni
ng p
erm
issi
ons
wit
htr
avel
pla
n m
etris
ing
from
a b
ase
of 3
3% in
200
2/03
to 8
6% in
200
4/05
and
100
% in
200
5/06
.
•N
orth
Som
erse
tlo
cal t
arge
tfo
r the
ado
ptio
n of
1 p
lan
per y
ear m
et.
By 2
005/
06 a
tota
l of 1
3tr
avel
pla
ns h
ad b
een
deve
lope
d.
•So
uth
Glo
uces
ters
hire
loca
l tar
get
3(12
) for
75%
of l
arge
em
ploy
ers
(>20
0 st
aff)
act
ivel
yim
plem
enti
ng tr
avel
pla
ns u
p fr
om 2
5% in
200
0/01
to 6
0% in
200
5/06
.
Trav
el b
yM
odes
•So
uth
Glo
uces
ters
hire
loca
l tar
get
3(5)
to in
crea
se %
of c
ars
wit
h 2+
occ
upan
ts u
p fr
om 8
.8%
base
in 2
001/
02 to
13.
1% in
200
5/06
.
•So
uth
Glo
uces
ters
hire
loca
l tar
get
3(1)
for c
yclin
g to
wor
k ris
en fr
om b
asel
ine
of 4
% in
2001
/02
to 1
0% in
200
5/06
. Ta
rget
traj
ecto
ry o
f 10%
met
.
Empl
oyee
s
•Ba
th a
nd N
orth
Eas
tSo
mer
set
loca
l tar
getT
12 fo
r 15%
of e
mpl
oyee
s to
be
cove
red
by a
dopt
edtr
avel
pla
n by
200
5/06
. Bas
elin
e in
200
2/03
of 9
650
empl
oyee
s. 1
3 pl
ans
in p
lace
by
2005
/06
cove
ring
mor
e th
an 1
5% o
f em
ploy
ees.
Oth
er
•Br
isto
l loc
al ta
rget
(21)
to in
crea
se n
umbe
r of B
risto
l em
ploy
ers
rece
ivin
g Av
on A
rea
Empl
oyer
s’Tr
avel
Pla
n Aw
ards
by
400%
. Tar
get
met
by 2
003/
04 w
ith
19 e
mpl
oyer
s.
Repl
aces
pre
viou
s le
ss s
tret
chin
g ta
rget
in a
ccor
danc
e w
ith
guid
ance
.
No
targ
etse
tbe
fore
200
2/03
as
diff
icul
ties
exp
erie
nced
in re
lati
ng to
the
size
of e
mpl
oyer
. N
ow u
sing
Cou
ncil
wor
kfor
ce a
s a
suit
able
pro
xy.
Tabl
e 5.
5 –
Impl
emen
tati
on o
f Tra
vel P
lans
(Pro
form
a B)

84
Del
iver
y Be
nchm
ark
(wha
tw
e pl
anne
d to
do)
Wha
tha
s be
en d
one
Expl
anat
ions
for c
hang
es to
wha
tw
as p
lann
ed
2.Pa
rtne
rshi
p W
orki
ngan
d A
ctio
n on
Tra
vel
Aw
aren
ess
Mon
itor
ing
Regu
lar m
onit
orin
g th
roug
h jo
urne
y to
wor
k su
rvey
s ha
s be
en e
ssen
tial
in h
elpi
ng u
s to
revi
ewpr
ogre
ss a
nd a
lloca
te re
sour
ces
acco
rdin
gly.
Stra
tegy
Bro
adly
Impl
emen
ted
as P
lann
ed
Staf
f: T
rave
l Pla
n O
ffic
ers
appo
inte
d pa
rtly
fund
ed th
roug
h D
ETR
Burs
ary
Awar
d, p
artl
y by
Coun
cil r
esou
rces
. Tra
vel p
lan
wor
k in
Bat
h an
d N
orth
Eas
tSo
mer
set
dire
cted
thro
ugh envolve,
alo
cal v
olun
tary
env
ironm
enta
l org
anis
atio
n.
Reve
nue
Fund
ing:
We
spen
d ov
er £
100,
000
aye
ar o
n re
venu
e su
ppor
tfo
r tra
vel p
lan
acti
viti
es.
Capi
tal F
undi
ng: A
tota
l of a
bout
£0.5
mof
LTP
capi
tal f
undi
ng h
as b
een
devo
ted
to tr
avel
pla
nsov
er th
e LT
P pe
riod.
Com
mut
er C
lubs
Com
mut
er C
lubs
hav
e be
en e
stab
lishe
d ac
ross
the
Gre
ater
Bris
tol a
rea
to e
ngag
e w
ith
the
busi
ness
com
mun
ity,
pro
vide
a fo
rum
for c
onsu
ltat
ion,
join
tly
deve
lop
solu
tion
s an
d en
cour
age
netw
orki
ng. A
Gre
ater
Bris
tol C
omm
uter
Clu
b N
etw
ork
was
est
ablis
hed
to e
ncou
rage
com
mun
icat
ion
and
spre
ad b
est
prac
tice
.
Firs
tar
e re
pres
ente
d on
the
Net
wor
k an
d pr
omot
e ti
cket
ing
and
agen
cy s
chem
es. A
ppro
xim
atel
y10
3 em
ploy
ers
are
invo
lved
in d
isco
unt
sche
mes
and
app
roxi
mat
ely
25 a
ctas
age
nts
for t
icke
tsa
les.
Com
mut
er c
lub
acti
viti
es h
ave
incl
uded
:
•G
reen
Com
mut
er C
lub
in B
risto
l has
gro
wn
to 1
08, a
tten
danc
e at
club
mee
ting
s av
erag
es
25-4
0.
•G
roup
ing
for e
mpl
oyer
s se
tup
for n
ew o
ffic
es a
tTem
ple
Qua
y. P
roje
cts
deve
lope
d: a
rea
trav
elm
ap; a
rea
Bike
Use
r Gro
up; f
irst
grou
p el
ectr
onic
car
sha
resc
hem
e.
•G
roup
ings
als
o es
tabl
ishe
d fo
r Bris
tol’s
Har
bour
side
are
a (v
isit
or a
ttra
ctio
ns) a
nd s
uppo
rtgi
ven
to g
roup
s of
em
ploy
ers
in A
vonm
outh
/Cab
otPa
rk; C
ater
Roa
d in
dust
rial p
ark;
Impe
rial
Trad
ing
Esta
te; a
nd in
Sou
th B
risto
l.
•In
Bris
tol a
bout
56%
of c
ompa
nies
wit
h m
ore
than
100
em
ploy
ees
now
hav
e tr
avel
pla
ns. T
he
Som
e de
lay
in tr
avel
pla
n ac
tivi
ty in
secu
ring
reso
urce
s, e
spec
ially
for C
ounc
ilsun
succ
essf
ul w
ith
Burs
ary
bids
. Tra
vel
plan
pos
ts n
ow p
erm
anen
t.
Abi
d to
buy
bus
es to
pro
vide
a d
irect
link
from
Tem
ple
Qua
yto
the
cent
ral a
rea
ofBr
isto
l was
uns
ucce
ssfu
l but
amen
dmen
ts to
the
loca
l bus
net
wor
kha
ve s
igni
fican
tly
impr
oved
bus
acc
ess
e.g.
73,
500
ser
vice
s.
Tabl
e 5.
5 –
Impl
emen
tati
on o
f Tra
vel P
lans
(Pro
form
a B)

85
Joint Delivery Report
Del
iver
y Be
nchm
ark
(wha
tw
e pl
anne
d to
do)
Wha
tha
s be
en d
one
Expl
anat
ions
for c
hang
es to
wha
tw
as p
lann
ed
resu
lts
have
bee
n im
pres
sive
wit
h co
mpa
nies
wit
h ac
tive
trav
el p
lans
ach
ievi
ng re
duct
ions
insi
ngle
occ
upan
cy v
ehic
le tr
ips
of b
etw
een
5% a
nd 3
0%.
•G
reen
Com
mut
er C
lub
in S
outh
Glo
uces
ters
hire
, a h
ugel
y ef
fect
ive
foru
m w
ith
72m
embe
rs.
Now
spl
itin
to tw
o to
man
age
incr
easi
ng m
embe
rshi
p m
ore
effe
ctiv
ely–
Azt
ec W
estT
rave
lFo
rum
(27
mem
bers
) and
Nor
th F
ringe
(45
mem
bers
). G
reen
Tra
vel R
oads
how
s ar
e or
gani
sed
wit
h su
ppor
tfr
om F
irst,
Wes
sex
Trai
ns a
nd L
ife C
ycle
UK
and
held
regu
larly
eve
ry y
ear a
tRA
C,U
WE,
Alli
anz
Corn
hill,
GE
and
Azte
c W
est.
•Ba
th a
nd N
orth
Eas
tSo
mer
setT
rave
l For
um h
as g
row
n fr
om th
e or
igin
al B
ath
Empl
oyer
s’Tr
avel
Pla
n Fo
rum
and
wor
k un
dert
aken
by
the
Coun
cil i
n pa
rtne
rshi
p w
ith
the
volu
ntar
yse
ctor
env
ironm
enta
l gro
up envolve
on th
e Ta
ke F
ive
proj
ect.
Now
has
17
mem
bers
incl
udin
gth
e U
nive
rsit
y of
Bat
h, th
e W
esse
x W
ater
regi
onal
hea
dqua
rter
s an
d Ro
yal U
nite
d H
ospi
tal a
ndm
eets
3 ti
mes
a y
ear.
•In
Nor
th S
omer
set
an e
mpl
oyer
gro
up h
as b
een
set
up in
Wes
ton-
supe
r-M
are
incl
udin
g th
eSo
vere
ign
Cent
re, W
esto
n G
ener
al H
ospi
tal a
nd W
esto
n Co
llege
. Con
tinu
ing
dial
ogue
has
take
n pl
ace
wit
h Br
isto
l Int
erna
tion
al A
irpor
t, w
hich
is d
evel
opin
g a
trav
el p
lan
as p
art
of it
sm
aste
r pla
n fo
r exp
ansi
on.
Trav
el P
lan
Aw
ard
Our
Avo
n Ar
ea E
mpl
oyer
s’Tr
avel
Pla
n Aw
ard,
sup
port
ed b
y th
e CB
I and
Bus
ines
s W
est,
has
gone
from
str
engt
h to
str
engt
h. It
has
prov
ided
an
exce
llent
plat
form
for p
osit
ive
med
ia p
ublic
ity.
Ove
r40
firm
s an
d or
gani
sati
ons
have
rece
ived
aw
ards
, nin
e of
them
ach
ievi
ng G
old
Awar
d st
atus
for
decr
easi
ng s
ingl
e ca
r occ
upan
cy b
y 7%
or m
ore.
The
Sov
erei
gn C
entr
e in
Wes
ton-
supe
r-M
are
won
aG
old
awar
d fo
r the
33%
redu
ctio
n in
em
ploy
ee s
ingl
e oc
cupa
ncy
car t
rips
to th
eir s
ite.
Wor
king
thro
ugh
the
Plan
ning
Pro
cess
Plan
ning
app
licat
ions
are
trac
ked
and
tran
spor
tas
sess
men
ts u
sed
to id
enti
fy ta
rget
s an
dm
onit
orin
g.Co
ntrib
utio
ns to
war
ds m
easu
res
to s
uppo
rttr
avel
pla
ns a
re s
ecur
ed th
roug
h S1
06ag
reem
ents
. The
se a
rese
en a
s a
furt
her m
etho
d fo
r 're
crui
ting
' em
ploy
ers
into
the
trav
el p
lan
mov
emen
t.
Coun
cil S
taff
Tra
vel P
lans
We
have
mad
e pr
ogre
ss w
ith
our o
wn
staf
f tra
vel p
lans
:
Som
e de
lays
bec
ause
of s
taff
reso
urce
s;no
w re
solv
ed.
Som
e de
lays
bec
ause
of s
taff
reso
urce
s;no
w re
solv
ed.
Rest
ruct
ured
to m
ake
itsi
mpl
er to
use
and
intr
oduc
ed G
old,
Bro
nze
and
Silv
eraw
ards
.
Scal
e of
new
dev
elop
men
tan
d pl
anni
ngap
plic
atio
ns h
as m
eant
incr
ease
d in
put
from
pla
nnin
g an
d tr
ansp
ort
staf
f.
Tabl
e 5.
5 –
Impl
emen
tati
on o
f Tra
vel P
lans
(Pro
form
a B)
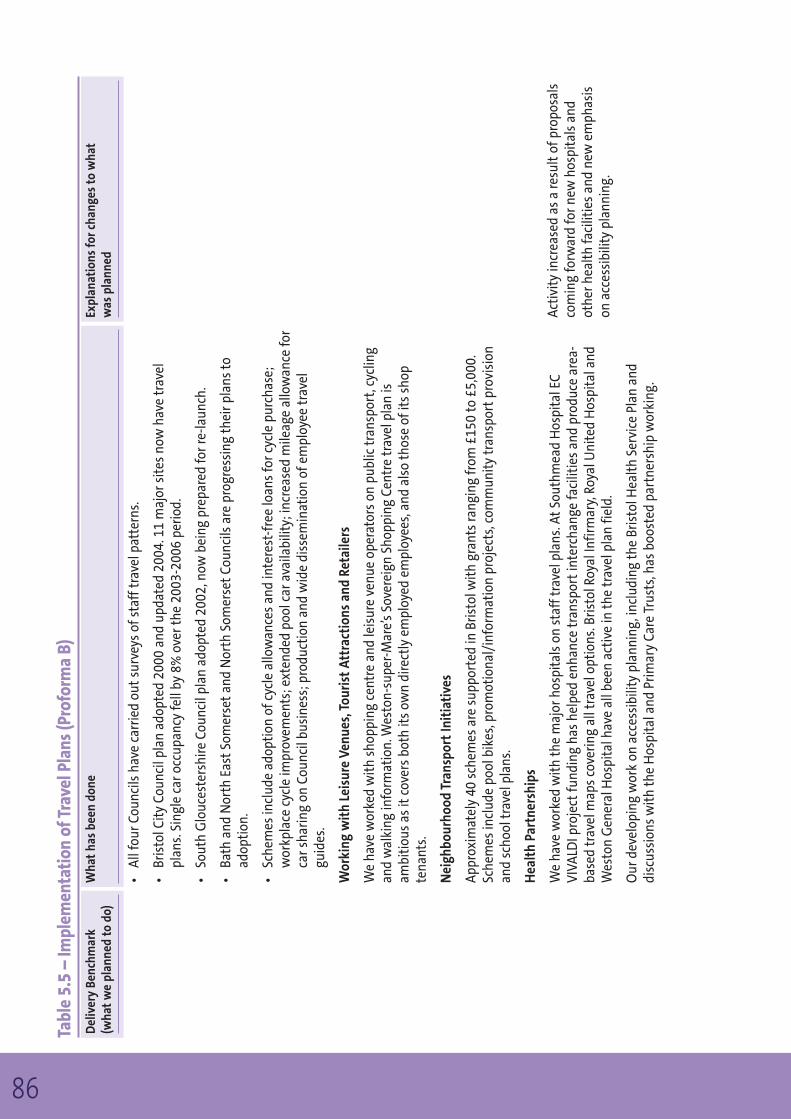
86
Del
iver
y Be
nchm
ark
(wha
tw
e pl
anne
d to
do)
Wha
tha
s be
en d
one
Expl
anat
ions
for c
hang
es to
wha
tw
as p
lann
ed
•Al
l fou
r Cou
ncils
hav
e ca
rrie
d ou
tsu
rvey
s of
sta
ff tr
avel
pat
tern
s.
•Br
isto
l Cit
y Co
unci
l pla
n ad
opte
d 20
00 a
nd u
pdat
ed 2
004.
11
maj
or s
ites
now
hav
e tr
avel
plan
s. S
ingl
e ca
r occ
upan
cy fe
ll by
8%
ove
r the
200
3-20
06 p
erio
d.
•So
uth
Glo
uces
ters
hire
Cou
ncil
plan
ado
pted
200
2, n
ow b
eing
pre
pare
d fo
r re-
laun
ch.
•Ba
th a
nd N
orth
Eas
tSo
mer
set
and
Nor
th S
omer
set
Coun
cils
are
pro
gres
sing
thei
r pla
ns to
adop
tion
.
•Sc
hem
es in
clud
e ad
opti
on o
f cyc
le a
llow
ance
s an
d in
tere
st-f
ree
loan
s fo
r cyc
le p
urch
ase;
wor
kpla
ce c
ycle
impr
ovem
ents
; ext
ende
d po
ol c
ar a
vaila
bilit
y; in
crea
sed
mile
age
allo
wan
ce fo
rca
r sha
ring
on C
ounc
il bu
sine
ss; p
rodu
ctio
n an
d w
ide
diss
emin
atio
n of
em
ploy
ee tr
avel
guid
es.
Wor
king
wit
h Le
isur
e Ve
nues
, Tou
rist
Attr
acti
ons
and
Reta
ilers
We
have
wor
ked
wit
h sh
oppi
ng c
entr
e an
d le
isur
e ve
nue
oper
ator
s on
pub
lic tr
ansp
ort,
cycl
ing
and
wal
king
info
rmat
ion.
Wes
ton-
supe
r-M
are’
s So
vere
ign
Shop
ping
Cen
tre
trav
el p
lan
isam
biti
ous
as it
cove
rs b
oth
its
own
dire
ctly
em
ploy
ed e
mpl
oyee
s, a
nd a
lso
thos
e of
its
shop
tena
nts.
Nei
ghbo
urho
od T
rans
port
Init
iati
ves
Appr
oxim
atel
y 40
sch
emes
are
sup
port
ed in
Bris
tol w
ith
gran
ts ra
ngin
g fr
om £
150
to £
5,00
0.Sc
hem
es in
clud
e po
ol b
ikes
,pro
mot
iona
l/in
form
atio
n pr
ojec
ts, c
omm
unit
y tr
ansp
ort
prov
isio
nan
d sc
hool
trav
el p
lans
.
Hea
lth
Part
ners
hips
We
have
wor
ked
wit
h th
e m
ajor
hos
pita
ls o
n st
aff t
rave
l pla
ns. A
tSo
uthm
ead
Hos
pita
l EC
VIVA
LDI p
roje
ctfu
ndin
g ha
s he
lped
enh
ance
tran
spor
tin
terc
hang
e fa
cilit
ies
and
prod
uce
area
-ba
sed
trav
el m
aps
cove
ring
all t
rave
l opt
ions
. Bris
tol R
oyal
Infir
mar
y, R
oyal
Uni
ted
Hos
pita
l and
Wes
ton
Gen
eral
Hos
pita
l hav
eal
l bee
n ac
tive
in th
e tr
avel
pla
n fie
ld.
Our
dev
elop
ing
wor
k on
acc
essi
bilit
y pl
anni
ng, i
nclu
ding
the
Bris
tol H
ealt
h Se
rvic
e Pl
an a
nddi
scus
sion
s w
ith
the
Hos
pita
l and
Prim
ary
Care
Tru
sts,
has
boo
sted
par
tner
ship
wor
king
.
Acti
vity
incr
ease
d as
a re
sult
of p
ropo
sals
com
ing
forw
ard
for n
ew h
ospi
tals
and
othe
r hea
lth
faci
litie
s an
d ne
w e
mph
asis
on a
cces
sibi
lity
plan
ning
.
Tabl
e 5.
5 –
Impl
emen
tati
on o
f Tra
vel P
lans
(Pro
form
a B)

87
Joint Delivery Report
Del
iver
y Be
nchm
ark
(wha
tw
e pl
anne
d to
do)
Wha
tha
s be
en d
one
Expl
anat
ions
for c
hang
es to
wha
tw
as p
lann
ed
Nei
ghbo
urin
g A
utho
riti
es
Apar
tfr
om th
e w
ell e
stab
lishe
d jo
int
wor
king
bet
wee
n us
in th
e G
reat
er B
risto
l are
a th
ere
has
been
an
ongo
ing
dial
ogue
wit
h ad
jace
ntau
thor
itie
s on
LTP
issu
es, w
ith
spec
ial e
mph
asis
on
the
rela
tion
ship
bet
wee
n W
estW
iltsh
ire a
nd e
mpl
oym
ent
in B
ath.
Air
port
Surf
ace
Acc
ess
Stra
tegy
We
are
all a
ctiv
e m
embe
rs o
f Bris
tol I
nter
nati
onal
Airp
ort’s
Air
Tran
spor
tFo
rum
, whi
ch g
uide
san
d ad
vise
s th
e de
velo
pmen
tan
d im
plem
enta
tion
of t
he A
irpor
tSu
rfac
e Ac
cess
Str
ateg
y.
Wid
er T
rave
l Aw
aren
ess
Act
ivit
ies
We
have
mad
e th
e lin
k w
ith
wid
er tr
avel
aw
aren
ess
acti
viti
es. B
risto
l and
Sou
th G
louc
este
rshi
rear
e en
erge
tic
mem
bers
of t
he N
atio
nal T
rave
lWis
e As
soci
atio
n. T
he A
ssoc
iati
on’s
Nat
iona
lCo
nfer
ence
is b
eing
hel
d in
Bris
tol i
n N
ovem
ber 2
006.
Our
wid
er a
ctiv
itie
s in
clud
e:
•Sc
hool
trav
el p
lans
: 19
8sc
hool
s ha
ve a
dopt
ed p
lans
. In
2004
we
assi
sted
46
scho
ols
inpr
oduc
ing
plan
s an
d 56
scho
ols
prod
uced
pla
ns in
200
5. D
ecre
ase
in c
ar u
se o
n th
e sc
hool
run
in N
orth
Som
erse
tfr
om 4
7% in
200
3 to
41%
in 2
006
and
in S
outh
Glo
uces
ters
hire
, fal
len
from
39%
in 2
000/
01 to
33%
in 2
005/
06.
•N
atio
nal B
ike
Wee
k: B
risto
l's B
igge
stBi
ke R
ide
and
Bike
Bre
akfa
sts
(go
to T
able
5.4
).
•Cy
cle
Prom
otio
n in
clud
ing
Adul
tCy
cle
trai
ning
sch
eme,
wor
kpla
ce p
rom
otio
ns, m
ass
part
icip
atio
n ev
ents
, ope
ning
of U
K’s
first
purp
ose
built
cycl
e re
sour
ce c
entr
e in
Bris
tol c
ity
cent
re a
nd C
ycle
Wes
t‘T
ake
a st
and’
proj
ect
(go
to T
able
5.4
).
•Bi
cycl
e U
ser G
roup
s (in
clud
ing,
in S
outh
Glo
uces
ters
hire
, Rol
ls R
oyce
, Airb
us, M
oD, S
TM a
tAz
tec
Wes
t, Ro
yal M
ail a
nd th
e Co
unci
l).
•'Ja
m B
usti
ng Ju
ne':
even
tin
trod
uced
in 2
005
wit
h 57
diff
eren
tem
ploy
ers
(go
to T
able
5.3
).
•Eu
rope
an M
obili
ty W
eek:
a fo
cus
for t
he T
rave
l Pla
n Aw
ards
.
•Pe
rson
alis
ed tr
avel
pla
nnin
g: T
rave
lSm
art®
pro
gram
me
(go
to T
able
5.3
).
Clos
er jo
int
wor
king
bet
wee
n us
has
resu
lted
in m
any
trav
el p
lan
acti
viti
esbe
ing
shar
ed.
Scho
ol tr
avel
pla
ns b
oost
ed b
y D
fT/
DfE
Sfu
ndin
g.
Pers
onal
ised
trav
el p
lann
ing
expa
nded
as
resu
ltof
VIV
ALD
I fun
ding
.
Tabl
e 5.
5 –
Impl
emen
tati
on o
f Tra
vel P
lans
(Pro
form
a B)

88
Del
iver
y Be
nchm
ark
(wha
tw
e pl
anne
d to
do)
Wha
tha
s be
en d
one
Expl
anat
ions
for c
hang
es to
wha
tw
as p
lann
ed
3.Im
prov
emen
ts to
Wal
king
and
Cyc
ling
Faci
litie
s an
d Pu
blic
Tran
spor
tfo
r Jou
rney
sto
Wor
k
Stra
tegy
Bro
adly
Impl
emen
ted
as P
lann
ed.
Wal
king
We
have
del
iver
ed a
rang
e of
sch
emes
that
mak
e it
easi
er a
nd s
afer
to w
alk
to w
ork.
Ove
r 200
spec
ific
pede
stria
n sc
hem
es h
ave
been
car
ried
out
and
this
num
ber i
s sw
elle
d by
new
and
enha
nced
cro
ssin
gs (g
o to
Tab
le 5
.2).
Our
inve
stm
ent
in c
ity
and
tow
n ce
ntre
rege
nera
tion
has
emph
asis
ed th
e im
port
ance
of t
he p
edes
tria
n (g
o to
Cha
pter
3).
We
have
als
o w
orke
d w
ith
deve
lope
rs to
sec
ure
on- a
nd o
ff-s
ite
pede
stria
n fa
cilit
ies.
Acc
ess
to b
us s
tops
and
railw
ayst
atio
ns h
as a
lso
been
impr
oved
(go
to T
able
5.1
)
Cycl
ing
Our
impl
emen
tati
on p
rogr
amm
es h
ave
incl
uded
man
y cy
clin
g sc
hem
es a
nd w
e ar
e pr
oud
of o
urac
hiev
emen
ts. T
he n
umbe
r and
rang
e of
faci
litie
s ha
s in
crea
sed
dram
atic
ally
and
mad
e cy
clin
g a
real
opt
ion
for w
ork
jour
neys
. (go
to C
hapt
er 4
and
Tab
le 5
.4)
Publ
ic T
rans
port
Jour
neys
to w
ork
have
ben
efit
ed fr
om th
e su
bsta
ntia
l cap
ital
and
reve
nue
reso
urce
s w
e ha
ve p
utin
to e
nhan
cing
pub
lic tr
ansp
ort
infr
astr
uctu
re(g
oto
Tab
le 5
.1).
Capi
tal p
roje
cts
such
as
our
show
case
rout
es a
nd in
vest
men
tin
bus
prio
ritie
s an
d be
tter
pas
seng
er a
nd in
form
atio
n fa
cilit
ies
all c
ontr
ibut
e to
mak
ing
the
bus
a m
ore
attr
acti
ve c
hoic
e fo
r get
ting
to w
ork.
Our
reve
nue
fund
ing
has
supp
orte
d no
n-co
mm
erci
al b
us s
ervi
ces
esse
ntia
l for
rura
l and
oth
er re
side
nts.
Urb
an a
nd R
ural
Bus
Cha
lleng
e fu
ndin
g ha
s he
lped
us
kick
star
tse
rvic
es in
oth
er a
reas
. Dev
elop
erco
ntrib
utio
ns h
ave
also
bee
n in
stru
men
tal i
n pu
mp
prim
ing
bus
serv
ices
for w
ork
jour
neys
; som
ebi
g em
ploy
ers
prov
ide
dedi
cate
d bu
s se
rvic
es o
f the
ir ow
n.
Car S
hari
ng
We
laun
ched
a jo
int
Gre
ater
Bris
tol c
ar s
harin
g sc
hem
e in
200
5 w
ith
easy
acc
ess
for p
oten
tial
mem
bers
thro
ugh
ww
w2c
arsh
are.
com
and
oth
er m
edia
. The
sch
eme
has
over
4,0
00m
embe
rsan
d 60
%of
use
rs fi
nd a
car
sha
re m
atch
. 2+
par
king
sig
nage
sup
plie
d to
man
y co
mpa
nies
incl
udin
g Ro
lls R
oyce
, WS
Atki
ns a
nd T
elew
est.
Sout
h G
louc
este
rshi
re C
ounc
il re
ceiv
ed a
Mar
keti
ng C
omm
enda
tion
Aw
ard
from
the
Asso
ciat
ion
for C
omm
uter
Tra
nspo
rtin
200
3. I
nter
net
site
reco
gnis
ed a
s “a
pat
tern
for o
ther
s to
follo
w…
offe
rs q
uick
, eas
y ac
cess
to e
ssen
tial
trav
el in
form
atio
n.”
Tabl
e 5.
5 –
Impl
emen
tati
on o
f Tra
vel P
lans
(Pro
form
a B)

89
6. Conclusion6.1 In our first LTP the Department for
Transport set us a series of challenges andtargets. Challenges to deal with local,regional and national transport issues,challenges to tackle wider policyobjectives such as economic vitality andsocial inclusion and targets to reduceaccidents, improve highway maintenanceand encourage cycling and bus use. All ofthis we believe we have achieved andmore.
6.2 62% of our LTP Core Targets on track.There are now 1.2 million extra peopletravelling by bus, 26% more peoplecycling, the lowest ever number ofchildren killed or seriously injured inaccidents and our highway network in thebest state it has been in. Table 6.1 isadded proof to our achievements.
Joint Delivery Report
Table 6.1: Our Achievements
Delivery Report LTP * Reference in AssessmentRating delivery report
Overall Impact of LTP
What difference has the ☺☺☺ Chapter 2 Our area is a safer and easier place to LTP made? Paras 2.2 to 2.11 get around as a result of the first LTP.
What are the key ☺☺☺ Chapter 2 We have been innovative and integrated,achievements of the Paras 2.12 to 2.25 attracted investment, delivered schemesfirst LTP? and met our targets.
Have the key aims and ☺☺☺ Chapter 2 Achieved our aims for air quality, road objectives of the LTP Table 2.2 safety, reducing traffic, providing quality been achieved? Figure 2.3 alternatives, accessibility and economic
vitality.
Changes to key aims and ☺☺ Chapter 2 Overall objectives unchanged. Light Rapid objectives since the Paras 2.27 to 2.36 Transit proposals adjusted following DfTfirst LTP. decision.
What has worked well ☺☺ Chapter 2 Promoting alternatives to the car, attractingand what can be Paras 2.37 to 2.57 funding and resources have all worked well.improved. Home Zones success exceeded our ability to
meet aspirations.
What foundations for the ☺☺ Chapter 2 Laid the basis for the Joint Local Transportlonger term have been Paras 2.58 to 2.67 Plan. New structures flexible at adapting to
put in place. changing priorities and meeting targets.
Contribution to Wider Objectives
City and Town Centre ☺☺ Chapter 3 Major improvements across the area from vitality and viability. Paras 3.7 to 3.36 large scale redevelopment and
enhancements in Bristol and Weston-super-Mare to the historic streets of Bath to localshopping centres in Kingswood, Clevedon, Nailsea, Downend and Midsomer Norton.
Social Inclusion. ☺☺ Chapter 3 New schemes and opportunities for travel Paras 3.37 to 3.60 particularly for rural and deprived areas.
Progress on Core Indicators
Highway Maintenance ☺☺☺ Chapter 4 Targets met. Highway in best condition Figures 4.6, 4.7 since 2000/01.and 4.8

90
Delivery Report LTP * Reference in AssessmentRating delivery report
Killed and Seriously Injured ☺ Chapter 4 Child KSI on track and lowest ever figures.Figures 4.3 All KSI not on track although trend is and 4.4 downwards.
Bus passengers ☺☺ Chapter 4 Bus patronage steady growth againstFigures 4.2 national decline outside London. 40% rise and 4.2a in fares has hit bus patronage in Bristol.
Rural Accessibility ☺☺ Chapter 4 New services raised accessibility levels.
Cycling ☺☺ Chapter 4 Impressive growth in cycling against a Figure 4.5 backdrop of massive development and
rising traffic levels.
Delivery of Plan Strategy
Public Transport ☺☺ Table 5.1 Implemented a wide range of schemes and met targets for increasing bus use broadly as planned.
Road Safety ☺ Table 5.2 Successful implementation of schemes bringing down accident levels broadly as planned.
Sustainable Transport ☺☺☺ Table 5.3 Innovative schemes helping to exceed expectations.
Cycling ☺☺☺ Table 5.4 New routes, networks and facilities leading to strategy exceeding expectations.
Travel Plans ☺☺☺ Table 5.5 Green Commuter clubs, car sharing and other initiatives assisted travel plans to exceed expectations.
*Maximum of three faces for each part of the Report. Greater the number of faces, better the performance.
☺☺☺ = exceptional performance (targets met/schemes delivered). ☺☺ = good performance (nearly all targets met/schemes delivered).☺ = reasonable performance (most targets met/schemes delivered).

91
6.3 Nonetheless there is no room forcomplacency. Work on the SharedPriorities Development Plan with the DfTin 2004 showed that more than £300m isrequired to address the under investmentin transport that has occurred over thelast 20 years and lay the foundation forfuture growth.
6.4 Our area too is the powerhouse for theSouth West’s economy. With over 1million residents we are the main focusfor employment, shopping, culturalactivities and education. For the futurewe have £3 billion worth of potentialdevelopment sites. Growth over the last20 years together with our role as theroad, rail and air gateway to the SouthWest is generating huge pressures. Ourtransport infrastructure is being pushedto the limit. Congestion even with all ourLTP successes is still the worst outsideLondon. New infrastructure is vital forregeneration and our continued economicand social success. This is our challengefor the JLTP.
6.5 The JLTP sets out our vision for the next20 to 30 years. During this period theRegional Spatial Strategy is suggesting ahundred thousand new homes, and asmany jobs, may need to be provided toachieve sustainable economic growth.Transport is vital for our area’s continuedeconomic and social success.
6.6 If we secure the funding we could start tomake the large-scale infrastructureimprovements for public transport androads that the area desperately needs. Atthe same time we could target additionalresources at measures to reducedependence on the car for short journeyssuch as more and safer walking andcycling routes and school and workplacetravel plans.
6.7 Working together we can achieve this.Working together we have alreadydelivered and met targets. Without it wewould not have had either a Provisional orFinal Joint Local Transport Plan pushingforward our ideas to 2011 and beyond.Neither would we have submitted the£68m Greater Bristol Bus Network majorscheme bid or indeed received the £1.5mof Transport Innovation Fund pumppriming.
6.8 It is in the spirit of this joint working thatwe look forward to removing cross-boundary barriers to movement,continuing to challenge ourselves withambitious targets, and delivering areliable, safe and efficient transportnetwork for the years to come.
Joint Delivery Report
City Centre congestion

93
Joint Delivery Report
Proforma A TablesProgress Against LTP 1 Core Indicators

95
Co
re I
nd
ica
tor
De
fin
itio
ns
Ye
ar
Va
lue
Ye
ar
Ty
pe
3
(En
ter
C f
or
Ca
len
da
r Y
ea
r
an
d F
fo
r
Fin
an
cia
l Y
ea
r)
Ha
s y
ou
r L
A
ac
hie
ve
d i
ts
LT
P1
ta
rge
t
for
this
co
re
ind
ica
tor?
Ple
as
e i
nd
ica
te i
f y
ou
r re
po
rte
d o
r
targ
et
fig
ure
s h
av
e c
ha
ng
ed
sin
ce
yo
u p
rev
iou
sly
re
po
rte
d.
Ple
as
e o
utl
ine
th
e m
eth
od
olo
gy
an
d
so
urc
e o
f d
ata
us
ed
to
ca
lcu
late
yo
ur
fig
ure
s.
Als
o i
nc
lud
e a
ny
oth
er
rele
va
nt
info
rma
tio
n.
Ba
se
Da
ta1
19
99
/20
00
15
%F
Ye
ar
20
00
/01
20
01
/02
20
02
/03
20
03
/04
20
04
/05
20
05
/06
Ac
hie
ve
d
Ta
rge
t
Da
ta2
20
05
/06
36
%A
ctu
al
Fig
ure
s2
1%
23
%2
0%
20
%3
6%
10
%
Un
its
Pe
rce
nta
ge
Tra
jec
tori
es
36
%
Ba
se
Da
ta1
19
99
/20
00
19
%F
Ye
ar
20
00
/01
20
01
/02
20
02
/03
20
03
/04
20
04
/05
20
05
/06
Ac
hie
ve
d
Ta
rge
t
Da
ta2
20
05
/06
33
%A
ctu
al
Fig
ure
sN
ot
Co
llecte
d4
6%
21
%2
1%
22
%
Un
its
Pe
rce
nta
ge
Tra
jec
tori
es
46
%4
2%
38
%3
3%
Ba
se
Da
ta1
20
02
/03
53
%F
Ye
ar
20
00
/01
20
01
/02
20
02
/03
20
03
/04
20
04
/05
20
05
/06
Ac
hie
ve
d
Ta
rge
t
Da
ta2
20
05
/06
35
%A
ctu
al
Fig
ure
sN
ot
Co
llecte
d5
3%
16
%1
4%
5%
Un
its
Pe
rce
nta
ge
Tra
jec
tori
es
53
%4
7%
41
%3
5%
Ba
se
Da
ta1
20
01
/02
9,1
84
,37
5F
Ye
ar
20
00
/01
20
01
/02
20
02
/03
20
03
/04
20
04
/05
20
05
/06
Ac
hie
ve
d
Ta
rge
t
Da
ta2
20
05
/06
9,6
43
,59
4A
ctu
al
Fig
ure
s9
,18
4,3
75
9,6
25
,49
89
,74
9,1
78
9,8
78
,81
91
0,3
31
,15
3
Un
its
Nu
mb
er
Tra
jec
tori
es
9,1
84
,37
59
,29
9,1
80
94
,13
2,9
84
9,5
28
,78
99
,64
3,5
94
Ba
th &
No
rth
-Ea
st
So
me
rse
t
Th
ou
sa
nd
s o
f b
us
pa
sse
ng
er
jou
rne
ys (
i.e
.
bo
ard
ing
s)
pe
r ye
ar
in
the
au
tho
rity
- B
V1
02
Se
lec
t y
ou
r L
A f
rom
th
e d
rop
do
wn
lis
t (C
lic
k i
n y
ell
ow
bo
x a
nd
us
e t
he
dro
p d
ow
n a
rro
w).
Ac
tua
l a
nd
Tra
jec
tory
Da
ta2
Ro
ad
Co
nd
itio
n
(% w
he
re
str
uctu
ral
ma
inte
na
nce
sh
ou
ld b
e
co
nsid
ere
d)4
(1)
prin
cip
al ro
ad
s -
BV
22
3
(2)
no
n-p
rin
cip
al ro
ad
s -
BV
22
4a
(3)
un
cla
ssifie
d r
oa
ds -
BV
22
4b
(B
V9
7b
)
Nu
mb
er
of
bu
s
pa
sse
ng
er
jou
rne
ys
5
No
t a
pp
lica
ble
Fig
ure
s b
ase
d o
n C
oa
rse
Vis
ua
l
Insp
ectio
n (
CV
I )
da
ta,
(10
0%
of
B a
nd
C r
oa
ds s
urv
eye
d).
Tra
jecto
ry d
ata
no
w e
xp
resse
d a
s
actu
al n
um
be
rs t
o f
acili
tate
co
mp
ariso
n
with
actu
al p
rog
ress.
Pa
tro
na
ge
da
ta p
rovid
ed
to
th
e C
ou
ncil
by b
us o
pe
rato
rs.
A n
ew
targ
et tr
aje
cto
ry h
as b
een
develo
ped, (n
o o
vera
ll dete
riora
tion b
y
2005/0
6),
follo
win
g the tra
nsitio
n to
SC
AN
NE
R s
urv
eys, (S
urf
ace C
onditio
n
Assessm
ent of th
e N
ational N
etw
ork
of
Roads),
in 2
004/0
5. F
igure
s p
rior
to
2004/0
5 w
ere
based o
n d
eflecto
gra
ph
surv
eys a
nd a
re n
ot com
para
ble
with the
late
st figure
s.
2004/0
5 fig
ure
based o
n d
ata
fro
m
SC
AN
NE
R s
urv
eys (
100%
of A
roads
surv
eyed in b
oth
directions).
T
he 1
0%
figure
is c
onsid
ere
d r
epre
senta
tive o
f th
e
netw
ork
conditio
n d
erived fro
m h
alf o
f th
e
netw
ork
surv
eyed in 0
4 a
naly
sed to n
ew
princip
les a
nd o
ther
half o
f netw
ork
surv
eyed in 0
5.
No
t a
pp
lica
ble
Fig
ure
s b
ase
d o
n C
oa
rse
Vis
ua
l
Insp
ectio
n (
CV
I )
da
ta,
(10
0%
of
B a
nd
C r
oa
ds s
urv
eye
d).
Prof
orm
a A
- Ba
th a
nd N
orth
Eas
tSom
erse
t

96
Co
re I
nd
ica
tor
De
fin
itio
ns
Ye
ar
Va
lue
Ye
ar
Ty
pe
3
(En
ter
C f
or
Ca
len
da
r Y
ea
r
an
d F
fo
r
Fin
an
cia
l Y
ea
r)
Ha
s y
ou
r L
A
ac
hie
ve
d i
ts
LT
P1
ta
rge
t
for
this
co
re
ind
ica
tor?
Ple
as
e i
nd
ica
te i
f y
ou
r re
po
rte
d o
r
targ
et
fig
ure
s h
av
e c
ha
ng
ed
sin
ce
yo
u p
rev
iou
sly
re
po
rte
d.
Ple
as
e o
utl
ine
th
e m
eth
od
olo
gy
an
d
so
urc
e o
f d
ata
us
ed
to
ca
lcu
late
yo
ur
fig
ure
s.
Als
o i
nc
lud
e a
ny
oth
er
rele
va
nt
info
rma
tio
n.
Ac
tua
l a
nd
Tra
jec
tory
Da
ta2
Ro
ad
Co
nd
itio
n
(% w
he
re
str
uctu
ral
ma
inte
na
nce
sh
ou
ld b
e
4
(1)
prin
cip
al ro
ad
s -
BV
22
3
A n
ew
targ
et tr
aje
cto
ry h
as b
een
develo
ped, (n
o o
vera
ll dete
riora
tion b
y
2005/0
6),
follo
win
g the tra
nsitio
n to
SC
AN
NE
R s
urv
eys, (S
urf
ace C
onditio
n
Assessm
ent of th
e N
ational N
etw
ork
of
Roads),
in 2
004/0
5. F
igure
s p
rior
to
surv
eyed in b
oth
directions).
T
he 1
0%
B
as
e
Da
ta1
20
03
2,2
05
CY
ea
r2
00
02
00
12
00
22
00
32
00
42
00
5N
ot
Ac
hie
ve
d
Ta
rge
t
Da
ta2
20
05
2,3
37
Ac
tua
l F
igu
res
1,7
42
1,9
43
2,2
28
2,2
05
2,2
74
2,2
86
Un
its
Nu
mb
er
Tra
jec
tori
es
2,2
05
2,2
71
2,3
37
Ba
se
Da
ta1
19
94
-19
98
A
ve
rag
e7
1C
Ye
ar
20
00
20
01
20
02
20
03
20
04
20
05
No
t o
n T
rac
k
Ta
rge
t
Da
ta2
20
10
43
Ac
tua
l F
igu
res
79
61
67
79
71
71
Un
its
Nu
mb
er
Tra
jec
tori
es
71
68
65
62
60
57
Ba
se
Da
ta1
19
94
-19
98
A
ve
rag
e9
CY
ea
r2
00
02
00
12
00
22
00
32
00
42
00
5O
n T
rac
k
Ta
rge
t
Da
ta2
20
10
5A
ctu
al
Fig
ure
s9
78
10
84
Un
its
Nu
mb
er
Tra
jec
tori
es
99
88
77
Ba
se
Da
ta1
Ye
ar
Ta
rge
t
Da
ta2
Ac
tua
l F
igu
res
Un
its
Tra
jec
tori
es
Ba
se
Da
ta1
20
01
49
.10
%C
Ye
ar
20
00
20
01
20
02
20
03
20
04
20
05
No
t o
n T
rac
k
Ta
rge
t
Da
ta2
20
10
65
.50
%A
ctu
al
Fig
ure
s4
9.1
0%
52
.10
%5
2.3
0%
52
.40
%5
2.3
0%
Un
its
Pe
rce
nta
ge
Tra
jec
tori
es
53
.90
%5
5.9
0%
Nu
mb
er
of
ch
ildre
n k
ille
d
an
d s
erio
usly
inju
red
6
Lig
ht
rail
pa
sse
ng
er
jou
rne
ys
7
% o
f ru
ral
ho
use
ho
lds
with
in 1
3
min
ute
s w
alk
of
an
ho
urly o
r
be
tte
r b
us
se
rvic
e7
Nu
mb
er
of
ch
ildre
n
(ag
ed
le
ss t
ha
n 1
6)
kill
ed
or
se
rio
usly
in
jure
d
in t
he
au
tho
rity
Th
ou
sa
nd
s o
f lig
ht
rail
pa
sse
ng
ers
pe
r ye
ar
% o
f ru
ral8 h
ou
se
ho
lds
with
in 1
3 m
inu
tes w
alk
of
an
ho
urly o
r b
ett
er
bu
s s
erv
ice
or
% o
f
rura
l8 h
ou
se
ho
lds w
ith
in
80
0 m
etr
es o
f a
n h
ou
rly
or
be
tte
r b
us s
erv
ice
(ple
ase
sta
te w
hic
h)
Nu
mb
er
of
cyclin
g t
rip
s
acro
ss t
he
au
tho
rity
or
nu
mb
er
of
cyclin
g t
rip
s
at
a r
ep
rese
nta
tive
nu
mb
er
of
co
un
tin
g
po
ints
(p
lea
se
sta
te
wh
ich
)
Nu
mb
er
of
pe
op
le k
ille
d
or
se
rio
usly
in
jure
d o
n
roa
ds in
th
e a
uth
ority
Nu
mb
er
of
de
ath
s a
nd
se
rio
us in
jurie
s
(all
ag
es)6
Nu
mb
er
of
cyclin
g t
rip
s
Fu
rth
er
to t
he
im
ple
me
nta
tio
n o
f n
ew
accid
en
t d
ata
ba
se
so
ftw
are
, a
ctu
al
fig
ure
s p
revio
usly
re
po
rte
d h
ave
be
en
ch
ecke
d f
or
accu
racy a
nd
co
rre
cte
d
wh
ere
ap
pro
pria
te.
Th
e t
arg
et
tra
jecto
ry
ha
s a
lso
be
en
co
rre
cte
d t
o s
ho
w a
line
ar
40
% d
ecre
ase
in
KS
I b
etw
ee
n
20
00
an
d 2
01
0.
Actu
al ra
w c
asu
alty f
igu
res r
ela
te t
o a
ll
roa
ds in
th
e a
uth
ority
are
a (
inclu
din
g
Tru
nk R
oa
ds)
an
d a
re p
rovid
ed
by A
vo
n
an
d S
om
ers
et
Co
nsta
bu
lary
('S
TA
TS
19
' da
ta).
No
t a
pp
lica
ble
.T
he
co
llatio
n o
f th
is d
ata
is u
nd
ert
ake
n
by t
he
Jo
int
Str
ate
gic
Pla
nn
ing
an
d
Tra
nsp
ort
atio
n U
nit.
Da
ta r
ela
tes t
o t
he
% o
f ru
ral h
ou
se
ho
lds w
ith
in 1
3 m
inu
tes
wa
lk o
f a
n h
ou
rly o
r b
ett
er
bu
s s
erv
ice
.
Fu
rth
er
to t
he
im
ple
me
nta
tio
n o
f n
ew
accid
en
t d
ata
ba
se
so
ftw
are
, a
ctu
al
fig
ure
s p
revio
usly
re
po
rte
d h
ave
be
en
ch
ecke
d f
or
accu
racy a
nd
co
rre
cte
d
wh
ere
ap
pro
pria
te.
Th
e t
arg
et
tra
jecto
ry
ha
s a
lso
be
en
co
rre
cte
d t
o s
ho
w a
line
ar
50
% d
ecre
ase
in
KS
I b
etw
ee
n
20
00
an
d 2
01
0.
Actu
al ra
w c
asu
alty f
igu
res r
ela
te t
o a
ll
roa
ds in
th
e a
uth
ority
are
a (
inclu
din
g
Tru
nk R
oa
ds)
an
d a
re p
rovid
ed
by A
vo
n
an
d S
om
ers
et
Co
nsta
bu
lary
('S
TA
TS
19
' da
ta).
No
t a
pp
lica
ble
to
th
is a
uth
ority
.
Targ
et re
-based a
nd r
evis
ed to 3
%
incre
ase p
er
annum
on 2
003 b
ase u
ntil th
e
end o
f th
e first Local T
ransport
Pla
n p
eriod,
follo
win
g a
susta
ined incre
ase in c
yclin
g,
(31%
sin
ce 2
000).
This
repla
ces the
pre
vio
us targ
et w
hic
h w
as b
ased o
n the
national cycle
targ
et, (
by 2
010 to triple
the
num
ber
of cycle
trips o
n 2
000 b
ase).
G
overn
ment O
ffic
e for
the S
outh
West
(GO
SW
) support
ed the a
doption o
f th
e
revis
ed targ
et.
Da
ta s
ho
wn
are
an
nu
al a
ve
rag
e 1
2-
ho
ur
we
ekd
ay c
ycle
mo
ve
me
nts
at
25
on
an
d o
ff-r
oa
d c
ycle
mo
nito
rin
g s
ite
s
on
th
e B
ath
In
ne
r a
nd
Ou
ter
Co
rdo
ns,
an
d a
t S
altfo
rd a
nd
Ne
wb
rid
ge
on
th
e
Bristo
l to
Ba
th R
ailw
ay P
ath
.
Prof
orm
a A
- Ba
th a
nd N
orth
Eas
tSom
erse
t

97
Co
re I
nd
ica
tor
De
fin
itio
ns
Ye
ar
Va
lue
Ye
ar
Ty
pe
3
(En
ter
C f
or
Ca
len
da
r Y
ea
r
an
d F
fo
r
Fin
an
cia
l Y
ea
r)
Ha
s y
ou
r L
A
ac
hie
ve
d i
ts
LT
P1
ta
rge
t
for
this
co
re
ind
ica
tor?
Ple
as
e i
nd
ica
te i
f y
ou
r re
po
rte
d o
r
targ
et
fig
ure
s h
av
e c
ha
ng
ed
sin
ce
yo
u p
rev
iou
sly
re
po
rte
d.
Ple
as
e o
utl
ine
th
e m
eth
od
olo
gy
an
d
so
urc
e o
f d
ata
us
ed
to
ca
lcu
late
yo
ur
fig
ure
s.
Als
o i
nc
lud
e a
ny
oth
er
rele
va
nt
info
rma
tio
n.
Ba
se
Da
ta1
FY
ea
r2
00
0/0
12
00
1/0
22
00
2/0
32
00
3/0
42
00
4/0
52
00
5/0
6A
ch
iev
ed
Ta
rge
t
Da
ta2
Ac
tua
l F
igu
res
0.3
71
4.7
14
.74
2.8
11
.1
Un
its
Pe
rce
nt
Tra
jec
tori
es
12
Ba
se
Da
ta1
FY
ea
r2
00
0/0
12
00
1/0
22
00
2/0
32
00
3/0
42
00
4/0
52
00
5/0
6A
ch
iev
ed
Ta
rge
t
Da
ta2
Ac
tua
l F
igu
res
0.7
5.3
26
.82
6.8
2.1
89
Un
its
Pe
rce
nt
Tra
jec
tori
es
12
Ba
se
Da
ta1
FY
ea
r2
00
0/0
12
00
1/0
22
00
2/0
32
00
3/0
42
00
4/0
52
00
5/0
6N
ot
Ac
hie
ve
d
Ta
rge
t
Da
ta2
Ac
tua
l F
igu
res
15
.97
4.6
51
8.3
Un
its
Pe
rce
nt
Tra
jec
tori
es
12
Ba
se
Da
ta1
20
00
/01
33
70
0F
Ye
ar
20
00
/01
20
01
/02
20
02
/03
20
03
/04
20
04
/05
20
05
/06
No
t o
n T
rac
k
Ta
rge
t
Da
ta2
20
10
/11
37
75
0A
ctu
al
Fig
ure
s3
37
00
32
05
03
20
60
33
32
03
21
50
31
15
7
Un
its
Th
ou
sa
nd
sT
raje
cto
rie
s3
37
00
33
74
03
38
70
34
07
03
43
50
34
72
0
Ba
se
Da
ta1
20
00
/01
16
18
3F
Ye
ar
20
00
/01
20
01
/02
20
02
/03
20
03
/04
20
04
/05
20
05
/06
No
t o
n T
rac
k
Ta
rge
t
Da
ta2
20
10
/11
48
54
9A
ctu
al
Fig
ure
s1
61
83
18
09
01
72
35
20
60
82
22
69
23
50
0
Un
its
Ab
so
lute
nu
mb
ers
Tra
jec
tori
es
16
18
31
65
00
17
50
01
91
00
21
40
02
43
00
Th
e m
eth
od
olo
gy u
se
d a
s p
rescrib
ed
for
Be
st
Va
lue
pu
rpo
se
s h
as b
ee
n
co
nsta
ntly e
vo
lvin
g,
the
refo
re n
o t
ren
ds
ca
n r
ea
so
na
bly
be
asse
sse
d o
n t
he
ne
w in
dic
ato
r d
ata
, a
nd
ne
w t
arg
et
tra
jecto
rie
s a
re y
et
to b
e d
ete
rmin
ed
Th
e m
eth
od
olo
gy u
se
d a
s p
rescrib
ed
for
Be
st
Va
lue
pu
rpo
se
s h
as b
ee
n
co
nsta
ntly e
vo
lvin
g,
the
refo
re n
o t
ren
ds
ca
n r
ea
so
na
bly
be
asse
sse
d o
n t
he
ne
w in
dic
ato
r d
ata
, a
nd
ne
w t
arg
et
tra
jecto
rie
s a
re y
et
to b
e d
ete
rmin
ed
Ma
nu
al a
nd
au
tom
atic c
ycle
su
rve
ys a
t
rep
rese
nta
tive
sa
mp
le o
f site
s a
nd
scre
en
line
s a
cro
ss t
he
city.
Th
e m
eth
od
olo
gy u
se
d a
s p
rescrib
ed
for
Be
st
Va
lue
pu
rpo
se
s h
as b
ee
n
co
nsta
ntly e
vo
lvin
g,
the
refo
re n
o t
ren
ds
ca
n r
ea
so
na
bly
be
asse
sse
d o
n t
he
ne
w in
dic
ato
r d
ata
, a
nd
ne
w t
arg
et
tra
jecto
rie
s a
re y
et
to b
e d
ete
rmin
ed
Da
ta c
olle
cte
d f
rom
op
era
tors
fo
r w
ho
le
of
loca
l a
uth
ority
are
a a
s p
er
req
uire
me
nts
Ac
tua
l a
nd
Tra
jec
tory
Da
ta2
Ro
ad
Co
nd
itio
n (
%
wh
ere
str
uctu
ral
ma
inte
na
nce
sh
ou
ld b
e
co
nsid
ere
d)4
Nu
mb
er
of
cyclin
g t
rip
s
(1)
prin
cip
al ro
ad
s -
BV
22
3
(2)
no
n-p
rin
cip
al ro
ad
s -
BV
22
4a
(3)
un
cla
ssifie
d r
oa
ds -
BV
22
4b
(B
V9
7b
)
Nu
mb
er
of
bu
s
pa
sse
ng
er
jou
rne
ys5
Bri
sto
l C
ity
Th
ou
sa
nd
s o
f b
us
pa
sse
ng
er
jou
rne
ys (
i.e
.
bo
ard
ing
s)
pe
r ye
ar
in
the
au
tho
rity
- B
V1
02
Nu
mb
er
of
cyclin
g t
rip
s
at
a r
ep
rese
nta
tive
nu
mb
er
of
co
un
tin
g
po
ints
Se
lec
t y
ou
r L
A f
rom
th
e d
rop
do
wn
lis
t (C
lic
k i
n y
ell
ow
bo
x a
nd
us
e t
he
dro
p d
ow
n a
rro
w).
Prof
orm
a A
- Br
isto
l

98
Co
re I
nd
ica
tor
De
fin
itio
ns
Ye
ar
Va
lue
Ye
ar
Ty
pe
3
(En
ter
C f
or
Ca
len
da
r Y
ea
r
an
d F
fo
r
Fin
an
cia
l Y
ea
r)
Ha
s y
ou
r L
A
ac
hie
ve
d i
ts
LT
P1
ta
rge
t
for
this
co
re
ind
ica
tor?
Ple
as
e i
nd
ica
te i
f y
ou
r re
po
rte
d o
r
targ
et
fig
ure
s h
av
e c
ha
ng
ed
sin
ce
yo
u p
rev
iou
sly
re
po
rte
d.
Ple
as
e o
utl
ine
th
e m
eth
od
olo
gy
an
d
so
urc
e o
f d
ata
us
ed
to
ca
lcu
late
yo
ur
fig
ure
s.
Als
o i
nc
lud
e a
ny
oth
er
rele
va
nt
info
rma
tio
n.
Th
e m
eth
od
olo
gy u
se
d a
s p
rescrib
ed
for
Be
st
Va
lue
pu
rpo
se
s h
as b
ee
n
co
nsta
ntly e
vo
lvin
g,
the
refo
re n
o t
ren
ds
ne
w in
dic
ato
r d
ata
, a
nd
ne
w t
arg
et
tra
jecto
rie
s a
re y
et
to b
e d
ete
rmin
ed
Ac
tua
l a
nd
Tra
jec
tory
Da
ta2
Ro
ad
Co
nd
itio
n (
%
4
(1)
prin
cip
al ro
ad
s -
BV
22
3B
as
e
Da
ta1
Se
e R
igh
t1
77
CY
ea
r2
00
02
00
12
00
22
00
32
00
42
00
5N
ot
on
Tra
ck
Ta
rge
t
Da
ta2
20
10
10
6A
ctu
al
Fig
ure
s1
75
18
02
43
19
72
28
17
8
Un
its
Ab
so
lute
nu
mb
ers
Tra
jec
tori
es
17
11
64
15
81
42
13
41
26
Ba
se
Da
ta1
Se
e R
igh
t2
9.6
CY
ea
r2
00
02
00
12
00
22
00
32
00
42
00
5N
ot
on
Tra
ck
Ta
rge
t
Da
ta2
20
10
15
Ac
tua
l F
igu
res
30
27
34
23
24
25
Un
its
Ab
so
lute
nu
mb
ers
Tra
jec
tori
es
28
27
26
24
23
22
Ba
se
Da
ta1
Ye
ar
Ta
rge
t
Da
ta2
Ac
tua
l F
igu
res
Un
its
Tra
jec
tori
es
Ba
se
Da
ta1
Ye
ar
Ta
rge
t
Da
ta2
Ac
tua
l F
igu
res
Un
its
Tra
jec
tori
es
Da
ta f
rom
po
lice
an
d lo
ca
l a
uth
ority
accid
en
t sta
tistics.
Ba
se
Ye
ar
= 1
99
4-1
99
8 A
ve
rag
e
Fig
ure
s in
clu
de
mo
torw
ay a
nd
tru
nk
roa
d n
etw
ork
IND
ICA
TO
R N
OT
AP
PL
ICA
BL
E
Da
ta f
rom
po
lice
an
d lo
ca
l a
uth
ority
accid
en
t sta
tistics.
Ba
se
Ye
ar
= 1
99
4-1
99
8 A
ve
rag
e
Fig
ure
s in
clu
de
mo
torw
ay a
nd
tru
nk
roa
d n
etw
ork
IND
ICA
TO
R N
OT
AP
PL
ICA
BL
E
Nu
mb
er
of
pe
op
le k
ille
d
or
se
rio
usly
in
jure
d o
n
roa
ds in
th
e a
uth
ority
Nu
mb
er
of
de
ath
s a
nd
se
rio
us in
jurie
s
(all
ag
es)6
Nu
mb
er
of
ch
ildre
n k
ille
d
an
d s
erio
usly
inju
red
6
Lig
ht
rail
pa
sse
ng
er
jou
rne
ys7
% o
f ru
ral
ho
use
ho
lds
with
in 1
3
min
ute
s w
alk
of
an
ho
urly o
r
be
tte
r b
us
se
rvic
e7
Nu
mb
er
of
ch
ildre
n
(ag
ed
le
ss t
ha
n 1
6)
kill
ed
or
se
rio
usly
inju
red
in
th
e a
uth
ority
Th
ou
sa
nd
s o
f lig
ht
rail
pa
sse
ng
ers
pe
r ye
ar
% o
f ru
ral8 h
ou
se
ho
lds
with
in 1
3 m
inu
tes w
alk
of
an
ho
urly o
r b
ett
er
bu
s s
erv
ice
Prof
orm
a A
- Br
isto
l

99
Co
re In
dic
ato
rD
efi
nit
ion
sY
ear
Valu
e
Year
Typ
e3
(Ente
r C
for
Cale
ndar
Year
and F
for
Fin
ancia
l Y
ear)
Has y
ou
r L
A
ach
ieved
its
LT
P1 t
arg
et
for
this
co
re
ind
icato
r?
Ple
ase in
dic
ate
if
yo
ur
rep
ort
ed
or
targ
et
fig
ure
s h
ave c
han
ged
sin
ce
yo
u p
revio
usly
rep
ort
ed
.
Ple
ase o
utl
ine t
he m
eth
od
olo
gy a
nd
so
urc
e o
f d
ata
used
to
calc
ula
te y
ou
r
fig
ure
s. A
lso
in
clu
de a
ny o
ther
rele
van
t in
form
ati
on
.
Base
Data
11998/9
913.0
6%
FY
ear
2000/0
12001/0
22002/0
32003/0
42004/0
52005/0
6A
ch
ieved
Targ
et
Data
22005/0
66.0
0%
Actu
al F
igu
res
10.6
0%
15.4
9%
10.8
0%
9.3
0%
5.9
4%
5.1
8%
Un
its
Perc
enta
ge
Tra
jecto
ries
10.6
0%
15.4
9%
10.8
0%
9.3
0%
7.5
0%
6.0
0%
Base
Data
12002/0
340.4
0%
FY
ear
2000/0
12001/0
22002/0
32003/0
42004/0
52005/0
6A
ch
ieved
Targ
et
Data
22005/0
634.0
0%
Actu
al F
igu
res
40.4
0%
25.5
6%
12.9
8%
12.0
0%
Un
its
Perc
enta
ge
Tra
jecto
ries
40.4
0%
38.0
0%
36.0
0%
34.0
0%
Base
Data
12002/0
325.1
0%
FY
ear
2000/0
12001/0
22002/0
32003/0
42004/0
52005/0
6A
ch
ieved
Targ
et
Data
22005/0
617.6
0%
Actu
al F
igu
res
25.1
0%
13.8
1%
8.6
4%
8.6
4%
Un
its
Perc
enta
ge
Tra
jecto
ries
25.1
0%
25.1
0%
22.0
0%
17.6
0%
Base
Data
12001/0
24167
FY
ear
2000/0
12001/0
22002/0
32003/0
42004/0
52005/0
6N
ot
on
Tra
ck
Targ
et
Data
22010/1
14583
Actu
al F
igu
res
4167
4187
4457
4424
4242
Un
its
Thousands
Tra
jecto
ries
4167
4193
4219
4253
4289
Deflecto
gra
ph fig
ure
s a
re u
sed a
s the
traje
cto
ries w
ere
based o
n this
meth
odolo
gy. U
nder
the S
CA
NN
ER
meth
od the r
esult is 7
.00%
Data
fro
m o
pera
tors
- s
ee a
dja
cent
note
.
This
tota
l in
clu
des a
n e
stim
ate
of
patr
onage w
ith r
egard
s to o
ne o
pera
tor
whic
h is b
ased o
n o
ur
bus s
urv
eys for
the s
urv
ice, as the a
uth
ority
has n
o
confidence in the o
pera
tor's fig
ure
s.
(Although it should
be n
ote
d that th
e
estim
ate
d fig
ure
only
makes u
p
appro
xim
ate
ly 0
.19%
of th
e tota
l
patr
onage r
eport
ed.
Actu
al an
d T
raje
cto
ry D
ata
2
Road C
onditio
n
(% w
here
str
uctu
ral
main
tenance
should
be
consid
ere
d)4
(1)
princip
al ro
ads -
BV
223
(2)
non-p
rincip
al ro
ads -
BV
224a
(3)
uncla
ssifie
d r
oads -
BV
224b (
BV
97b)
Num
ber
of bus
passenger
journ
eys
5
No
rth
So
mers
et
Thousands o
f bus
passenger
journ
eys (
i.e.
board
ings)
per
year
in
the a
uth
ority
- B
V102
Sele
ct
yo
ur
LA
fro
m t
he d
rop
do
wn
list
(Click in
yello
w b
ox a
nd
use t
he
dro
p d
ow
n a
rro
w).
Prof
orm
a A
- N
orth
Som
erse
t

100
Co
re In
dic
ato
rD
efi
nit
ion
sY
ear
Valu
e
Year
Typ
e3
(Ente
r C
for
Cale
ndar
Year
and F
for
Fin
ancia
l Y
ear)
Has y
ou
r L
A
ach
ieved
its
LT
P1 t
arg
et
for
this
co
re
ind
icato
r?
Ple
ase in
dic
ate
if
yo
ur
rep
ort
ed
or
targ
et
fig
ure
s h
ave c
han
ged
sin
ce
yo
u p
revio
usly
rep
ort
ed
.
Ple
ase o
utl
ine t
he m
eth
od
olo
gy a
nd
so
urc
e o
f d
ata
used
to
calc
ula
te y
ou
r
fig
ure
s. A
lso
in
clu
de a
ny o
ther
rele
van
t in
form
ati
on
.
Deflecto
gra
ph fig
ure
s a
re u
sed a
s the
traje
cto
ries w
ere
based o
n this
meth
odolo
gy. U
nder
the S
CA
NN
ER
meth
od the r
esult is 7
.00%
Actu
al an
d T
raje
cto
ry D
ata
2
4
(1)
princip
al ro
ads -
BV
223
Base
Data
11999/0
04919
FY
ear
2000/0
12001/0
22002/0
32003/0
42004/0
52005/0
6N
ot
on
Tra
ck
Targ
et
Data
22010/1
19838
Actu
al F
igu
res
5302
4303
4388
5179
5355
5230
Un
its
Actu
al
Tra
jecto
ries
4968
5087
5260
5492
5788
6159
Base
Data
11994-9
898
CY
ear
2000
2001
2002
2003
2004
2005
On
Tra
ck
Targ
et
Data
22010/1
159
Actu
al F
igu
res
85
85
118
111
111
80
Un
its
Actu
al
Tra
jecto
ries
92
89
86
83
81
78
Base
Data
11994-9
810
CY
ear
2000
2001
2002
2003
2004
2005
On
Tra
ck
Targ
et
Data
22010/1
15
Actu
al F
igu
res
611
10
99
8
Un
its
Actu
al
Tra
jecto
ries
99
88
88
Base
Data
1Y
ear
Targ
et
Data
2A
ctu
al F
igu
res
Un
its
Tra
jecto
ries
Base
Data
12001/0
224.5
0%
FY
ear
2000/0
12001/0
22002/0
32003/0
42004/0
52005/0
6O
n T
rack
Targ
et
Data
22010/1
133.9
0%
Actu
al F
igu
res
24.5
0%
24.5
0%
24.5
0%
24.5
0%
24.5
0%
24.5
0%
Un
its
Perc
enta
ge
Tra
jecto
ries
24.5
0%
24.5
0%
24.5
0%
24.5
0%
24.5
0%
24.5
0%
As the n
um
ber
of accid
ents
reduces
year
on y
ear
the m
ore
vuln
era
ble
the
targ
et is
to m
inor
fluctu
ations. W
e h
ave
consid
ere
d b
est pra
ctice in this
fie
ld a
nd
consid
er
the H
ighw
ays A
gency's
(Busin
ess P
lan 2
006/0
7)
appro
ach o
f
accura
cy w
ithin
a +
/- 5
% m
arg
in to b
e
sensis
ble
. O
n this
basis
the targ
et is
on
track.
Accid
ent data
fro
m A
von &
Som
ers
et
Consta
bula
ry.
Targ
ets
rem
ain
the s
am
e, but data
has
been c
hanged to 3
-year
rolli
ng
avera
ges to o
verc
om
e the larg
e
perc
enta
ge v
ariations y
ear-
on-y
ear,
whic
h a
llow
s a
tre
nd to b
e identified.
Accid
ent data
fro
m A
von &
Som
ers
et
Consta
bula
ry. F
rom
2002 o
nw
ard
s the
figure
s a
re s
how
n a
s thre
e-y
ear
rolli
ng
avera
ges, as d
iscussed w
ith G
OS
W.
Not applic
able
in N
ort
h S
om
ers
et.
Num
ber
of people
kill
ed
or
seriously
inju
red o
n
roads in the a
uth
ority
Num
ber
of
death
s a
nd
serious inju
ries
(all
ages)6
Num
ber
of
cyclin
g trips
Num
ber
of cyclin
g trips
acro
ss the a
uth
ority
or
num
ber
of cyclin
g trips
at a r
epre
senta
tive
num
ber
of counting
poin
ts (
ple
ase s
tate
whic
h)
Num
ber
of
child
ren k
illed
and s
eriously
inju
red
6
Lig
ht ra
il
passenger
journ
eys
7
% o
f ru
ral
household
s
within
13
min
ute
s w
alk
of
an h
ourly o
r
better
bus
serv
ice
7
Num
ber
of child
ren
(aged less than 1
6)
kill
ed o
r seriously
inju
red
in the a
uth
ority
Thousands o
f lig
ht ra
il
passengers
per
year
% o
f ru
ral8 h
ousehold
s
within
13 m
inute
s w
alk
of an h
ourly o
r better
bus s
erv
ice o
r %
of
rura
l8 h
ousehold
s w
ithin
800 m
etr
es o
f an h
ourly
or
better
bus s
erv
ice
(ple
ase s
tate
whic
h)
Prof
orm
a A
- N
orth
Som
erse
t

101
Co
re I
nd
ica
tor
De
fin
itio
ns
Ye
ar
Va
lue
Ye
ar
Ty
pe
3
(En
ter
C f
or
Ca
len
da
r Y
ea
r
an
d F
fo
r
Fin
an
cia
l Y
ea
r)
Ha
s y
ou
r L
A
ac
hie
ve
d i
ts
LT
P1
ta
rge
t
for
this
co
re
ind
ica
tor?
Ple
as
e i
nd
ica
te i
f y
ou
r re
po
rte
d o
r
targ
et
fig
ure
s h
av
e c
ha
ng
ed
sin
ce
yo
u p
rev
iou
sly
re
po
rte
d.
Ple
as
e o
utl
ine
th
e m
eth
od
olo
gy
an
d
so
urc
e o
f d
ata
us
ed
to
ca
lcu
late
yo
ur
fig
ure
s.
Als
o i
nc
lud
e a
ny
oth
er
rele
va
nt
info
rma
tio
n.
Ba
se
Da
ta1
20
00
/01
21
.20
%F
Ye
ar
20
00
/01
20
01
/02
20
02
/03
20
03
/04
20
04
/05
20
05
/06
Ac
hie
ve
d
Ta
rge
t
Da
ta2
20
05
/06
17
.00
%A
ctu
al
Fig
ure
s2
1.2
0%
19
.41
%1
9.9
5%
19
.08
%3
3.1
1%
4.6
9%
Un
its
Ab
so
lute
Pe
rce
nta
ge
Tra
jec
tori
es
27
.00
%2
4.0
0%
20
.00
%1
8.0
0%
17
.00
%
Ba
se
Da
ta1
20
00
/01
28
.39
%F
Ye
ar
20
00
/01
20
01
/02
20
02
/03
20
03
/04
20
04
/05
20
05
/06
Ac
hie
ve
d
Ta
rge
t
Da
ta2
20
05
/06
25
.00
%A
ctu
al
Fig
ure
s2
8.3
9%
30
.72
%2
2.2
9%
17
.18
%8
.43
%
Un
its
Ab
so
lute
Pe
rce
nta
ge
Tra
jec
tori
es
27
.00
%2
6.0
0%
25
.00
%
Ba
se
Da
ta1
20
02
/03
18
.13
%F
Ye
ar
20
00
/01
20
01
/02
20
02
/03
20
03
/04
20
04
/05
20
05
/06
Ac
hie
ve
d
Ta
rge
t
Da
ta2
20
05
/06
18
.00
%A
ctu
al
Fig
ure
s1
8.1
3%
17
.29
%1
7.2
2%
4.7
1%
Un
its
Ab
so
lute
Pe
rce
nta
ge
Tra
jec
tori
es
20
.00
%1
9.0
0%
18
.00
%
Ba
se
Da
ta1
20
03
/04
7,7
00
,00
0F
Ye
ar
20
00
/01
20
01
/02
20
02
/03
20
03
/04
20
04
/05
20
05
/06
Ac
hie
ve
d
Ta
rge
t
Da
ta2
20
05
/06
7,9
00
,00
0A
ctu
al
Fig
ure
s7
,70
0,0
00
7,8
00
,00
08
,23
9,0
00
Un
its
Ab
so
lute
Fig
ure
sT
raje
cto
rie
s7
,70
0,0
00
7,8
00
,00
07
,90
0,0
00
So
uth
Glo
uc
es
ters
hir
e
Th
ou
sa
nd
s o
f b
us
pa
sse
ng
er
jou
rne
ys (
i.e
.
bo
ard
ing
s)
pe
r ye
ar
in
the
au
tho
rity
- B
V1
02
Se
lec
t y
ou
r L
A f
rom
th
e d
rop
do
wn
lis
t (C
lic
k i
n y
ell
ow
bo
x a
nd
us
e t
he
dro
p d
ow
n a
rro
w).
Ac
tua
l a
nd
Tra
jec
tory
Da
ta2
Ro
ad
Co
nd
itio
n (
%
wh
ere
str
uctu
ral
ma
inte
na
nce
sh
ou
ld b
e
co
nsid
ere
d)4
(1)
prin
cip
al ro
ad
s -
BV
22
3
(2)
no
n-p
rin
cip
al ro
ad
s -
BV
22
4a
(3)
un
cla
ssifie
d r
oa
ds -
BV
22
4b
(B
V9
7b
)
Nu
mb
er
of
bu
s
pa
sse
ng
er
jou
rne
ys5
An
nu
al R
oa
d C
on
ditio
n s
urv
ey u
sin
g
Co
ars
e V
isu
al In
sp
ectio
n,
in
acco
rda
nce
with
na
tio
na
l sta
nd
ard
s.
Th
is a
uth
ority
will
we
lco
me
th
e
intr
od
uctio
n o
f T
TS
to
pro
vid
e r
ob
ust
da
ta o
n o
ur
pro
gre
ss in
de
live
rin
g t
his
targ
et.
T
he
me
tho
do
log
y h
as n
ot
ch
an
ge
d s
ince
be
co
min
g B
VP
I 2
24
b,
Fro
m 2
00
3/0
4 b
us p
asse
ng
ers
co
un
ted
as b
oa
rde
rs (
no
t jo
urn
eys)
in lin
e w
ith
Au
dit C
om
mis
sio
n r
eco
mm
en
da
tio
n.
Actu
al a
nd
tra
jecto
ry f
igu
res a
dju
ste
d
acco
rdin
gly
.
Bu
s p
atr
on
ag
e in
form
atio
n c
olle
cte
d in
acco
rda
nce
with
BV
10
2.
Da
ta h
as
be
en
su
pp
lied
by b
us o
pe
rato
rs.
In a
cco
rda
nce
with
BV
PI
gu
ida
nce
th
e
crite
ria
wa
s m
od
ifie
d in
20
04
/05
, a
nd
ag
ain
in
20
05
/06
wh
en
th
e P
I b
eca
me
BV
PI
22
3.
An
nu
al R
oa
d C
on
ditio
n s
urv
ey u
sin
g
"TR
AC
S T
yp
e S
urv
ey"
(TT
S)
in
20
04
/05
an
d "
SC
AN
NE
R"
in 2
00
5/0
6,
in a
cco
rda
nce
with
na
tio
na
l sta
nd
ard
s.
Re
su
lts a
re c
olle
cte
d a
nn
ua
lly f
or
50
%
of
the
ne
two
rk.
In a
cco
rda
nce
with
BV
PI
gu
ida
nce
th
e
crite
ria
wa
s m
od
ifie
d in
20
05
/06
wh
en
the
PI
be
ca
me
BV
PI
22
4a
.
An
nu
al R
oa
d C
on
ditio
n s
urv
ey u
sin
g
Co
ars
e V
isu
al In
sp
ectio
n,
in
acco
rda
nce
with
na
tio
na
l sta
nd
ard
s.
Th
is a
uth
ority
we
lco
me
s t
he
intr
od
uctio
n o
f "S
CA
NN
ER
" in
20
05
/06
,
to p
rovid
e r
ob
ust
da
ta o
n o
ur
pro
gre
ss
in d
eliv
erin
g t
his
ta
rge
t.
Prof
orm
a A
- So
uth
Glo
uces
ters
hire

102
Co
re I
nd
ica
tor
De
fin
itio
ns
Ye
ar
Va
lue
Ye
ar
Ty
pe
3
(En
ter
C f
or
Ca
len
da
r Y
ea
r
an
d F
fo
r
Fin
an
cia
l Y
ea
r)
Ha
s y
ou
r L
A
ac
hie
ve
d i
ts
LT
P1
ta
rge
t
for
this
co
re
ind
ica
tor?
Ple
as
e i
nd
ica
te i
f y
ou
r re
po
rte
d o
r
targ
et
fig
ure
s h
av
e c
ha
ng
ed
sin
ce
yo
u p
rev
iou
sly
re
po
rte
d.
Ple
as
e o
utl
ine
th
e m
eth
od
olo
gy
an
d
so
urc
e o
f d
ata
us
ed
to
ca
lcu
late
yo
ur
fig
ure
s.
Als
o i
nc
lud
e a
ny
oth
er
rele
va
nt
info
rma
tio
n.
Ac
tua
l a
nd
Tra
jec
tory
Da
ta2
Ro
ad
Co
nd
itio
n (
%
wh
ere
str
uctu
ral
ma
inte
na
nce
sh
ou
ld b
e
4
(1)
prin
cip
al ro
ad
s -
BV
22
3
In a
cco
rda
nce
with
BV
PI
gu
ida
nce
th
e
crite
ria
wa
s m
od
ifie
d in
20
04
/05
, a
nd
ag
ain
in
20
05
/06
wh
en
th
e P
I b
eca
me
BV
PI
22
3.
An
nu
al R
oa
d C
on
ditio
n s
urv
ey u
sin
g
"TR
AC
S T
yp
e S
urv
ey"
(TT
S)
in
20
04
/05
an
d "
SC
AN
NE
R"
in 2
00
5/0
6,
of
the
ne
two
rk.
Ba
se
Da
ta1
20
00
10
0C
Ye
ar
20
00
20
01
20
02
20
03
20
04
20
05
Ac
hie
ve
d
Ta
rge
t
Da
ta2
20
05
12
5A
ctu
al
Fig
ure
s1
00
10
41
14
.91
17
.31
20
.31
28
.2
Un
its
Ind
ex R
ela
tive
to B
ase
of
10
0T
raje
cto
rie
s1
05
11
01
15
12
01
25
Ba
se
Da
ta1
19
94
-19
98
(Ave
rag
e)
12
3.6
CY
ea
r2
00
02
00
12
00
22
00
32
00
42
00
5O
n T
rac
k
Ta
rge
t
Da
ta2
20
10
74
.2A
ctu
al
Fig
ure
s1
22
12
91
27
11
11
15
10
1
Un
its
Ab
so
lute
Fig
ure
sT
raje
cto
rie
s1
23
.61
18
.71
13
.71
08
.81
03
.89
8.9
Ba
se
Da
ta1
19
94
-19
98
(Ave
rag
e)
12
.4C
Ye
ar
20
00
20
01
20
02
20
03
20
04
20
05
On
Tra
ck
Ta
rge
t
Da
ta2
20
10
6.2
Ac
tua
l F
igu
res
91
91
31
17
6
Un
its
Ab
so
lute
Fig
ure
sT
raje
cto
rie
s1
2.4
11
.81
1.2
10
.59
.99
.3
Ba
se
Da
ta1
Ye
ar
Ta
rge
t
Da
ta2
Ac
tua
l F
igu
res
Un
its
Tra
jec
tori
es
Ba
se
Da
ta1
20
01
58
.50
%C
Ye
ar
20
00
20
01
20
02
20
03
20
04
20
05
On
Tra
ck
Ta
rge
t
Da
ta2
20
10
78
.00
%A
ctu
al
Fig
ure
s5
8.5
0%
58
.50
%7
0.1
4%
78
.00
%7
8.0
0%
Un
its
Ab
so
lute
Pe
rce
nta
ge
Tra
jec
tori
es
60
.00
%6
4.0
0%
66
.00
%6
8.0
0%
Nu
mb
er
of
ch
ildre
n k
ille
d
an
d s
erio
usly
inju
red
6
Lig
ht
rail
pa
sse
ng
er
jou
rne
ys7
% o
f ru
ral
ho
use
ho
lds
with
in 1
3
min
ute
s w
alk
of
an
ho
urly o
r
be
tte
r b
us
se
rvic
e7
Nu
mb
er
of
ch
ildre
n
(ag
ed
le
ss t
ha
n 1
6)
kill
ed
or
se
rio
usly
inju
red
in
th
e a
uth
ority
Th
ou
sa
nd
s o
f lig
ht
rail
pa
sse
ng
ers
pe
r ye
ar
% o
f ru
ral8 h
ou
se
ho
lds
with
in 1
3 m
inu
tes w
alk
of
an
ho
urly o
r b
ett
er
bu
s s
erv
ice
Nu
mb
er
of
cyclin
g t
rip
s
at
a r
ep
rese
nta
tive
nu
mb
er
of
co
un
tin
g
po
ints
Nu
mb
er
of
pe
op
le k
ille
d
or
se
rio
usly
in
jure
d o
n
roa
ds in
th
e a
uth
ority
Nu
mb
er
of
de
ath
s a
nd
se
rio
us in
jurie
s
(all
ag
es)6
Nu
mb
er
of
cyclin
g t
rip
s
As t
he
nu
mb
er
of
accid
en
ts r
ed
uce
s
ye
ar
on
ye
ar
the
mo
re v
uln
era
ble
th
e
targ
et
is t
o m
ino
r flu
ctu
atio
ns.
We
ha
ve
co
nsid
ere
d b
est
pra
ctice
in
th
is
fie
ld a
nd
co
nsid
er
the
Hig
hw
ays
Ag
en
cy's
(B
usin
ess P
lan
20
06
/07
)
ap
pro
ach
of
accu
racy w
ith
in a
+/-
5%
ma
rgin
to
be
se
nsis
ble
. O
n t
his
ba
sis
the
ta
rge
t is
on
tra
ck.
Avo
n &
So
me
rse
t C
asu
alty d
ata
is
use
d f
or
this
in
dic
ato
r, in
clu
din
g
Mo
torw
ays a
nd
Tru
nk r
oa
ds in
So
uth
Glo
uce
ste
rsh
ire
.
Ru
ral b
us a
cce
ssib
ility
in
de
x c
alc
ula
ted
usin
g a
dd
ress p
oin
t a
nd
bu
s s
erv
ice
da
ta.
Fo
r 2
00
5 t
his
ta
rge
t is
on
tra
ck.
Usin
g
the
be
st
pra
ctice
of
the
Hig
hw
ays
Ag
en
cy (
Bu
sin
ess P
lan
20
06
/07
) o
f +
/-
5%
accu
racy t
he
20
05
Ch
ild K
SI
fig
ure
is m
ore
th
an
5%
be
low
th
e 2
01
0 t
arg
et.
On
th
is b
asis
th
e 2
01
0 t
arg
et
ha
s a
lso
be
en
ach
ieve
d.
Avo
n &
So
me
rse
t C
asu
alty d
ata
is
use
d f
or
this
in
dic
ato
r, in
clu
din
g
Mo
torw
ays a
nd
Tru
nk r
oa
ds in
So
uth
Glo
uce
ste
rsh
ire
.
Co
re I
nd
ica
tor
is n
ot
ap
plic
ab
le t
o
So
uth
Glo
uce
ste
rsh
ire
.
Ta
rge
t a
dju
ste
d a
nd
se
t a
s a
lo
ca
l
targ
et
in 2
00
3 f
ollo
win
g c
on
su
lta
tio
n.
Th
is in
dic
ato
r is
me
asu
red
as a
n
An
nu
al A
ve
rag
e W
ee
kd
ay T
ota
l
(AA
WT
).
Cyclin
g d
ata
is
co
llecte
d
fro
m a
re
pre
se
nta
tive
nu
mb
er
of
site
s.
Prof
orm
a A
- So
uth
Glo
uces
ters
hire

103
Joint Delivery Report
Glossary of TermsAPR Annual Progress Report
AQAP Air Quality Action Plan
AQMAs Air Quality Management Areas
ATF Air Transport Forum
BANA FQP Bristol And Neighbouring Authorities Freight Quality Partnership
BIA Bristol International Airport
CBI Confederation of British Industry
DDA Disability Discrimination Act
DEFRA Department of the Environmentand Rural Affairs
DfT Department for Transport
DPE Decriminalised Parking Enforcement
DTI Department for Trade and Industry
ERCDT English Regional Cycling Development Team
ETP Education, Training & Publicity
GBSTS Greater Bristol Strategic Transport Study
GOSW Government Office for the South West
GVA Gross Value Added
HOV High Occupancy Vehicle
JLTP Joint Local Transport Plan
KSI Killed or Seriously Injured
LA Local Authority
LDF Land Disposal Facility
LPG Liquid Propane Gas
LRT Light Rapid Transit
LTP Local Transport Plan
MPH Miles per Hour
NCN National Cycle Network
NO2 Nitrogen Dioxide
PAP Priority Access Point
P&R Park and Ride
PHVs Private Hire Vehicles
PRoGRESS Priority Road Use for Greater Responsibilities, Efficiency and Sustainability in Cities
PSA Public Service Agreement
PTW Powered Two Wheelers
RFF Regional Freight Forum
RFM Regional Freight Map
RPG Regional Planning Guidance
RUH Royal United Hospital
SAS Surface Access Strategy
SRA Strategic Rail Authority
SRB Single Regeneration Budget
STAG Strategic Traffic Action Group
SWPTI South West Public TransportInformation
SWRDA South West Regional DevelopmentAgency
TAMP Transport Asset Management Plan
TOC Train Operating Company
UWE University of the West of England
VIVALDI Visionary and Visible Actions Through Local TransportDemonstration Initiatives
WoW Walk on Wednesdays