Embed Size (px)
Citation preview
Joint Center for Housing Studies Harvard University
Updated 2010-2020 Household and New Home Demand Projections
George S. Masnick, Daniel McCue, and Eric S. Belsky
September 2010 W10-9
© by George S. Masnick, Dan McCue, and Eric S. Belsky. All rights reserved. Short sections of text, not to exceed two paragraphs, may be quoted without explicit permission provided that full credit, including © notice, is given to the source. Any opinions expressed are those of the author and not those of the Joint Center for Housing Studies.


3
Given the prolonged period of high unemployment and the possibility that it will influence
headship rates and household growth, this working paper explores a variety of alternative
headship rate assumptions to arrive at a new set of low and high household growth projections,
and incorporates revisions to programming used to project household growth. A low headship
scenario is also presented to explore what would happen if headship rates by each age fell to
three-year average lows they experienced at any time since 1980. Because household growth is
the cornerstone of new home demand, updated new home demand projections are also presented.
In our new household projections, headship rates by age and race are averaged over 2007-2009.
The projections assume that these three-year averages by age and race/ethnicity are maintained
over the entire projection period (2005-2025). These are picked because they incorporate recent
downward trends in headship rates that coincide with the bursting of the housing bubble and the
Great Recession but are in line with the relatively stable headship rate by age trends observed
over most of the past decade.1 By averaging across three years, the new headship assumptions do
not give undue weight to any one year. This is important because in any given year headship
rates by age—and especially by age and race/ethnicity—can deviate materially from the year
before and the year after because of sampling variability.
This preferred set of headship rates is applied to baseline population growth by age and race as
projected by the US Bureau of the Census for 2010-2020 (which we view as based on a high
immigration assumption) as well as to projections that assume that immigration is half as great as
projected by the Census Bureau (which we view as a low immigration assumption). These
household projections are built up from 5-year age groups by race and ethnicity, and are
allocated with full detail to household types.
Under the new household projections, total household growth for 2010-2020 is 11.8 million in
the low immigration series and 13.8 million in the high immigration series. These new
1 Holding age specific headship rates constant from other individual years in the 2000s does not yield results materially different from using the 2007-2009 average with the exception of using 2009. Using 2009 results in household growth estimates that are about one million lower than the 2007-2009 average. But most of the falloff comes from the 55-64 year age group—a group that has not experienced a large upward shift in unemployment, further underscoring the value of averaging headship rates across three years.
4
projections are 6.0 and 6.8 percent lower, respectively, than the 2009 low and high immigration
series for 2010-2020. The new projections incorporate a change in headship rate assumptions
from holding 2008 headship rates constant by age and race/ethnicity, to averaging them for
2007-2009. The projections also include a revision that addresses a programming issue found in
the calculation of “Asian/Other” households, reducing the projected number of households in
this category.
So far, there is little evidence that the recent downward shift in age-specific headship rates as
measured 2007-2009 in the Current Population Survey (CPS) is large enough to have been the
primary reason that household growth slowed as much as it did in recent years (from well over 1
million annually to well below 1 million annually as measured by various surveys). Instead, the
sharp slowdown in household growth appears to have been driven by reductions in the rate of
growth of the adult population resulting from a reduction in immigration. Thus, barring a
worsening economic downturn that is dramatic and prolonged, future household growth is likely
to be more sensitive to assumptions about immigration levels than headship rates.
Still, given the magnitude of sustained job losses that have occurred in the wake of the Great
Recession, it is possible that headship rates may yet experience a significant decline. Perhaps the
most relevant benchmark for the current situation would be the change in headship rates that
resulted from the Great Depression. But there are no annual estimates of household growth and
headship rates from the 1930s that can be used to examine the impact of the Great Depression
and, even if there were, the unemployment rate in the Great Depression topped 25 percent2, so it
constitutes an event of much worse magnitude than has so far been experienced this downturn.
Similarly, though unemployment rates in the early 1980s reached levels comparable to those of
today, the rebound in employment was relatively swift, aided in part by sharp reductions in
interest rates, and by the fact that smaller cohorts of young adults from the baby bust generation
were beginning to enter the job market in the mid-1980s so fewer jobs were needed to reduce the
unemployment rate. This time most economists believe employment will be much slower to
2 Haugen, Steven E, 2009, “Measures of Labor Underutilization from the Current Population Survey” BLS Working Papers, U.S. Bureau of Labor Statistics, Office of Employment and Unemployment Statistics. (Accessed on 9/07/2010: http://www.bls.gov/ore/pdf/ec090020.pdf)
5
recover because this crisis was driven far more than was the 1980s contraction by a financial
crisis and a great deleveraging. In addition, companies and businesses today, much more than in
the 1980s, can expand productivity and increase their contribution to national GDP by hiring
temporary workers, by out-sourcing jobs to other countries, and by reducing costs through
adopting new technologies that impact production, marketing and sales - without increasing the
permanent payroll. Furthermore, young cohorts now entering the job market are from the larger
echo-boom generation born after 1985, requiring more jobs to be created to simply keep pace
with young adult population growth.
As a test of the sensitivity of our new preferred projections to a potential across-the- board falloff
in headship rates in response to sustained job losses, we present a low headship rate scenario.
Our low headship rate scenario takes the lowest 3-year rolling average that each rate reached for
each age group since 1980. This exercise shows that that one would need to apply the lowest
three-year rolling average plumbed by each ten-year age group since 1980-1982 to reduce
household growth for the coming decade to 1.0 million per year on average even under our low
immigration assumptions.3 This is about 0.18 million per year less on average than our new low
immigration series using 2007-2009 headship rate averages by age and race/ethnicity held
constant. However, this scenario reveals that the specific years in which each ten-year age group
reached its three-year rolling average low point did not line up that well with periods of
economic turmoil, leaving open the question as to what an extended period of high
unemployment might actually do to age-specific headship rates. Thus, we view this more as a
sensitivity analysis than a projection of what might actually happen if the economy worsens
further or takes many years to recover.
New home demand projections for years 2010 through 2019 are driven off our new preferred
household projections and range from a low of 16.4 million completions (single-family,
3 Focusing on ten-year age groups rather than five-year age groups by race simplifies the analysis and comparisons and avoids larger random sampling variability by race in picking low points. Moving to age groups undivided by race and ethnicity, however, results in higher overall household growth estimates than would otherwise be the case because the minority population share is increasing and minorities on average have lower headship rates than non-Hispanic whites. Thus, controlling for race as well would lead to a low headship rate annual average estimate of somewhat lower than 1.0 million.

6
multifamily, and manufactured home placements) in the low immigration case to a high of 18.7
in the high immigration case. This compares with housing completions and placements of 17.4
million in the 1980s, 16.1 million in the 1990s, and 17.0 million in the 2000s. The lowest 10-year
completion figure in records spanning back to 1974-1983 and forward to 2000-2009 was set at
15.7 million in the 1988-1997 period—a time when the baby bust generation was forming
households and construction was expected to be lower.
These new home demand projections are not forecasts of the construction that will occur 2010-
2020. To do so requires estimating whether we entered 2010 with a large long-run oversupply
and predicting whether and by how much markets with will be oversupplied or undersupplied in
a short-run sense exiting the period at the end of 2019. Obviously there is no way to predict how
close to balance housing supply and demand will be ten years from now. As we have seen, new
additions to the housing stock are strongly cyclical, and it is impossible to predict where in such
a cycle we will be in ten years.
As for assessing whether markets in a long-run sense are or are not in balance now, even that is
challenging, and far too little work has been done to reliably estimate how close to long-run
demand-supply balance housing markets are in at any given point in time. With vacancy rates
well above those observed in past periods when markets appeared to be closer to balance (as
evidenced by rents and prices nationally changing in line with fundamentals like income growth
and construction cost changes), many deduce that housing markets in 2010 are way out of long-
run balance. While such elevated vacancy rates clearly show a market that is oversupplied in the
short run, it is more difficult to assess what it suggests about where markets may be in a long-run
sense.
With household growth well below what most demographers believe would have occurred absent
a severe housing and economic downturn, it is likely that part of the reason for elevated
vacancies is that demand has been well below trend growth. Indeed, according to the Housing
Vacancy Survey (HVS) used to estimate vacancy rates, household growth may have been off by
7
more than 3 million in 2005-2010 from its pace from 2000-2005.4 This suggests demand is
being pent up, and when the economy improves and unemployment falls, at least some of the
slowdown in net immigration may be made up, and people now doubling up—with their parents,
their adult children, their siblings and roommates they would otherwise have split from if not for
the economy—will strike out on their own. The new household projections presented here do not
take into account any pent-up demand that may have developed in and around the recession (or
may occur while unemployment remains so elevated) that could lift household growth above
trend if pent-up demand gets released at some point in the coming years. Furthermore, as a result
of the sharp inventory correction—annual starts and placements are at lows not seen since World
War II—total new housing over the last decade has been no higher than the average rate of
additions to the housing stock over the last several decades. Total completions plus placements
2000-2009 were 17.0 million – slightly less than 17.3 million average for all 27 ten-year periods
from 1974-1983 to 2000-2009.
For both these reasons, markets may be closer to long-run balance than today’s high vacancy
rates would suggest. Thus, it is possible that housing markets nationally may not be that far out
of long-run balance and that a surge in pent-up demand at some point in the coming years will
absorb much of what today is showing up as excess vacancies.
Finally, it is important to underscore that the datasets used here to make household growth and
new home demand projections vary in the amount of measurement error they are likely to
introduce into the analysis. The household projections rely on headship rates 2007-2009 as
measured by the CPS and on Census Bureau population projections released in 2008. This far
from a re-benchmark to a decennial census, both these headship rate estimates and population
projections are subject to the potential for increasing measurement error. When the 2010 Census
results are released, we will gain a much more accurate picture of headship rate changes and
population changes over the past decade. As for new home demand projections, these are built
up from the sum of expected household growth, expected demand for additional vacant units to 4 Adjusting for the HVS revision in 2003 by excluding the 2002-3 period and taking the average growth of the other four years, the pace of annual household growth 2000-5 averaged 1.37 million. Using a combination of annual data and the most recent change in the 4 quarter rolling average occupied households from Q2:2009 to Q2:2010, household growth 2005-2010 averaged just 718,000 per year, a decline of 650,000 per year accumulated over five years to total 3.25 million fewer new households 2005-2010.
8
accommodate mobility of a larger number of households and for second homes as the baby
boomers reach peak second-home buying ages, and expected demand to replace units lost from
the housing stock. Vacancy rates and the number of vacant units are estimated by the HVS. Like
the CPS, the HVS is subject to increasing measurement error this far out from a Census re-
benchmark. Net removals are typically calculated as a residual based on the difference between
how many new homes were built as well as manufactured homes placed over a period and how
much the estimated size of the housing stock increased. These estimates of the total size of the
housing stock are also subject to increasing measurement error between decennial censuses yet
serve as the control totals for the HVS and as an important element of estimating net removals.
Assumptions about normal net removals and natural vacancy rates must also be made to arrive at
expected replacement demand and demand for additional vacant units. In contrast to the
measurement issues and assumptions that feed into new home demand projections, estimates of
the number of homes built and manufactured homes placed are subject to far less measurement
error. Completions and placement are based on following a sample drawn from a near complete
universe of housing permits issued and manufactured homes produced that are followed through
to completion and placement. Thus, they are subject mostly only to sampling error with known
characteristics and are the most reliable estimates of all those discussed in this report.
Choosing Headship Rate and Immigration Assumptions
To project household growth, two key sets of assumptions must be made. One is the rate at
which individuals form independent households and the other is the rate of net immigration. The
greatest uncertainty surrounds future rates of net immigration, which have an immediate and
direct effect on growth in the number of households moving forward.5
Net immigration is the difference between the number of people who immigrate to the country
and the number who emigrate away from it. During the 1990s and early 2000s immigration
5 The number of people living in the country and their ages, on the other hand, are known with some precision, especially after decennial censuses. Furthermore, mortality rates by age moving forward are reliable estimates. Thus, the component of population projections that deal with the size of the adult age population is reliable. Predictions about future fertility rate trends are unimportant to household projections because they do not affect projections of the size of the household formation population for another 20-to-30 years.
9
increased and the foreign born accounted for about a third of net household growth, raising the
share of foreign-born households from 9.9 percent in 1995 to 11.2 percent in 2000 to 12.8
percent in 2005. We view immigration as the key wildcard in making household projections but
acknowledge the possibility that headship rate assumptions may also turn out to be important
drivers because of the depth of the recent downturn and the possibility of a very slow recovery or
even a second economic dip.
While headship rates moving forward are uncertain, we do know that headship rates rise
predictably with age and reflect the ways that people come together in households. As a result,
they are heavily influenced by average age of first marriage, divorce rates and remarriage rates,
as well as tastes for living with roommates, as adult children with parents, adult siblings, and in
multigenerational households. While influenced by economic factors, these are also deeply
personal decisions and reflect tastes and preferences. The last big changes in headship patterns
by age occurred 1960-1980. They carried forward to a lesser degree 1980-2000 as the influences
of increases in both age at first marriage and divorce rates together with the decline in remarriage
rates during the 1960s and 1970s worked their way through adult ages. During the 1980s, for
example, older age groups which started out with higher headship rates, because as young people
in the 1960s and 1970s they began marrying later and divorcing more, carried higher headship
rates into middle age. Similarly, middle-aged people divorcing more and remarrying less during
the 1960s, 1970s and 1980s carried these higher headship rates into older age groups as they
aged.
What appeared to have been behind these large headship rate changes was the increase in female
labor force participation. This created greater economic independence for women. When age at
first marriage and divorce started to move up and remarriage rates went down, headship rates
increased compared to previous age cohorts. With these changes, it became important to use a
technique called cohort smoothing to project household growth. This takes the higher headship
starting point that each age group is on than the generation ahead of it and carries it through as
the age groups age. This was done to project household growth in the 1980s and 1990s.
10
Relative stability in the underlying factors that drove big headship rate changes has now caused
us to shift to holding headship rates by age and race/ethnicity constant when projecting
household growth. As expected, given the severe economic recession, headship rates in some age
groups fell in 2008 and 2009.. This is not to say that the Great Recession has not, and in and of
itself might not have, a lasting negative impact of headship rates, especially among the young
where the unemployment rate is highest. But so far, headship rates for all ages have not been
significantly affected.
We use the CPS to estimate the numerators of our headship rates—the number of people who
head a household—and divide by Census resident population estimates for July 1.6 We have
chosen the CPS for several reasons. First, the CPS total households for 2000 were close to the
2000 census number (104.7 million in the former compared to 105.5 million in the latter), and
these totals are even closer when the census is adjusted for the known household over count.
Second, the March CPS numbers we use are part of a monthly data collection effort designed to
measure changing household characteristics, particularly labor force participation and income,
and to achieve robust estimates of these variables. In addition, population groups with low
numbers—particularly among minorities and among non-traditional households—are
oversampled. Our attention to different race/Hispanic origin populations in our projections
requires this robustness. Third, the CPS has a long historical series, which enables us to compare
and contrast current trends with historical levels and trends. Fourth, the CPS releases a timely
public use micro-data file enabling us to generate custom tabulations during the current year.
And fifth, there have been few fundamental changes in the CPS methodology since its inception,
allowing us to attribute trends in the data to trends in the underlying household concept being
measured.7
6 In calculating CPS headship rates we use July 1 resident population estimates in the denominator taken from the Census Bureau’s monthly population estimates series. The reason we use this “external” population number for the denominator of the headship rates is to produce rates that, when multiplied by resident population projections by age and race/Hispanic origin (that are July 1 numbers), produce consistent household projections. Internal CPS population numbers do not represent the entire resident population of the United States and are not July 1 numbers. 7 With other data sources, many of these advantages are not present. For example, the HVS, although more timely than the CPS (quarterly data are released within 2 months after the end of a quarter), does not release household data broken down by age and race/Hispanic origin, does not have a public use micro-data file to allow for custom tabulations, and has recently changed the method by which occupied housing units (households) are estimated, creating a dramatic break in the series. While the HVS formerly tracked CPS household growth quite closely, total household numbers no longer do. Another possible source of data on headship rates is the American Community
11
In order to minimize random variation in headship rates that normally occur for any given year
when the CPS data are broken down by race/Hispanic origin, 5-year age groups, and partner/non-
partner categories—as we do in our projection model—in this update to our projections we have
averaged headship rates for 2007, 2008 and 2009 to produce a current preferred headship
assumption.8 We assume that headship rates have likely bottomed out in 2009, or are close to
doing so, and that a preferred set of rates that are consistent with the continued, albeit slow,
economic recovery would more closely reflect the average for the years 2007, 2008 and 2009
than other possible periods.
While it is possible that a protracted economic downturn or jobless recovery could depress
headship rates to levels as low—or even lower—than the lows of each age group over the last 30
years, there is scant evidence in the trends through 2009 that such declines are starting to take
place. While the observed drop in headship rates among households under 35 may persist
because of high unemployment and anxiety about the future among this group, their lower
headship rates mean they are living in ways they would not have and did not just before the
recession—living with unrelated roommates, siblings, grandparents, or parents. This creates
pressure to move out at the first opportunity.9 As for the other age group that has shown a
meaningful decline in headship rates – 55-64 year olds – it is not clear why they rose steadily
through 2008 or fell off so much from 2008 to 2009. It is therefore difficult to know whether it is
more of a measurement or sampling error than a trend that will persist. This underscores the
value of averaging headship rates over a three-year period.
Survey, but it has only reached its first full sample in 2005, changed the definition of the population sampled in 2006, has a different definition of what constitutes a household, and is less timely (2009 ACS data have still not been released as of this writing). Still, the ACS probably represents the survey of choice for the future when looking at changing household numbers and characteristics because it is a larger sample and will have less sampling variability, so will produce more accurate short-term trends, and will allow greater attention to geographic and other sub-population differences. 8 Starting in 2009, Census Bureau annual population estimates no longer provide a full age and race/Hispanic origin breakdown that includes non-Hispanic blacks and non-Hispanic Asian/others. That full breakdown is still provided in the Census Bureau’s monthly population estimates series, however. Our updated household projections recalculate headship rates using the July resident population estimates from the monthly series. 9 A recent study finds a strong association for young adults between moving back home and labor market conditions, but that on average about half of boomerang kids have moved back out again after 1 year. See Greg Kaplan “Boomerang Kids: Labor Market Dynamics and Moving Back Home”, Federal Reserve Bank of Minneapolis Research Department, Working Paper 675, October 2009
12
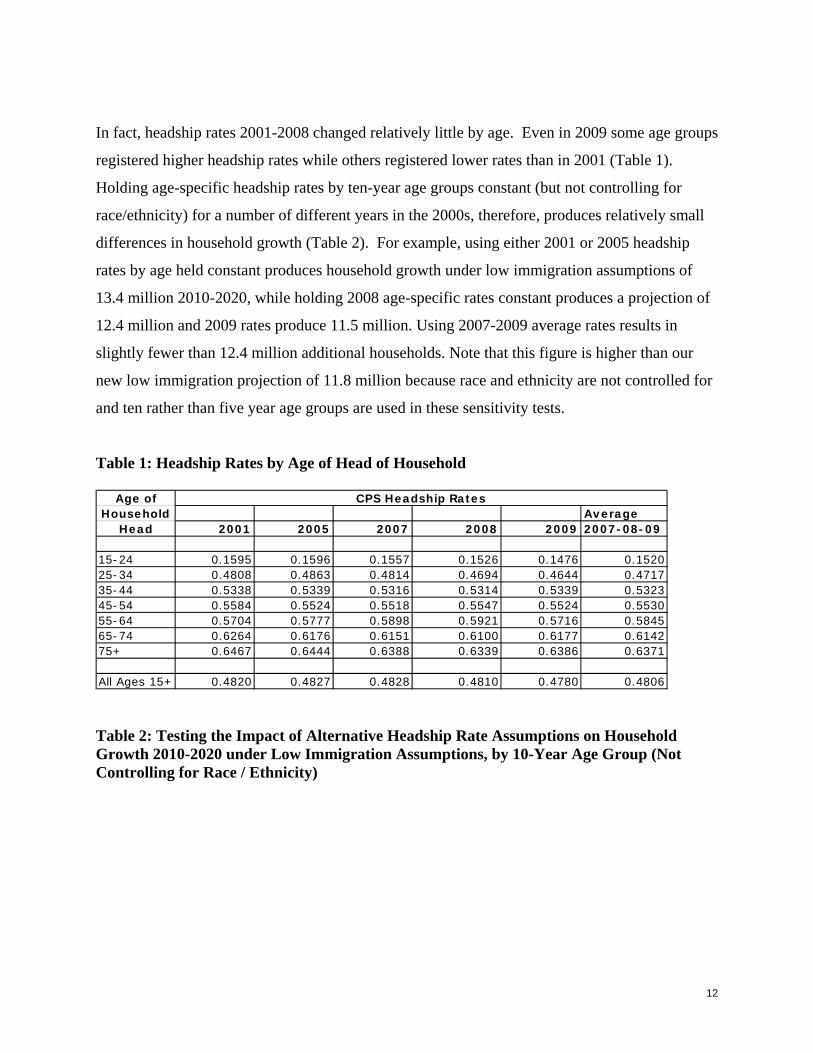
In fact, headship rates 2001-2008 changed relatively little by age. Even in 2009 some age groups
registered higher headship rates while others registered lower rates than in 2001 (Table 1).
Holding age-specific headship rates by ten-year age groups constant (but not controlling for
race/ethnicity) for a number of different years in the 2000s, therefore, produces relatively small
differences in household growth (Table 2). For example, using either 2001 or 2005 headship
rates by age held constant produces household growth under low immigration assumptions of
13.4 million 2010-2020, while holding 2008 age-specific rates constant produces a projection of
12.4 million and 2009 rates produce 11.5 million. Using 2007-2009 average rates results in
slightly fewer than 12.4 million additional households. Note that this figure is higher than our
new low immigration projection of 11.8 million because race and ethnicity are not controlled for
and ten rather than five year age groups are used in these sensitivity tests.
Table 1: Headship Rates by Age of Head of Household
Age ofHousehold Average
Head 2001 2005 2007 2008 2009 2007-08-09
15-24 0.1595 0.1596 0.1557 0.1526 0.1476 0.152025-34 0.4808 0.4863 0.4814 0.4694 0.4644 0.471735-44 0.5338 0.5339 0.5316 0.5314 0.5339 0.532345-54 0.5584 0.5524 0.5518 0.5547 0.5524 0.553055-64 0.5704 0.5777 0.5898 0.5921 0.5716 0.584565-74 0.6264 0.6176 0.6151 0.6100 0.6177 0.614275+ 0.6467 0.6444 0.6388 0.6339 0.6386 0.6371
All Ages 15+ 0.4820 0.4827 0.4828 0.4810 0.4780 0.4806
CPS Headship Rates
Table 2: Testing the Impact of Alternative Headship Rate Assumptions on Household Growth 2010-2020 under Low Immigration Assumptions, by 10-Year Age Group (Not Controlling for Race / Ethnicity)
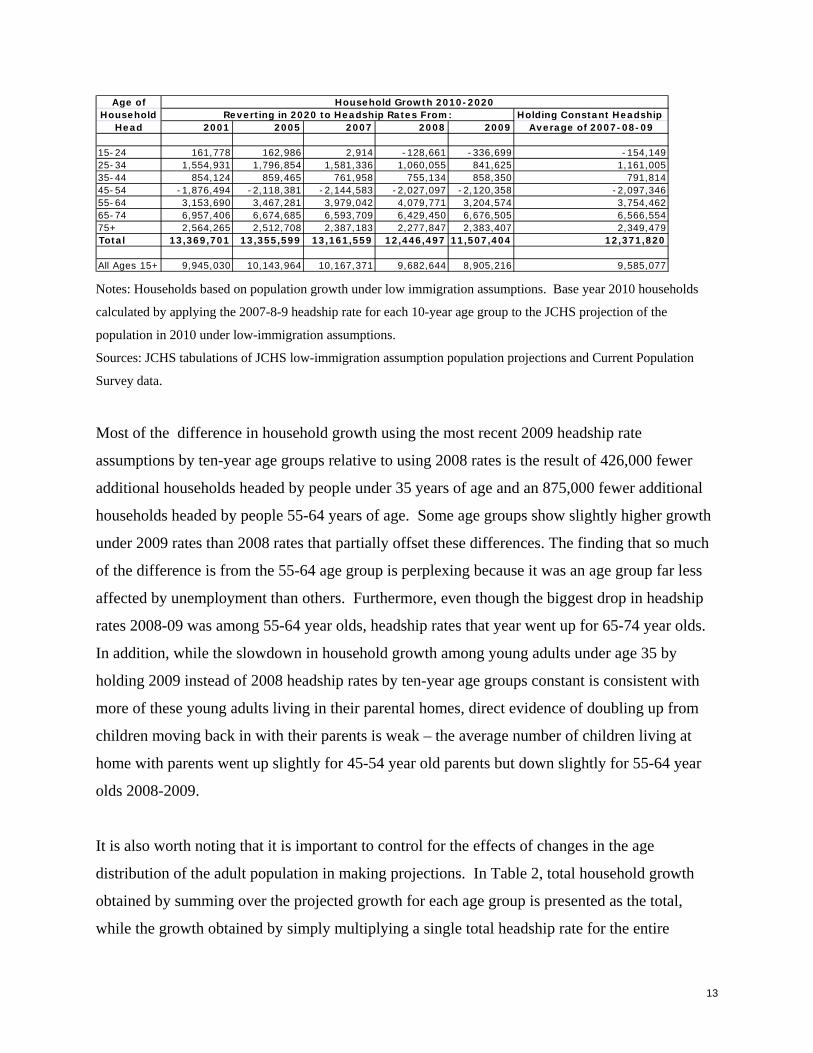
13
Age ofHousehold Holding Constant Headship
Head 2001 2005 2007 2008 2009 Average of 2007-08-09
15-24 161,778 162,986 2,914 -128,661 -336,699 -154,14925-34 1,554,931 1,796,854 1,581,336 1,060,055 841,625 1,161,00535-44 854,124 859,465 761,958 755,134 858,350 791,81445-54 -1,876,494 -2,118,381 -2,144,583 -2,027,097 -2,120,358 -2,097,34655-64 3,153,690 3,467,281 3,979,042 4,079,771 3,204,574 3,754,46265-74 6,957,406 6,674,685 6,593,709 6,429,450 6,676,505 6,566,55475+ 2,564,265 2,512,708 2,387,183 2,277,847 2,383,407 2,349,479Total 13,369,701 13,355,599 13,161,559 12,446,497 11,507,404 12,371,820
All Ages 15+ 9,945,030 10,143,964 10,167,371 9,682,644 8,905,216 9,585,077
Household Growth 2010-2020Reverting in 2020 to Headship Rates From:
Notes: Households based on population growth under low immigration assumptions. Base year 2010 households
calculated by applying the 2007-8-9 headship rate for each 10-year age group to the JCHS projection of the
population in 2010 under low-immigration assumptions.
Sources: JCHS tabulations of JCHS low-immigration assumption population projections and Current Population
Survey data.
Most of the difference in household growth using the most recent 2009 headship rate
assumptions by ten-year age groups relative to using 2008 rates is the result of 426,000 fewer
additional households headed by people under 35 years of age and an 875,000 fewer additional
households headed by people 55-64 years of age. Some age groups show slightly higher growth
under 2009 rates than 2008 rates that partially offset these differences. The finding that so much
of the difference is from the 55-64 age group is perplexing because it was an age group far less
affected by unemployment than others. Furthermore, even though the biggest drop in headship
rates 2008-09 was among 55-64 year olds, headship rates that year went up for 65-74 year olds.
In addition, while the slowdown in household growth among young adults under age 35 by
holding 2009 instead of 2008 headship rates by ten-year age groups constant is consistent with
more of these young adults living in their parental homes, direct evidence of doubling up from
children moving back in with their parents is weak – the average number of children living at
home with parents went up slightly for 45-54 year old parents but down slightly for 55-64 year
olds 2008-2009.
It is also worth noting that it is important to control for the effects of changes in the age
distribution of the adult population in making projections. In Table 2, total household growth
obtained by summing over the projected growth for each age group is presented as the total,
while the growth obtained by simply multiplying a single total headship rate for the entire
14
population aged 15 or older is presented in italics. If, instead of using headship rates by ten-year
age groups, the headship rate for the entire population 15 years of age or older is used, household
growth projections are reduced significantly. The aging U.S. population gives increasing weight
to age groups with higher headship rates, explaining the higher household growth if changing
age structure is taken into account. It is critically important to take age effects into account.
During the 1970s, for example, the aging of the baby boomers into household formation age
groups drove the headship rate for the entire population age 15 or older in 1980 to its lowest
level since then because the age distribution in that year was so heavily skewed to young adults
who predictably have much lower headship rates. Yet, the age-specific headship rates in 1980
were higher than in 2009 for all but a couple of the older ten-year age groups (Appendix Table
A-1).
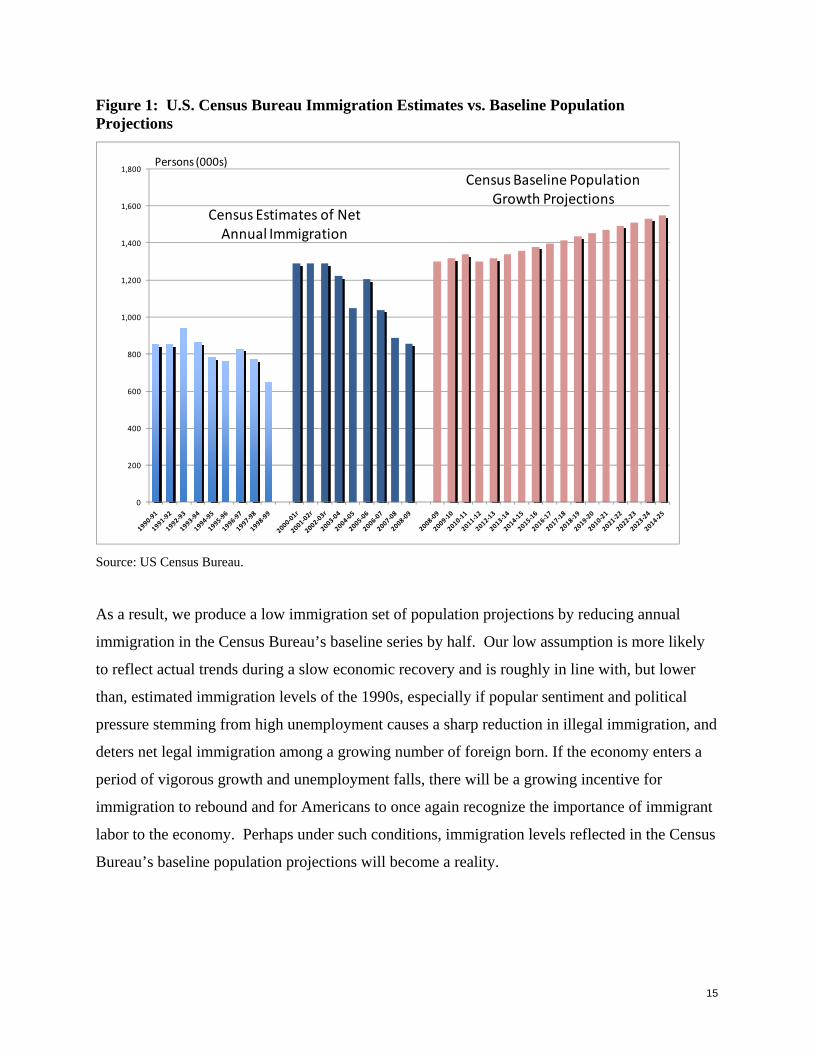
Turning to immigration assumptions used in the new projections, we chose to use the Census
Bureau’s 2008 baseline population projections to create a “high” immigration series and half that
to create a “low” immigration series. The Census Bureau’s 2008 baseline population projections
assume that immigration in 2010 is 1.3 million people and rises to 1.6 million by 2025 (Figure
1). In 2009 the Census Bureau released a “low” immigration series, going from 1.15 million in
2010 to 1.35 million in 2025, but we felt that even this assumption is still too high to constitute a
“low” series. They also released a “high” immigration series at that time, going from 1.6 million
annually in 2010 to 1.8 million in 2025. These numbers compare to Census Bureau estimates of
812,000 annually for the 1990s and 1.28 million on average for the first half of the 2000-2010
decade. Estimates for the 2005-2009 period have fallen below 1 million, with 2009 being
855,000. But just as it has been shown that the Census Bureau continually underestimated
immigration when immigration was on the upswing (largely underestimating levels of illegal
immigration), they are likely overestimating current levels of immigration when it is on a
downward trajectory, missing the illegal immigrants who have returned home.10
10 See Tammany Mulder, “Accuracy of the U.S. Census Bureau National Population Projections and Their Respective Components of Change” Population Division Working Paper #50, Population Division, US Census Bureau 9/18/2001.
15
Figure 1: U.S. Census Bureau Immigration Estimates vs. Baseline Population Projections
0
200
400
600
800
1,000
1,200
1,400
1,600
1,800
Census Estimates of Net Annual Immigration
Census Baseline Population Growth Projections
Persons (000s)
Source: US Census Bureau.
As a result, we produce a low immigration set of population projections by reducing annual
immigration in the Census Bureau’s baseline series by half. Our low assumption is more likely
to reflect actual trends during a slow economic recovery and is roughly in line with, but lower
than, estimated immigration levels of the 1990s, especially if popular sentiment and political
pressure stemming from high unemployment causes a sharp reduction in illegal immigration, and
deters net legal immigration among a growing number of foreign born. If the economy enters a
period of vigorous growth and unemployment falls, there will be a growing incentive for
immigration to rebound and for Americans to once again recognize the importance of immigrant
labor to the economy. Perhaps under such conditions, immigration levels reflected in the Census
Bureau’s baseline population projections will become a reality.
16
Recent Household Growth Trends
Current interest in the impact of headship rate assumptions on household growth projections has
been driven in part by a recent dramatic slowdown in household growth. A close examination of
what has been driving the slowdown reveals that it is associated more with a falloff in
immigration than a reduction in headship rates.
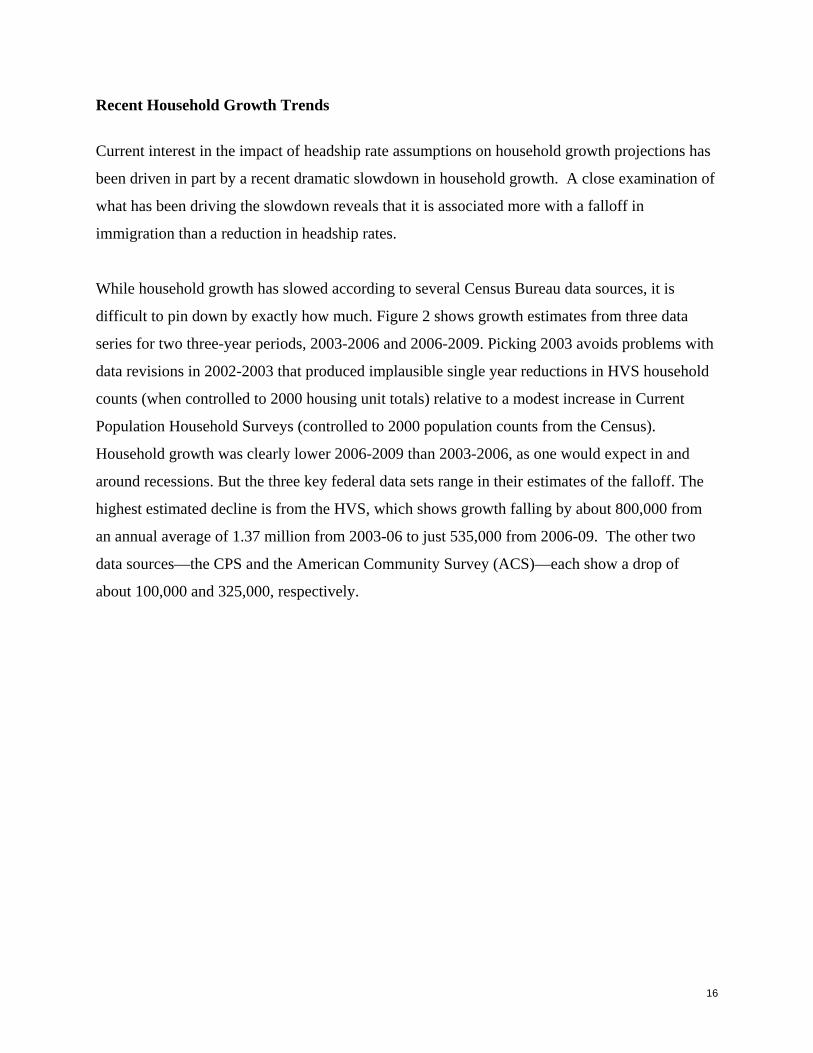
While household growth has slowed according to several Census Bureau data sources, it is
difficult to pin down by exactly how much. Figure 2 shows growth estimates from three data
series for two three-year periods, 2003-2006 and 2006-2009. Picking 2003 avoids problems with
data revisions in 2002-2003 that produced implausible single year reductions in HVS household
counts (when controlled to 2000 housing unit totals) relative to a modest increase in Current
Population Household Surveys (controlled to 2000 population counts from the Census).
Household growth was clearly lower 2006-2009 than 2003-2006, as one would expect in and
around recessions. But the three key federal data sets range in their estimates of the falloff. The
highest estimated decline is from the HVS, which shows growth falling by about 800,000 from
an annual average of 1.37 million from 2003-06 to just 535,000 from 2006-09. The other two
data sources—the CPS and the American Community Survey (ACS)—each show a drop of
about 100,000 and 325,000, respectively.
17
Figure 2: Annual Household Growth Estimates Vary Widely but Each Shows Recent Declines
1,035
1,368
1,066
932
535742
0
200
400
600
800
1,000
1,200
1,400
1,600
CPS HVS Revised ACS*
2003‐2006 2006‐2009
Annual HouseholdGrowth (000s)
Notes: ACS data are for 2006-8. Sources: US Census Bureau, American Community Survey, Housing Vacancy Survey, and Current Population Survey.
Within the CPS, our sensitivity analysis of headship rates in the 2000s has demonstrated that this
recent falloff in total annual household growth, which is well below what is projected even under
historically low headship rates, is not explained entirely or even mostly by increasing doubling
up.11 A slowdown, or possibly even a loss of net immigration, with its attending impact on adult
age population growth, is therefore a more likely explanation. Indeed, while the number of
native-born households under the age of 35 declined by only 2,000 households between March
2007 and March 2009 according to the CPS, the falloff in foreign-born households under the age
of 35 was a much sharper 338,000.
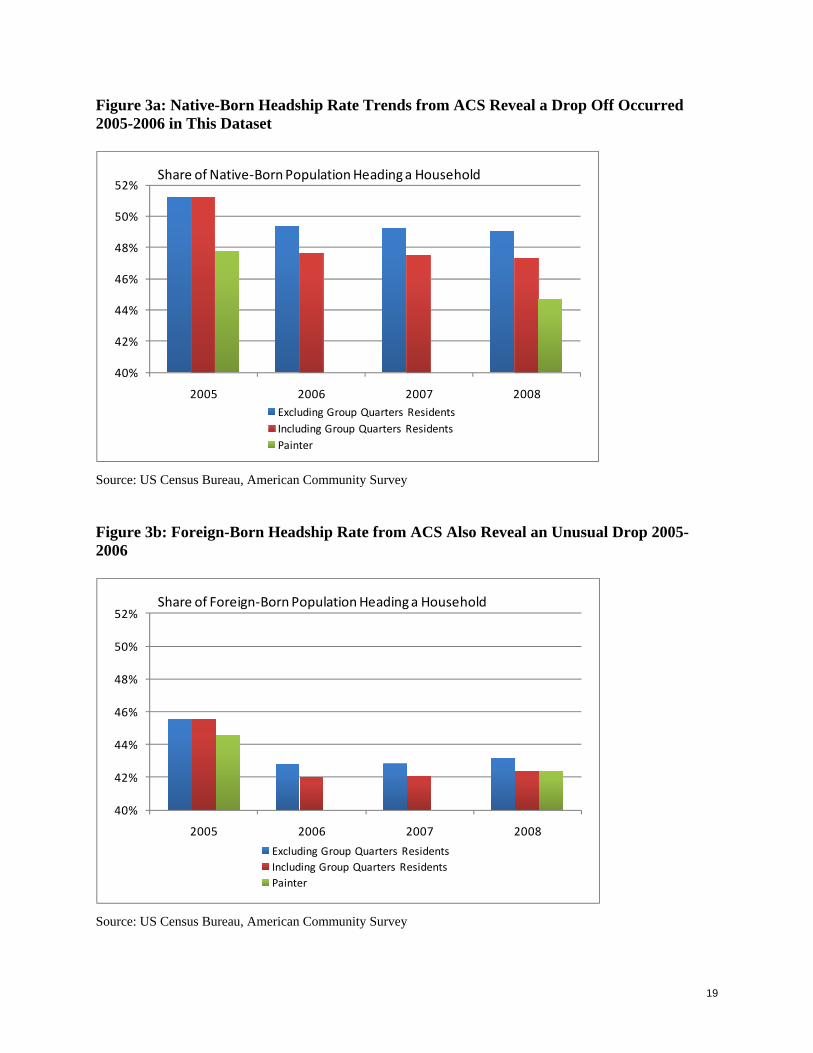
A recent analysis by Gary Painter suggests that falling rates of household formation lay behind
the recent sharp drop in household growth.12 To reach this conclusion the author observes that
headship rates have declined sharply between 2005 and 2008 for both native born and
immigrants as measured in the ACS. But the decline in headship occurred between 2005 and
11 The 2006-09 CPS average is made up of annual growth estimates that fall from 1.626 million in 2006-07, to 773,000 in 2007-08, to 397,000 in 2008-09. 12 Gary Painter, “What Happens to Household Formation in a Recession?,” Research Institute for Housing America, April 2010.
18
2006, well before the Great Recession. The ACS began to include group quarters population in
its sample beginning in 2006, raising the denominator of ACS headship rates, and this may
explain part of Painter’s findings. But even excluding the group quarters population from the
denominator of ACS headship rates results in most of the decline occurring between 2005 and
2006 for native born population, and in all of the decline over this period for the foreign born. In
fact, foreign-born headship rates as measured by the ACS actually increased between 2006 and
2008 (see Figures 3a and 3b).
Painter calculated headship rates on a sub-sample of the national population that is more urban
and more minority, including “established immigrant gateways”, “emerging immigrant
gateways”, and “small metros”, which is an important factor in explaining why he came up with
lower headship rates in his sample than in our national estimates using the ACS. In his
conclusion Painter mentions the finding that the biggest declines in headship rates were among
native-born Americans, which he found surprising since the foreign-born—with lower income
and education—should have been hardest hit. But our finding of slightly rising foreign-born
headship rates 2006-2008 is consistent with the growing loss of undocumented immigrants (who
have lower headship rates) as the construction downturn accelerated and the nation fell into
recession, leaving behind a foreign-born population with higher headship. The ACS headship
rate trends in Figures 3a and 3b provides further confirmation of our findings from the CPS that
headship rates have likely not fallen dramatically during the recent recession since they have
changed little since 2006.
For all these reasons, we have selected the average of headship rates 2007-2009, though further
broken down into five year-age groups by race/ethnicity, and held them constant in our new
preferred household growth projections.
19
Figure 3a: Native-Born Headship Rate Trends from ACS Reveal a Drop Off Occurred 2005-2006 in This Dataset
40%
42%
44%
46%
48%
50%
52%
2005 2006 2007 2008
Excluding Group Quarters Residents
Including Group Quarters Residents
Painter
Share of Native‐Born Population Heading a Household
Source: US Census Bureau, American Community Survey
Figure 3b: Foreign-Born Headship Rate from ACS Also Reveal an Unusual Drop 2005-2006
40%
42%
44%
46%
48%
50%
52%
2005 2006 2007 2008
Excluding Group Quarters Residents
Including Group Quarters Residents
Painter
Share of Foreign‐Born Population Heading a Household
Source: US Census Bureau, American Community Survey
20
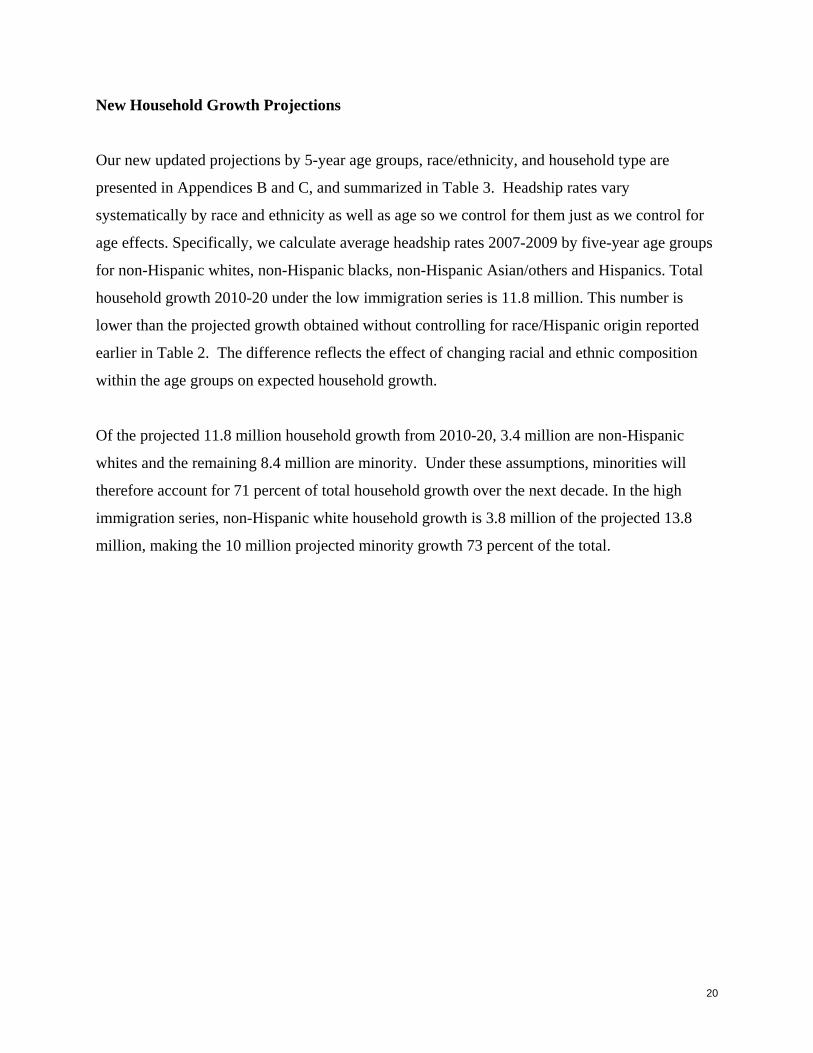
New Household Growth Projections
Our new updated projections by 5-year age groups, race/ethnicity, and household type are
presented in Appendices B and C, and summarized in Table 3. Headship rates vary
systematically by race and ethnicity as well as age so we control for them just as we control for
age effects. Specifically, we calculate average headship rates 2007-2009 by five-year age groups
for non-Hispanic whites, non-Hispanic blacks, non-Hispanic Asian/others and Hispanics. Total
household growth 2010-20 under the low immigration series is 11.8 million. This number is
lower than the projected growth obtained without controlling for race/Hispanic origin reported
earlier in Table 2. The difference reflects the effect of changing racial and ethnic composition
within the age groups on expected household growth.
Of the projected 11.8 million household growth from 2010-20, 3.4 million are non-Hispanic
whites and the remaining 8.4 million are minority. Under these assumptions, minorities will
therefore account for 71 percent of total household growth over the next decade. In the high
immigration series, non-Hispanic white household growth is 3.8 million of the projected 13.8
million, making the 10 million projected minority growth 73 percent of the total.
21
Table 3: New 2010 JCHS Household Growth Projections
Household Growth 2010‐20
Age
Low Immigration Assumptions
High Immigration Assumptions
15‐19 10,376 56,123
20‐24 ‐267,455 ‐41,955
25‐29 192,187 590,552
30‐34 970,194 1,358,389
35‐39 941,085 1,206,328
40‐44 ‐222,297 ‐28,580
45‐49 ‐1,403,257 ‐1,266,781
50‐54 ‐865,347 ‐769,603
55‐59 1,308,260 1,395,690
60‐64 2,393,452 2,472,387
65‐69 3,410,487 3,474,521
70‐74 3,110,759 3,138,008
75+ 2,223,705 2,243,040
Total 11,802,149 13,828,120
Note: Produced by holding 2007-2009 average headship rates by five-year age groups by race/ethnicity constant. High series uses US Census Bureau baseline population projections and low series uses a Joint Center for Housing Studies modification of US Census Bureau projections that reduces its baseline immigration assumptions by half.
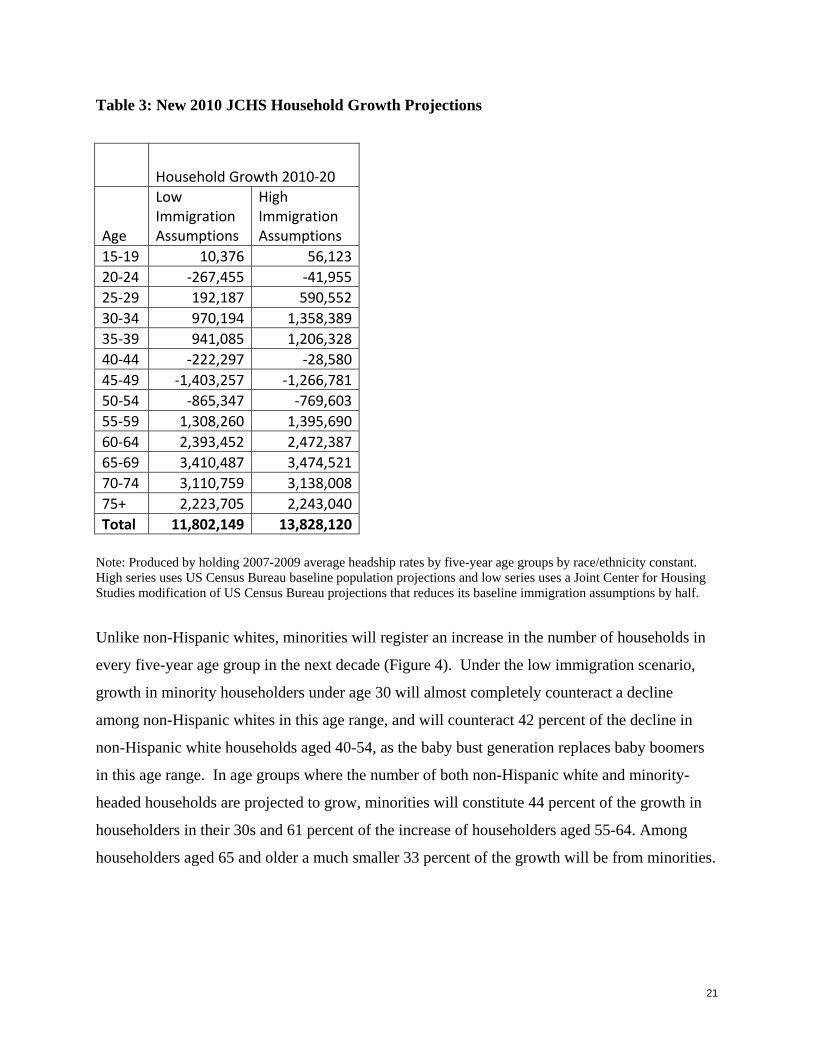
Unlike non-Hispanic whites, minorities will register an increase in the number of households in
every five-year age group in the next decade (Figure 4). Under the low immigration scenario,
growth in minority householders under age 30 will almost completely counteract a decline
among non-Hispanic whites in this age range, and will counteract 42 percent of the decline in
non-Hispanic white households aged 40-54, as the baby bust generation replaces baby boomers
in this age range. In age groups where the number of both non-Hispanic white and minority-
headed households are projected to grow, minorities will constitute 44 percent of the growth in
householders in their 30s and 61 percent of the increase of householders aged 55-64. Among
householders aged 65 and older a much smaller 33 percent of the growth will be from minorities.
22
Figure 4: While Each Age Group Will See Growth in Minority Householders, the Number
of Middle-Aged White Householders Will Fall and Older White Householders Grow from
2010-2020
‐2.5
‐2.0
‐1.5
‐1.0
‐0.5
0.0
0.5
1.0
1.5
2.0
2.5
15‐19 20‐24 25‐29 30‐34 35‐39 40‐44 45‐49 50‐54 55‐59 60‐64 65‐69 70‐74 75 and Over
Age of Householder
Non‐Hispanic White Minority
Household Growth 2010‐2020 (Millions)
Note: Uses JCHS low-immigration population growth assumption.
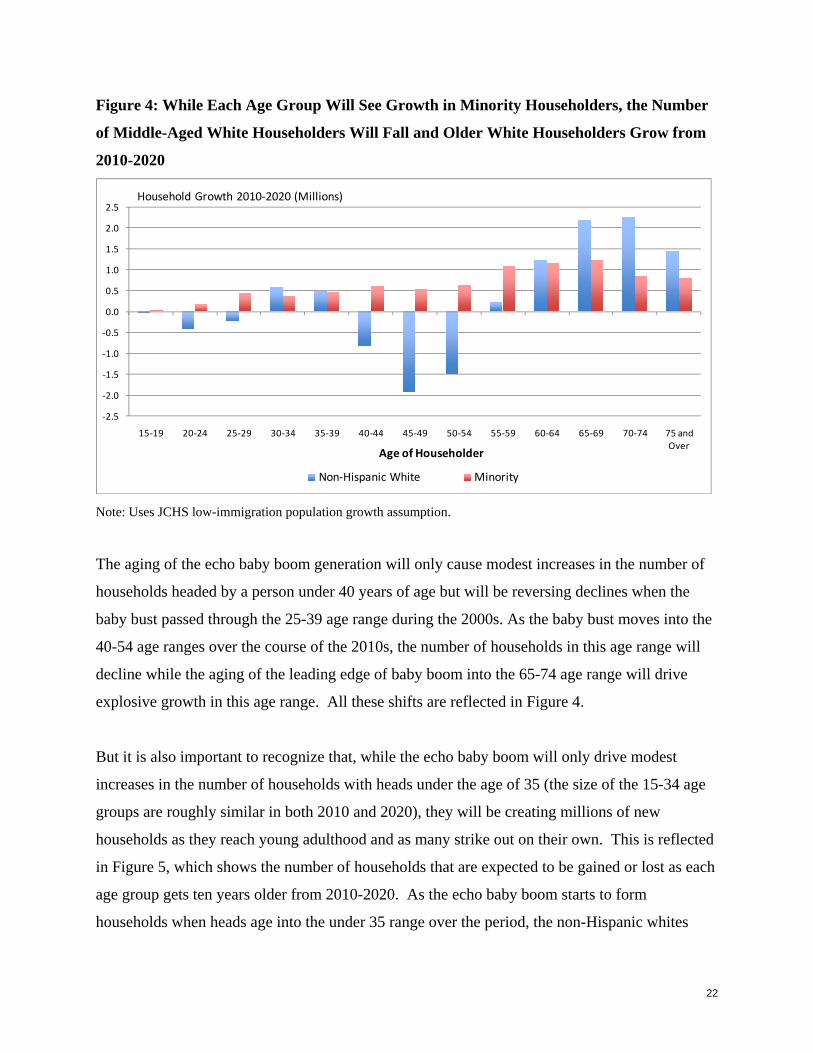
The aging of the echo baby boom generation will only cause modest increases in the number of
households headed by a person under 40 years of age but will be reversing declines when the
baby bust passed through the 25-39 age range during the 2000s. As the baby bust moves into the
40-54 age ranges over the course of the 2010s, the number of households in this age range will
decline while the aging of the leading edge of baby boom into the 65-74 age range will drive
explosive growth in this age range. All these shifts are reflected in Figure 4.
But it is also important to recognize that, while the echo baby boom will only drive modest
increases in the number of households with heads under the age of 35 (the size of the 15-34 age
groups are roughly similar in both 2010 and 2020), they will be creating millions of new
households as they reach young adulthood and as many strike out on their own. This is reflected
in Figure 5, which shows the number of households that are expected to be gained or lost as each
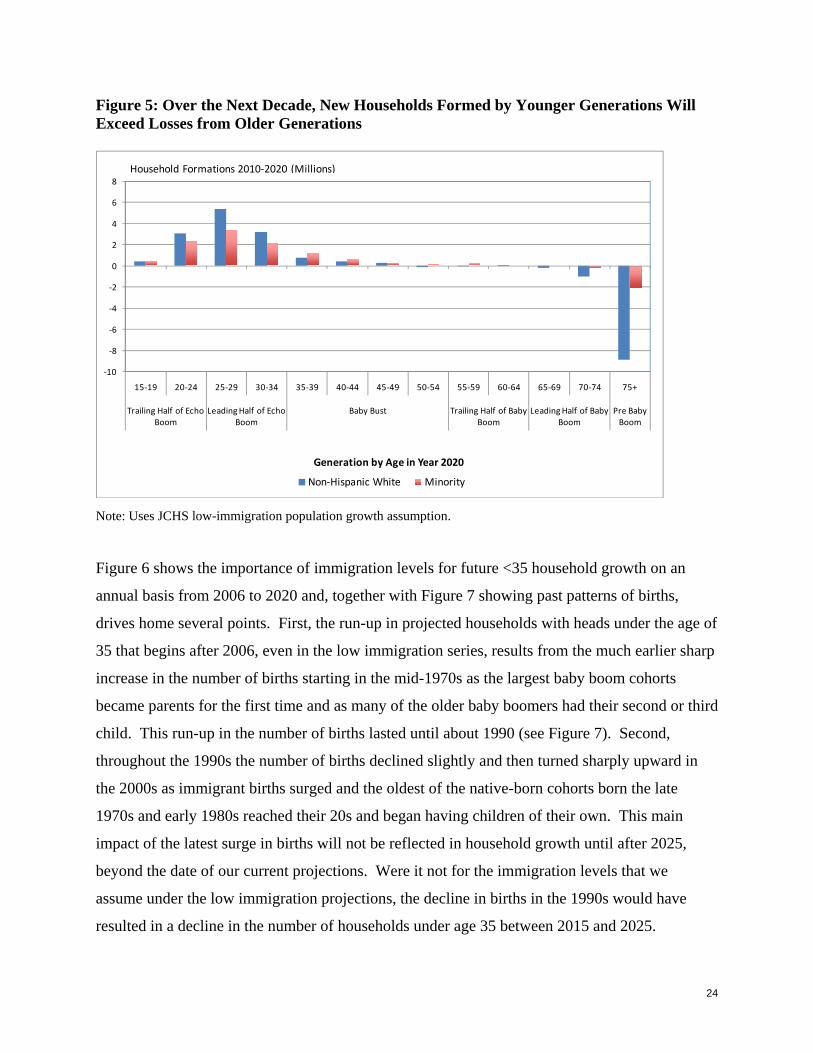
age group gets ten years older from 2010-2020. As the echo baby boom starts to form
households when heads age into the under 35 range over the period, the non-Hispanic whites
23
among them will form fully 12.1 million additional households and minorities fully 8.3 million
under a low immigration scenario, and 12.4 million and 9.4 million respectively under the high
immigration scenario. The baby bust and trailing edge of the baby boom will gain a total of 3.9
million net additional households (63 percent being minority) as they age into the ranges of 35-
54 and 55-64 respectively by 2020. But as mortality rates increase among members of the
leading edge of the baby boom generation as they age into the 65-74 old age range, and also
increase among those over 75 born into generations older than the baby boomers, the losses of
non-Hispanic whites from these generation will be especially dramatic. Indeed, the number of
non-Hispanic whites in baby boom and older generations is expected to fall by 10.1 million
under both the low and high immigration series (few immigrants are over 65). However, only
2.3 million minorities born into the baby boom and older generations as they age over 65 and
beyond will be lost in each series. Thus, it is primarily the loss of non-Hispanic white members
of the baby boom and older generations, together with more proportionate gains in the number of
minority and non-Hispanic white households from the echo baby boom generation, that will
drive significant shifts in the overall racial/ethnic composition of households.
24
Figure 5: Over the Next Decade, New Households Formed by Younger Generations Will Exceed Losses from Older Generations
‐10
‐8
‐6
‐4
‐2
0
2
4
6
8
15‐19 20‐24 25‐29 30‐34 35‐39 40‐44 45‐49 50‐54 55‐59 60‐64 65‐69 70‐74 75+
Trailing Half of Echo Boom
Leading Half of Echo Boom
Baby Bust Trailing Half of Baby Boom
Leading Half of Baby Boom
Pre Baby Boom
Generation by Age in Year 2020
Non‐Hispanic White Minority
Household Formations 2010‐2020 (Millions)
Note: Uses JCHS low-immigration population growth assumption.
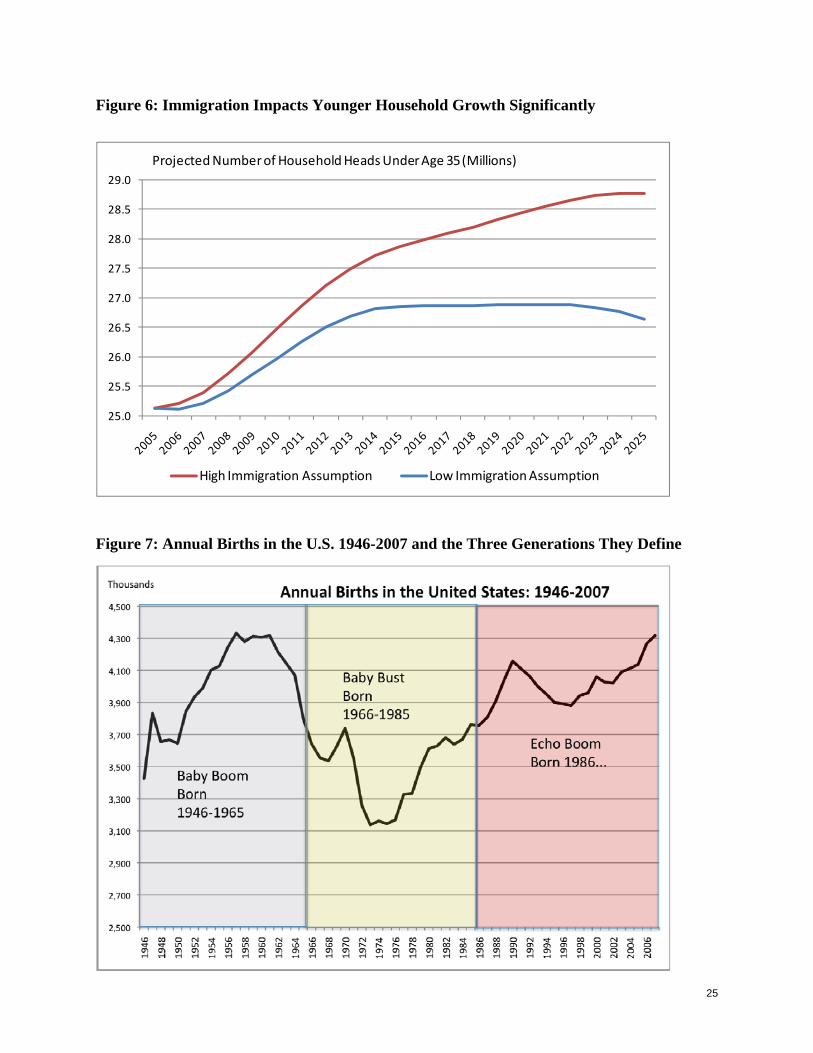
Figure 6 shows the importance of immigration levels for future <35 household growth on an
annual basis from 2006 to 2020 and, together with Figure 7 showing past patterns of births,
drives home several points. First, the run-up in projected households with heads under the age of
35 that begins after 2006, even in the low immigration series, results from the much earlier sharp
increase in the number of births starting in the mid-1970s as the largest baby boom cohorts
became parents for the first time and as many of the older baby boomers had their second or third
child. This run-up in the number of births lasted until about 1990 (see Figure 7). Second,
throughout the 1990s the number of births declined slightly and then turned sharply upward in
the 2000s as immigrant births surged and the oldest of the native-born cohorts born the late
1970s and early 1980s reached their 20s and began having children of their own. This main
impact of the latest surge in births will not be reflected in household growth until after 2025,
beyond the date of our current projections. Were it not for the immigration levels that we
assume under the low immigration projections, the decline in births in the 1990s would have
resulted in a decline in the number of households under age 35 between 2015 and 2025.
25
Figure 6: Immigration Impacts Younger Household Growth Significantly
25.0
25.5
26.0
26.5
27.0
27.5
28.0
28.5
29.0
High Immigration Assumption Low Immigration Assumption
Projected Number of Household Heads Under Age 35 (Millions)
Figure 7: Annual Births in the U.S. 1946-2007 and the Three Generations They Define
26
The aging of the echo boom into household formation ages, and the changing ethnic composition
of the population, will mean that the net growth in households will take on a different
composition as we move forward in time. Recently, about half of all net household growth has
been married and partner couples without minor children in the household. This reflects the
increasing number of baby boom parents entering the empty nest stage (or those whose children
who are still at home are 18 or older), as well as the delay in family formation among young
adults (see Figures 8 and 9). As we move through this decade and into the next, however, the
share of new married couple or partner households that are childless is projected to decline
dramatically as both households with young children increase and as aging baby boomers find
themselves widowed or divorced. Figure 8 shows projection results for the total population
under the low immigration scenario, and the share of household growth in the married without
children plus partnered without children columns falls from 47.7 percent in 2010-15 to 38.2
percent in 2015-20, and then to 28.5 percent in 2020-25. During the same three periods, the
share of total net household growth in the married with children plus partnered with children
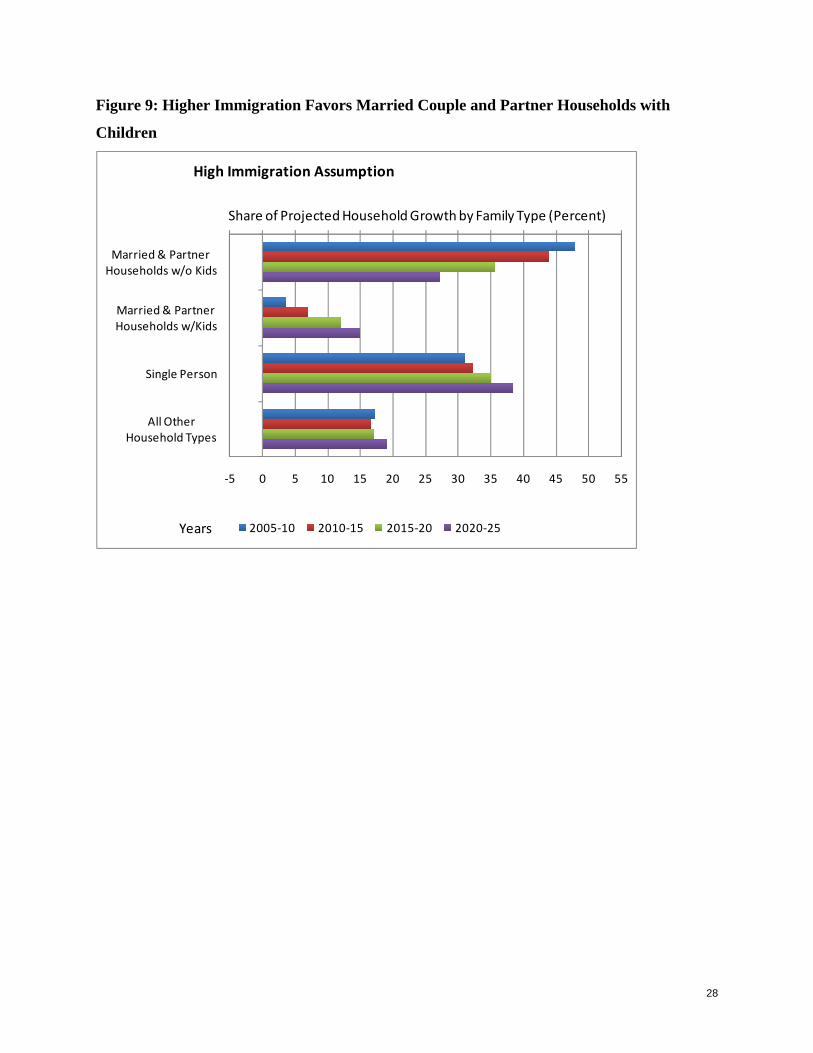
categories climbs steadily from 2.6 to 8.0 to 11.1 percent. Under the high immigration
assumption these percentages are 7.1, 12.2 and 15.0 (see Appendix C for the numbers from
which these percentages are calculated).
The category that captures the largest share of future household growth is persons living alone.
Under the low immigration scenario the share of growth in this category is 34.5 percent in 2010-
15, climbing to 42.3 percent in 2020-25. Under the high immigration scenario, with more
household growth in the younger age groups, the share of the growth that is people who live
alone climbs from 32.3 percent to 38.5 percent over this period.
Figure 8 examines projected household growth by family type under the low immigration
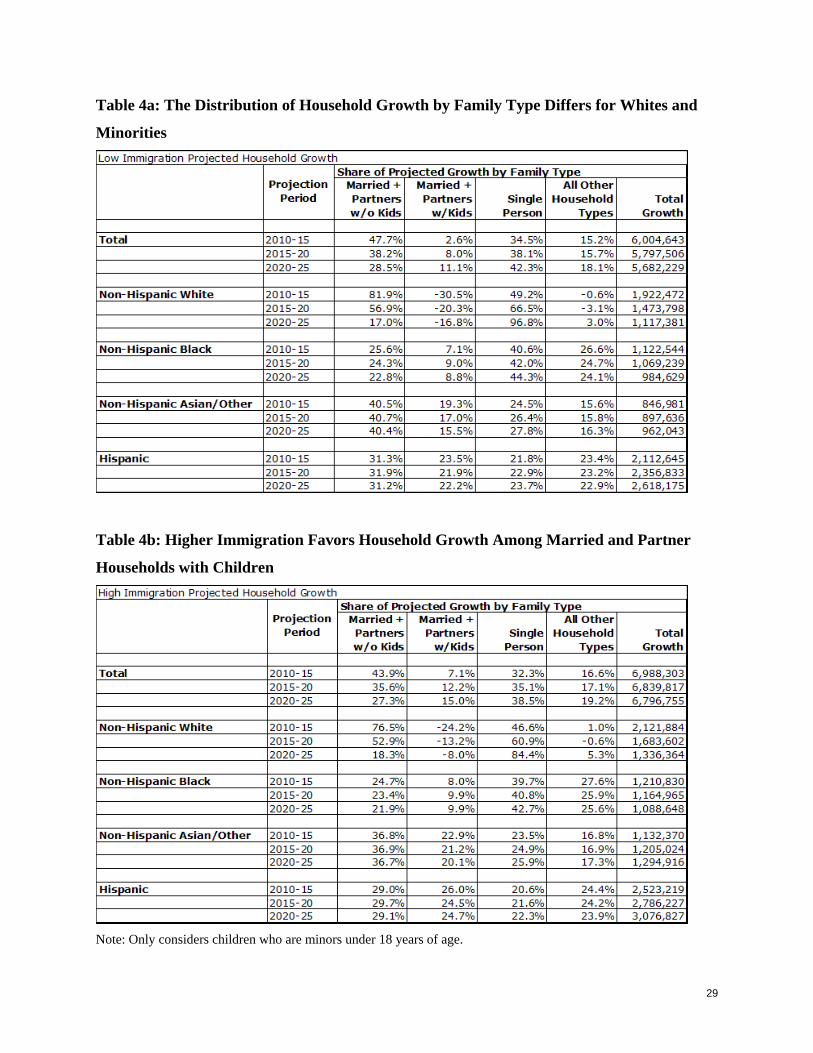
assumption for all race/Hispanic origin groups combined. Table 4a examines the ethnic
breakdown of projected household growth. When we break things down this way, we get a
markedly different picture for non-Hispanic whites compared to minorities. The large presence
of middle-age and older white households means that the only household categories with positive
net household growth are married couples plus partners without children and single person
households. Early in the projection period, it is households without minor children that dominate
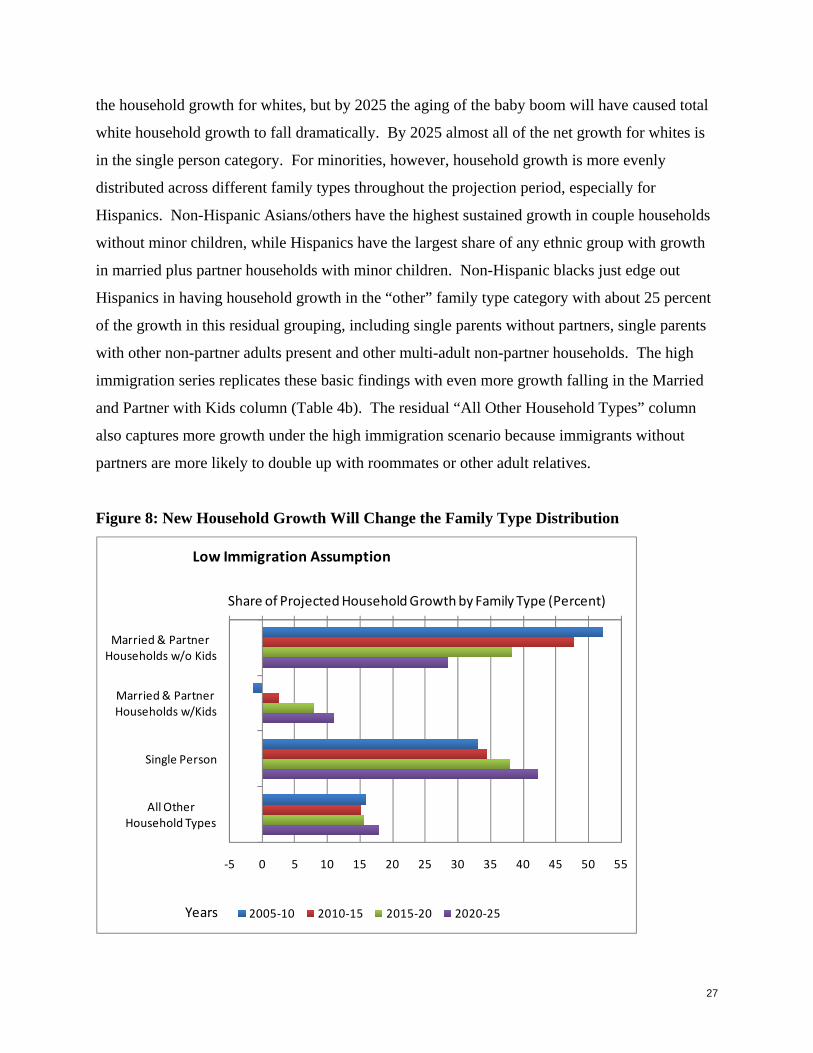
27
the household growth for whites, but by 2025 the aging of the baby boom will have caused total
white household growth to fall dramatically. By 2025 almost all of the net growth for whites is
in the single person category. For minorities, however, household growth is more evenly
distributed across different family types throughout the projection period, especially for
Hispanics. Non-Hispanic Asians/others have the highest sustained growth in couple households
without minor children, while Hispanics have the largest share of any ethnic group with growth
in married plus partner households with minor children. Non-Hispanic blacks just edge out
Hispanics in having household growth in the “other” family type category with about 25 percent
of the growth in this residual grouping, including single parents without partners, single parents
with other non-partner adults present and other multi-adult non-partner households. The high
immigration series replicates these basic findings with even more growth falling in the Married
and Partner with Kids column (Table 4b). The residual “All Other Household Types” column
also captures more growth under the high immigration scenario because immigrants without
partners are more likely to double up with roommates or other adult relatives.
Figure 8: New Household Growth Will Change the Family Type Distribution
‐5 0 5 10 15 20 25 30 35 40 45 50 55
Married & PartnerHouseholds w/o Kids
Married & PartnerHouseholds w/Kids
Single Person
All OtherHousehold Types
Low Immigration Assumption
2005‐10 2010‐15 2015‐20 2020‐25
Share of Projected Household Growth by Family Type (Percent)
Years
28
Figure 9: Higher Immigration Favors Married Couple and Partner Households with
Children
‐5 0 5 10 15 20 25 30 35 40 45 50 55
Married & PartnerHouseholds w/o Kids
Married & PartnerHouseholds w/Kids
Single Person
All OtherHousehold Types
High Immigration Assumption
2005‐10 2010‐15 2015‐20 2020‐25
Share of Projected Household Growth by Family Type (Percent)
Years
29
Table 4a: The Distribution of Household Growth by Family Type Differs for Whites and
Minorities
Table 4b: Higher Immigration Favors Household Growth Among Married and Partner
Households with Children
Note: Only considers children who are minors under 18 years of age.
30
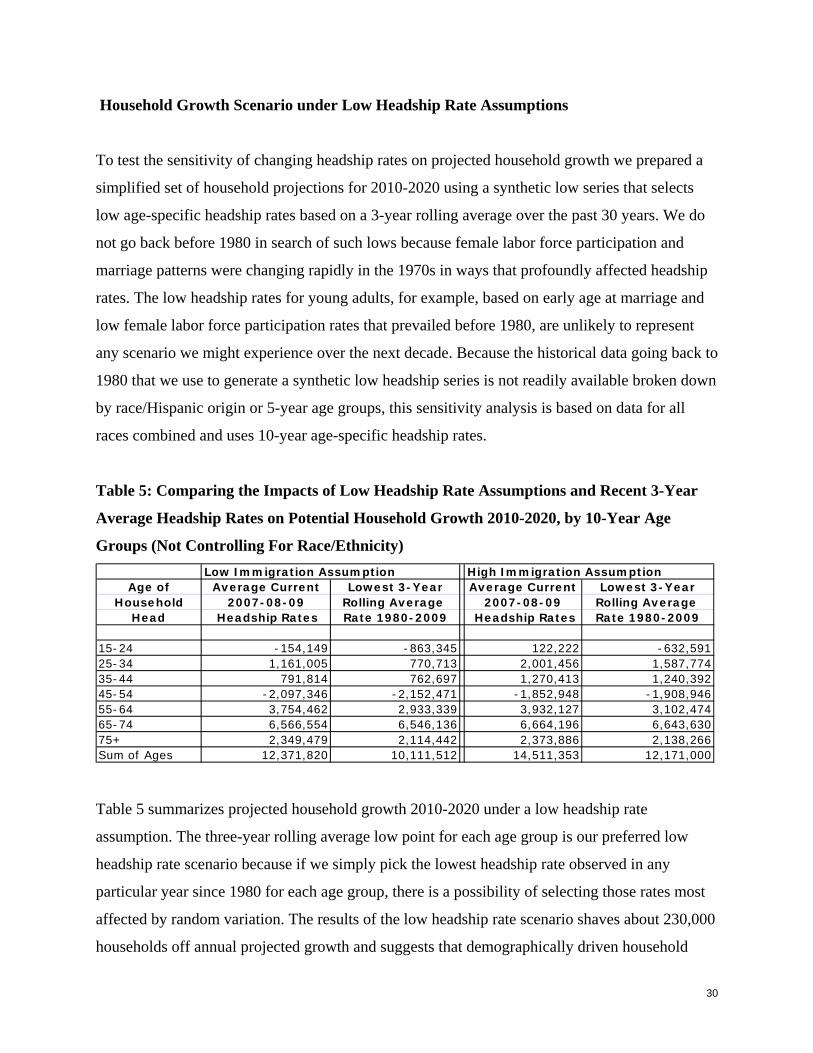
Household Growth Scenario under Low Headship Rate Assumptions
To test the sensitivity of changing headship rates on projected household growth we prepared a
simplified set of household projections for 2010-2020 using a synthetic low series that selects
low age-specific headship rates based on a 3-year rolling average over the past 30 years. We do
not go back before 1980 in search of such lows because female labor force participation and
marriage patterns were changing rapidly in the 1970s in ways that profoundly affected headship
rates. The low headship rates for young adults, for example, based on early age at marriage and
low female labor force participation rates that prevailed before 1980, are unlikely to represent
any scenario we might experience over the next decade. Because the historical data going back to
1980 that we use to generate a synthetic low headship series is not readily available broken down
by race/Hispanic origin or 5-year age groups, this sensitivity analysis is based on data for all
races combined and uses 10-year age-specific headship rates.
Table 5: Comparing the Impacts of Low Headship Rate Assumptions and Recent 3-Year
Average Headship Rates on Potential Household Growth 2010-2020, by 10-Year Age
Groups (Not Controlling For Race/Ethnicity)
Low Immigration Assumption High Immigration AssumptionAge of Average Current Lowest 3-Year Average Current Lowest 3-Year
Household 2007-08-09 Rolling Average 2007-08-09 Rolling Average Head Headship Rates Rate 1980-2009 Headship Rates Rate 1980-2009
15-24 -154,149 -863,345 122,222 -632,59125-34 1,161,005 770,713 2,001,456 1,587,77435-44 791,814 762,697 1,270,413 1,240,39245-54 -2,097,346 -2,152,471 -1,852,948 -1,908,94655-64 3,754,462 2,933,339 3,932,127 3,102,47465-74 6,566,554 6,546,136 6,664,196 6,643,63075+ 2,349,479 2,114,442 2,373,886 2,138,266Sum of Ages 12,371,820 10,111,512 14,511,353 12,171,000
Table 5 summarizes projected household growth 2010-2020 under a low headship rate
assumption. The three-year rolling average low point for each age group is our preferred low
headship rate scenario because if we simply pick the lowest headship rate observed in any
particular year since 1980 for each age group, there is a possibility of selecting those rates most
affected by random variation. The results of the low headship rate scenario shaves about 230,000
households off annual projected growth and suggests that demographically driven household
31
projections, even under a low immigration assumption, and even assuming historically low age-
specific headship rates, would not fall much below 1 million annual growth over the next
decade.13
Given the severity of the recent recession and the continued high unemployment rates during the
recovery, it is reasonable to ask why current headship rates have not fallen to levels represented
by the historic low series (Appendix Tables A-1 and A-2). There are several possible reasons.
The labor force participation and income decline among younger persons (especially among
males) has been a long one - predating this recession by many years. Young people have already
made adjustments in their household formation rates based on this long-term trend. Men are
increasingly being carried enough by women's employment, which has fared better during this
recession, to maintain living in their own households. Also, unemployment benefits are blunting
the impact of the recession on household formations. On top of this—and importantly—falling
rents and home prices in many areas (in particular in areas that were previously prohibitively
expensive for young people) has allowed many lower wage employed persons to now afford
their own house or apartment. This counter-trend among the employed could offset the impact on
the unemployed. The point is that to assume that loss of jobs automatically and immediately
means less overall household formation is an incomplete view of the world because lower
housing costs can accelerate household formation among those employed and people can tap
other resources at least for a time. That said, today’s long-term unemployed is at high levels and
unless reduced could cause some of the recession-related declines in headship rates to persist.
Finally, the loss of immigrant population (those with the lowest headship rates) creates upward
pressure on headship rates of the remaining resident population. The Department of Homeland
Security Office of Immigration Statistics estimates that a million fewer unauthorized immigrants
were living in the U.S. in January 2009 compared to January 2007. This contrasts with their
estimates of a net gain of 1.3 million illegal residents between 2005 and 2007.14 Such a large
13 The numbers in Table 5 would be slightly lower than calculated because of shifts in the racial and ethnic composition over the period to groups with lower headship rates which we do not control for under these stylized scenarios. 14 Michael Hoefer, Nancy Rytina, and Bryan C. Baker, “Estimates of the Unauthorized Immigrant Population Residing in the United States: January 2009” Department of Homeland Security, Office of Immigration Statistics,
32
swing from positive to negative can easily account for the majority of the recent decline in
overall household growth. The poor job market, most notably but not exclusively in the
construction industry, explains this turnaround in undocumented immigration.
While we have examined the sensitivity of household projections to substantial declines in
headship rates based on the lowest rolling three-year average rates since 1980, we do not believe
that such low rates will materialize during the next decade. We therefore do not produce a full set
of detailed age/race-Hispanic origin/family type projections using a low headship assumption.
Future household growth is more likely to fall between the low immigration current preferred
headship assumption projections and the high immigration, current preferred headship
assumption projections.
January 2010.
33
New Home Demand Projections
Demand for new residential units is the sum of three components: 1) demand for additional units
to accommodate household growth, 2) demand for additional second homes and vacant units for
rent or sale to accommodate the normal turnover of a larger housing stock, and 3) demand for
additional units to replace existing units lost on net from the stock (including net conversions
from residential to non-residential use). To turn projected new home demand into an estimate of
the amount of construction needed to meet demand 2010-2019, one must also factor in market
imbalances entering the period (and assume markets in balance at the end). This section details
the components of new home demand. The following section then considers whether the market
is likely oversupplied in a long-run sense entering 2010 and 2011.
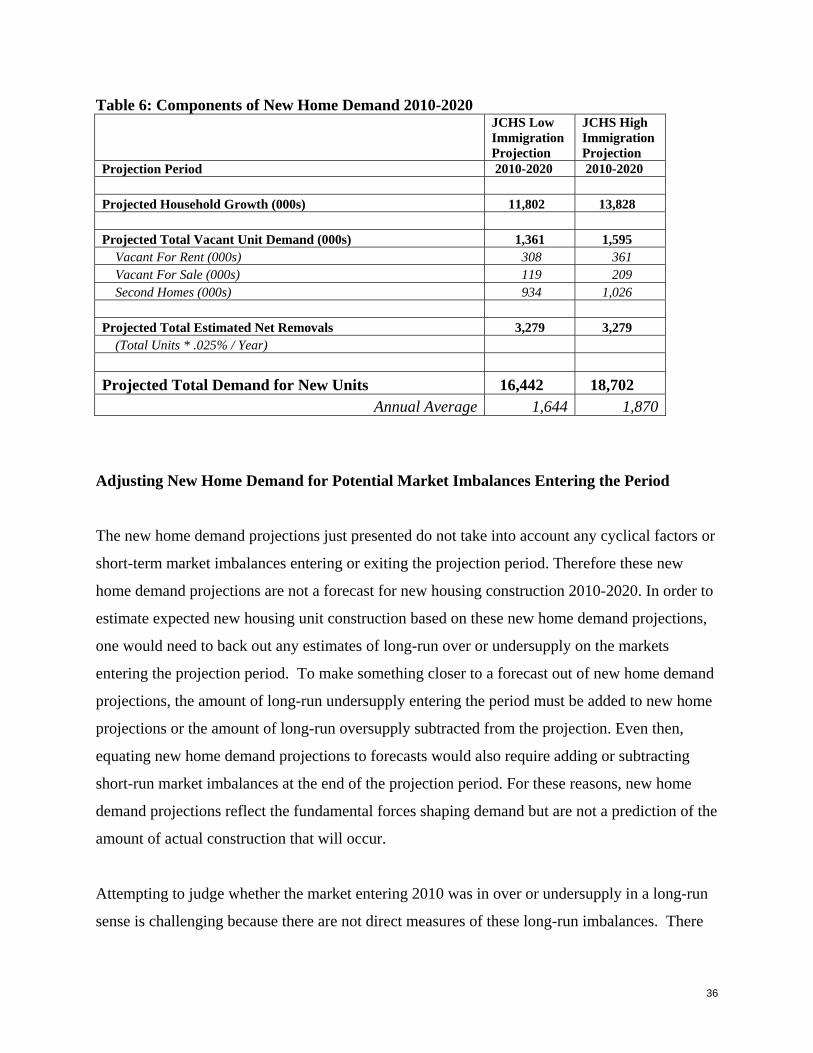
Net household growth is the largest single driver of demand for new housing units. The 11.8 and
13.8 million additional households projected to form from 2010-2020 account for fully 72 and 74
percent of our low and high new-home demand projections. Replacement of units lost on net
from the existing housing stock units is the second largest component of new housing unit
demand, making up slightly less than 20 percent of the totals. The rest is created by demand for
additional vacancies assuming the market is in balance in a long-run sense entering the period.
Such vacancies include multiple units owned by members of a given household, including
former units owned or rented by partner households that have not yet been put back on the
market, additional units owned or rented to facilitated employment at a distance from the
primary residence, units that are undergoing renovation and repair and are not yet occupied,
vacation and investment homes, and foreclosures that are held off the market, as well as vacant
units that are for sale or for rent.
As detailed in JCHS Working Paper W07-715, net replacements over the next 10-year period are
calculated using a loss rate of 2.5 percent of the total housing stock at the start of the period.
This loss rate is based both on the residual estimates of differences between the amount of
housing produced and the change in the total housing stock over recent ten year periods, as well
as on tracking losses of housing units of different ages over a recent two-year period. Because 15 “Projecting the Underlying Demand for New Housing Units: Inferences from the Past, Assumptions about the Future” Harvard Joint Center for Housing Studies Working Paper W07-7, November 2007.
34
net replacements are a function of the size of the stock at the beginning of the period, our net
replacement projections are not affected by our new household growth projections. But
replacement demand projections have been updated to use the most recent estimate of the total
housing stock from the second quarter 2010 HVS. This equates to approximately 3.3 million
units over the 10 year projection period needed to replace lost units.
Projected demand for additional seasonal and vacant homes ranges from 1.4 to 1.6 million units.
Thus, demand for vacancies to accommodate a larger number of households and demand for
second homes is slightly less than half that of net replacements, amounting to just over 8 percent
of the total projected new unit demand. Because it is a function of the projected size and
composition of household growth, expected vacancy demand is updated based on the new
household growth projections. Approximately two-thirds of the new vacant unit demand is for
second homes. Second homes include homes held for recreational or vacation homes, held for
use by seasonal or migrant workers, used for employment related reasons, occupied temporarily
by a household with a usual residence elsewhere (URE), and unoccupied units held off the
market for a number of reasons. For reasons outlined in JCHS Working Paper W07-7, it is
difficult to estimate a sustainable level of second home demand, but propensities to own second
homes have been shown to increase with wealth and age. We obtain a doubly-conservative
estimate of new second home demand by applying the new household growth projections by age
group to the lowest second homeownership rates for each age group going back to 1993,
obtained from the already conservative Survey of Consumer Finances that provides by far the
lowest estimates of the number of second homes of all federal data series. This calculation
results in a total increase in demand for second homes of 0.9 to 1.0 million units from 2010-
2020.
The remaining one-third of the demand for new vacancies is for growth in natural vacancies of
for-sale and for-rent units. Similar to the way in which there is a certain number of unemployed
persons at full employment as people move between jobs, a certain number of vacant units is
needed to accommodate turnover in the housing stock for a mobile population. Due largely to
the fact that renters move more than owners, but also because of the complex behavior of
landlords in setting and managing the rental stock, sustainable vacancy rates in the rental market
35
are higher than in the for-sale market, and it is appropriate to disaggregate for-rent and for-sale
vacancies in determining sustainable vacancy levels. Having identified various years when
markets appeared to be more or less stable or at equilibrium during the past 20 years, we obtain a
range of potential natural vacancy rates for for-sale and for-rent unit. For rentals, the lowest
sustainable rental vacancy rate during this period is 8.0 percent averaged across 1991-1994,
while the lowest for-sale vacancy rate is 1.5% of owner households from 1992-1995 (for more
details behind the selection of these vacancy rate assumptions see JCHS Working Paper W07-7).
Applying the lowest observed natural vacancy rates of for-sale and for-rent units since 1990 to
the new household growth projections results in demand for approximately 300,000-360,000
vacant for-rent units and 120,000-210,000 vacant for-sale units for the entire ten-year projection
period depending on whether the low or high immigration series is used.16
Together the projected components of new home demand 2010-2020 under the low immigration
household growth series is 16.4 million units and under the high immigration household growth
series is 18.7 million. The individual components are summarized in Table 6.17
16 Implicit in the calculation of demand for natural vacancies is a homeownership rate projection for 2010. However, because natural for-rent and for-sale vacancy demand is such a small fraction of new housing unit demand, there is not much sensitivity to the homeownership rate. For example, the difference between assuming a tenure split based on constant 2009 homeownership rates versus that obtained from a reversion to the lowest recorded homeownership rates for each age group going back to 1982 amounts to a difference in new vacant unit demand of only 15,000 additional units for the entire ten-year projection period. For this reason and for simplicity, the new unit demand projections simply apply the most recent annual homeownership rate from 2009. 17 As a cross-check on these new home demand projections, as in JCHS Working Paper W07-7, we multiply our updated household growth projections by the average ratio of completions plus placements to household growth as measured by the HVS over 10-year periods going back to 1974. This ratio is 1.40 and implies a low immigration new home demand projections of 16.5 million and high immigration new home demand projections of 19.3 million. These are very much in line with the sum of our detailed projections of household growth, demand for new vacancies, and net removals. Even if the ten-year periods that end in 2000-2009 are excluded – a period when the ratio was high for a number of years, the ratio is 1.33 and implies new home demand of 15.6 million completions and placements 2010-2020 – in line with the lowest point reach in any ten-year period since 1974-1983.
36
Table 6: Components of New Home Demand 2010-2020
JCHS Low Immigration Projection
JCHS High Immigration Projection
Projection Period 2010-2020 2010-2020 Projected Household Growth (000s) 11,802 13,828 Projected Total Vacant Unit Demand (000s) 1,361 1,595
Vacant For Rent (000s) 308 361 Vacant For Sale (000s) 119 209 Second Homes (000s) 934 1,026
Projected Total Estimated Net Removals 3,279 3,279
(Total Units * .025% / Year)
Projected Total Demand for New Units 16,442 18,702 Annual Average 1,644 1,870
Adjusting New Home Demand for Potential Market Imbalances Entering the Period
The new home demand projections just presented do not take into account any cyclical factors or
short-term market imbalances entering or exiting the projection period. Therefore these new
home demand projections are not a forecast for new housing construction 2010-2020. In order to
estimate expected new housing unit construction based on these new home demand projections,
one would need to back out any estimates of long-run over or undersupply on the markets
entering the projection period. To make something closer to a forecast out of new home demand
projections, the amount of long-run undersupply entering the period must be added to new home
projections or the amount of long-run oversupply subtracted from the projection. Even then,
equating new home demand projections to forecasts would also require adding or subtracting
short-run market imbalances at the end of the projection period. For these reasons, new home
demand projections reflect the fundamental forces shaping demand but are not a prediction of the
amount of actual construction that will occur.
Attempting to judge whether the market entering 2010 was in over or undersupply in a long-run
sense is challenging because there are not direct measures of these long-run imbalances. There
37
are, of course, short-run measures of imbalance: changes in vacancy rates above or below long-
run trend levels. When vacancy rates move below these levels, this can be viewed as indicating
at least a short-term undersupply. When they move above these levels, this can be viewed as
indicating at least a short-run oversupply. Right now vacancy rates appear well above historical
norms for periods in which it looked like markets were in balance.
However, it is risky to make facile assumptions about what a certain vacancy rate at a given
moment implies about whether markets are, or are not, in long-run balance. This is because
during periods in which housing demand is pulled forward, overbuilding can occur but not show
up immediately in higher vacancy rates. Conversely, during periods in which housing demand is
lagging its long-run potential, markets can be at or near long-run balance even though vacancy
rates remain at elevated levels. Indeed, there are reasons to believe that oversupplies started to
develop in the 2000s before for-sale vacancy rates began to climb sharply in 2005 and reasons to
believe that markets have now begun to move back into balance in ways not yet reflected in
reduced vacancy rates.
The impact of the recent sharp supply-side correction in housing has not yet brought down
vacancy rates much from peak levels because of a similarly sharp slowdown in recent household
growth to levels that are well below long-run trends. It is this below-trend household growth that
has produced today’s stubbornly high vacancy rates despite housing construction reaching lows
not seen since World War II.
While this below-trend household growth may not all be ‘pent-up’ and ready to re-emerge in the
future, recent household growth levels—as measured by all three data sources earlier
discussed—are well below nearly all estimates of what household growth would have been
absent major financial and economic dislocations. Short of a significant, dramatic and lasting
cultural shift in household formation rates – on par with that of the 1960’s and 70’s when divorce
rates surged and women began entering the workforce and forming independent households –
much of the household growth one would expect due to the aging of the population has been
delayed as a result of the economic environment and will likely materialize in the future as pent-
38
up demand is released. As for net immigration, it appears to have taken a hit, and while it should
recover along with the economy, some of the immigration that was lost may not be made up.
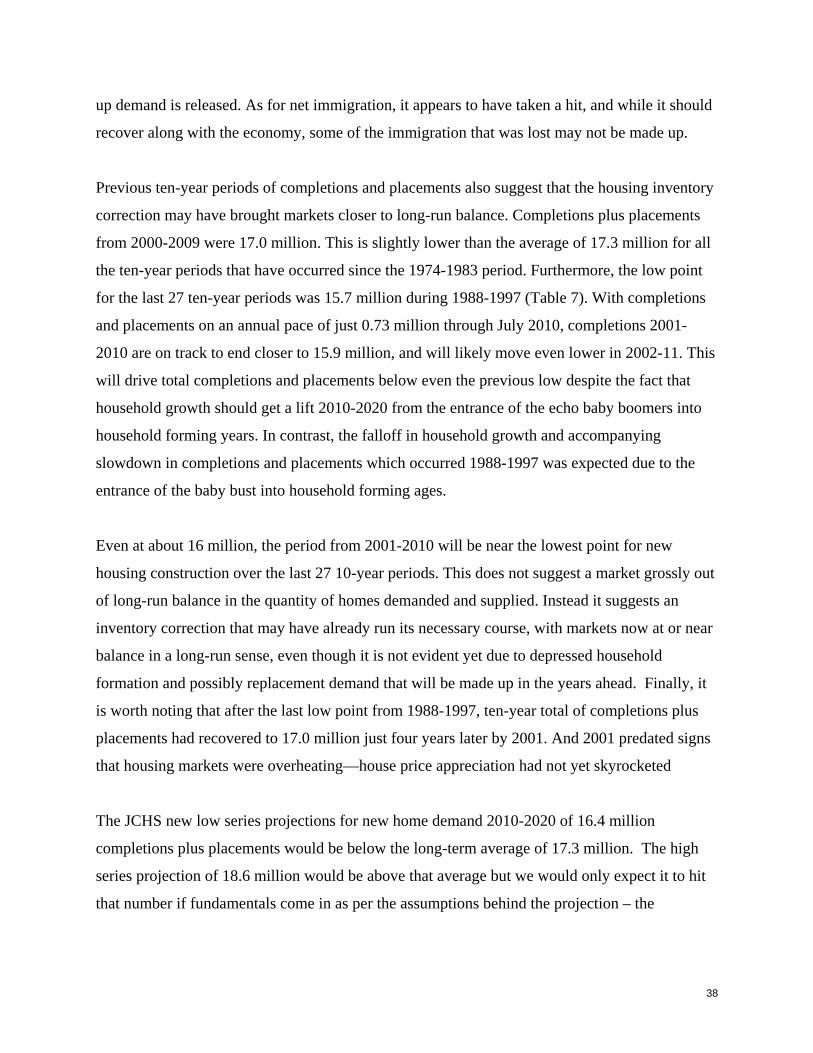
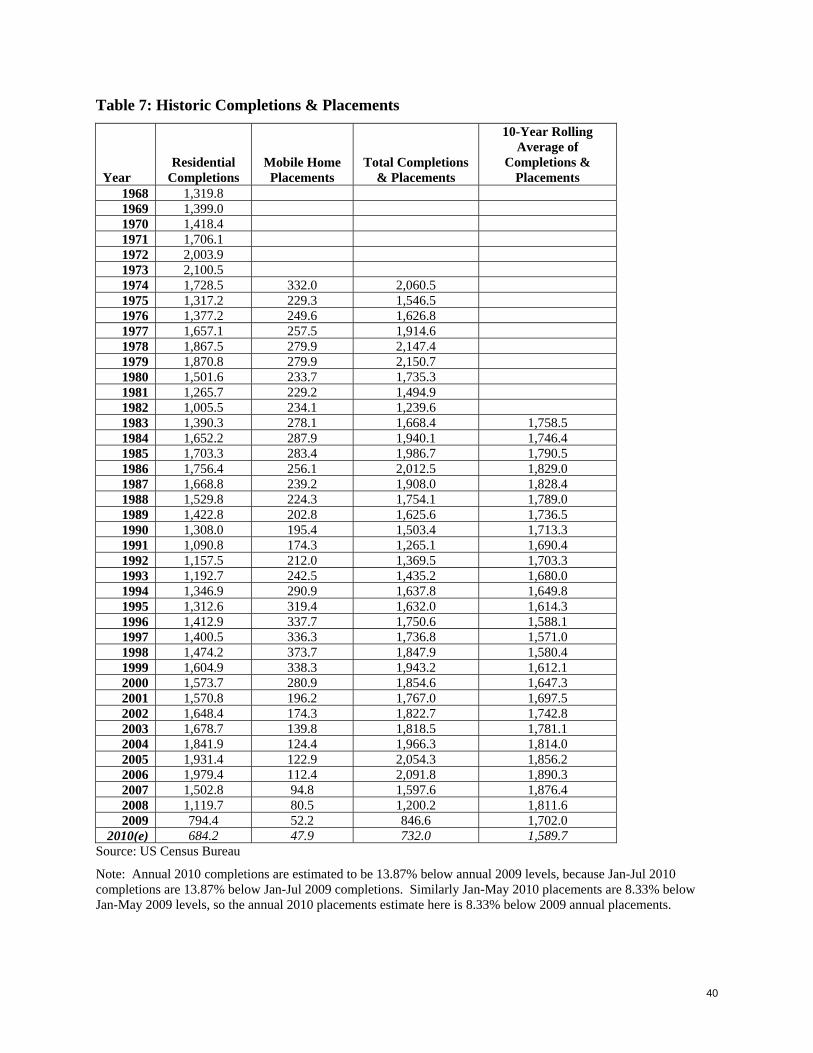
Previous ten-year periods of completions and placements also suggest that the housing inventory
correction may have brought markets closer to long-run balance. Completions plus placements
from 2000-2009 were 17.0 million. This is slightly lower than the average of 17.3 million for all
the ten-year periods that have occurred since the 1974-1983 period. Furthermore, the low point
for the last 27 ten-year periods was 15.7 million during 1988-1997 (Table 7). With completions
and placements on an annual pace of just 0.73 million through July 2010, completions 2001-
2010 are on track to end closer to 15.9 million, and will likely move even lower in 2002-11. This
will drive total completions and placements below even the previous low despite the fact that
household growth should get a lift 2010-2020 from the entrance of the echo baby boomers into
household forming years. In contrast, the falloff in household growth and accompanying
slowdown in completions and placements which occurred 1988-1997 was expected due to the
entrance of the baby bust into household forming ages.
Even at about 16 million, the period from 2001-2010 will be near the lowest point for new
housing construction over the last 27 10-year periods. This does not suggest a market grossly out
of long-run balance in the quantity of homes demanded and supplied. Instead it suggests an
inventory correction that may have already run its necessary course, with markets now at or near
balance in a long-run sense, even though it is not evident yet due to depressed household
formation and possibly replacement demand that will be made up in the years ahead. Finally, it
is worth noting that after the last low point from 1988-1997, ten-year total of completions plus
placements had recovered to 17.0 million just four years later by 2001. And 2001 predated signs
that housing markets were overheating—house price appreciation had not yet skyrocketed
The JCHS new low series projections for new home demand 2010-2020 of 16.4 million
completions plus placements would be below the long-term average of 17.3 million. The high
series projection of 18.6 million would be above that average but we would only expect it to hit
that number if fundamentals come in as per the assumptions behind the projection – the

39
dynamics of the changing number and age composition of the population and immigration as
high as the baseline assumptions of the Census Bureau.
40
Table 7: Historic Completions & Placements
Year Residential
Completions Mobile Home Placements
Total Completions & Placements
10-Year Rolling Average of
Completions & Placements
1968 1,319.8 1969 1,399.0 1970 1,418.4 1971 1,706.1 1972 2,003.9 1973 2,100.5 1974 1,728.5 332.0 2,060.51975 1,317.2 229.3 1,546.51976 1,377.2 249.6 1,626.81977 1,657.1 257.5 1,914.61978 1,867.5 279.9 2,147.41979 1,870.8 279.9 2,150.71980 1,501.6 233.7 1,735.31981 1,265.7 229.2 1,494.91982 1,005.5 234.1 1,239.61983 1,390.3 278.1 1,668.4 1,758.51984 1,652.2 287.9 1,940.1 1,746.41985 1,703.3 283.4 1,986.7 1,790.51986 1,756.4 256.1 2,012.5 1,829.01987 1,668.8 239.2 1,908.0 1,828.41988 1,529.8 224.3 1,754.1 1,789.01989 1,422.8 202.8 1,625.6 1,736.51990 1,308.0 195.4 1,503.4 1,713.31991 1,090.8 174.3 1,265.1 1,690.41992 1,157.5 212.0 1,369.5 1,703.31993 1,192.7 242.5 1,435.2 1,680.01994 1,346.9 290.9 1,637.8 1,649.8
1995 1,312.6 319.4 1,632.0 1,614.3 1996 1,412.9 337.7 1,750.6 1,588.1 1997 1,400.5 336.3 1,736.8 1,571.0 1998 1,474.2 373.7 1,847.9 1,580.4 1999 1,604.9 338.3 1,943.2 1,612.1 2000 1,573.7 280.9 1,854.6 1,647.3 2001 1,570.8 196.2 1,767.0 1,697.5 2002 1,648.4 174.3 1,822.7 1,742.8 2003 1,678.7 139.8 1,818.5 1,781.1 2004 1,841.9 124.4 1,966.3 1,814.0 2005 1,931.4 122.9 2,054.3 1,856.2 2006 1,979.4 112.4 2,091.8 1,890.3 2007 1,502.8 94.8 1,597.6 1,876.42008 1,119.7 80.5 1,200.2 1,811.62009 794.4 52.2 846.6 1,702.0
2010(e) 684.2 47.9 732.0 1,589.7Source: US Census Bureau
Note: Annual 2010 completions are estimated to be 13.87% below annual 2009 levels, because Jan-Jul 2010 completions are 13.87% below Jan-Jul 2009 completions. Similarly Jan-May 2010 placements are 8.33% below Jan-May 2009 levels, so the annual 2010 placements estimate here is 8.33% below 2009 annual placements.
41
Conclusions
This is a time of significant uncertainty about the state of the economy and what the recovery—
should it continue—will look like over the next 5-10 years. Both immigration and headship rates
appear to have been negatively affected by the economic downturn. The specific age groups that
have seen their headship rates driven down, however, do not follow a predictable pattern of
groups hardest hit by high unemployment having the biggest reductions. And some age groups
even saw their headship rates go up. Furthermore, in one of two federal datasets used to examine
age-specific headship rates the declines that did occur took place 2005-2006, before either the
housing or the broader economic recession gathered speed.
Moving ahead, unless there is a long jobless recovery or a further contraction, improved housing
affordability, together with a return to job gains and a restoration of consumer confidence, should
cause households that delayed forming as a result of the recession to form. More importantly, it
should restore net immigration to at least half the levels that the Census Bureau assumed in its
baseline population projections from 2010-2020 as we assume in our low household growth
series. If the Census baseline population projections are correct about a return to higher levels of
immigration—and the coming decade does not see further erosion in age-specific headship
rates—this will be the strongest decade for household growth since the baby boomers entered
housing markets in the 1970s. Immigration since 2005 appears to be running close to half of
Census Bureau baseline projections, and so our new low immigration series—which reflects this
slower than assumed pace and an average of the past three-year average headship rates by age
and race—could prove realistic if immigration does not bounce back. If it does, it will also have
to make up for lost immigration to achieve the Census Bureau’s baseline assumptions, which is
why we treat this as our high immigration series. Actual household growth is likely to come in
somewhere in between our low and high series.
Constructing new home demand projections based on the new low and high immigration
household projections implies new home demand in the range of about 16.4 to 18.7 million. The
long-run average of actual completions plus placements for ten-year periods beginning with
1974-1983 and ending with 2000-2009 is 17.3 million. The lowest ten-year total was 15.7

42
million in 1988-1997 and we are about to reach that level in 2001-2010. But back then a
slowdown was expected due to the entrance of the baby bust generation into household forming
ages. With the echo baby boomers entering household forming ages over the coming decade, that
is not the case this time. It is important to underscore that these projections are not predictions of
actual construction because these will be influenced by whether housing markets reach 2020 in
balance.
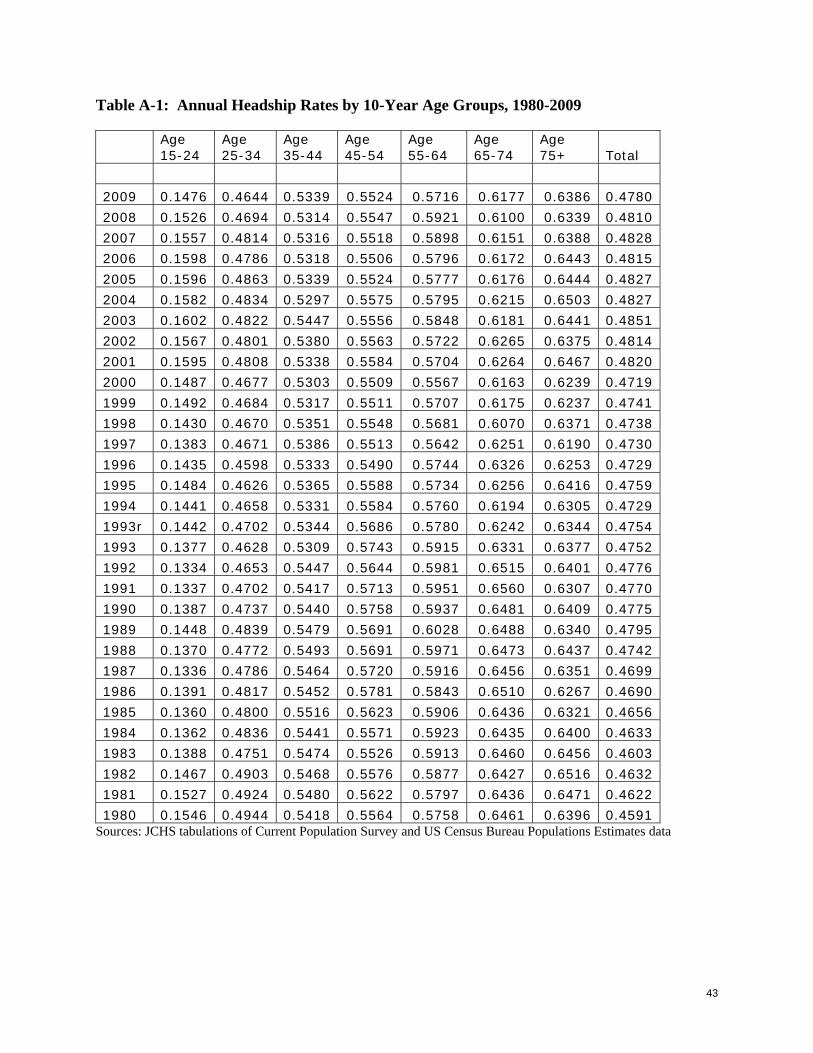
43
Table A-1: Annual Headship Rates by 10-Year Age Groups, 1980-2009
Age 15-24
Age 25-34
Age 35-44
Age 45-54
Age 55-64
Age 65-74
Age 75+ Total
2009 0.1476 0.4644 0.5339 0.5524 0.5716 0.6177 0.6386 0.4780
2008 0.1526 0.4694 0.5314 0.5547 0.5921 0.6100 0.6339 0.4810
2007 0.1557 0.4814 0.5316 0.5518 0.5898 0.6151 0.6388 0.4828
2006 0.1598 0.4786 0.5318 0.5506 0.5796 0.6172 0.6443 0.4815
2005 0.1596 0.4863 0.5339 0.5524 0.5777 0.6176 0.6444 0.4827
2004 0.1582 0.4834 0.5297 0.5575 0.5795 0.6215 0.6503 0.4827
2003 0.1602 0.4822 0.5447 0.5556 0.5848 0.6181 0.6441 0.4851
2002 0.1567 0.4801 0.5380 0.5563 0.5722 0.6265 0.6375 0.4814
2001 0.1595 0.4808 0.5338 0.5584 0.5704 0.6264 0.6467 0.4820
2000 0.1487 0.4677 0.5303 0.5509 0.5567 0.6163 0.6239 0.4719
1999 0.1492 0.4684 0.5317 0.5511 0.5707 0.6175 0.6237 0.4741
1998 0.1430 0.4670 0.5351 0.5548 0.5681 0.6070 0.6371 0.4738
1997 0.1383 0.4671 0.5386 0.5513 0.5642 0.6251 0.6190 0.4730
1996 0.1435 0.4598 0.5333 0.5490 0.5744 0.6326 0.6253 0.4729
1995 0.1484 0.4626 0.5365 0.5588 0.5734 0.6256 0.6416 0.4759
1994 0.1441 0.4658 0.5331 0.5584 0.5760 0.6194 0.6305 0.4729
1993r 0.1442 0.4702 0.5344 0.5686 0.5780 0.6242 0.6344 0.4754
1993 0.1377 0.4628 0.5309 0.5743 0.5915 0.6331 0.6377 0.4752
1992 0.1334 0.4653 0.5447 0.5644 0.5981 0.6515 0.6401 0.4776
1991 0.1337 0.4702 0.5417 0.5713 0.5951 0.6560 0.6307 0.4770
1990 0.1387 0.4737 0.5440 0.5758 0.5937 0.6481 0.6409 0.4775
1989 0.1448 0.4839 0.5479 0.5691 0.6028 0.6488 0.6340 0.4795
1988 0.1370 0.4772 0.5493 0.5691 0.5971 0.6473 0.6437 0.4742
1987 0.1336 0.4786 0.5464 0.5720 0.5916 0.6456 0.6351 0.4699
1986 0.1391 0.4817 0.5452 0.5781 0.5843 0.6510 0.6267 0.4690
1985 0.1360 0.4800 0.5516 0.5623 0.5906 0.6436 0.6321 0.4656
1984 0.1362 0.4836 0.5441 0.5571 0.5923 0.6435 0.6400 0.4633
1983 0.1388 0.4751 0.5474 0.5526 0.5913 0.6460 0.6456 0.4603
1982 0.1467 0.4903 0.5468 0.5576 0.5877 0.6427 0.6516 0.4632
1981 0.1527 0.4924 0.5480 0.5622 0.5797 0.6436 0.6471 0.4622
1980 0.1546 0.4944 0.5418 0.5564 0.5758 0.6461 0.6396 0.4591 Sources: JCHS tabulations of Current Population Survey and US Census Bureau Populations Estimates data
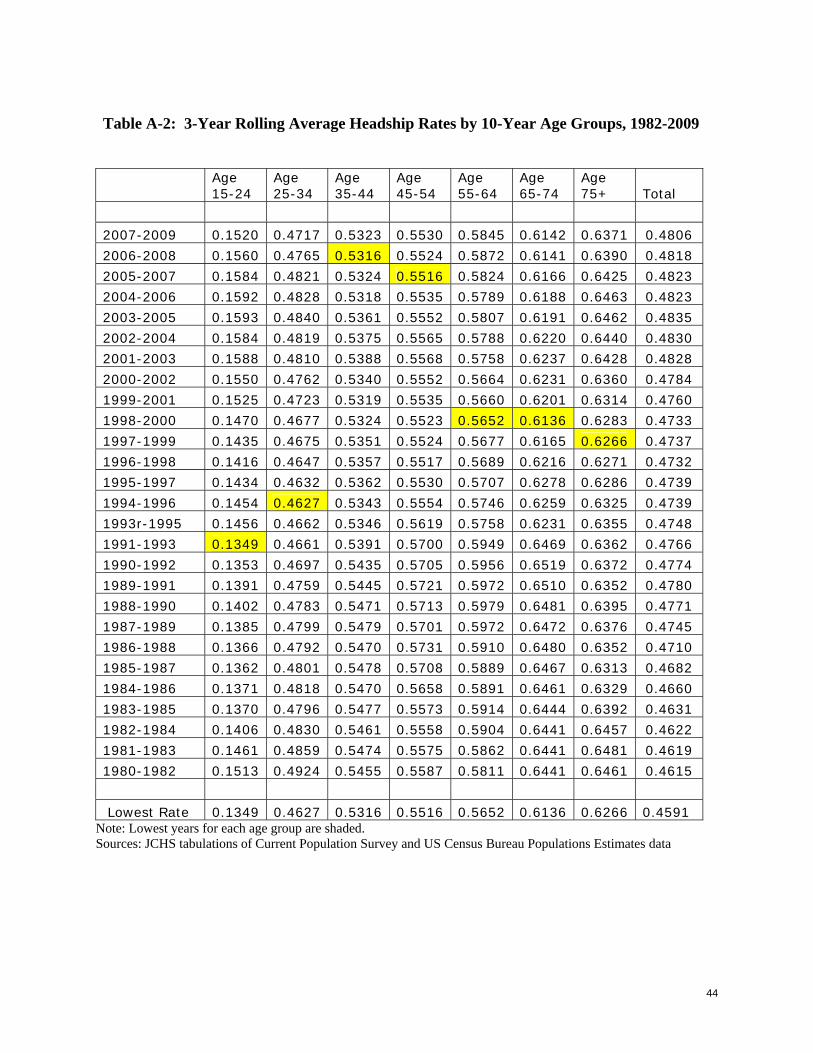
44
Table A-2: 3-Year Rolling Average Headship Rates by 10-Year Age Groups, 1982-2009
Age 15-24
Age 25-34
Age 35-44
Age 45-54
Age 55-64
Age 65-74
Age 75+ Total
2007-2009 0.1520 0.4717 0.5323 0.5530 0.5845 0.6142 0.6371 0.4806
2006-2008 0.1560 0.4765 0.5316 0.5524 0.5872 0.6141 0.6390 0.4818
2005-2007 0.1584 0.4821 0.5324 0.5516 0.5824 0.6166 0.6425 0.4823
2004-2006 0.1592 0.4828 0.5318 0.5535 0.5789 0.6188 0.6463 0.4823
2003-2005 0.1593 0.4840 0.5361 0.5552 0.5807 0.6191 0.6462 0.4835
2002-2004 0.1584 0.4819 0.5375 0.5565 0.5788 0.6220 0.6440 0.4830
2001-2003 0.1588 0.4810 0.5388 0.5568 0.5758 0.6237 0.6428 0.4828
2000-2002 0.1550 0.4762 0.5340 0.5552 0.5664 0.6231 0.6360 0.4784
1999-2001 0.1525 0.4723 0.5319 0.5535 0.5660 0.6201 0.6314 0.4760
1998-2000 0.1470 0.4677 0.5324 0.5523 0.5652 0.6136 0.6283 0.4733
1997-1999 0.1435 0.4675 0.5351 0.5524 0.5677 0.6165 0.6266 0.4737
1996-1998 0.1416 0.4647 0.5357 0.5517 0.5689 0.6216 0.6271 0.4732
1995-1997 0.1434 0.4632 0.5362 0.5530 0.5707 0.6278 0.6286 0.4739
1994-1996 0.1454 0.4627 0.5343 0.5554 0.5746 0.6259 0.6325 0.4739
1993r-1995 0.1456 0.4662 0.5346 0.5619 0.5758 0.6231 0.6355 0.4748
1991-1993 0.1349 0.4661 0.5391 0.5700 0.5949 0.6469 0.6362 0.4766
1990-1992 0.1353 0.4697 0.5435 0.5705 0.5956 0.6519 0.6372 0.4774
1989-1991 0.1391 0.4759 0.5445 0.5721 0.5972 0.6510 0.6352 0.4780
1988-1990 0.1402 0.4783 0.5471 0.5713 0.5979 0.6481 0.6395 0.4771
1987-1989 0.1385 0.4799 0.5479 0.5701 0.5972 0.6472 0.6376 0.4745
1986-1988 0.1366 0.4792 0.5470 0.5731 0.5910 0.6480 0.6352 0.4710
1985-1987 0.1362 0.4801 0.5478 0.5708 0.5889 0.6467 0.6313 0.4682
1984-1986 0.1371 0.4818 0.5470 0.5658 0.5891 0.6461 0.6329 0.4660
1983-1985 0.1370 0.4796 0.5477 0.5573 0.5914 0.6444 0.6392 0.4631
1982-1984 0.1406 0.4830 0.5461 0.5558 0.5904 0.6441 0.6457 0.4622
1981-1983 0.1461 0.4859 0.5474 0.5575 0.5862 0.6441 0.6481 0.4619
1980-1982 0.1513 0.4924 0.5455 0.5587 0.5811 0.6441 0.6461 0.4615
Lowest Rate 0.1349 0.4627 0.5316 0.5516 0.5652 0.6136 0.6266 0.4591 Note: Lowest years for each age group are shaded. Sources: JCHS tabulations of Current Population Survey and US Census Bureau Populations Estimates data
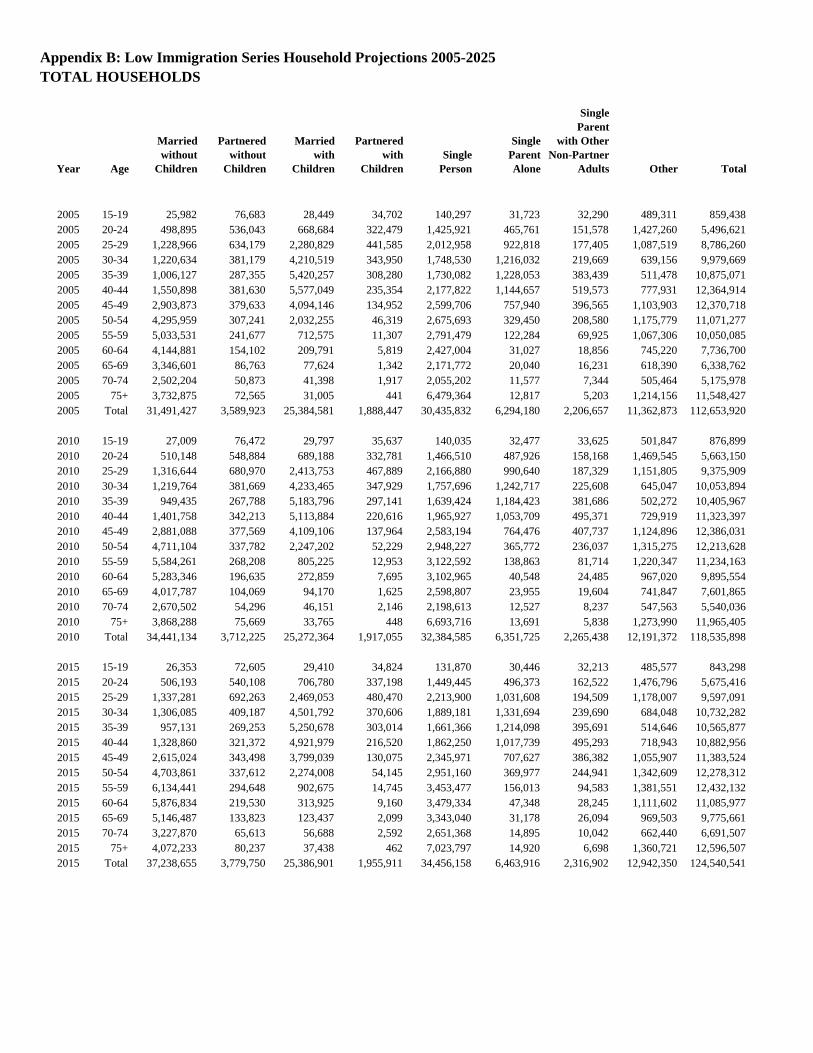
Appendix B: Low Immigration Series Household Projections 2005-2025TOTAL HOUSEHOLDS
Year Age
Married without
Children
Partnered without
Children
Married with
Children
Partneredwith
ChildrenSingle
Person
Single Parent Alone
Single Parent
with OtherNon-Partner
Adults Other Total
2005 15-19 25,982 76,683 28,449 34,702 140,297 31,723 32,290 489,311 859,4382005 20-24 498,895 536,043 668,684 322,479 1,425,921 465,761 151,578 1,427,260 5,496,6212005 25-29 1,228,966 634,179 2,280,829 441,585 2,012,958 922,818 177,405 1,087,519 8,786,2602005 30-34 1,220,634 381,179 4,210,519 343,950 1,748,530 1,216,032 219,669 639,156 9,979,6692005 35-39 1,006,127 287,355 5,420,257 308,280 1,730,082 1,228,053 383,439 511,478 10,875,0712005 40-44 1,550,898 381,630 5,577,049 235,354 2,177,822 1,144,657 519,573 777,931 12,364,9142005 45-49 2,903,873 379,633 4,094,146 134,952 2,599,706 757,940 396,565 1,103,903 12,370,7182005 50-54 4,295,959 307,241 2,032,255 46,319 2,675,693 329,450 208,580 1,175,779 11,071,2772005 55-59 5,033,531 241,677 712,575 11,307 2,791,479 122,284 69,925 1,067,306 10,050,0852005 60-64 4,144,881 154,102 209,791 5,819 2,427,004 31,027 18,856 745,220 7,736,7002005 65-69 3,346,601 86,763 77,624 1,342 2,171,772 20,040 16,231 618,390 6,338,7622005 70-74 2,502,204 50,873 41,398 1,917 2,055,202 11,577 7,344 505,464 5,175,9782005 75+ 3,732,875 72,565 31,005 441 6,479,364 12,817 5,203 1,214,156 11,548,4272005 Total 31,491,427 3,589,923 25,384,581 1,888,447 30,435,832 6,294,180 2,206,657 11,362,873 112,653,920
2010 15-19 27,009 76,472 29,797 35,637 140,035 32,477 33,625 501,847 876,8992010 20-24 510,148 548,884 689,188 332,781 1,466,510 487,926 158,168 1,469,545 5,663,1502010 25-29 1,316,644 680,970 2,413,753 467,889 2,166,880 990,640 187,329 1,151,805 9,375,9092010 30-34 1,219,764 381,669 4,233,465 347,929 1,757,696 1,242,717 225,608 645,047 10,053,8942010 35-39 949,435 267,788 5,183,796 297,141 1,639,424 1,184,423 381,686 502,272 10,405,9672010 40-44 1,401,758 342,213 5,113,884 220,616 1,965,927 1,053,709 495,371 729,919 11,323,3972010 45-49 2,881,088 377,569 4,109,106 137,964 2,583,194 764,476 407,737 1,124,896 12,386,0312010 50-54 4,711,104 337,782 2,247,202 52,229 2,948,227 365,772 236,037 1,315,275 12,213,6282010 55-59 5,584,261 268,208 805,225 12,953 3,122,592 138,863 81,714 1,220,347 11,234,1632010 60-64 5,283,346 196,635 272,859 7,695 3,102,965 40,548 24,485 967,020 9,895,5542010 65-69 4,017,787 104,069 94,170 1,625 2,598,807 23,955 19,604 741,847 7,601,8652010 70-74 2,670,502 54,296 46,151 2,146 2,198,613 12,527 8,237 547,563 5,540,0362010 75+ 3,868,288 75,669 33,765 448 6,693,716 13,691 5,838 1,273,990 11,965,4052010 Total 34,441,134 3,712,225 25,272,364 1,917,055 32,384,585 6,351,725 2,265,438 12,191,372 118,535,898
2015 15-19 26,353 72,605 29,410 34,824 131,870 30,446 32,213 485,577 843,2982015 20-24 506,193 540,108 706,780 337,198 1,449,445 496,373 162,522 1,476,796 5,675,4162015 25-29 1,337,281 692,263 2,469,053 480,470 2,213,900 1,031,608 194,509 1,178,007 9,597,0912015 30-34 1,306,085 409,187 4,501,792 370,606 1,889,181 1,331,694 239,690 684,048 10,732,2822015 35-39 957,131 269,253 5,250,678 303,014 1,661,366 1,214,098 395,691 514,646 10,565,8772015 40-44 1,328,860 321,372 4,921,979 216,520 1,862,250 1,017,739 495,293 718,943 10,882,9562015 45-49 2,615,024 343,498 3,799,039 130,075 2,345,971 707,627 386,382 1,055,907 11,383,5242015 50-54 4,703,861 337,612 2,274,008 54,145 2,951,160 369,977 244,941 1,342,609 12,278,3122015 55-59 6,134,441 294,648 902,675 14,745 3,453,477 156,013 94,583 1,381,551 12,432,1322015 60-64 5,876,834 219,530 313,925 9,160 3,479,334 47,348 28,245 1,111,602 11,085,9772015 65-69 5,146,487 133,823 123,437 2,099 3,343,040 31,178 26,094 969,503 9,775,6612015 70-74 3,227,870 65,613 56,688 2,592 2,651,368 14,895 10,042 662,440 6,691,5072015 75+ 4,072,233 80,237 37,438 462 7,023,797 14,920 6,698 1,360,721 12,596,5072015 Total 37,238,655 3,779,750 25,386,901 1,955,911 34,456,158 6,463,916 2,316,902 12,942,350 124,540,541
Appendix B: Low Immigration Series Household Projections 2005-2025TOTAL HOUSEHOLDS
Year Age
Married without
Children
Partnered without
Children
Married with
Children
Partneredwith
ChildrenSingle
Person
Single Parent Alone
Single Parent
with OtherNon-Partner
Adults Other Total
2020 15-19 28,088 75,374 31,605 37,032 136,248 31,596 34,005 513,327 887,2752020 20-24 482,112 507,653 689,533 323,627 1,359,149 465,287 155,380 1,412,954 5,395,6952020 25-29 1,311,927 677,671 2,485,200 485,569 2,176,637 1,044,678 200,408 1,186,005 9,568,0962020 30-34 1,331,459 417,965 4,612,153 382,039 1,938,364 1,387,886 250,747 703,475 11,024,0882020 35-39 1,031,031 290,828 5,624,131 324,487 1,795,371 1,308,441 422,709 550,053 11,347,0512020 40-44 1,347,829 325,328 5,009,437 222,689 1,893,731 1,044,209 514,807 743,069 11,101,0992020 45-49 2,489,580 327,810 3,688,861 128,478 2,236,094 687,260 383,932 1,040,760 10,982,7742020 50-54 4,310,928 309,112 2,127,353 52,043 2,707,386 344,076 235,128 1,262,255 11,348,2812020 55-59 6,137,068 294,101 930,028 15,481 3,471,213 159,980 101,131 1,433,422 12,542,4242020 60-64 6,470,242 242,694 358,530 10,834 3,856,813 54,607 32,006 1,263,281 12,289,0072020 65-69 5,755,246 150,333 142,805 2,386 3,773,393 36,090 30,920 1,121,180 11,012,3522020 70-74 4,155,367 84,479 75,985 3,538 3,429,674 19,768 13,636 868,349 8,650,7952020 75+ 4,590,060 90,845 43,849 511 7,889,276 17,247 8,046 1,549,275 14,189,1112020 Total 39,440,937 3,794,193 25,819,470 1,988,714 36,663,349 6,601,125 2,382,854 13,647,406 130,338,047
2025 15-19 29,075 76,803 32,804 38,246 138,763 32,345 35,072 529,277 912,3862025 20-24 500,917 522,095 732,759 339,694 1,397,552 482,281 163,346 1,476,948 5,615,5932025 25-29 1,234,697 634,967 2,382,335 464,279 2,029,777 975,071 192,204 1,136,939 9,050,2692025 30-34 1,314,610 412,969 4,632,534 386,035 1,920,916 1,411,982 259,560 713,657 11,052,2632025 35-39 1,060,112 298,397 5,803,842 337,055 1,856,576 1,367,399 445,896 573,847 11,743,1242025 40-44 1,455,843 351,813 5,387,012 238,007 2,052,768 1,127,209 552,529 800,178 11,965,3592025 45-49 2,535,880 334,642 3,775,514 132,923 2,283,815 707,719 399,379 1,077,553 11,247,4242025 50-54 4,144,500 296,778 2,090,294 52,375 2,607,665 335,907 236,416 1,245,246 11,009,1812025 55-59 5,641,069 268,663 889,361 15,097 3,198,387 150,996 100,782 1,375,267 11,639,6212025 60-64 6,487,440 244,415 378,109 11,895 3,885,809 57,662 32,850 1,314,367 12,412,5462025 65-69 6,370,220 166,810 163,947 2,700 4,210,981 41,373 36,163 1,281,034 12,273,2292025 70-74 4,668,148 95,123 90,713 4,399 3,889,638 23,438 16,674 1,004,923 9,793,0562025 75+ 5,597,824 111,443 55,520 612 9,596,612 21,630 10,468 1,912,116 17,306,2252025 Total 41,040,336 3,814,918 26,414,745 2,023,315 39,069,259 6,735,012 2,481,339 14,441,352 136,020,276
Household Growth2005-10 2,949,707 122,302 -112,218 28,608 1,948,754 57,545 58,781 828,499 5,881,9782010-15 2,797,521 67,524 114,537 38,856 2,071,572 112,191 51,464 750,977 6,004,6432015-20 2,202,283 14,443 432,569 32,803 2,207,191 137,209 65,952 705,056 5,797,5062020-25 1,599,398 20,726 595,275 34,602 2,405,910 133,887 98,485 793,946 5,682,229
Appendix B: Low Immigration Series Household Projections 2005-2025NON-HISPANIC WHITE HOUSEHOLDS
Year Age
Married without
Children
Partnered without
Children
Married with
Children
Partnered with
ChildrenSingle
Person
Single Parent Alone
Single Parent
with Other Non-
Partner Adults Other Total
2005 15-19 11,618 54,617 14,021 20,115 85,427 10,104 10,439 245,944 452,2862005 20-24 379,160 409,126 386,432 189,957 980,339 174,949 61,266 882,090 3,463,3192005 25-29 941,663 492,958 1,454,962 249,586 1,377,045 358,625 66,076 625,731 5,566,6462005 30-34 884,524 276,400 2,769,674 203,037 1,135,187 517,487 75,350 349,465 6,211,1242005 35-39 739,904 224,797 3,755,328 188,521 1,129,402 632,212 140,575 262,714 7,073,4542005 40-44 1,180,322 301,706 4,077,332 150,510 1,548,147 706,156 231,392 400,520 8,596,0842005 45-49 2,277,959 287,165 3,035,503 86,241 1,913,158 499,454 212,465 643,005 8,954,9502005 50-54 3,440,792 236,738 1,507,270 28,565 1,951,079 223,629 116,678 730,130 8,234,8812005 55-59 4,131,452 197,648 502,669 7,114 2,091,200 79,462 32,361 649,292 7,691,1992005 60-64 3,463,820 125,650 134,258 2,548 1,873,216 15,424 9,872 452,574 6,077,3622005 65-69 2,794,610 68,318 50,132 1,062 1,657,048 12,355 7,118 372,204 4,962,8482005 70-74 2,137,272 43,192 20,900 303 1,614,479 4,725 2,155 334,623 4,157,6512005 75+ 3,308,316 58,155 17,080 441 5,665,350 7,626 1,202 907,969 9,966,1392005 Total 25,691,411 2,776,470 17,725,561 1,128,000 23,021,078 3,242,210 966,950 6,856,262 81,407,942
2010 15-19 11,075 52,068 13,367 19,176 81,439 9,632 9,952 234,464 431,1742010 20-24 384,180 414,542 391,548 192,472 993,319 177,265 62,077 893,768 3,509,1722010 25-29 1,023,262 535,675 1,581,040 271,213 1,496,371 389,702 71,802 679,953 6,049,0182010 30-34 874,343 273,219 2,737,794 200,700 1,122,121 511,531 74,483 345,442 6,139,6312010 35-39 661,263 200,905 3,356,189 168,484 1,009,362 565,017 125,634 234,791 6,321,6442010 40-44 1,015,270 259,516 3,507,174 129,463 1,331,661 607,410 199,035 344,513 7,394,0432010 45-49 2,182,054 275,075 2,907,705 82,610 1,832,612 478,427 203,520 615,934 8,577,9382010 50-54 3,673,690 252,762 1,609,294 30,499 2,083,142 238,766 124,576 779,551 8,792,2782010 55-59 4,467,619 213,730 543,570 7,693 2,261,356 85,928 34,994 702,123 8,317,0132010 60-64 4,340,691 157,458 168,246 3,192 2,347,424 19,329 12,371 567,144 7,615,8562010 65-69 3,337,684 81,595 59,874 1,269 1,979,060 14,756 8,501 444,534 5,927,2732010 70-74 2,240,875 45,285 21,913 318 1,692,740 4,954 2,260 350,844 4,359,1902010 75+ 3,366,121 59,171 17,379 448 5,764,339 7,759 1,223 923,833 10,140,2732010 Total 27,578,127 2,821,001 16,915,093 1,107,538 23,994,946 3,110,476 930,428 7,116,896 83,574,504
2015 15-19 10,186 47,886 12,293 17,636 74,899 8,859 9,153 215,635 396,5472015 20-24 366,026 394,954 373,046 183,377 946,381 168,889 59,144 851,535 3,343,3512015 25-29 1,032,507 540,515 1,595,325 273,664 1,509,891 393,222 72,450 686,096 6,103,6712015 30-34 948,717 296,459 2,970,678 217,772 1,217,572 555,043 80,819 374,827 6,661,8862015 35-39 654,957 198,989 3,324,182 166,877 999,736 559,629 124,436 232,552 6,261,3572015 40-44 908,642 232,261 3,138,834 115,866 1,191,803 543,617 178,131 308,331 6,617,4852015 45-49 1,880,178 237,019 2,505,438 71,181 1,579,079 412,239 175,364 530,723 7,391,2222015 50-54 3,525,556 242,570 1,544,402 29,269 1,999,144 229,138 119,553 748,117 8,437,7492015 55-59 4,776,450 228,505 581,146 8,225 2,417,676 91,868 37,413 750,658 8,891,9402015 60-64 4,704,579 170,658 182,350 3,460 2,544,213 20,949 13,408 614,689 8,254,3072015 65-69 4,197,289 102,609 75,295 1,596 2,488,758 18,557 10,691 559,022 7,453,8152015 70-74 2,691,726 54,396 26,322 382 2,033,310 5,951 2,715 421,432 5,236,2342015 75+ 3,468,078 60,964 17,905 462 5,938,936 7,994 1,260 951,815 10,447,4152015 Total 29,164,890 2,807,785 16,347,216 1,089,767 24,941,397 3,015,955 884,536 7,245,431 85,496,977
Appendix B: Low Immigration Series Household Projections 2005-2025NON-HISPANIC WHITE HOUSEHOLDS
Year Age
Married without
Children
Partnered without
Children
Married with
Children
Partnered with
ChildrenSingle
Person
Single Parent Alone
Single Parent
with Other Non-
Partner Adults Other Total
2020 15-19 10,236 48,123 12,354 17,723 75,270 8,902 9,198 216,701 398,5082020 20-24 336,322 362,902 342,772 168,496 869,580 155,183 54,344 782,431 3,072,0312020 25-29 982,314 514,239 1,517,772 260,360 1,436,491 374,107 68,928 652,743 5,806,9552020 30-34 957,700 299,266 2,998,808 219,834 1,229,101 560,299 81,584 378,376 6,724,9672020 35-39 711,992 216,317 3,613,663 181,409 1,086,797 608,363 135,272 252,804 6,806,6162020 40-44 901,804 230,513 3,115,213 114,994 1,182,834 539,526 176,791 306,010 6,567,6852020 45-49 1,686,592 212,616 2,247,475 63,853 1,416,495 369,794 157,308 476,079 6,630,2132020 50-54 3,045,546 209,544 1,334,129 25,284 1,726,957 197,940 103,275 646,260 7,288,9352020 55-59 4,590,030 219,586 558,464 7,904 2,323,316 88,282 35,953 721,361 8,544,8962020 60-64 5,040,173 182,832 195,358 3,707 2,725,700 22,444 14,365 658,537 8,843,1152020 65-69 4,564,219 111,579 81,877 1,735 2,706,327 20,179 11,625 607,892 8,105,4332020 70-74 3,401,830 68,747 33,266 483 2,569,717 7,521 3,431 532,609 6,617,6052020 75+ 3,838,674 67,478 19,819 511 6,573,565 8,849 1,394 1,053,525 11,563,8152020 Total 30,067,433 2,743,742 16,070,969 1,066,293 25,922,150 2,961,389 853,469 7,285,329 86,970,775
2025 15-19 10,216 48,025 12,329 17,687 75,117 8,884 9,179 216,261 397,6992025 20-24 337,823 364,521 344,302 169,248 873,460 155,876 54,587 785,922 3,085,7372025 25-29 901,130 471,739 1,392,334 238,842 1,317,770 343,188 63,232 598,797 5,327,0322025 30-34 911,922 284,962 2,855,466 209,326 1,170,350 533,517 77,684 360,290 6,403,5162025 35-39 720,440 218,884 3,656,538 183,562 1,099,691 615,581 136,877 255,803 6,887,3752025 40-44 981,546 250,896 3,390,678 125,163 1,287,427 587,234 192,424 333,069 7,148,4372025 45-49 1,677,586 211,480 2,235,474 63,512 1,408,932 367,820 156,468 473,537 6,594,8092025 50-54 2,739,166 188,464 1,199,917 22,740 1,553,226 178,028 92,886 581,246 6,555,6732025 55-59 3,971,492 189,996 483,207 6,839 2,010,233 76,385 31,108 624,152 7,393,4132025 60-64 4,853,167 176,048 188,109 3,569 2,624,568 21,611 13,832 634,103 8,515,0082025 65-69 4,904,667 119,902 87,984 1,864 2,908,193 21,684 12,493 653,235 8,710,0232025 70-74 3,717,350 75,123 36,352 528 2,808,058 8,219 3,749 582,009 7,231,3872025 75+ 4,593,618 80,749 23,716 612 7,866,376 10,589 1,668 1,260,720 13,838,0482025 Total 30,320,122 2,680,789 15,906,405 1,043,492 27,003,402 2,928,615 846,187 7,359,144 88,088,156
Household Growth2005-10 1,886,715 44,531 -810,468 -20,462 973,868 -131,734 -36,522 260,634 2,166,5632010-15 1,586,763 -13,216 -567,877 -17,771 946,451 -94,522 -45,892 128,535 1,922,4722015-20 902,543 -64,042 -276,247 -23,474 980,753 -54,565 -31,067 39,897 1,473,7982020-25 252,689 -62,953 -164,564 -22,802 1,081,252 -32,774 -7,283 73,816 1,117,381
Appendix B: Low Immigration Series Household Projections 2005-2025NON-HISPANIC BLACK HOUSEHOLDS
Year Age
Married without
Children
Partnered without
Children
Married with
Children
Partnered with
ChildrenSingle
Person
Single Parent Alone
Single Parent
with Other Non-
Partner Adults Other Total
2005 15-19 4,315 6,815 2,087 1,715 29,177 15,000 11,835 78,562 149,5072005 20-24 18,150 50,254 48,285 45,730 235,241 200,121 47,305 179,209 824,2952005 25-29 58,933 41,717 164,339 61,244 318,600 375,077 49,280 109,093 1,178,2842005 30-34 82,640 34,459 289,657 51,907 302,223 419,627 72,507 74,641 1,327,6612005 35-39 92,309 26,653 415,463 46,568 330,088 358,443 123,777 95,985 1,489,2862005 40-44 153,354 37,526 408,378 25,296 372,872 244,852 147,261 204,071 1,593,6082005 45-49 280,169 47,458 327,947 20,114 405,058 143,201 102,707 254,363 1,581,0172005 50-54 319,960 36,512 154,848 6,904 428,318 59,549 47,050 256,932 1,310,0722005 55-59 328,265 22,361 63,913 1,477 420,994 25,487 16,902 218,615 1,098,0142005 60-64 247,409 12,428 24,606 1,335 331,491 9,923 7,206 165,428 799,8252005 65-69 196,458 8,767 6,199 0 295,526 4,712 4,205 134,179 650,0452005 70-74 148,696 3,101 7,020 1,068 263,836 6,147 2,840 97,521 530,2292005 75+ 166,163 8,708 6,277 0 499,109 3,169 2,189 186,258 871,8742005 Total 2,096,820 336,758 1,919,019 263,360 4,232,533 1,865,309 635,064 2,054,857 13,403,719
2010 15-19 4,384 6,923 2,120 1,743 29,639 15,238 12,022 79,806 151,8732010 20-24 19,545 54,115 51,994 49,242 253,311 215,493 50,938 192,975 887,6122010 25-29 65,142 46,112 181,653 67,697 352,165 414,592 54,472 120,586 1,302,4182010 30-34 86,758 36,176 304,090 54,494 317,282 440,536 76,120 78,360 1,393,8152010 35-39 89,945 25,970 404,820 45,375 321,633 349,261 120,606 93,526 1,451,1362010 40-44 142,261 34,811 378,837 23,466 345,900 227,140 136,608 189,309 1,478,3332010 45-49 288,621 48,889 337,841 20,721 417,278 147,521 105,805 262,037 1,628,7142010 50-54 371,580 42,403 179,830 8,018 497,421 69,156 54,641 298,384 1,521,4322010 55-59 396,573 27,014 77,212 1,785 508,598 30,791 20,420 264,106 1,326,4982010 60-64 329,651 16,559 32,786 1,779 441,683 13,222 9,601 220,419 1,065,6982010 65-69 226,142 10,092 7,135 0 340,179 5,424 4,841 154,454 748,2672010 70-74 162,152 3,381 7,655 1,165 287,712 6,704 3,097 106,346 578,2122010 75+ 177,541 9,305 6,707 0 533,285 3,387 2,339 199,012 931,5752010 Total 2,360,293 361,749 1,972,681 275,484 4,646,084 1,938,463 651,510 2,259,319 14,465,582
2015 15-19 3,882 6,132 1,878 1,543 26,251 13,496 10,648 70,683 134,5132015 20-24 19,858 54,983 52,828 50,033 257,377 218,952 51,756 196,072 901,8592015 25-29 69,796 49,406 194,631 72,533 377,326 444,212 58,364 129,202 1,395,4702015 30-34 95,739 39,921 335,570 60,135 350,128 486,142 84,000 86,472 1,538,1062015 35-39 94,814 27,376 426,737 47,832 339,046 368,170 127,136 98,590 1,529,7002015 40-44 139,274 34,080 370,882 22,973 338,636 222,371 133,740 185,334 1,447,2892015 45-49 268,979 45,562 314,848 19,311 388,879 137,481 98,605 244,203 1,517,8682015 50-54 384,500 43,877 186,083 8,297 514,716 71,561 56,540 308,758 1,574,3322015 55-59 462,968 31,537 90,140 2,083 593,749 35,946 23,838 308,324 1,548,5852015 60-64 400,856 20,136 39,868 2,163 537,087 16,077 11,675 268,030 1,295,8902015 65-69 304,202 13,575 9,598 0 457,603 7,296 6,512 207,768 1,006,5542015 70-74 189,128 3,944 8,929 1,358 335,578 7,819 3,612 124,039 674,4072015 75+ 195,070 10,223 7,370 0 585,938 3,721 2,570 218,661 1,023,5532015 Total 2,629,067 380,752 2,039,361 288,262 5,102,312 2,033,243 668,995 2,446,135 15,588,126
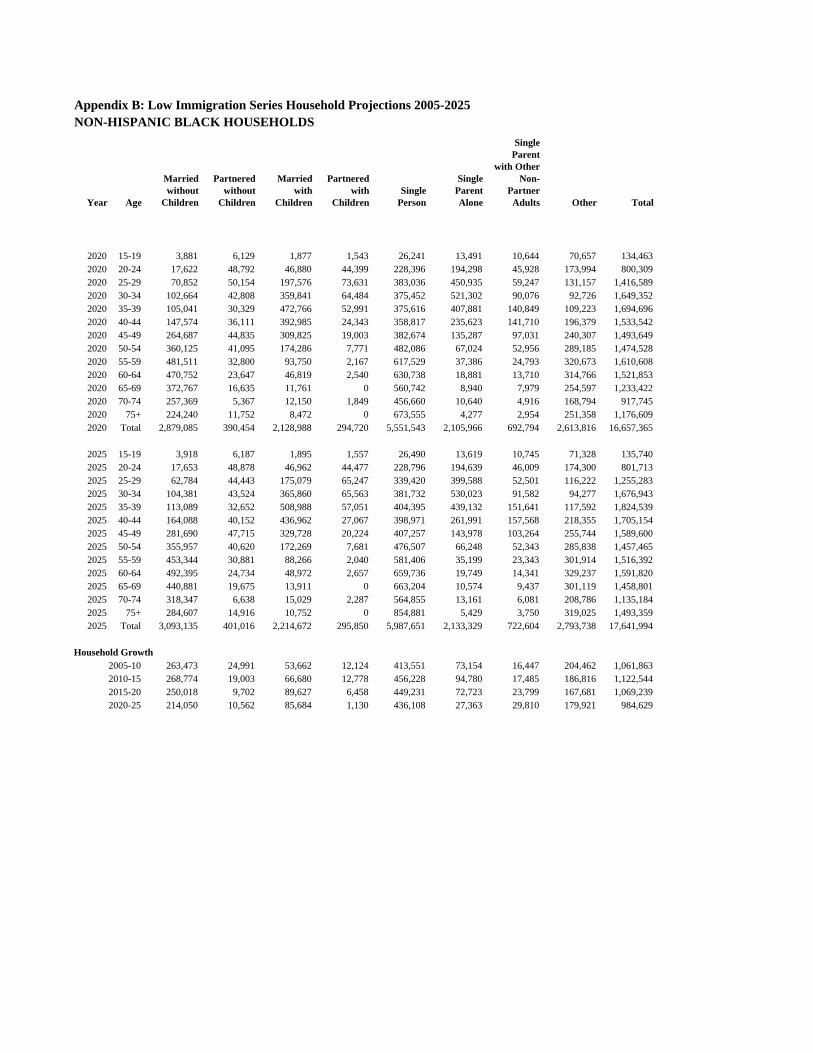
Appendix B: Low Immigration Series Household Projections 2005-2025NON-HISPANIC BLACK HOUSEHOLDS
Year Age
Married without
Children
Partnered without
Children
Married with
Children
Partnered with
ChildrenSingle
Person
Single Parent Alone
Single Parent
with Other Non-
Partner Adults Other Total
2020 15-19 3,881 6,129 1,877 1,543 26,241 13,491 10,644 70,657 134,4632020 20-24 17,622 48,792 46,880 44,399 228,396 194,298 45,928 173,994 800,3092020 25-29 70,852 50,154 197,576 73,631 383,036 450,935 59,247 131,157 1,416,5892020 30-34 102,664 42,808 359,841 64,484 375,452 521,302 90,076 92,726 1,649,3522020 35-39 105,041 30,329 472,766 52,991 375,616 407,881 140,849 109,223 1,694,6962020 40-44 147,574 36,111 392,985 24,343 358,817 235,623 141,710 196,379 1,533,5422020 45-49 264,687 44,835 309,825 19,003 382,674 135,287 97,031 240,307 1,493,6492020 50-54 360,125 41,095 174,286 7,771 482,086 67,024 52,956 289,185 1,474,5282020 55-59 481,511 32,800 93,750 2,167 617,529 37,386 24,793 320,673 1,610,6082020 60-64 470,752 23,647 46,819 2,540 630,738 18,881 13,710 314,766 1,521,8532020 65-69 372,767 16,635 11,761 0 560,742 8,940 7,979 254,597 1,233,4222020 70-74 257,369 5,367 12,150 1,849 456,660 10,640 4,916 168,794 917,7452020 75+ 224,240 11,752 8,472 0 673,555 4,277 2,954 251,358 1,176,6092020 Total 2,879,085 390,454 2,128,988 294,720 5,551,543 2,105,966 692,794 2,613,816 16,657,365
2025 15-19 3,918 6,187 1,895 1,557 26,490 13,619 10,745 71,328 135,7402025 20-24 17,653 48,878 46,962 44,477 228,796 194,639 46,009 174,300 801,7132025 25-29 62,784 44,443 175,079 65,247 339,420 399,588 52,501 116,222 1,255,2832025 30-34 104,381 43,524 365,860 65,563 381,732 530,023 91,582 94,277 1,676,9432025 35-39 113,089 32,652 508,988 57,051 404,395 439,132 151,641 117,592 1,824,5392025 40-44 164,088 40,152 436,962 27,067 398,971 261,991 157,568 218,355 1,705,1542025 45-49 281,690 47,715 329,728 20,224 407,257 143,978 103,264 255,744 1,589,6002025 50-54 355,957 40,620 172,269 7,681 476,507 66,248 52,343 285,838 1,457,4652025 55-59 453,344 30,881 88,266 2,040 581,406 35,199 23,343 301,914 1,516,3922025 60-64 492,395 24,734 48,972 2,657 659,736 19,749 14,341 329,237 1,591,8202025 65-69 440,881 19,675 13,911 0 663,204 10,574 9,437 301,119 1,458,8012025 70-74 318,347 6,638 15,029 2,287 564,855 13,161 6,081 208,786 1,135,1842025 75+ 284,607 14,916 10,752 0 854,881 5,429 3,750 319,025 1,493,3592025 Total 3,093,135 401,016 2,214,672 295,850 5,987,651 2,133,329 722,604 2,793,738 17,641,994
Household Growth2005-10 263,473 24,991 53,662 12,124 413,551 73,154 16,447 204,462 1,061,8632010-15 268,774 19,003 66,680 12,778 456,228 94,780 17,485 186,816 1,122,5442015-20 250,018 9,702 89,627 6,458 449,231 72,723 23,799 167,681 1,069,2392020-25 214,050 10,562 85,684 1,130 436,108 27,363 29,810 179,921 984,629
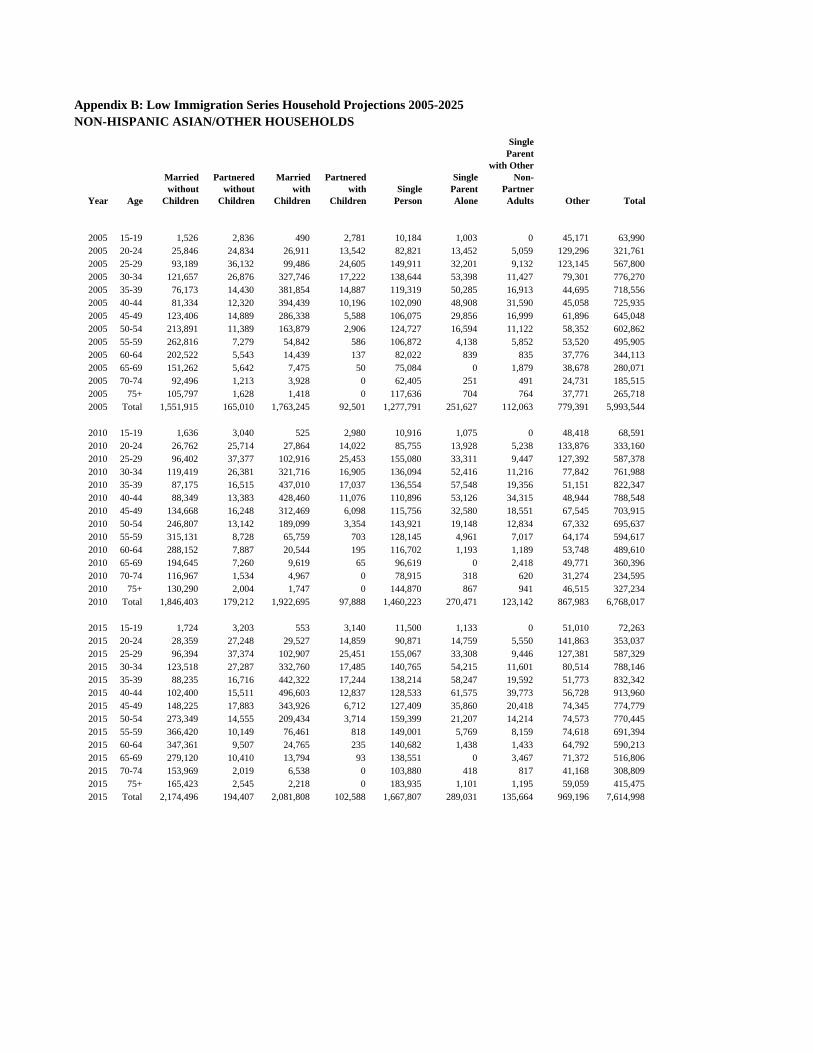
Appendix B: Low Immigration Series Household Projections 2005-2025NON-HISPANIC ASIAN/OTHER HOUSEHOLDS
Year Age
Married without
Children
Partnered without
Children
Married with
Children
Partnered with
ChildrenSingle
Person
Single Parent Alone
Single Parent
with Other Non-
Partner Adults Other Total
2005 15-19 1,526 2,836 490 2,781 10,184 1,003 0 45,171 63,9902005 20-24 25,846 24,834 26,911 13,542 82,821 13,452 5,059 129,296 321,7612005 25-29 93,189 36,132 99,486 24,605 149,911 32,201 9,132 123,145 567,8002005 30-34 121,657 26,876 327,746 17,222 138,644 53,398 11,427 79,301 776,2702005 35-39 76,173 14,430 381,854 14,887 119,319 50,285 16,913 44,695 718,5562005 40-44 81,334 12,320 394,439 10,196 102,090 48,908 31,590 45,058 725,9352005 45-49 123,406 14,889 286,338 5,588 106,075 29,856 16,999 61,896 645,0482005 50-54 213,891 11,389 163,879 2,906 124,727 16,594 11,122 58,352 602,8622005 55-59 262,816 7,279 54,842 586 106,872 4,138 5,852 53,520 495,9052005 60-64 202,522 5,543 14,439 137 82,022 839 835 37,776 344,1132005 65-69 151,262 5,642 7,475 50 75,084 0 1,879 38,678 280,0712005 70-74 92,496 1,213 3,928 0 62,405 251 491 24,731 185,5152005 75+ 105,797 1,628 1,418 0 117,636 704 764 37,771 265,7182005 Total 1,551,915 165,010 1,763,245 92,501 1,277,791 251,627 112,063 779,391 5,993,544
2010 15-19 1,636 3,040 525 2,980 10,916 1,075 0 48,418 68,5912010 20-24 26,762 25,714 27,864 14,022 85,755 13,928 5,238 133,876 333,1602010 25-29 96,402 37,377 102,916 25,453 155,080 33,311 9,447 127,392 587,3782010 30-34 119,419 26,381 321,716 16,905 136,094 52,416 11,216 77,842 761,9882010 35-39 87,175 16,515 437,010 17,037 136,554 57,548 19,356 51,151 822,3472010 40-44 88,349 13,383 428,460 11,076 110,896 53,126 34,315 48,944 788,5482010 45-49 134,668 16,248 312,469 6,098 115,756 32,580 18,551 67,545 703,9152010 50-54 246,807 13,142 189,099 3,354 143,921 19,148 12,834 67,332 695,6372010 55-59 315,131 8,728 65,759 703 128,145 4,961 7,017 64,174 594,6172010 60-64 288,152 7,887 20,544 195 116,702 1,193 1,189 53,748 489,6102010 65-69 194,645 7,260 9,619 65 96,619 0 2,418 49,771 360,3962010 70-74 116,967 1,534 4,967 0 78,915 318 620 31,274 234,5952010 75+ 130,290 2,004 1,747 0 144,870 867 941 46,515 327,2342010 Total 1,846,403 179,212 1,922,695 97,888 1,460,223 270,471 123,142 867,983 6,768,017
2015 15-19 1,724 3,203 553 3,140 11,500 1,133 0 51,010 72,2632015 20-24 28,359 27,248 29,527 14,859 90,871 14,759 5,550 141,863 353,0372015 25-29 96,394 37,374 102,907 25,451 155,067 33,308 9,446 127,381 587,3292015 30-34 123,518 27,287 332,760 17,485 140,765 54,215 11,601 80,514 788,1462015 35-39 88,235 16,716 442,322 17,244 138,214 58,247 19,592 51,773 832,3422015 40-44 102,400 15,511 496,603 12,837 128,533 61,575 39,773 56,728 913,9602015 45-49 148,225 17,883 343,926 6,712 127,409 35,860 20,418 74,345 774,7792015 50-54 273,349 14,555 209,434 3,714 159,399 21,207 14,214 74,573 770,4452015 55-59 366,420 10,149 76,461 818 149,001 5,769 8,159 74,618 691,3942015 60-64 347,361 9,507 24,765 235 140,682 1,438 1,433 64,792 590,2132015 65-69 279,120 10,410 13,794 93 138,551 0 3,467 71,372 516,8062015 70-74 153,969 2,019 6,538 0 103,880 418 817 41,168 308,8092015 75+ 165,423 2,545 2,218 0 183,935 1,101 1,195 59,059 415,4752015 Total 2,174,496 194,407 2,081,808 102,588 1,667,807 289,031 135,664 969,196 7,614,998
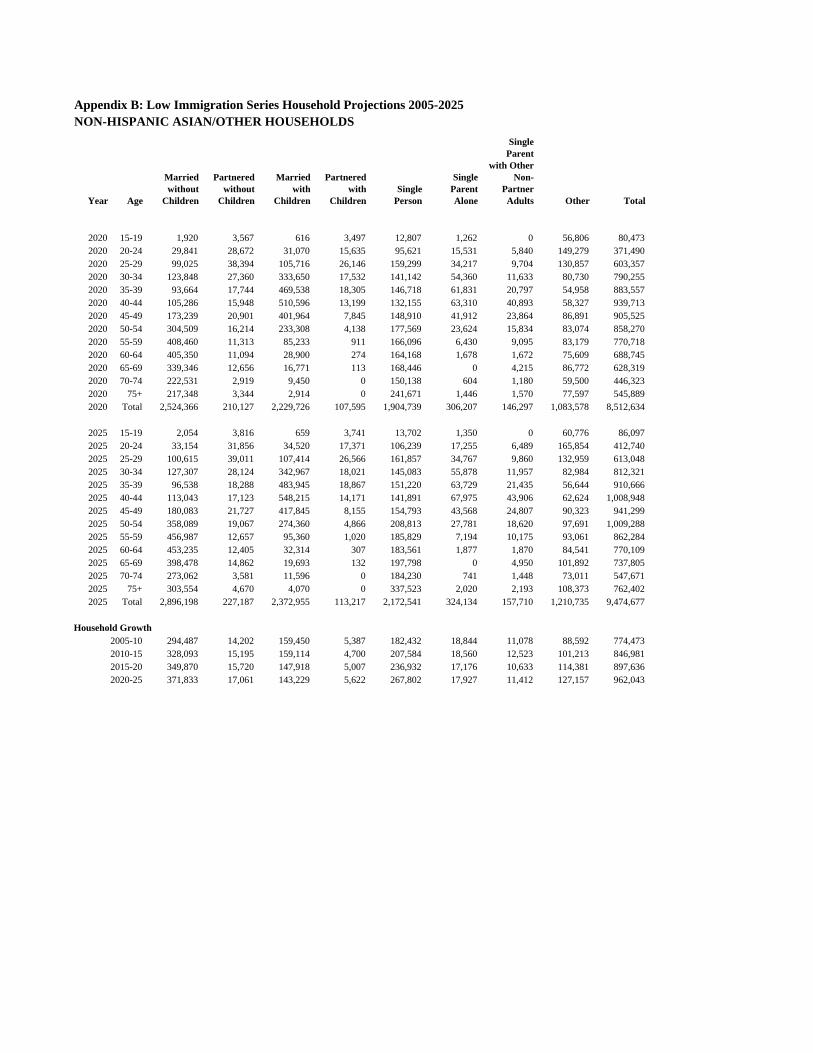
Appendix B: Low Immigration Series Household Projections 2005-2025NON-HISPANIC ASIAN/OTHER HOUSEHOLDS
Year Age
Married without
Children
Partnered without
Children
Married with
Children
Partnered with
ChildrenSingle
Person
Single Parent Alone
Single Parent
with Other Non-
Partner Adults Other Total
2020 15-19 1,920 3,567 616 3,497 12,807 1,262 0 56,806 80,4732020 20-24 29,841 28,672 31,070 15,635 95,621 15,531 5,840 149,279 371,4902020 25-29 99,025 38,394 105,716 26,146 159,299 34,217 9,704 130,857 603,3572020 30-34 123,848 27,360 333,650 17,532 141,142 54,360 11,633 80,730 790,2552020 35-39 93,664 17,744 469,538 18,305 146,718 61,831 20,797 54,958 883,5572020 40-44 105,286 15,948 510,596 13,199 132,155 63,310 40,893 58,327 939,7132020 45-49 173,239 20,901 401,964 7,845 148,910 41,912 23,864 86,891 905,5252020 50-54 304,509 16,214 233,308 4,138 177,569 23,624 15,834 83,074 858,2702020 55-59 408,460 11,313 85,233 911 166,096 6,430 9,095 83,179 770,7182020 60-64 405,350 11,094 28,900 274 164,168 1,678 1,672 75,609 688,7452020 65-69 339,346 12,656 16,771 113 168,446 0 4,215 86,772 628,3192020 70-74 222,531 2,919 9,450 0 150,138 604 1,180 59,500 446,3232020 75+ 217,348 3,344 2,914 0 241,671 1,446 1,570 77,597 545,8892020 Total 2,524,366 210,127 2,229,726 107,595 1,904,739 306,207 146,297 1,083,578 8,512,634
2025 15-19 2,054 3,816 659 3,741 13,702 1,350 0 60,776 86,0972025 20-24 33,154 31,856 34,520 17,371 106,239 17,255 6,489 165,854 412,7402025 25-29 100,615 39,011 107,414 26,566 161,857 34,767 9,860 132,959 613,0482025 30-34 127,307 28,124 342,967 18,021 145,083 55,878 11,957 82,984 812,3212025 35-39 96,538 18,288 483,945 18,867 151,220 63,729 21,435 56,644 910,6662025 40-44 113,043 17,123 548,215 14,171 141,891 67,975 43,906 62,624 1,008,9482025 45-49 180,083 21,727 417,845 8,155 154,793 43,568 24,807 90,323 941,2992025 50-54 358,089 19,067 274,360 4,866 208,813 27,781 18,620 97,691 1,009,2882025 55-59 456,987 12,657 95,360 1,020 185,829 7,194 10,175 93,061 862,2842025 60-64 453,235 12,405 32,314 307 183,561 1,877 1,870 84,541 770,1092025 65-69 398,478 14,862 19,693 132 197,798 0 4,950 101,892 737,8052025 70-74 273,062 3,581 11,596 0 184,230 741 1,448 73,011 547,6712025 75+ 303,554 4,670 4,070 0 337,523 2,020 2,193 108,373 762,4022025 Total 2,896,198 227,187 2,372,955 113,217 2,172,541 324,134 157,710 1,210,735 9,474,677
Household Growth2005-10 294,487 14,202 159,450 5,387 182,432 18,844 11,078 88,592 774,4732010-15 328,093 15,195 159,114 4,700 207,584 18,560 12,523 101,213 846,9812015-20 349,870 15,720 147,918 5,007 236,932 17,176 10,633 114,381 897,6362020-25 371,833 17,061 143,229 5,622 267,802 17,927 11,412 127,157 962,043
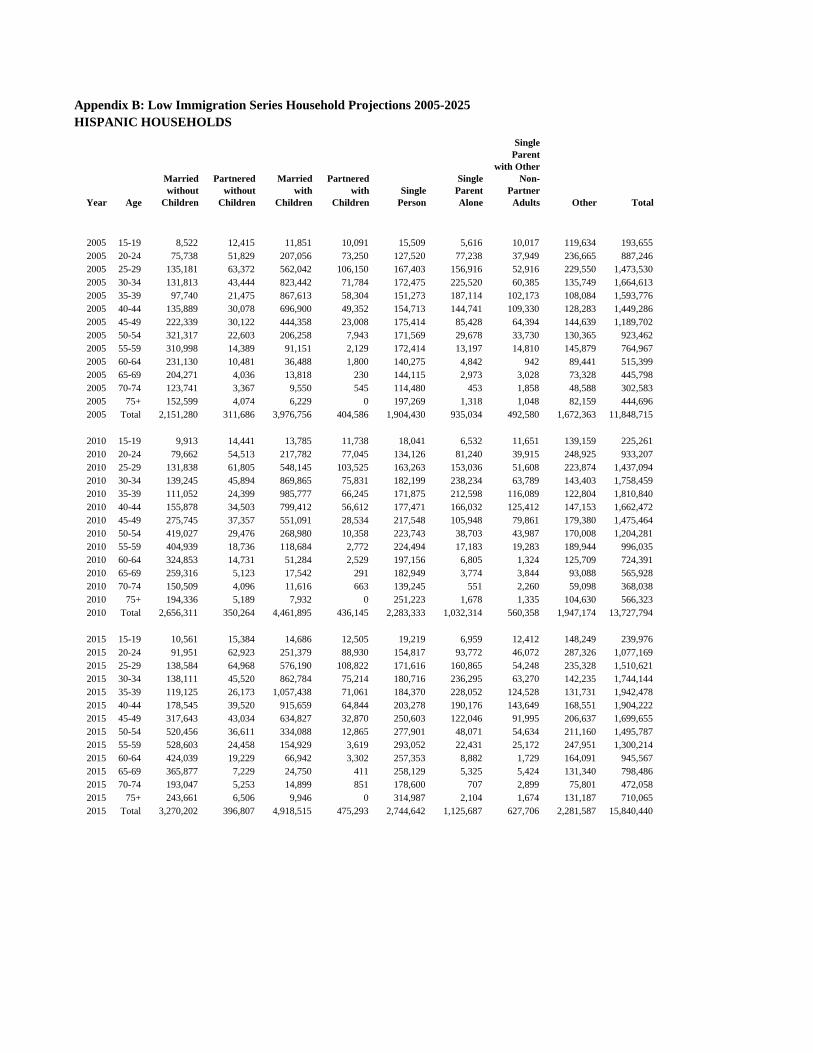
Appendix B: Low Immigration Series Household Projections 2005-2025HISPANIC HOUSEHOLDS
Year Age
Married without
Children
Partnered without
Children
Married with
Children
Partnered with
ChildrenSingle
Person
Single Parent Alone
Single Parent
with Other Non-
Partner Adults Other Total
2005 15-19 8,522 12,415 11,851 10,091 15,509 5,616 10,017 119,634 193,6552005 20-24 75,738 51,829 207,056 73,250 127,520 77,238 37,949 236,665 887,2462005 25-29 135,181 63,372 562,042 106,150 167,403 156,916 52,916 229,550 1,473,5302005 30-34 131,813 43,444 823,442 71,784 172,475 225,520 60,385 135,749 1,664,6132005 35-39 97,740 21,475 867,613 58,304 151,273 187,114 102,173 108,084 1,593,7762005 40-44 135,889 30,078 696,900 49,352 154,713 144,741 109,330 128,283 1,449,2862005 45-49 222,339 30,122 444,358 23,008 175,414 85,428 64,394 144,639 1,189,7022005 50-54 321,317 22,603 206,258 7,943 171,569 29,678 33,730 130,365 923,4622005 55-59 310,998 14,389 91,151 2,129 172,414 13,197 14,810 145,879 764,9672005 60-64 231,130 10,481 36,488 1,800 140,275 4,842 942 89,441 515,3992005 65-69 204,271 4,036 13,818 230 144,115 2,973 3,028 73,328 445,7982005 70-74 123,741 3,367 9,550 545 114,480 453 1,858 48,588 302,5832005 75+ 152,599 4,074 6,229 0 197,269 1,318 1,048 82,159 444,6962005 Total 2,151,280 311,686 3,976,756 404,586 1,904,430 935,034 492,580 1,672,363 11,848,715
2010 15-19 9,913 14,441 13,785 11,738 18,041 6,532 11,651 139,159 225,2612010 20-24 79,662 54,513 217,782 77,045 134,126 81,240 39,915 248,925 933,2072010 25-29 131,838 61,805 548,145 103,525 163,263 153,036 51,608 223,874 1,437,0942010 30-34 139,245 45,894 869,865 75,831 182,199 238,234 63,789 143,403 1,758,4592010 35-39 111,052 24,399 985,777 66,245 171,875 212,598 116,089 122,804 1,810,8402010 40-44 155,878 34,503 799,412 56,612 177,471 166,032 125,412 147,153 1,662,4722010 45-49 275,745 37,357 551,091 28,534 217,548 105,948 79,861 179,380 1,475,4642010 50-54 419,027 29,476 268,980 10,358 223,743 38,703 43,987 170,008 1,204,2812010 55-59 404,939 18,736 118,684 2,772 224,494 17,183 19,283 189,944 996,0352010 60-64 324,853 14,731 51,284 2,529 197,156 6,805 1,324 125,709 724,3912010 65-69 259,316 5,123 17,542 291 182,949 3,774 3,844 93,088 565,9282010 70-74 150,509 4,096 11,616 663 139,245 551 2,260 59,098 368,0382010 75+ 194,336 5,189 7,932 0 251,223 1,678 1,335 104,630 566,3232010 Total 2,656,311 350,264 4,461,895 436,145 2,283,333 1,032,314 560,358 1,947,174 13,727,794
2015 15-19 10,561 15,384 14,686 12,505 19,219 6,959 12,412 148,249 239,9762015 20-24 91,951 62,923 251,379 88,930 154,817 93,772 46,072 287,326 1,077,1692015 25-29 138,584 64,968 576,190 108,822 171,616 160,865 54,248 235,328 1,510,6212015 30-34 138,111 45,520 862,784 75,214 180,716 236,295 63,270 142,235 1,744,1442015 35-39 119,125 26,173 1,057,438 71,061 184,370 228,052 124,528 131,731 1,942,4782015 40-44 178,545 39,520 915,659 64,844 203,278 190,176 143,649 168,551 1,904,2222015 45-49 317,643 43,034 634,827 32,870 250,603 122,046 91,995 206,637 1,699,6552015 50-54 520,456 36,611 334,088 12,865 277,901 48,071 54,634 211,160 1,495,7872015 55-59 528,603 24,458 154,929 3,619 293,052 22,431 25,172 247,951 1,300,2142015 60-64 424,039 19,229 66,942 3,302 257,353 8,882 1,729 164,091 945,5672015 65-69 365,877 7,229 24,750 411 258,129 5,325 5,424 131,340 798,4862015 70-74 193,047 5,253 14,899 851 178,600 707 2,899 75,801 472,0582015 75+ 243,661 6,506 9,946 0 314,987 2,104 1,674 131,187 710,0652015 Total 3,270,202 396,807 4,918,515 475,293 2,744,642 1,125,687 627,706 2,281,587 15,840,440
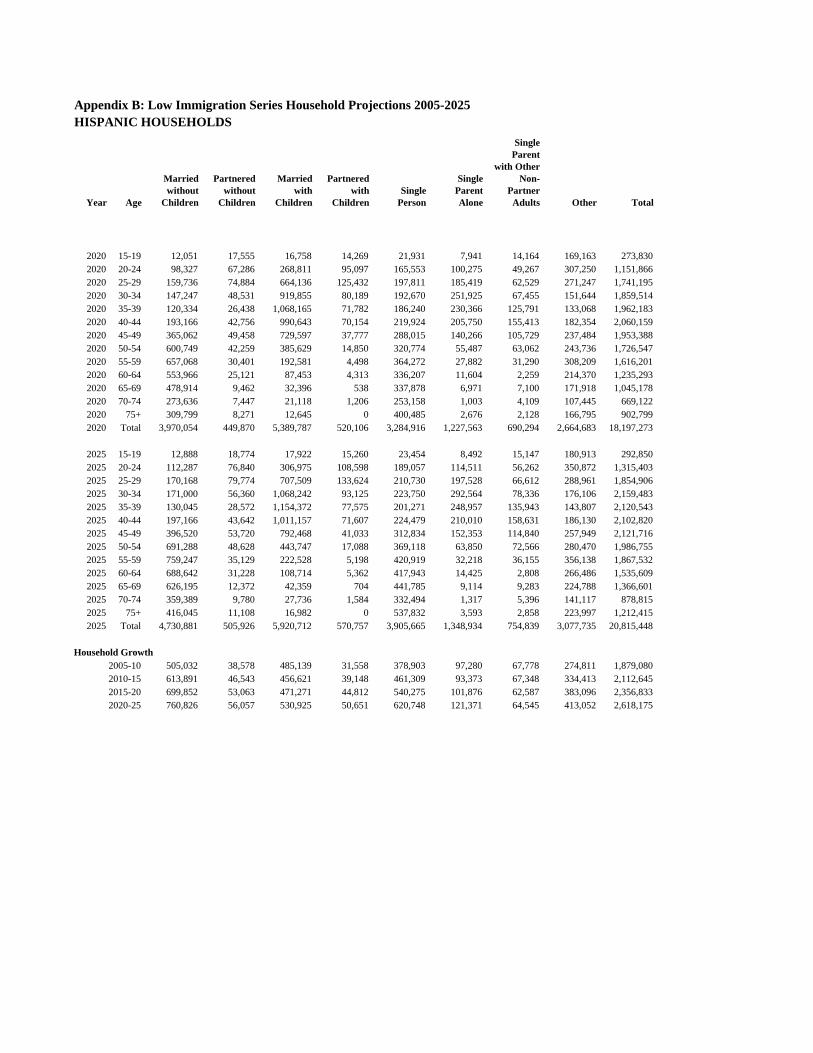
Appendix B: Low Immigration Series Household Projections 2005-2025HISPANIC HOUSEHOLDS
Year Age
Married without
Children
Partnered without
Children
Married with
Children
Partnered with
ChildrenSingle
Person
Single Parent Alone
Single Parent
with Other Non-
Partner Adults Other Total
2020 15-19 12,051 17,555 16,758 14,269 21,931 7,941 14,164 169,163 273,8302020 20-24 98,327 67,286 268,811 95,097 165,553 100,275 49,267 307,250 1,151,8662020 25-29 159,736 74,884 664,136 125,432 197,811 185,419 62,529 271,247 1,741,1952020 30-34 147,247 48,531 919,855 80,189 192,670 251,925 67,455 151,644 1,859,5142020 35-39 120,334 26,438 1,068,165 71,782 186,240 230,366 125,791 133,068 1,962,1832020 40-44 193,166 42,756 990,643 70,154 219,924 205,750 155,413 182,354 2,060,1592020 45-49 365,062 49,458 729,597 37,777 288,015 140,266 105,729 237,484 1,953,3882020 50-54 600,749 42,259 385,629 14,850 320,774 55,487 63,062 243,736 1,726,5472020 55-59 657,068 30,401 192,581 4,498 364,272 27,882 31,290 308,209 1,616,2012020 60-64 553,966 25,121 87,453 4,313 336,207 11,604 2,259 214,370 1,235,2932020 65-69 478,914 9,462 32,396 538 337,878 6,971 7,100 171,918 1,045,1782020 70-74 273,636 7,447 21,118 1,206 253,158 1,003 4,109 107,445 669,1222020 75+ 309,799 8,271 12,645 0 400,485 2,676 2,128 166,795 902,7992020 Total 3,970,054 449,870 5,389,787 520,106 3,284,916 1,227,563 690,294 2,664,683 18,197,273
2025 15-19 12,888 18,774 17,922 15,260 23,454 8,492 15,147 180,913 292,8502025 20-24 112,287 76,840 306,975 108,598 189,057 114,511 56,262 350,872 1,315,4032025 25-29 170,168 79,774 707,509 133,624 210,730 197,528 66,612 288,961 1,854,9062025 30-34 171,000 56,360 1,068,242 93,125 223,750 292,564 78,336 176,106 2,159,4832025 35-39 130,045 28,572 1,154,372 77,575 201,271 248,957 135,943 143,807 2,120,5432025 40-44 197,166 43,642 1,011,157 71,607 224,479 210,010 158,631 186,130 2,102,8202025 45-49 396,520 53,720 792,468 41,033 312,834 152,353 114,840 257,949 2,121,7162025 50-54 691,288 48,628 443,747 17,088 369,118 63,850 72,566 280,470 1,986,7552025 55-59 759,247 35,129 222,528 5,198 420,919 32,218 36,155 356,138 1,867,5322025 60-64 688,642 31,228 108,714 5,362 417,943 14,425 2,808 266,486 1,535,6092025 65-69 626,195 12,372 42,359 704 441,785 9,114 9,283 224,788 1,366,6012025 70-74 359,389 9,780 27,736 1,584 332,494 1,317 5,396 141,117 878,8152025 75+ 416,045 11,108 16,982 0 537,832 3,593 2,858 223,997 1,212,4152025 Total 4,730,881 505,926 5,920,712 570,757 3,905,665 1,348,934 754,839 3,077,735 20,815,448
Household Growth2005-10 505,032 38,578 485,139 31,558 378,903 97,280 67,778 274,811 1,879,0802010-15 613,891 46,543 456,621 39,148 461,309 93,373 67,348 334,413 2,112,6452015-20 699,852 53,063 471,271 44,812 540,275 101,876 62,587 383,096 2,356,8332020-25 760,826 56,057 530,925 50,651 620,748 121,371 64,545 413,052 2,618,175
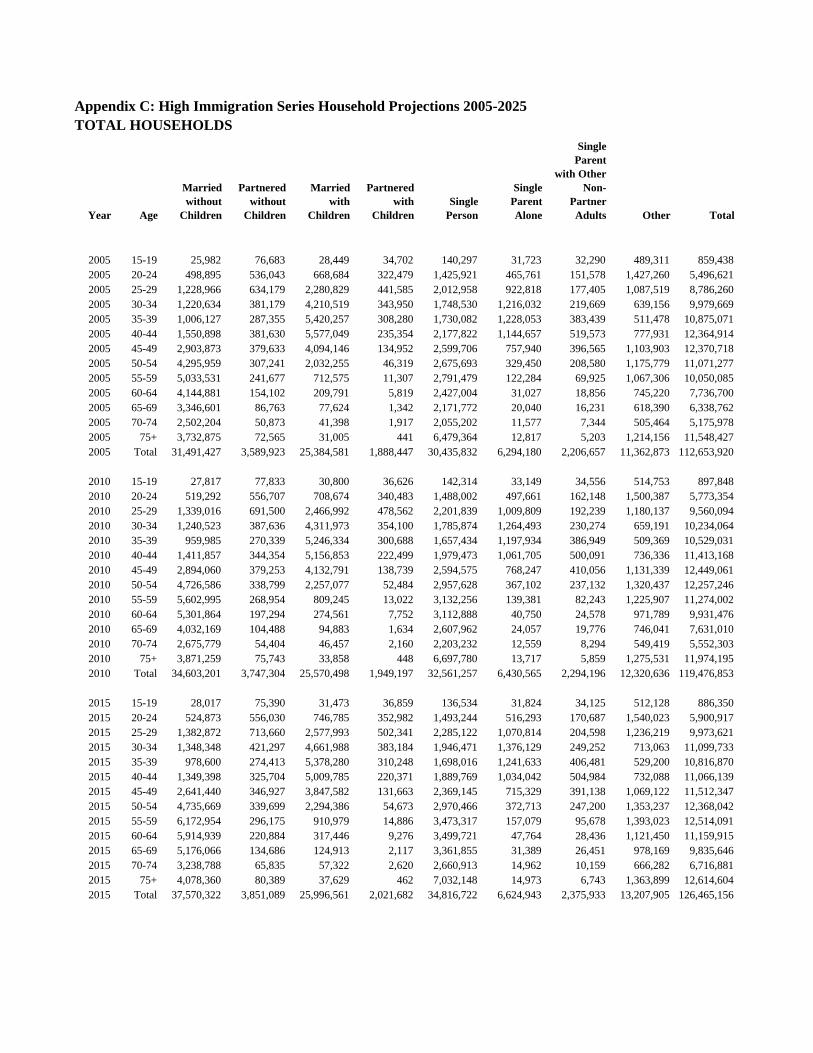
Appendix C: High Immigration Series Household Projections 2005-2025TOTAL HOUSEHOLDS
Year Age
Married without
Children
Partnered without
Children
Married with
Children
Partneredwith
ChildrenSingle
Person
Single Parent Alone
Single Parent
with Other Non-
Partner Adults Other Total
2005 15-19 25,982 76,683 28,449 34,702 140,297 31,723 32,290 489,311 859,4382005 20-24 498,895 536,043 668,684 322,479 1,425,921 465,761 151,578 1,427,260 5,496,6212005 25-29 1,228,966 634,179 2,280,829 441,585 2,012,958 922,818 177,405 1,087,519 8,786,2602005 30-34 1,220,634 381,179 4,210,519 343,950 1,748,530 1,216,032 219,669 639,156 9,979,6692005 35-39 1,006,127 287,355 5,420,257 308,280 1,730,082 1,228,053 383,439 511,478 10,875,0712005 40-44 1,550,898 381,630 5,577,049 235,354 2,177,822 1,144,657 519,573 777,931 12,364,9142005 45-49 2,903,873 379,633 4,094,146 134,952 2,599,706 757,940 396,565 1,103,903 12,370,7182005 50-54 4,295,959 307,241 2,032,255 46,319 2,675,693 329,450 208,580 1,175,779 11,071,2772005 55-59 5,033,531 241,677 712,575 11,307 2,791,479 122,284 69,925 1,067,306 10,050,0852005 60-64 4,144,881 154,102 209,791 5,819 2,427,004 31,027 18,856 745,220 7,736,7002005 65-69 3,346,601 86,763 77,624 1,342 2,171,772 20,040 16,231 618,390 6,338,7622005 70-74 2,502,204 50,873 41,398 1,917 2,055,202 11,577 7,344 505,464 5,175,9782005 75+ 3,732,875 72,565 31,005 441 6,479,364 12,817 5,203 1,214,156 11,548,4272005 Total 31,491,427 3,589,923 25,384,581 1,888,447 30,435,832 6,294,180 2,206,657 11,362,873 112,653,920
2010 15-19 27,817 77,833 30,800 36,626 142,314 33,149 34,556 514,753 897,8482010 20-24 519,292 556,707 708,674 340,483 1,488,002 497,661 162,148 1,500,387 5,773,3542010 25-29 1,339,016 691,500 2,466,992 478,562 2,201,839 1,009,809 192,239 1,180,137 9,560,0942010 30-34 1,240,523 387,636 4,311,973 354,100 1,785,874 1,264,493 230,274 659,191 10,234,0642010 35-39 959,985 270,339 5,246,334 300,688 1,657,434 1,197,934 386,949 509,369 10,529,0312010 40-44 1,411,857 344,354 5,156,853 222,499 1,979,473 1,061,705 500,091 736,336 11,413,1682010 45-49 2,894,060 379,253 4,132,791 138,739 2,594,575 768,247 410,056 1,131,339 12,449,0612010 50-54 4,726,586 338,799 2,257,077 52,484 2,957,628 367,102 237,132 1,320,437 12,257,2462010 55-59 5,602,995 268,954 809,245 13,022 3,132,256 139,381 82,243 1,225,907 11,274,0022010 60-64 5,301,864 197,294 274,561 7,752 3,112,888 40,750 24,578 971,789 9,931,4762010 65-69 4,032,169 104,488 94,883 1,634 2,607,962 24,057 19,776 746,041 7,631,0102010 70-74 2,675,779 54,404 46,457 2,160 2,203,232 12,559 8,294 549,419 5,552,3032010 75+ 3,871,259 75,743 33,858 448 6,697,780 13,717 5,859 1,275,531 11,974,1952010 Total 34,603,201 3,747,304 25,570,498 1,949,197 32,561,257 6,430,565 2,294,196 12,320,636 119,476,853
2015 15-19 28,017 75,390 31,473 36,859 136,534 31,824 34,125 512,128 886,3502015 20-24 524,873 556,030 746,785 352,982 1,493,244 516,293 170,687 1,540,023 5,900,9172015 25-29 1,382,872 713,660 2,577,993 502,341 2,285,122 1,070,814 204,598 1,236,219 9,973,6212015 30-34 1,348,348 421,297 4,661,988 383,184 1,946,471 1,376,129 249,252 713,063 11,099,7332015 35-39 978,600 274,413 5,378,280 310,248 1,698,016 1,241,633 406,481 529,200 10,816,8702015 40-44 1,349,398 325,704 5,009,785 220,371 1,889,769 1,034,042 504,984 732,088 11,066,1392015 45-49 2,641,440 346,927 3,847,582 131,663 2,369,145 715,329 391,138 1,069,122 11,512,3472015 50-54 4,735,669 339,699 2,294,386 54,673 2,970,466 372,713 247,200 1,353,237 12,368,0422015 55-59 6,172,954 296,175 910,979 14,886 3,473,317 157,079 95,678 1,393,023 12,514,0912015 60-64 5,914,939 220,884 317,446 9,276 3,499,721 47,764 28,436 1,121,450 11,159,9152015 65-69 5,176,066 134,686 124,913 2,117 3,361,855 31,389 26,451 978,169 9,835,6462015 70-74 3,238,788 65,835 57,322 2,620 2,660,913 14,962 10,159 666,282 6,716,8812015 75+ 4,078,360 80,389 37,629 462 7,032,148 14,973 6,743 1,363,899 12,614,6042015 Total 37,570,322 3,851,089 25,996,561 2,021,682 34,816,722 6,624,943 2,375,933 13,207,905 126,465,156
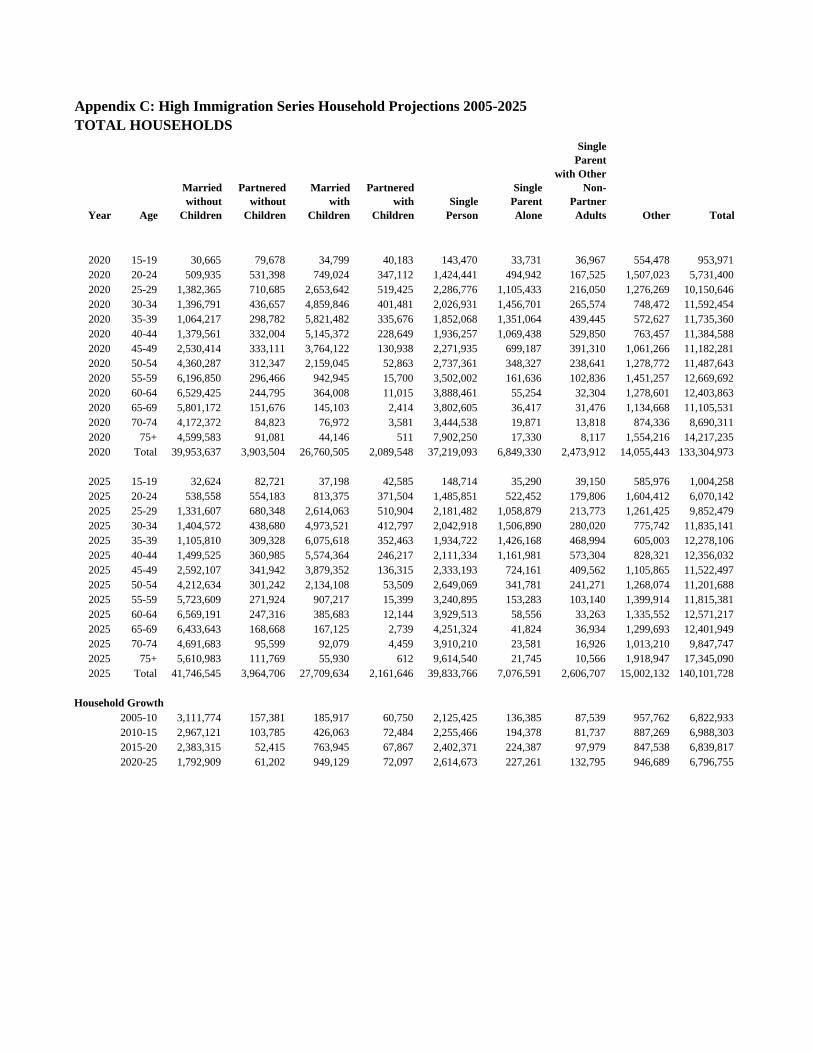
Appendix C: High Immigration Series Household Projections 2005-2025TOTAL HOUSEHOLDS
Year Age
Married without
Children
Partnered without
Children
Married with
Children
Partneredwith
ChildrenSingle
Person
Single Parent Alone
Single Parent
with Other Non-
Partner Adults Other Total
2020 15-19 30,665 79,678 34,799 40,183 143,470 33,731 36,967 554,478 953,9712020 20-24 509,935 531,398 749,024 347,112 1,424,441 494,942 167,525 1,507,023 5,731,4002020 25-29 1,382,365 710,685 2,653,642 519,425 2,286,776 1,105,433 216,050 1,276,269 10,150,6462020 30-34 1,396,791 436,657 4,859,846 401,481 2,026,931 1,456,701 265,574 748,472 11,592,4542020 35-39 1,064,217 298,782 5,821,482 335,676 1,852,068 1,351,064 439,445 572,627 11,735,3602020 40-44 1,379,561 332,004 5,145,372 228,649 1,936,257 1,069,438 529,850 763,457 11,384,5882020 45-49 2,530,414 333,111 3,764,122 130,938 2,271,935 699,187 391,310 1,061,266 11,182,2812020 50-54 4,360,287 312,347 2,159,045 52,863 2,737,361 348,327 238,641 1,278,772 11,487,6432020 55-59 6,196,850 296,466 942,945 15,700 3,502,002 161,636 102,836 1,451,257 12,669,6922020 60-64 6,529,425 244,795 364,008 11,015 3,888,461 55,254 32,304 1,278,601 12,403,8632020 65-69 5,801,172 151,676 145,103 2,414 3,802,605 36,417 31,476 1,134,668 11,105,5312020 70-74 4,172,372 84,823 76,972 3,581 3,444,538 19,871 13,818 874,336 8,690,3112020 75+ 4,599,583 91,081 44,146 511 7,902,250 17,330 8,117 1,554,216 14,217,2352020 Total 39,953,637 3,903,504 26,760,505 2,089,548 37,219,093 6,849,330 2,473,912 14,055,443 133,304,973
2025 15-19 32,624 82,721 37,198 42,585 148,714 35,290 39,150 585,976 1,004,2582025 20-24 538,558 554,183 813,375 371,504 1,485,851 522,452 179,806 1,604,412 6,070,1422025 25-29 1,331,607 680,348 2,614,063 510,904 2,181,482 1,058,879 213,773 1,261,425 9,852,4792025 30-34 1,404,572 438,680 4,973,521 412,797 2,042,918 1,506,890 280,020 775,742 11,835,1412025 35-39 1,105,810 309,328 6,075,618 352,463 1,934,722 1,426,168 468,994 605,003 12,278,1062025 40-44 1,499,525 360,985 5,574,364 246,217 2,111,334 1,161,981 573,304 828,321 12,356,0322025 45-49 2,592,107 341,942 3,879,352 136,315 2,333,193 724,161 409,562 1,105,865 11,522,4972025 50-54 4,212,634 301,242 2,134,108 53,509 2,649,069 341,781 241,271 1,268,074 11,201,6882025 55-59 5,723,609 271,924 907,217 15,399 3,240,895 153,283 103,140 1,399,914 11,815,3812025 60-64 6,569,191 247,316 385,683 12,144 3,929,513 58,556 33,263 1,335,552 12,571,2172025 65-69 6,433,643 168,668 167,125 2,739 4,251,324 41,824 36,934 1,299,693 12,401,9492025 70-74 4,691,683 95,599 92,079 4,459 3,910,210 23,581 16,926 1,013,210 9,847,7472025 75+ 5,610,983 111,769 55,930 612 9,614,540 21,745 10,566 1,918,947 17,345,0902025 Total 41,746,545 3,964,706 27,709,634 2,161,646 39,833,766 7,076,591 2,606,707 15,002,132 140,101,728
Household Growth2005-10 3,111,774 157,381 185,917 60,750 2,125,425 136,385 87,539 957,762 6,822,9332010-15 2,967,121 103,785 426,063 72,484 2,255,466 194,378 81,737 887,269 6,988,3032015-20 2,383,315 52,415 763,945 67,867 2,402,371 224,387 97,979 847,538 6,839,8172020-25 1,792,909 61,202 949,129 72,097 2,614,673 227,261 132,795 946,689 6,796,755
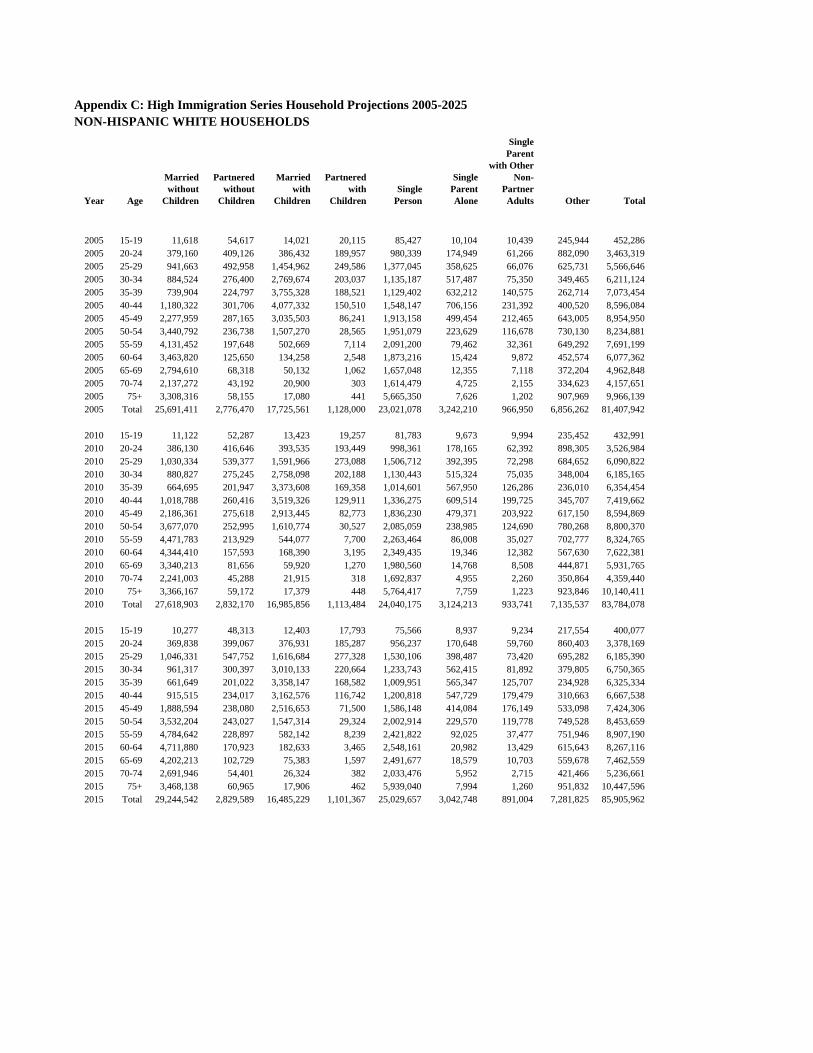
Appendix C: High Immigration Series Household Projections 2005-2025NON-HISPANIC WHITE HOUSEHOLDS
Year Age
Married without
Children
Partnered without
Children
Married with
Children
Partnered with
ChildrenSingle
Person
Single Parent Alone
Single Parent
with Other Non-
Partner Adults Other Total
2005 15-19 11,618 54,617 14,021 20,115 85,427 10,104 10,439 245,944 452,2862005 20-24 379,160 409,126 386,432 189,957 980,339 174,949 61,266 882,090 3,463,3192005 25-29 941,663 492,958 1,454,962 249,586 1,377,045 358,625 66,076 625,731 5,566,6462005 30-34 884,524 276,400 2,769,674 203,037 1,135,187 517,487 75,350 349,465 6,211,1242005 35-39 739,904 224,797 3,755,328 188,521 1,129,402 632,212 140,575 262,714 7,073,4542005 40-44 1,180,322 301,706 4,077,332 150,510 1,548,147 706,156 231,392 400,520 8,596,0842005 45-49 2,277,959 287,165 3,035,503 86,241 1,913,158 499,454 212,465 643,005 8,954,9502005 50-54 3,440,792 236,738 1,507,270 28,565 1,951,079 223,629 116,678 730,130 8,234,8812005 55-59 4,131,452 197,648 502,669 7,114 2,091,200 79,462 32,361 649,292 7,691,1992005 60-64 3,463,820 125,650 134,258 2,548 1,873,216 15,424 9,872 452,574 6,077,3622005 65-69 2,794,610 68,318 50,132 1,062 1,657,048 12,355 7,118 372,204 4,962,8482005 70-74 2,137,272 43,192 20,900 303 1,614,479 4,725 2,155 334,623 4,157,6512005 75+ 3,308,316 58,155 17,080 441 5,665,350 7,626 1,202 907,969 9,966,1392005 Total 25,691,411 2,776,470 17,725,561 1,128,000 23,021,078 3,242,210 966,950 6,856,262 81,407,942
2010 15-19 11,122 52,287 13,423 19,257 81,783 9,673 9,994 235,452 432,9912010 20-24 386,130 416,646 393,535 193,449 998,361 178,165 62,392 898,305 3,526,9842010 25-29 1,030,334 539,377 1,591,966 273,088 1,506,712 392,395 72,298 684,652 6,090,8222010 30-34 880,827 275,245 2,758,098 202,188 1,130,443 515,324 75,035 348,004 6,185,1652010 35-39 664,695 201,947 3,373,608 169,358 1,014,601 567,950 126,286 236,010 6,354,4542010 40-44 1,018,788 260,416 3,519,326 129,911 1,336,275 609,514 199,725 345,707 7,419,6622010 45-49 2,186,361 275,618 2,913,445 82,773 1,836,230 479,371 203,922 617,150 8,594,8692010 50-54 3,677,070 252,995 1,610,774 30,527 2,085,059 238,985 124,690 780,268 8,800,3702010 55-59 4,471,783 213,929 544,077 7,700 2,263,464 86,008 35,027 702,777 8,324,7652010 60-64 4,344,410 157,593 168,390 3,195 2,349,435 19,346 12,382 567,630 7,622,3812010 65-69 3,340,213 81,656 59,920 1,270 1,980,560 14,768 8,508 444,871 5,931,7652010 70-74 2,241,003 45,288 21,915 318 1,692,837 4,955 2,260 350,864 4,359,4402010 75+ 3,366,167 59,172 17,379 448 5,764,417 7,759 1,223 923,846 10,140,4112010 Total 27,618,903 2,832,170 16,985,856 1,113,484 24,040,175 3,124,213 933,741 7,135,537 83,784,078
2015 15-19 10,277 48,313 12,403 17,793 75,566 8,937 9,234 217,554 400,0772015 20-24 369,838 399,067 376,931 185,287 956,237 170,648 59,760 860,403 3,378,1692015 25-29 1,046,331 547,752 1,616,684 277,328 1,530,106 398,487 73,420 695,282 6,185,3902015 30-34 961,317 300,397 3,010,133 220,664 1,233,743 562,415 81,892 379,805 6,750,3652015 35-39 661,649 201,022 3,358,147 168,582 1,009,951 565,347 125,707 234,928 6,325,3342015 40-44 915,515 234,017 3,162,576 116,742 1,200,818 547,729 179,479 310,663 6,667,5382015 45-49 1,888,594 238,080 2,516,653 71,500 1,586,148 414,084 176,149 533,098 7,424,3062015 50-54 3,532,204 243,027 1,547,314 29,324 2,002,914 229,570 119,778 749,528 8,453,6592015 55-59 4,784,642 228,897 582,142 8,239 2,421,822 92,025 37,477 751,946 8,907,1902015 60-64 4,711,880 170,923 182,633 3,465 2,548,161 20,982 13,429 615,643 8,267,1162015 65-69 4,202,213 102,729 75,383 1,597 2,491,677 18,579 10,703 559,678 7,462,5592015 70-74 2,691,946 54,401 26,324 382 2,033,476 5,952 2,715 421,466 5,236,6612015 75+ 3,468,138 60,965 17,906 462 5,939,040 7,994 1,260 951,832 10,447,5962015 Total 29,244,542 2,829,589 16,485,229 1,101,367 25,029,657 3,042,748 891,004 7,281,825 85,905,962
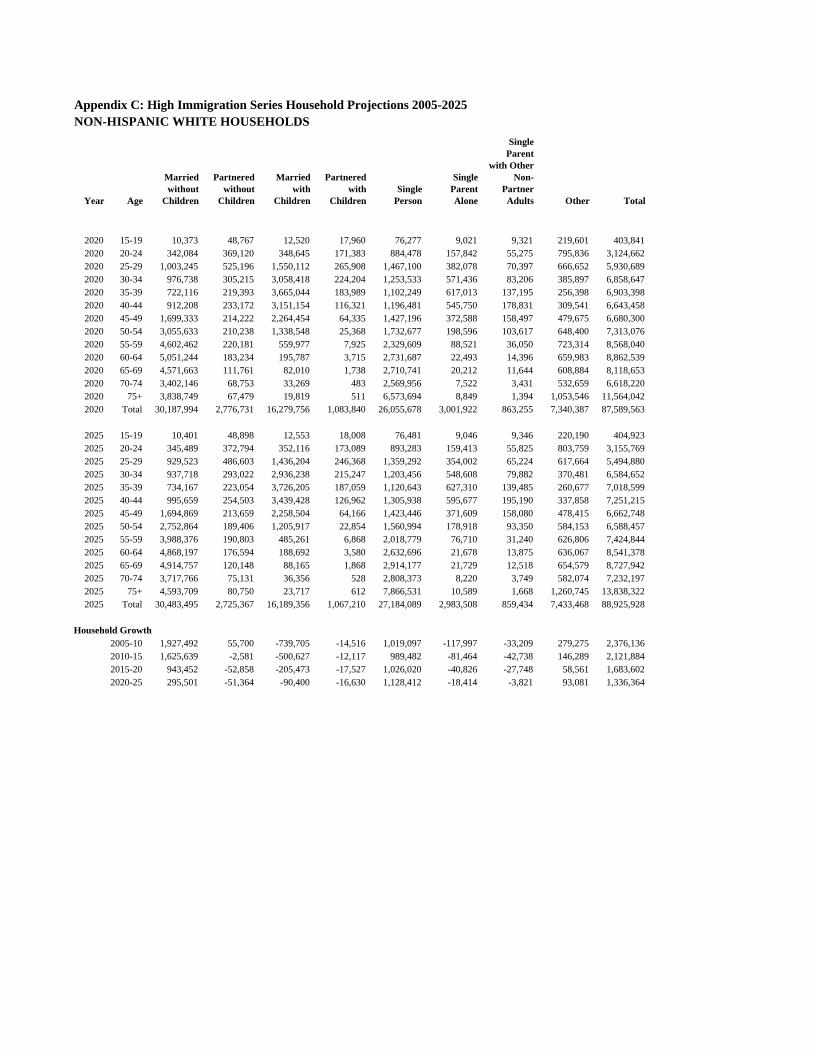
Appendix C: High Immigration Series Household Projections 2005-2025NON-HISPANIC WHITE HOUSEHOLDS
Year Age
Married without
Children
Partnered without
Children
Married with
Children
Partnered with
ChildrenSingle
Person
Single Parent Alone
Single Parent
with Other Non-
Partner Adults Other Total
2020 15-19 10,373 48,767 12,520 17,960 76,277 9,021 9,321 219,601 403,8412020 20-24 342,084 369,120 348,645 171,383 884,478 157,842 55,275 795,836 3,124,6622020 25-29 1,003,245 525,196 1,550,112 265,908 1,467,100 382,078 70,397 666,652 5,930,6892020 30-34 976,738 305,215 3,058,418 224,204 1,253,533 571,436 83,206 385,897 6,858,6472020 35-39 722,116 219,393 3,665,044 183,989 1,102,249 617,013 137,195 256,398 6,903,3982020 40-44 912,208 233,172 3,151,154 116,321 1,196,481 545,750 178,831 309,541 6,643,4582020 45-49 1,699,333 214,222 2,264,454 64,335 1,427,196 372,588 158,497 479,675 6,680,3002020 50-54 3,055,633 210,238 1,338,548 25,368 1,732,677 198,596 103,617 648,400 7,313,0762020 55-59 4,602,462 220,181 559,977 7,925 2,329,609 88,521 36,050 723,314 8,568,0402020 60-64 5,051,244 183,234 195,787 3,715 2,731,687 22,493 14,396 659,983 8,862,5392020 65-69 4,571,663 111,761 82,010 1,738 2,710,741 20,212 11,644 608,884 8,118,6532020 70-74 3,402,146 68,753 33,269 483 2,569,956 7,522 3,431 532,659 6,618,2202020 75+ 3,838,749 67,479 19,819 511 6,573,694 8,849 1,394 1,053,546 11,564,0422020 Total 30,187,994 2,776,731 16,279,756 1,083,840 26,055,678 3,001,922 863,255 7,340,387 87,589,563
2025 15-19 10,401 48,898 12,553 18,008 76,481 9,046 9,346 220,190 404,9232025 20-24 345,489 372,794 352,116 173,089 893,283 159,413 55,825 803,759 3,155,7692025 25-29 929,523 486,603 1,436,204 246,368 1,359,292 354,002 65,224 617,664 5,494,8802025 30-34 937,718 293,022 2,936,238 215,247 1,203,456 548,608 79,882 370,481 6,584,6522025 35-39 734,167 223,054 3,726,205 187,059 1,120,643 627,310 139,485 260,677 7,018,5992025 40-44 995,659 254,503 3,439,428 126,962 1,305,938 595,677 195,190 337,858 7,251,2152025 45-49 1,694,869 213,659 2,258,504 64,166 1,423,446 371,609 158,080 478,415 6,662,7482025 50-54 2,752,864 189,406 1,205,917 22,854 1,560,994 178,918 93,350 584,153 6,588,4572025 55-59 3,988,376 190,803 485,261 6,868 2,018,779 76,710 31,240 626,806 7,424,8442025 60-64 4,868,197 176,594 188,692 3,580 2,632,696 21,678 13,875 636,067 8,541,3782025 65-69 4,914,757 120,148 88,165 1,868 2,914,177 21,729 12,518 654,579 8,727,9422025 70-74 3,717,766 75,131 36,356 528 2,808,373 8,220 3,749 582,074 7,232,1972025 75+ 4,593,709 80,750 23,717 612 7,866,531 10,589 1,668 1,260,745 13,838,3222025 Total 30,483,495 2,725,367 16,189,356 1,067,210 27,184,089 2,983,508 859,434 7,433,468 88,925,928
Household Growth2005-10 1,927,492 55,700 -739,705 -14,516 1,019,097 -117,997 -33,209 279,275 2,376,1362010-15 1,625,639 -2,581 -500,627 -12,117 989,482 -81,464 -42,738 146,289 2,121,8842015-20 943,452 -52,858 -205,473 -17,527 1,026,020 -40,826 -27,748 58,561 1,683,6022020-25 295,501 -51,364 -90,400 -16,630 1,128,412 -18,414 -3,821 93,081 1,336,364
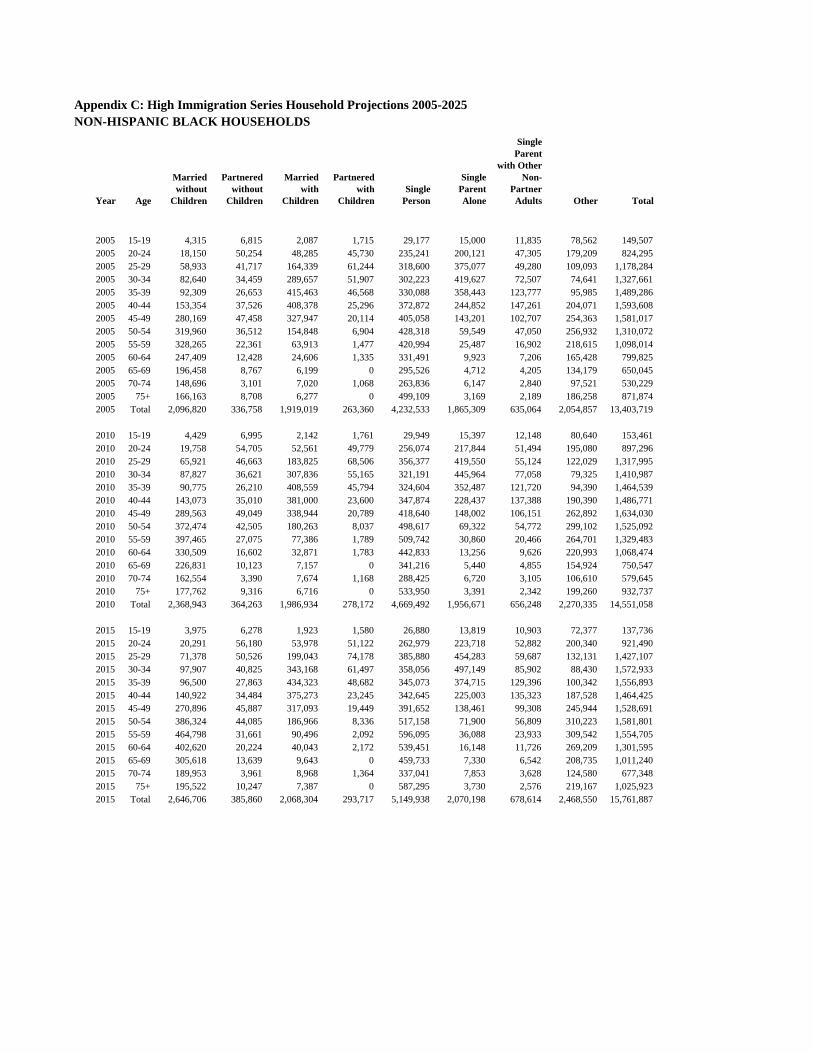
Appendix C: High Immigration Series Household Projections 2005-2025NON-HISPANIC BLACK HOUSEHOLDS
Year Age
Married without
Children
Partnered without
Children
Married with
Children
Partnered with
ChildrenSingle
Person
Single Parent Alone
Single Parent
with Other Non-
Partner Adults Other Total
2005 15-19 4,315 6,815 2,087 1,715 29,177 15,000 11,835 78,562 149,5072005 20-24 18,150 50,254 48,285 45,730 235,241 200,121 47,305 179,209 824,2952005 25-29 58,933 41,717 164,339 61,244 318,600 375,077 49,280 109,093 1,178,2842005 30-34 82,640 34,459 289,657 51,907 302,223 419,627 72,507 74,641 1,327,6612005 35-39 92,309 26,653 415,463 46,568 330,088 358,443 123,777 95,985 1,489,2862005 40-44 153,354 37,526 408,378 25,296 372,872 244,852 147,261 204,071 1,593,6082005 45-49 280,169 47,458 327,947 20,114 405,058 143,201 102,707 254,363 1,581,0172005 50-54 319,960 36,512 154,848 6,904 428,318 59,549 47,050 256,932 1,310,0722005 55-59 328,265 22,361 63,913 1,477 420,994 25,487 16,902 218,615 1,098,0142005 60-64 247,409 12,428 24,606 1,335 331,491 9,923 7,206 165,428 799,8252005 65-69 196,458 8,767 6,199 0 295,526 4,712 4,205 134,179 650,0452005 70-74 148,696 3,101 7,020 1,068 263,836 6,147 2,840 97,521 530,2292005 75+ 166,163 8,708 6,277 0 499,109 3,169 2,189 186,258 871,8742005 Total 2,096,820 336,758 1,919,019 263,360 4,232,533 1,865,309 635,064 2,054,857 13,403,719
2010 15-19 4,429 6,995 2,142 1,761 29,949 15,397 12,148 80,640 153,4612010 20-24 19,758 54,705 52,561 49,779 256,074 217,844 51,494 195,080 897,2962010 25-29 65,921 46,663 183,825 68,506 356,377 419,550 55,124 122,029 1,317,9952010 30-34 87,827 36,621 307,836 55,165 321,191 445,964 77,058 79,325 1,410,9872010 35-39 90,775 26,210 408,559 45,794 324,604 352,487 121,720 94,390 1,464,5392010 40-44 143,073 35,010 381,000 23,600 347,874 228,437 137,388 190,390 1,486,7712010 45-49 289,563 49,049 338,944 20,789 418,640 148,002 106,151 262,892 1,634,0302010 50-54 372,474 42,505 180,263 8,037 498,617 69,322 54,772 299,102 1,525,0922010 55-59 397,465 27,075 77,386 1,789 509,742 30,860 20,466 264,701 1,329,4832010 60-64 330,509 16,602 32,871 1,783 442,833 13,256 9,626 220,993 1,068,4742010 65-69 226,831 10,123 7,157 0 341,216 5,440 4,855 154,924 750,5472010 70-74 162,554 3,390 7,674 1,168 288,425 6,720 3,105 106,610 579,6452010 75+ 177,762 9,316 6,716 0 533,950 3,391 2,342 199,260 932,7372010 Total 2,368,943 364,263 1,986,934 278,172 4,669,492 1,956,671 656,248 2,270,335 14,551,058
2015 15-19 3,975 6,278 1,923 1,580 26,880 13,819 10,903 72,377 137,7362015 20-24 20,291 56,180 53,978 51,122 262,979 223,718 52,882 200,340 921,4902015 25-29 71,378 50,526 199,043 74,178 385,880 454,283 59,687 132,131 1,427,1072015 30-34 97,907 40,825 343,168 61,497 358,056 497,149 85,902 88,430 1,572,9332015 35-39 96,500 27,863 434,323 48,682 345,073 374,715 129,396 100,342 1,556,8932015 40-44 140,922 34,484 375,273 23,245 342,645 225,003 135,323 187,528 1,464,4252015 45-49 270,896 45,887 317,093 19,449 391,652 138,461 99,308 245,944 1,528,6912015 50-54 386,324 44,085 186,966 8,336 517,158 71,900 56,809 310,223 1,581,8012015 55-59 464,798 31,661 90,496 2,092 596,095 36,088 23,933 309,542 1,554,7052015 60-64 402,620 20,224 40,043 2,172 539,451 16,148 11,726 269,209 1,301,5952015 65-69 305,618 13,639 9,643 0 459,733 7,330 6,542 208,735 1,011,2402015 70-74 189,953 3,961 8,968 1,364 337,041 7,853 3,628 124,580 677,3482015 75+ 195,522 10,247 7,387 0 587,295 3,730 2,576 219,167 1,025,9232015 Total 2,646,706 385,860 2,068,304 293,717 5,149,938 2,070,198 678,614 2,468,550 15,761,887
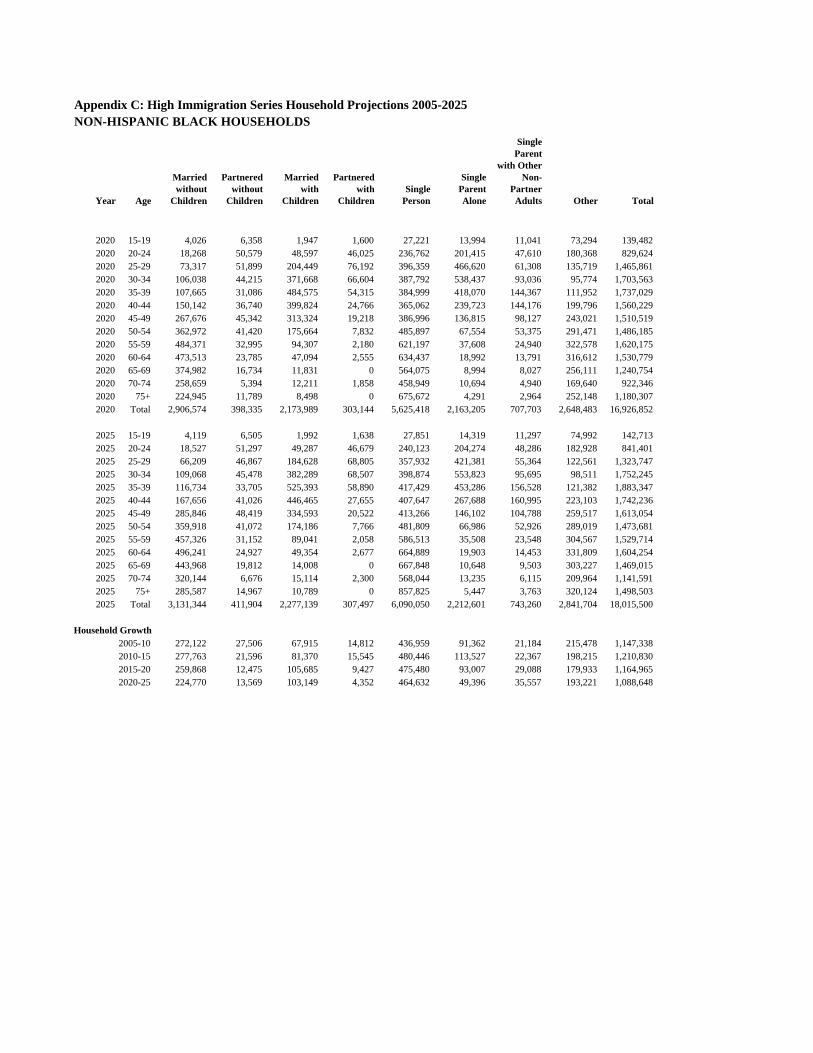
Appendix C: High Immigration Series Household Projections 2005-2025NON-HISPANIC BLACK HOUSEHOLDS
Year Age
Married without
Children
Partnered without
Children
Married with
Children
Partnered with
ChildrenSingle
Person
Single Parent Alone
Single Parent
with Other Non-
Partner Adults Other Total
2020 15-19 4,026 6,358 1,947 1,600 27,221 13,994 11,041 73,294 139,4822020 20-24 18,268 50,579 48,597 46,025 236,762 201,415 47,610 180,368 829,6242020 25-29 73,317 51,899 204,449 76,192 396,359 466,620 61,308 135,719 1,465,8612020 30-34 106,038 44,215 371,668 66,604 387,792 538,437 93,036 95,774 1,703,5632020 35-39 107,665 31,086 484,575 54,315 384,999 418,070 144,367 111,952 1,737,0292020 40-44 150,142 36,740 399,824 24,766 365,062 239,723 144,176 199,796 1,560,2292020 45-49 267,676 45,342 313,324 19,218 386,996 136,815 98,127 243,021 1,510,5192020 50-54 362,972 41,420 175,664 7,832 485,897 67,554 53,375 291,471 1,486,1852020 55-59 484,371 32,995 94,307 2,180 621,197 37,608 24,940 322,578 1,620,1752020 60-64 473,513 23,785 47,094 2,555 634,437 18,992 13,791 316,612 1,530,7792020 65-69 374,982 16,734 11,831 0 564,075 8,994 8,027 256,111 1,240,7542020 70-74 258,659 5,394 12,211 1,858 458,949 10,694 4,940 169,640 922,3462020 75+ 224,945 11,789 8,498 0 675,672 4,291 2,964 252,148 1,180,3072020 Total 2,906,574 398,335 2,173,989 303,144 5,625,418 2,163,205 707,703 2,648,483 16,926,852
2025 15-19 4,119 6,505 1,992 1,638 27,851 14,319 11,297 74,992 142,7132025 20-24 18,527 51,297 49,287 46,679 240,123 204,274 48,286 182,928 841,4012025 25-29 66,209 46,867 184,628 68,805 357,932 421,381 55,364 122,561 1,323,7472025 30-34 109,068 45,478 382,289 68,507 398,874 553,823 95,695 98,511 1,752,2452025 35-39 116,734 33,705 525,393 58,890 417,429 453,286 156,528 121,382 1,883,3472025 40-44 167,656 41,026 446,465 27,655 407,647 267,688 160,995 223,103 1,742,2362025 45-49 285,846 48,419 334,593 20,522 413,266 146,102 104,788 259,517 1,613,0542025 50-54 359,918 41,072 174,186 7,766 481,809 66,986 52,926 289,019 1,473,6812025 55-59 457,326 31,152 89,041 2,058 586,513 35,508 23,548 304,567 1,529,7142025 60-64 496,241 24,927 49,354 2,677 664,889 19,903 14,453 331,809 1,604,2542025 65-69 443,968 19,812 14,008 0 667,848 10,648 9,503 303,227 1,469,0152025 70-74 320,144 6,676 15,114 2,300 568,044 13,235 6,115 209,964 1,141,5912025 75+ 285,587 14,967 10,789 0 857,825 5,447 3,763 320,124 1,498,5032025 Total 3,131,344 411,904 2,277,139 307,497 6,090,050 2,212,601 743,260 2,841,704 18,015,500
Household Growth2005-10 272,122 27,506 67,915 14,812 436,959 91,362 21,184 215,478 1,147,3382010-15 277,763 21,596 81,370 15,545 480,446 113,527 22,367 198,215 1,210,8302015-20 259,868 12,475 105,685 9,427 475,480 93,007 29,088 179,933 1,164,9652020-25 224,770 13,569 103,149 4,352 464,632 49,396 35,557 193,221 1,088,648
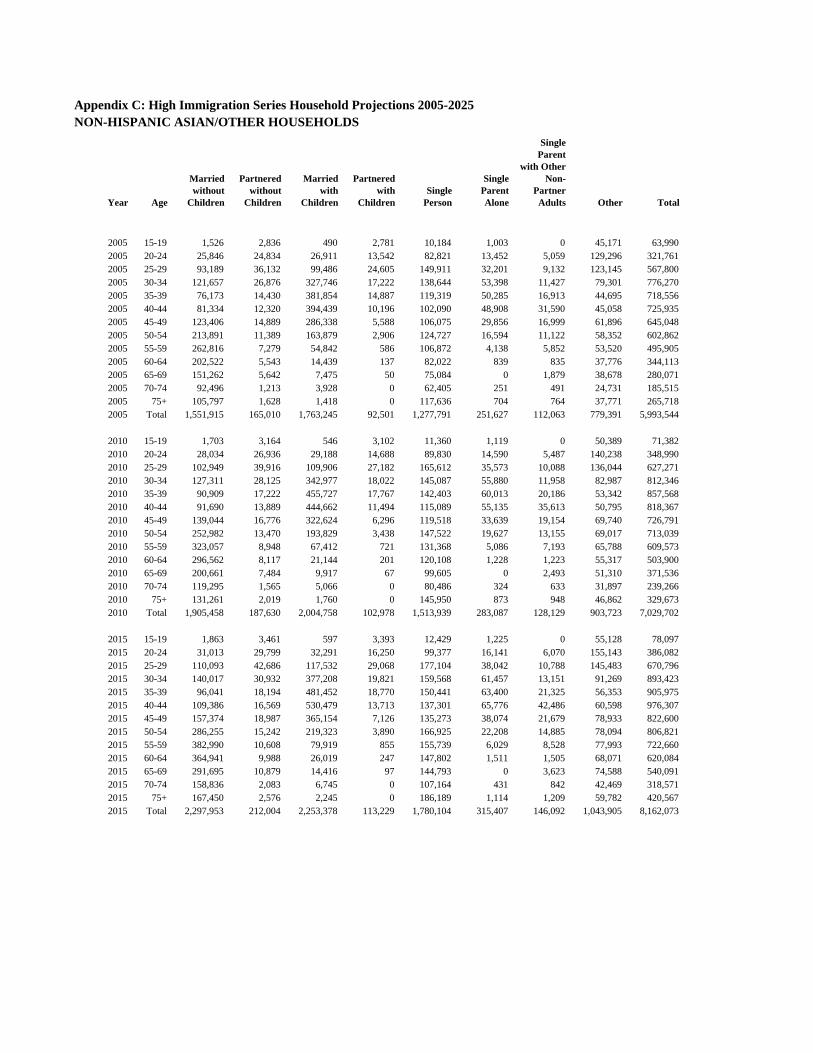
Appendix C: High Immigration Series Household Projections 2005-2025NON-HISPANIC ASIAN/OTHER HOUSEHOLDS
Year Age
Married without
Children
Partnered without
Children
Married with
Children
Partnered with
ChildrenSingle
Person
Single Parent Alone
Single Parent
with Other Non-
Partner Adults Other Total
2005 15-19 1,526 2,836 490 2,781 10,184 1,003 0 45,171 63,9902005 20-24 25,846 24,834 26,911 13,542 82,821 13,452 5,059 129,296 321,7612005 25-29 93,189 36,132 99,486 24,605 149,911 32,201 9,132 123,145 567,8002005 30-34 121,657 26,876 327,746 17,222 138,644 53,398 11,427 79,301 776,2702005 35-39 76,173 14,430 381,854 14,887 119,319 50,285 16,913 44,695 718,5562005 40-44 81,334 12,320 394,439 10,196 102,090 48,908 31,590 45,058 725,9352005 45-49 123,406 14,889 286,338 5,588 106,075 29,856 16,999 61,896 645,0482005 50-54 213,891 11,389 163,879 2,906 124,727 16,594 11,122 58,352 602,8622005 55-59 262,816 7,279 54,842 586 106,872 4,138 5,852 53,520 495,9052005 60-64 202,522 5,543 14,439 137 82,022 839 835 37,776 344,1132005 65-69 151,262 5,642 7,475 50 75,084 0 1,879 38,678 280,0712005 70-74 92,496 1,213 3,928 0 62,405 251 491 24,731 185,5152005 75+ 105,797 1,628 1,418 0 117,636 704 764 37,771 265,7182005 Total 1,551,915 165,010 1,763,245 92,501 1,277,791 251,627 112,063 779,391 5,993,544
2010 15-19 1,703 3,164 546 3,102 11,360 1,119 0 50,389 71,3822010 20-24 28,034 26,936 29,188 14,688 89,830 14,590 5,487 140,238 348,9902010 25-29 102,949 39,916 109,906 27,182 165,612 35,573 10,088 136,044 627,2712010 30-34 127,311 28,125 342,977 18,022 145,087 55,880 11,958 82,987 812,3462010 35-39 90,909 17,222 455,727 17,767 142,403 60,013 20,186 53,342 857,5682010 40-44 91,690 13,889 444,662 11,494 115,089 55,135 35,613 50,795 818,3672010 45-49 139,044 16,776 322,624 6,296 119,518 33,639 19,154 69,740 726,7912010 50-54 252,982 13,470 193,829 3,438 147,522 19,627 13,155 69,017 713,0392010 55-59 323,057 8,948 67,412 721 131,368 5,086 7,193 65,788 609,5732010 60-64 296,562 8,117 21,144 201 120,108 1,228 1,223 55,317 503,9002010 65-69 200,661 7,484 9,917 67 99,605 0 2,493 51,310 371,5362010 70-74 119,295 1,565 5,066 0 80,486 324 633 31,897 239,2662010 75+ 131,261 2,019 1,760 0 145,950 873 948 46,862 329,6732010 Total 1,905,458 187,630 2,004,758 102,978 1,513,939 283,087 128,129 903,723 7,029,702
2015 15-19 1,863 3,461 597 3,393 12,429 1,225 0 55,128 78,0972015 20-24 31,013 29,799 32,291 16,250 99,377 16,141 6,070 155,143 386,0822015 25-29 110,093 42,686 117,532 29,068 177,104 38,042 10,788 145,483 670,7962015 30-34 140,017 30,932 377,208 19,821 159,568 61,457 13,151 91,269 893,4232015 35-39 96,041 18,194 481,452 18,770 150,441 63,400 21,325 56,353 905,9752015 40-44 109,386 16,569 530,479 13,713 137,301 65,776 42,486 60,598 976,3072015 45-49 157,374 18,987 365,154 7,126 135,273 38,074 21,679 78,933 822,6002015 50-54 286,255 15,242 219,323 3,890 166,925 22,208 14,885 78,094 806,8212015 55-59 382,990 10,608 79,919 855 155,739 6,029 8,528 77,993 722,6602015 60-64 364,941 9,988 26,019 247 147,802 1,511 1,505 68,071 620,0842015 65-69 291,695 10,879 14,416 97 144,793 0 3,623 74,588 540,0912015 70-74 158,836 2,083 6,745 0 107,164 431 842 42,469 318,5712015 75+ 167,450 2,576 2,245 0 186,189 1,114 1,209 59,782 420,5672015 Total 2,297,953 212,004 2,253,378 113,229 1,780,104 315,407 146,092 1,043,905 8,162,073
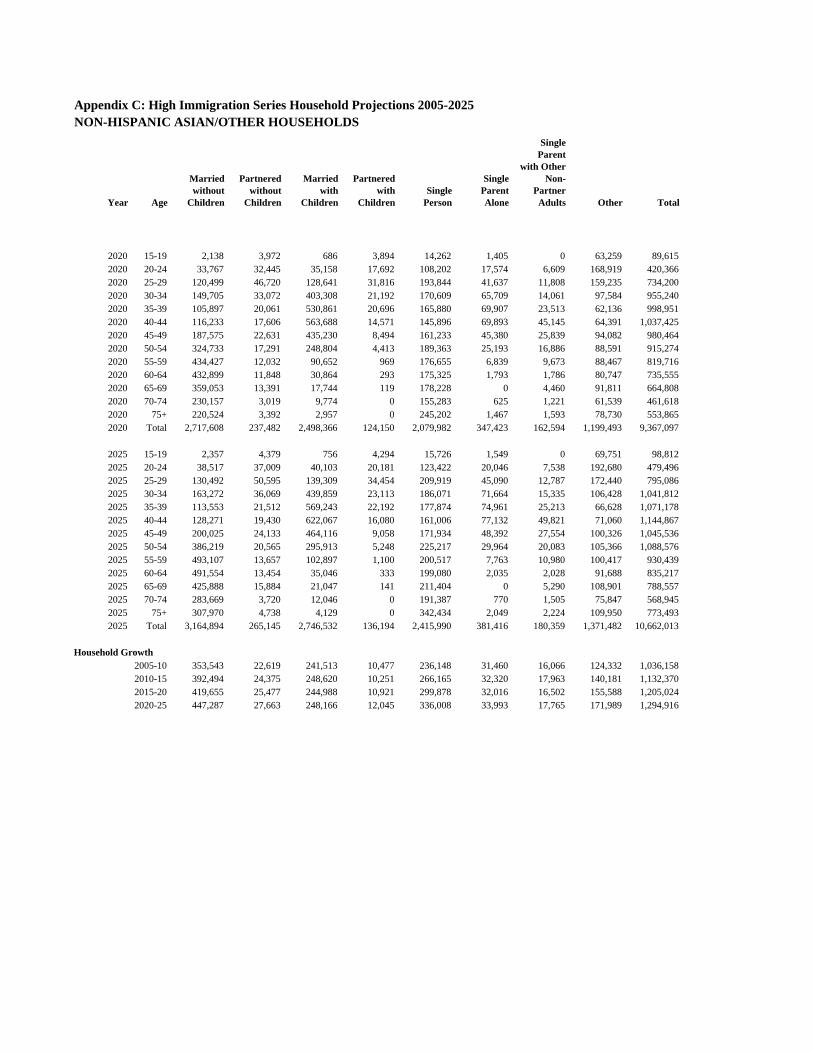
Appendix C: High Immigration Series Household Projections 2005-2025NON-HISPANIC ASIAN/OTHER HOUSEHOLDS
Year Age
Married without
Children
Partnered without
Children
Married with
Children
Partnered with
ChildrenSingle
Person
Single Parent Alone
Single Parent
with Other Non-
Partner Adults Other Total
2020 15-19 2,138 3,972 686 3,894 14,262 1,405 0 63,259 89,6152020 20-24 33,767 32,445 35,158 17,692 108,202 17,574 6,609 168,919 420,3662020 25-29 120,499 46,720 128,641 31,816 193,844 41,637 11,808 159,235 734,2002020 30-34 149,705 33,072 403,308 21,192 170,609 65,709 14,061 97,584 955,2402020 35-39 105,897 20,061 530,861 20,696 165,880 69,907 23,513 62,136 998,9512020 40-44 116,233 17,606 563,688 14,571 145,896 69,893 45,145 64,391 1,037,4252020 45-49 187,575 22,631 435,230 8,494 161,233 45,380 25,839 94,082 980,4642020 50-54 324,733 17,291 248,804 4,413 189,363 25,193 16,886 88,591 915,2742020 55-59 434,427 12,032 90,652 969 176,655 6,839 9,673 88,467 819,7162020 60-64 432,899 11,848 30,864 293 175,325 1,793 1,786 80,747 735,5552020 65-69 359,053 13,391 17,744 119 178,228 0 4,460 91,811 664,8082020 70-74 230,157 3,019 9,774 0 155,283 625 1,221 61,539 461,6182020 75+ 220,524 3,392 2,957 0 245,202 1,467 1,593 78,730 553,8652020 Total 2,717,608 237,482 2,498,366 124,150 2,079,982 347,423 162,594 1,199,493 9,367,097
2025 15-19 2,357 4,379 756 4,294 15,726 1,549 0 69,751 98,8122025 20-24 38,517 37,009 40,103 20,181 123,422 20,046 7,538 192,680 479,4962025 25-29 130,492 50,595 139,309 34,454 209,919 45,090 12,787 172,440 795,0862025 30-34 163,272 36,069 439,859 23,113 186,071 71,664 15,335 106,428 1,041,8122025 35-39 113,553 21,512 569,243 22,192 177,874 74,961 25,213 66,628 1,071,1782025 40-44 128,271 19,430 622,067 16,080 161,006 77,132 49,821 71,060 1,144,8672025 45-49 200,025 24,133 464,116 9,058 171,934 48,392 27,554 100,326 1,045,5362025 50-54 386,219 20,565 295,913 5,248 225,217 29,964 20,083 105,366 1,088,5762025 55-59 493,107 13,657 102,897 1,100 200,517 7,763 10,980 100,417 930,4392025 60-64 491,554 13,454 35,046 333 199,080 2,035 2,028 91,688 835,2172025 65-69 425,888 15,884 21,047 141 211,404 0 5,290 108,901 788,5572025 70-74 283,669 3,720 12,046 0 191,387 770 1,505 75,847 568,9452025 75+ 307,970 4,738 4,129 0 342,434 2,049 2,224 109,950 773,4932025 Total 3,164,894 265,145 2,746,532 136,194 2,415,990 381,416 180,359 1,371,482 10,662,013
Household Growth2005-10 353,543 22,619 241,513 10,477 236,148 31,460 16,066 124,332 1,036,1582010-15 392,494 24,375 248,620 10,251 266,165 32,320 17,963 140,181 1,132,3702015-20 419,655 25,477 244,988 10,921 299,878 32,016 16,502 155,588 1,205,0242020-25 447,287 27,663 248,166 12,045 336,008 33,993 17,765 171,989 1,294,916
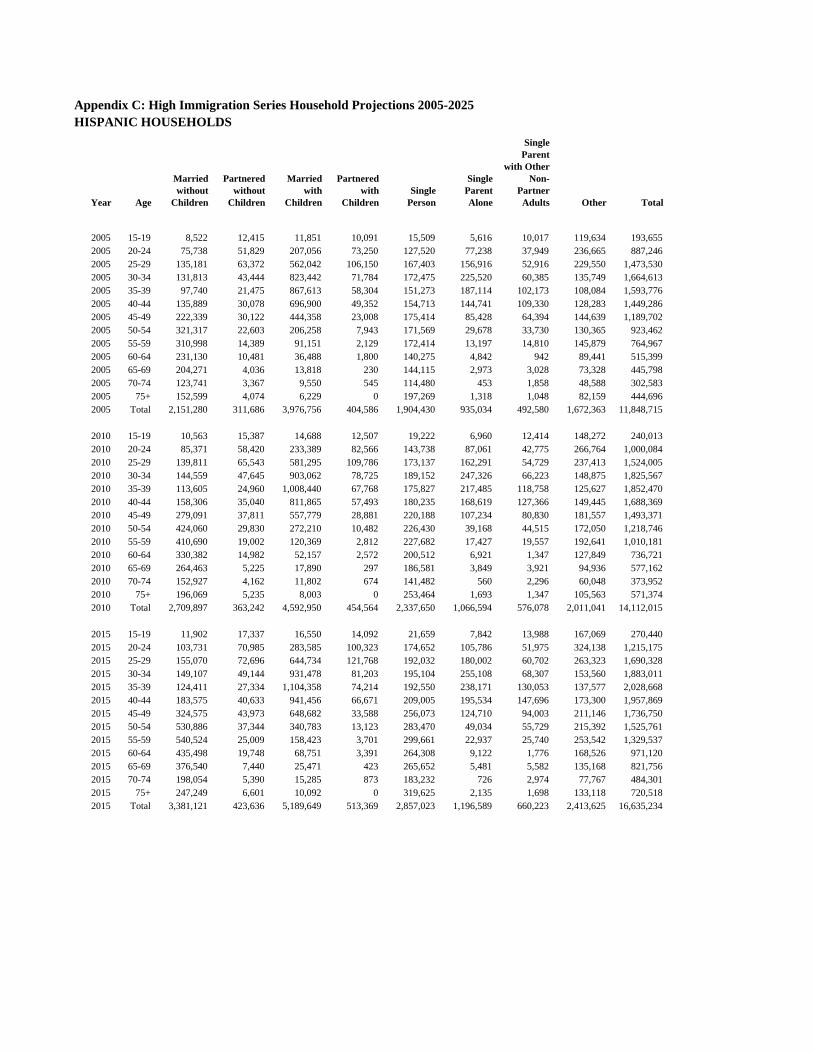
Appendix C: High Immigration Series Household Projections 2005-2025HISPANIC HOUSEHOLDS
Year Age
Married without
Children
Partnered without
Children
Married with
Children
Partnered with
ChildrenSingle
Person
Single Parent Alone
Single Parent
with Other Non-
Partner Adults Other Total
2005 15-19 8,522 12,415 11,851 10,091 15,509 5,616 10,017 119,634 193,6552005 20-24 75,738 51,829 207,056 73,250 127,520 77,238 37,949 236,665 887,2462005 25-29 135,181 63,372 562,042 106,150 167,403 156,916 52,916 229,550 1,473,5302005 30-34 131,813 43,444 823,442 71,784 172,475 225,520 60,385 135,749 1,664,6132005 35-39 97,740 21,475 867,613 58,304 151,273 187,114 102,173 108,084 1,593,7762005 40-44 135,889 30,078 696,900 49,352 154,713 144,741 109,330 128,283 1,449,2862005 45-49 222,339 30,122 444,358 23,008 175,414 85,428 64,394 144,639 1,189,7022005 50-54 321,317 22,603 206,258 7,943 171,569 29,678 33,730 130,365 923,4622005 55-59 310,998 14,389 91,151 2,129 172,414 13,197 14,810 145,879 764,9672005 60-64 231,130 10,481 36,488 1,800 140,275 4,842 942 89,441 515,3992005 65-69 204,271 4,036 13,818 230 144,115 2,973 3,028 73,328 445,7982005 70-74 123,741 3,367 9,550 545 114,480 453 1,858 48,588 302,5832005 75+ 152,599 4,074 6,229 0 197,269 1,318 1,048 82,159 444,6962005 Total 2,151,280 311,686 3,976,756 404,586 1,904,430 935,034 492,580 1,672,363 11,848,715
2010 15-19 10,563 15,387 14,688 12,507 19,222 6,960 12,414 148,272 240,0132010 20-24 85,371 58,420 233,389 82,566 143,738 87,061 42,775 266,764 1,000,0842010 25-29 139,811 65,543 581,295 109,786 173,137 162,291 54,729 237,413 1,524,0052010 30-34 144,559 47,645 903,062 78,725 189,152 247,326 66,223 148,875 1,825,5672010 35-39 113,605 24,960 1,008,440 67,768 175,827 217,485 118,758 125,627 1,852,4702010 40-44 158,306 35,040 811,865 57,493 180,235 168,619 127,366 149,445 1,688,3692010 45-49 279,091 37,811 557,779 28,881 220,188 107,234 80,830 181,557 1,493,3712010 50-54 424,060 29,830 272,210 10,482 226,430 39,168 44,515 172,050 1,218,7462010 55-59 410,690 19,002 120,369 2,812 227,682 17,427 19,557 192,641 1,010,1812010 60-64 330,382 14,982 52,157 2,572 200,512 6,921 1,347 127,849 736,7212010 65-69 264,463 5,225 17,890 297 186,581 3,849 3,921 94,936 577,1622010 70-74 152,927 4,162 11,802 674 141,482 560 2,296 60,048 373,9522010 75+ 196,069 5,235 8,003 0 253,464 1,693 1,347 105,563 571,3742010 Total 2,709,897 363,242 4,592,950 454,564 2,337,650 1,066,594 576,078 2,011,041 14,112,015
2015 15-19 11,902 17,337 16,550 14,092 21,659 7,842 13,988 167,069 270,4402015 20-24 103,731 70,985 283,585 100,323 174,652 105,786 51,975 324,138 1,215,1752015 25-29 155,070 72,696 644,734 121,768 192,032 180,002 60,702 263,323 1,690,3282015 30-34 149,107 49,144 931,478 81,203 195,104 255,108 68,307 153,560 1,883,0112015 35-39 124,411 27,334 1,104,358 74,214 192,550 238,171 130,053 137,577 2,028,6682015 40-44 183,575 40,633 941,456 66,671 209,005 195,534 147,696 173,300 1,957,8692015 45-49 324,575 43,973 648,682 33,588 256,073 124,710 94,003 211,146 1,736,7502015 50-54 530,886 37,344 340,783 13,123 283,470 49,034 55,729 215,392 1,525,7612015 55-59 540,524 25,009 158,423 3,701 299,661 22,937 25,740 253,542 1,329,5372015 60-64 435,498 19,748 68,751 3,391 264,308 9,122 1,776 168,526 971,1202015 65-69 376,540 7,440 25,471 423 265,652 5,481 5,582 135,168 821,7562015 70-74 198,054 5,390 15,285 873 183,232 726 2,974 77,767 484,3012015 75+ 247,249 6,601 10,092 0 319,625 2,135 1,698 133,118 720,5182015 Total 3,381,121 423,636 5,189,649 513,369 2,857,023 1,196,589 660,223 2,413,625 16,635,234
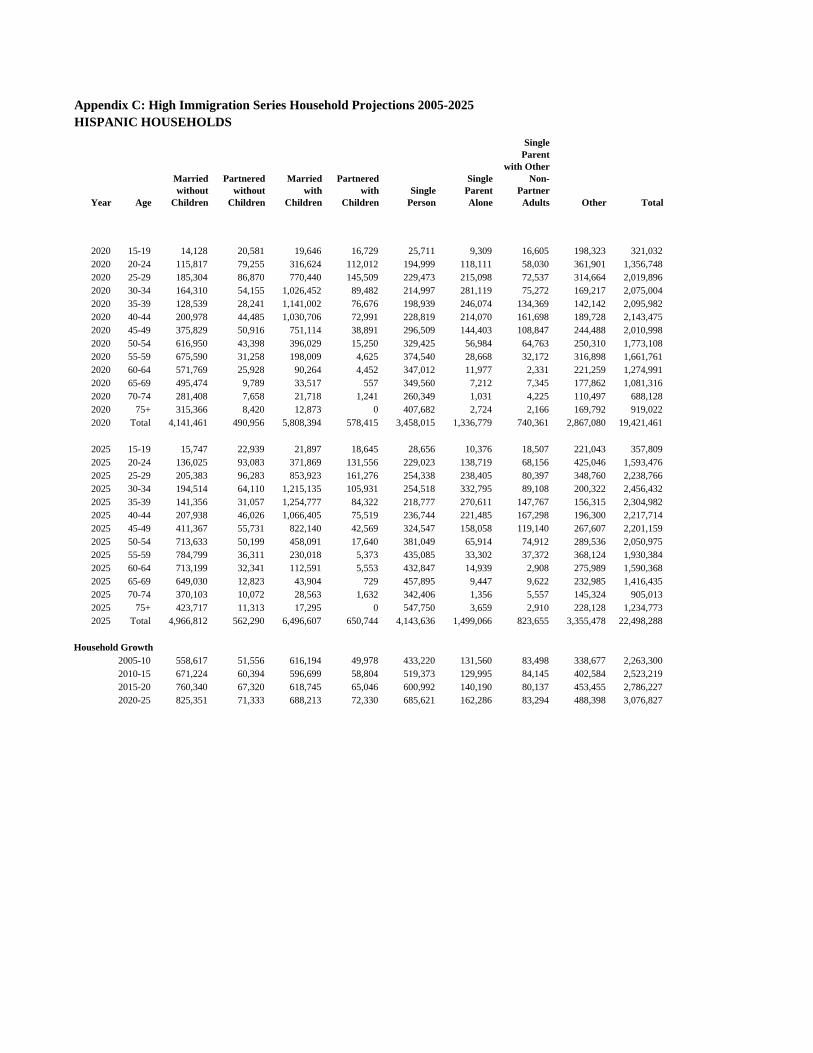
Appendix C: High Immigration Series Household Projections 2005-2025HISPANIC HOUSEHOLDS
Year Age
Married without
Children
Partnered without
Children
Married with
Children
Partnered with
ChildrenSingle
Person
Single Parent Alone
Single Parent
with Other Non-
Partner Adults Other Total
2020 15-19 14,128 20,581 19,646 16,729 25,711 9,309 16,605 198,323 321,0322020 20-24 115,817 79,255 316,624 112,012 194,999 118,111 58,030 361,901 1,356,7482020 25-29 185,304 86,870 770,440 145,509 229,473 215,098 72,537 314,664 2,019,8962020 30-34 164,310 54,155 1,026,452 89,482 214,997 281,119 75,272 169,217 2,075,0042020 35-39 128,539 28,241 1,141,002 76,676 198,939 246,074 134,369 142,142 2,095,9822020 40-44 200,978 44,485 1,030,706 72,991 228,819 214,070 161,698 189,728 2,143,4752020 45-49 375,829 50,916 751,114 38,891 296,509 144,403 108,847 244,488 2,010,9982020 50-54 616,950 43,398 396,029 15,250 329,425 56,984 64,763 250,310 1,773,1082020 55-59 675,590 31,258 198,009 4,625 374,540 28,668 32,172 316,898 1,661,7612020 60-64 571,769 25,928 90,264 4,452 347,012 11,977 2,331 221,259 1,274,9912020 65-69 495,474 9,789 33,517 557 349,560 7,212 7,345 177,862 1,081,3162020 70-74 281,408 7,658 21,718 1,241 260,349 1,031 4,225 110,497 688,1282020 75+ 315,366 8,420 12,873 0 407,682 2,724 2,166 169,792 919,0222020 Total 4,141,461 490,956 5,808,394 578,415 3,458,015 1,336,779 740,361 2,867,080 19,421,461
2025 15-19 15,747 22,939 21,897 18,645 28,656 10,376 18,507 221,043 357,8092025 20-24 136,025 93,083 371,869 131,556 229,023 138,719 68,156 425,046 1,593,4762025 25-29 205,383 96,283 853,923 161,276 254,338 238,405 80,397 348,760 2,238,7662025 30-34 194,514 64,110 1,215,135 105,931 254,518 332,795 89,108 200,322 2,456,4322025 35-39 141,356 31,057 1,254,777 84,322 218,777 270,611 147,767 156,315 2,304,9822025 40-44 207,938 46,026 1,066,405 75,519 236,744 221,485 167,298 196,300 2,217,7142025 45-49 411,367 55,731 822,140 42,569 324,547 158,058 119,140 267,607 2,201,1592025 50-54 713,633 50,199 458,091 17,640 381,049 65,914 74,912 289,536 2,050,9752025 55-59 784,799 36,311 230,018 5,373 435,085 33,302 37,372 368,124 1,930,3842025 60-64 713,199 32,341 112,591 5,553 432,847 14,939 2,908 275,989 1,590,3682025 65-69 649,030 12,823 43,904 729 457,895 9,447 9,622 232,985 1,416,4352025 70-74 370,103 10,072 28,563 1,632 342,406 1,356 5,557 145,324 905,0132025 75+ 423,717 11,313 17,295 0 547,750 3,659 2,910 228,128 1,234,7732025 Total 4,966,812 562,290 6,496,607 650,744 4,143,636 1,499,066 823,655 3,355,478 22,498,288
Household Growth2005-10 558,617 51,556 616,194 49,978 433,220 131,560 83,498 338,677 2,263,3002010-15 671,224 60,394 596,699 58,804 519,373 129,995 84,145 402,584 2,523,2192015-20 760,340 67,320 618,745 65,046 600,992 140,190 80,137 453,455 2,786,2272020-25 825,351 71,333 688,213 72,330 685,621 162,286 83,294 488,398 3,076,827