Embed Size (px)
Citation preview

JOHNSON & JOHNSON REPORTS 2020 FOURTH-QUARTER AND FULL YEAR RESULTS:
• 2020 Fourth-Quarter Sales of $22.5 Billion reflecting growth of 8.3%, operational growth of 7.1%* and adjusted operational growth of 7.3%*
• 2020 Full-Year Sales of $82.6 Billion reflecting growth of 0.6%, operational growth of 1.2%* and adjusted operational growth of 1.5%*
• 2020 Fourth-Quarter EPS of $0.65 decreased 56.7%; adjusted EPS of $1.86 decreased 1.1%*
• 2020 Full-Year EPS of $5.51 decreased 2.1%; adjusted EPS of $8.03 decreased 7.5%*
• Company provides 2021 guidance of adjusted operational sales growth of 8.8%* and adjusted operational EPS growth of 16.4%*
New Brunswick, N.J. (January 26, 2021) – Johnson & Johnson (NYSE: JNJ) today announced results for fourth-quarter and full year 2020. “Our notable full year performance reflects the continued confidence from patients, physicians, customers and consumers in our life-enhancing products and medicines, particularly throughout the COVID-19 pandemic,” said Alex Gorsky, Chairman and Chief Executive Officer. “I’m incredibly proud of our Johnson & Johnson teams around the world for going above and beyond to meet stakeholder needs. These efforts, and our commitment to families around the world as the largest broad-based healthcare company, enabled us to lead in the fight against COVID-19. We continue to progress our COVID-19 vaccine candidate and look forward to sharing details from our Phase 3 study soon. Johnson & Johnson was built for times like these, and I am extremely confident in our ability to deliver lasting value and continued innovation in 2021 and for years to come.”
OVERALL FINANCIAL RESULTS:
1 Non-GAAP financial measure; refer to reconciliations of non-GAAP financial measures included in accompanying schedules 2 Excludes the impact of translational currency 3 Excludes the net impact of acquisitions and divestitures and translational currency 4 Excludes intangible amortization expense and special items
($ in Millions, except EPS) 2020 2019 % Change 2020 2019 % ChangeReported Sales 22,475$ 20,747$ 8.3% 82,584$ 82,059$ 0.6%Net Earnings 1,738 4,010 (56.7)% 14,714 15,119 (2.7)%EPS (diluted) 0.65$ 1.50$ (56.7)% 5.51$ 5.63$ (2.1)%
Non-GAAP*($ in Millions, except EPS) 2020 2019 % Change 2020 2019 % ChangeOperational Sales1,2 7.1% 1.2%
Adjusted Operational Sales1,3 7.3% 1.5%
Adjusted Net Earnings1,4 4,965 5,027 (1.2)% 21,433 23,310 (8.1)%
Adjusted EPS (diluted)1,4 1.86$ 1.88$ (1.1)% 8.03$ 8.68$ (7.5)%
FOURTH QUARTER
FOURTH QUARTER TWELVE MONTHS
TWELVE MONTHS

2
REGIONAL SALES RESULTS:
1 Non-GAAP financial measure; refer to reconciliations of non-GAAP financial measures included in accompanying schedules
2 Excludes the impact of translational currency 3 Excludes the net impact of acquisitions and divestitures and translational currency
Note: values may have been rounded SEGMENT SALES RESULTS:
1 Non-GAAP financial measure; refer to reconciliations of non-GAAP financial measures included in accompanying schedules
2 Excludes the impact of translational currency 3 Excludes the net impact of acquisitions and divestitures and translational currency
Note: values may have been rounded
Adjusted($ in Millions) 1
Adjusted20202
Adjusted20192
AdjustedReported2
AdjustedOperational1,2
AdjustedCurrency2
Adjusted Operational1,3
U.S. 11,809$ 10,774$ 9.6% 9.6% - 9.6International 10,666 9,973 7.0% 4.3% 2.7 4.8Worldwide 22,475$ 20,747$ 8.3% 7.1% 1.2 7.3
Adjusted($ in Millions) 1
Adjusted20202
Adjusted20192
AdjustedReported2
AdjustedOperational1,2
AdjustedCurrency2
Adjusted Operational1,3
U.S. 43,133$ 42,097$ 2.5% 2.5 - 2.8International 39,451 39,962 (1.3)% (0.2) (1.1) 0.2Worldwide 82,584$ 82,059$ 0.6% 1.2 (0.6) 1.5
FOURTH QUARTER % Change
TWELVE MONTHS % Change
Adjusted($ in Millions) 1
Adjusted20201
Adjusted20191
AdjustedReported2
AdjustedOperational1,2
AdjustedCurrency1
Adjusted Operational1,3
Consumer Health 3,618$ 3,567$ 1.4% 2.0 (0.6) 2.1Pharmaceutical 12,268 10,548 16.3% 14.6 1.7 14.6Medical Devices 6,589 6,632 (0.7)% (2.2) 1.5 (1.5)Worldwide 22,475$ 20,747$ 8.3% 7.1 1.2 7.3
Adjusted($ in Millions) 1
Adjusted20201
Adjusted20191
AdjustedReported2
AdjustedOperational1,2
AdjustedCurrency1
Adjusted Operational1,3
Consumer Health 14,053$ 13,898$ 1.1% 3.0 (1.9) 3.1Pharmaceutical 45,572 42,198 8.0% 8.2 (0.2) 8.4Medical Devices 22,959 25,963 (11.6)% (11.4) (0.2) (10.5)Worldwide 82,584$ 82,059$ 0.6% 1.2 (0.6) 1.5
% ChangeFOURTH QUARTER
TWELVE MONTHS % Change

3
FULL-YEAR 2020 SEGMENT COMMENTARY:
Consumer Health Consumer Health worldwide operational sales, excluding the net impact of acquisitions and divestitures, grew 3.1%*
driven by U.S. growth in over-the-counter products including TYLENOL analgesics, PEPCID and ZYRTEC; LISTERINE
mouthwash in oral care products; OGX in skin health/beauty products and wound care products. Growth was
negatively impacted by COVID-19 primarily in skin health/beauty and international baby care partially offset by
increased COVID-19 demand in oral care products.
Pharmaceutical Pharmaceutical worldwide operational sales, excluding the net impact of acquisitions and divestitures, grew 8.4%*
driven by STELARA (ustekinumab), a biologic for the treatment of a number of immune-mediated inflammatory
diseases, DARZALEX (daratumumab), for the treatment of multiple myeloma, IMBRUVICA (ibrutinib), an oral, once-
daily therapy approved for use in treating certain B-cell malignancies, a type of blood or lymph node cancer, ERLEADA
(apalutamide), a next-generation androgen receptor inhibitor for the treatment of patients with prostate cancer,
TREMFYA (guselkumab), a biologic for the treatment of adults living with moderate to severe plaque psoriasis, and for
adults with active psoriatic arthritis, INVEGA SUSTENNA/XEPLION/INVEGA TRINZA/TREVICTA (paliperidone
palmitate), long-acting, injectable atypical antipsychotics for the treatment of schizophrenia in adults, OPSUMIT
(macitentan), an oral endothelin receptor antagonist indicated for the treatment of pulmonary arterial hypertension to
delay disease progression and UPTRAVI (selexipag), an oral prostacyclin receptor agonist used to treat pulmonary
arterial hypertension and reduce hospitalization. This growth was partially offset by the negative impact of COVID-19
as well as biosimilar and generic competition, with declines primarily in REMICADE (infliximab), a biologic approved
for the treatment of a number of immune-mediated inflammatory diseases, U.S. ZYTIGA (abiraterone acetate), an oral,
once-daily medication for use in combination with prednisone for the treatment of metastatic castration-resistant
prostate cancer, and international VELCADE (bortezomib), a proteasome inhibitor for the treatment of multiple
myeloma.
Medical Devices Medical Devices worldwide operational sales, excluding the net impact of acquisitions and divestitures, declined by
10.5%*. The decline was primarily driven by the negative impact of the COVID-19 pandemic and the associated deferral
of medical procedures to our Surgery, Orthopaedics, and Vision businesses. The decline was partially
offset by growth in the Interventional Solutions business led by electrophysiology products. Results reflect market
recovery in the second half of 2020.

4
NOTABLE NEW ANNOUNCEMENTS IN THE QUARTER: The information contained in this section should be read in conjunction with Johnson & Johnson’s other disclosures
filed with the Securities and Exchange Commission, including its Current Reports on Form 8-K, Quarterly Reports on
Form 10-Q and Annual Reports on Form 10-K. Copies of these filings are available online at www.sec.gov,
www.jnj.com or on request from Johnson & Johnson. The reader is also encouraged to review all other news
releases available online in the Investors section of the company’s website at news releases.
Regulatory Approvals
VELYS Robotic-Assisted Solution- Receives 510(k) FDA Clearance Designed for Use with the ATTUNE Total Knee System ¹ (press release)
DARZALEX FASPRO (daratumumab and hyaluronidase-fihj)- Becomes the First FDA-Approved Treatment for Patients with Newly Diagnosed Light Chain (AL) Amyloidosis ¹ (press release)
CABENUVA (rilpivirine/cabotegravir)- U.S. FDA Approval and European Commission Authorization of the first complete long acting injectable HIV treatment ¹
(press release)
(press release)
TREMFYA (guselkumab)- European Commission Approves First-in-Class treatment for Active Psoriatic Arthritis (PsA) (press release)
Regulatory Submissions
Amivantamab- Submission of U.S. FDA and European Marketing Authorization Application for Treatment of Patients with Metastatic Non-Small Cell Lung Cancer with EGFR Exon 20 Insertion Mutations
(press release)
(press release)
BCMA CAR-T Therapy (ciltacabtagene autoleucel)- Rolling Submission of a Biologics License Application to U.S. FDA for the Treatment of Relapsed and/or Refractory Multiple Myeloma
(press release)
DARZALEX (daratumumab and hyaluronidase-fihj)- Janssen Submits Applications in U.S. and EU Seeking Approval of DARZALEX FASPRO (daratumumab and hyaluronidase-fihj)/DARZALEX (daratumumab) Subcutaneous (SC) Formulation in Combination With Pomalidomide and Dexamethasone for Patients With Relapsed or Refractory Multiple Myeloma
(press release)
Paliperidone Palmitate 6-Month- Submission of Supplemental New Drug Application to U.S. FDA and European Marketing Authorization for Treatment of Schizophrenia in Adults
(press release)
(press release)
XARELTO (rivaroxaban)- Submission of Application to U.S. FDA for New Indication to Expand Use in Patients with Peripheral Artery Disease (press release)
Other
Janssen Receives Positive CHMP Opinion for SPRAVATO (esketamine Nasal Spray) for the Rapid Reduction of Depressive Symptoms in a Psychiatric Emergency for Patients with Major Depressive Disorder
(press release)
Janssen Acquires Rights to Novel Gene Therapy, Pioneering Treatment Solutions for Late-Stage Age-Related Macular Degeneration (press release)
Johnson & Johnson Initiates Second Global Phase 3 Clinical Trial of its Janssen COVID-19 Vaccine Candidate (press release)
1 Subsequent to the quarter

5
FULL-YEAR 2021 GUIDANCE: Johnson & Johnson does not provide GAAP financial measures on a forward-looking basis because the company is
unable to predict with reasonable certainty the ultimate outcome of legal proceedings, unusual gains and losses,
acquisition-related expenses and purchase accounting fair value adjustments without unreasonable effort. These items
are uncertain, depend on various factors, and could be material to Johnson & Johnson's results computed in
accordance with GAAP.
January 2021 ($ in Billions, except EPS)
Adjusted Operational Sales1,2
Change vs. Prior Year 8.0% - 9.5%
Operational Sales2
Change vs. Prior Year
$88.8B - $90.0B
7.5% – 9.0%
Estimated Reported Sales3
Change vs. Prior Year
$90.5B - $91.7B
9.5% – 11.0%
Adjusted Operational EPS (Diluted)2,4
Change vs. Prior Year
$9.25 - $9.45
15.2% - 17.7%
Adjusted EPS (Diluted)3,4
Change vs. Prior Year
$9.40 - $9.60
17.1% - 19.6%
1 Non-GAAP financial measure; excludes the net impact of acquisitions and divestitures
2 Non-GAAP financial measure; excludes the impact of translational currency 3 Calculated using Euro Average Rate: January 2021 = $1.21 (Illustrative purposes only) 4 Non-GAAP financial measure; excludes intangible amortization expense and special items
Other modeling considerations will be provided on the webcast.
WEBCAST INFORMATION:
Johnson & Johnson will conduct a conference call with investors to discuss this earnings release today at 8:30 a.m.,
Eastern Time. A simultaneous webcast of the call for investors and other interested parties may be accessed by visiting
the Johnson & Johnson website. A replay and podcast will be available approximately two hours after the live webcast
in the Investors section of the company's website at events-and-presentations.
ABOUT JOHNSON & JOHNSON: At Johnson & Johnson, we believe good health is the foundation of vibrant lives, thriving communities and forward
progress. That’s why for more than 130 years, we have aimed to keep people well at every age and every stage of life.
Today, as the world’s largest and most broadly-based health care company, we are committed to using our reach and
size for good. We strive to improve access and affordability, create healthier communities, and put a healthy mind,
body and environment within reach of everyone, everywhere. We are blending our heart, science and ingenuity to
profoundly change the trajectory of health for humanity.

6
NON-GAAP FINANCIAL MEASURES: *Operational sales growth excluding the impact of translational currency, adjusted operational sales growth excluding
the net impact of acquisitions and divestitures and translational currency, as well as adjusted net earnings, adjusted
diluted earnings per share and adjusted operational diluted earnings per share excluding after-tax intangible
amortization expense and special items, are non-GAAP financial measures and should not be considered
replacements for, and should be read together with, the most comparable GAAP financial measures. Except for
guidance measures, reconciliations of these non-GAAP financial measures to the most directly comparable GAAP
financial measures can be found in the accompanying financial schedules of the earnings release and the Investors
section of the company's website at quarterly-results.
Copies of the financial schedules accompanying this earnings release are available on the company’s website at
quarterly-results. These schedules include supplementary sales data, a condensed consolidated statement of
earnings, reconciliations of non-GAAP financial measures, and sales of key products/franchises. Additional information
on Johnson & Johnson, including adjusted income before tax by segment, a pharmaceutical pipeline of selected
compounds in late stage development and a copy of today’s earnings call presentation can also be found in the
Investors section of the company's website at quarterly-results. NOTE TO INVESTORS CONCERNING FORWARD-LOOKING STATEMENTS: This press release contains “forward-looking statements” as defined in the Private Securities Litigation Reform Act of 1995 regarding, among other things: future operating and financial performance, product development, market position and business strategy. The reader is cautioned not to rely on these forward-looking statements. These statements are based on current expectations of future events. If underlying assumptions prove inaccurate or known or unknown risks or uncertainties materialize, actual results could vary materially from the expectations and projections of Johnson & Johnson. Risks and uncertainties include, but are not limited to: risks related to the impact of the COVID-19 global pandemic, such as the scope and duration of the outbreak, government actions and restrictive measures implemented in response, material delays and cancellations of medical procedures, supply chain disruptions and other impacts to the business, or on the Company’s ability to execute business continuity plans, as a result of the COVID-19 pandemic, economic factors, such as interest rate and currency exchange rate fluctuations; competition, including technological advances, new products and patents attained by competitors; challenges inherent in new product research and development, including uncertainty of clinical success and obtaining regulatory approvals; uncertainty of commercial success for new and existing products; challenges to patents; the impact of patent expirations; the ability of the Company to successfully execute strategic plans; the impact of business combinations and divestitures; manufacturing difficulties or delays, internally or within the supply chain; product efficacy or safety concerns resulting in product recalls or regulatory action; significant adverse litigation or government action, including related to product liability claims; changes to applicable laws and regulations, including tax laws and global health care reforms; trends toward health care cost containment; changes in behavior and spending patterns of purchasers of health care products and services; financial instability of international economies and legal systems and sovereign risk; increased scrutiny of the health care industry by government agencies. A further list and descriptions of these risks, uncertainties and other factors can be found in Johnson & Johnson's Annual Report on Form 10-K for the fiscal year ended December 29, 2019, including in the sections captioned “Cautionary Note Regarding Forward-Looking Statements” and “Item 1A. Risk Factors,” in the Company’s most recently filed Quarterly Report on Form 10-Q and the Company’s subsequent filings with the Securities and Exchange Commission. Copies of these filings are available online at www.sec.gov, www.jnj.com or on request from Johnson & Johnson. Any forward-looking statement made in this release speaks only as of the date of this release. Johnson & Johnson does not undertake to update any forward-looking statement as a result of new information or future events or developments. Press Contacts: Investor Contacts:
Christina Chan Courtney Dugan Christopher DelOrefice Lisa Romanko (732) 524-6297 (347) 452-1061 (732) 524-2955 (732) 524-2034
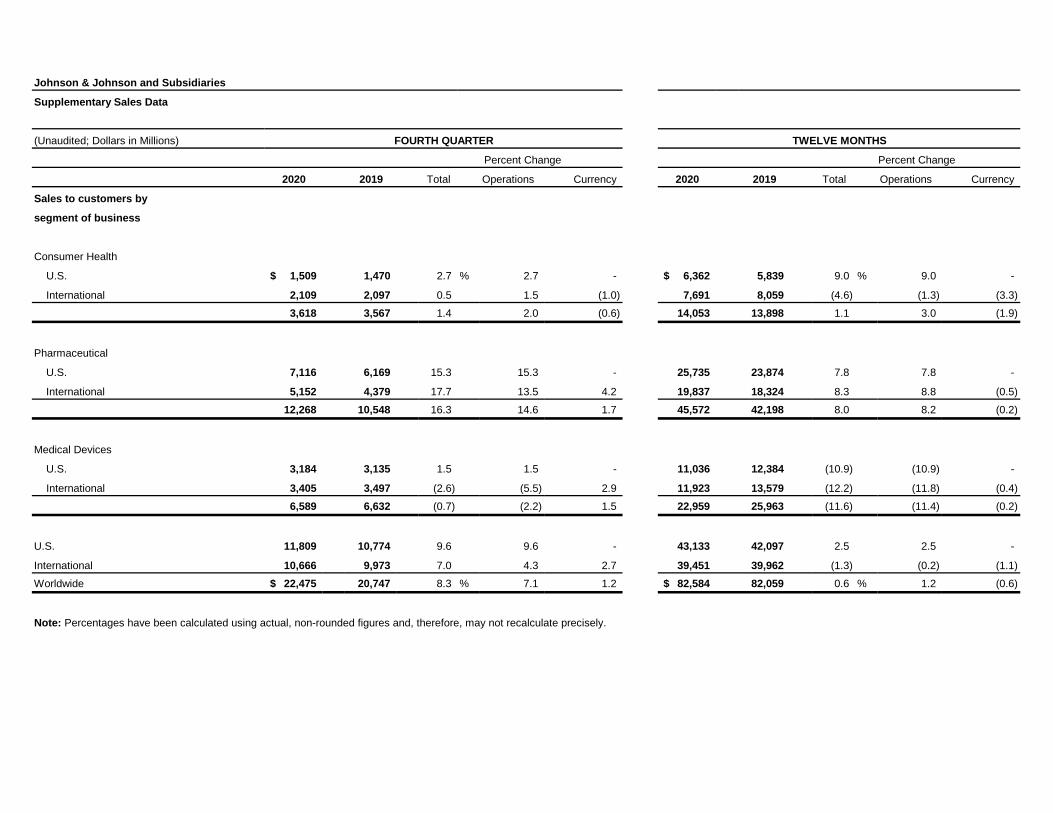
Johnson & Johnson and Subsidiaries
Supplementary Sales Data
(Unaudited; Dollars in Millions)
Percent Change
2020 2019 Total Operations Currency 2020 2019 Total Operations Currency
Sales to customers by
segment of business
Consumer Health
U.S. 1,509$ 1,470 2.7 % 2.7 - 6,362$ 5,839 9.0 % 9.0 -
International 2,109 2,097 0.5 1.5 (1.0) 7,691 8,059 (4.6) (1.3) (3.3) 3,618 3,567 1.4 2.0 (0.6) 14,053 13,898 1.1 3.0 (1.9)
Pharmaceutical
U.S. 7,116 6,169 15.3 15.3 - 25,735 23,874 7.8 7.8 -
International 5,152 4,379 17.7 13.5 4.2 19,837 18,324 8.3 8.8 (0.5) 12,268 10,548 16.3 14.6 1.7 45,572 42,198 8.0 8.2 (0.2)
Medical Devices
U.S. 3,184 3,135 1.5 1.5 - 11,036 12,384 (10.9) (10.9) -
International 3,405 3,497 (2.6) (5.5) 2.9 11,923 13,579 (12.2) (11.8) (0.4) 6,589 6,632 (0.7) (2.2) 1.5 22,959 25,963 (11.6) (11.4) (0.2)
U.S. 11,809 10,774 9.6 9.6 - 43,133 42,097 2.5 2.5 -
International 10,666 9,973 7.0 4.3 2.7 39,451 39,962 (1.3) (0.2) (1.1) Worldwide 22,475$ 20,747 8.3 % 7.1 1.2 82,584$ 82,059 0.6 % 1.2 (0.6)
Note: Percentages have been calculated using actual, non-rounded figures and, therefore, may not recalculate precisely.
TWELVE MONTHS
Percent Change
FOURTH QUARTER
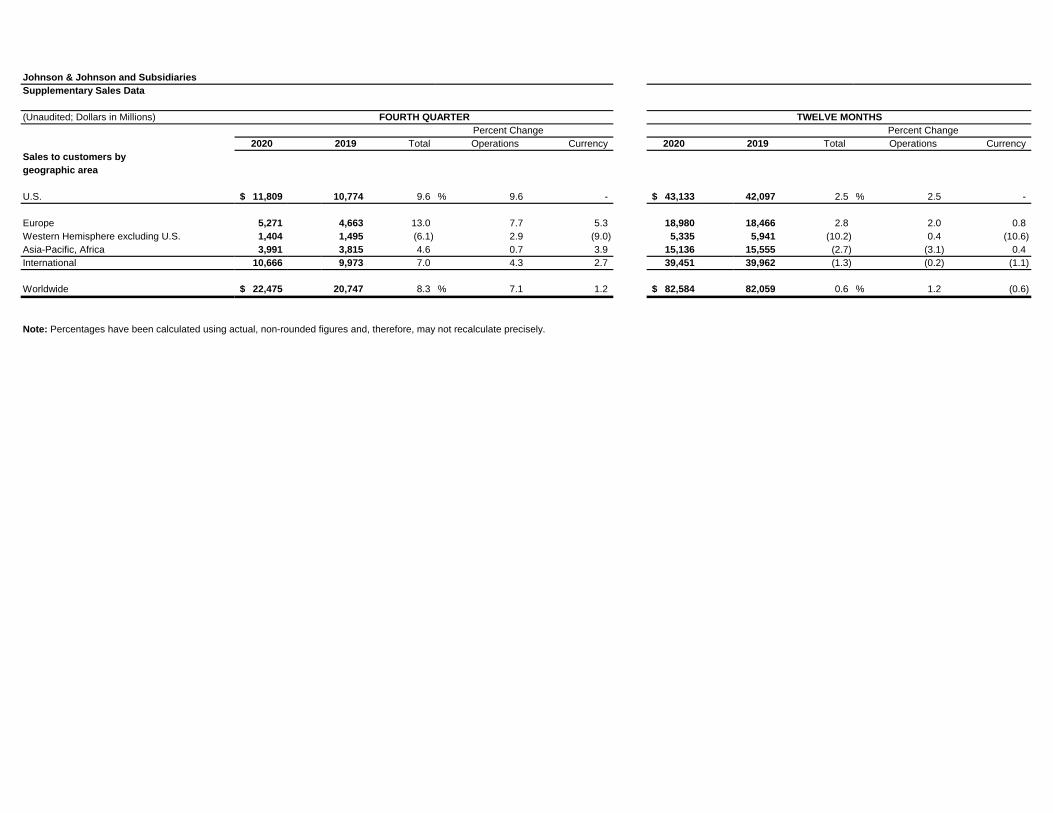
Johnson & Johnson and SubsidiariesSupplementary Sales Data
(Unaudited; Dollars in Millions)Percent Change
2020 2019 Total Operations Currency 2020 2019 Total Operations CurrencySales to customers bygeographic area
U.S. 11,809$ 10,774 9.6 % 9.6 - 43,133$ 42,097 2.5 % 2.5 -
Europe 5,271 4,663 13.0 7.7 5.3 18,980 18,466 2.8 2.0 0.8 Western Hemisphere excluding U.S. 1,404 1,495 (6.1) 2.9 (9.0) 5,335 5,941 (10.2) 0.4 (10.6) Asia-Pacific, Africa 3,991 3,815 4.6 0.7 3.9 15,136 15,555 (2.7) (3.1) 0.4 International 10,666 9,973 7.0 4.3 2.7 39,451 39,962 (1.3) (0.2) (1.1)
Worldwide 22,475$ 20,747 8.3 % 7.1 1.2 82,584$ 82,059 0.6 % 1.2 (0.6)
Note: Percentages have been calculated using actual, non-rounded figures and, therefore, may not recalculate precisely.
FOURTH QUARTER TWELVE MONTHSPercent Change
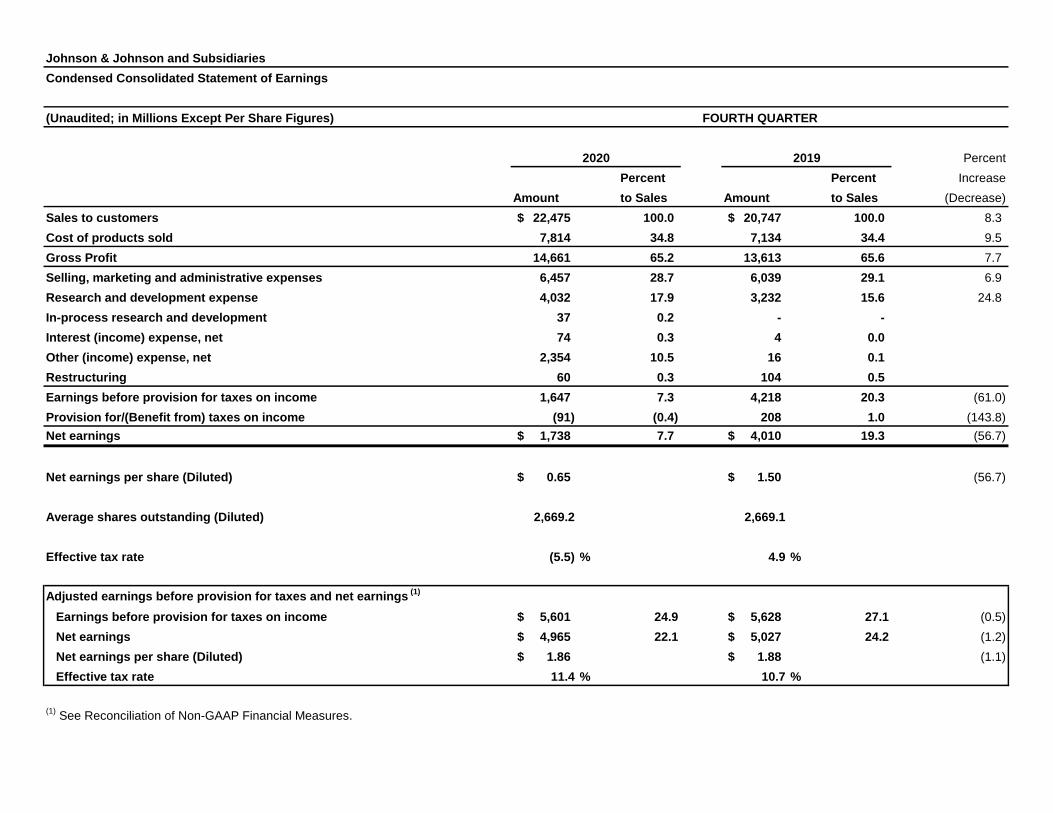
Johnson & Johnson and SubsidiariesCondensed Consolidated Statement of Earnings
(Unaudited; in Millions Except Per Share Figures)
PercentPercent Percent Increase
Amount to Sales Amount to Sales (Decrease)Sales to customers 22,475$ 100.0 20,747$ 100.0 8.3Cost of products sold 7,814 34.8 7,134 34.4 9.5Gross Profit 14,661 65.2 13,613 65.6 7.7Selling, marketing and administrative expenses 6,457 28.7 6,039 29.1 6.9Research and development expense 4,032 17.9 3,232 15.6 24.8In-process research and development 37 0.2 - - Interest (income) expense, net 74 0.3 4 0.0Other (income) expense, net 2,354 10.5 16 0.1Restructuring 60 0.3 104 0.5Earnings before provision for taxes on income 1,647 7.3 4,218 20.3 (61.0)Provision for/(Benefit from) taxes on income (91) (0.4) 208 1.0 (143.8)Net earnings 1,738$ 7.7 4,010$ 19.3 (56.7)
Net earnings per share (Diluted) 0.65$ 1.50$ (56.7)
Average shares outstanding (Diluted) 2,669.2 2,669.1
Effective tax rate (5.5) % 4.9 %
Adjusted earnings before provision for taxes and net earnings (1)
Earnings before provision for taxes on income 5,601$ 24.9 5,628$ 27.1 (0.5)Net earnings 4,965$ 22.1 5,027$ 24.2 (1.2)Net earnings per share (Diluted) 1.86$ 1.88$ (1.1)Effective tax rate 11.4 % 10.7 %
(1) See Reconciliation of Non-GAAP Financial Measures.
FOURTH QUARTER
2020 2019

Johnson & Johnson and SubsidiariesCondensed Consolidated Statement of Earnings
(Unaudited; in Millions Except Per Share Figures)
PercentPercent Percent Increase
Amount to Sales Amount to Sales (Decrease)Sales to customers 82,584$ 100.0 82,059$ 100.0 0.6Cost of products sold 28,427 34.4 27,556 33.6 3.2Gross Profit 54,157 65.6 54,503 66.4 (0.6)Selling, marketing and administrative expenses 22,084 26.8 22,178 27.0 (0.4)Research and development expense 12,159 14.7 11,355 13.8 7.1In-process research and development 181 0.2 890 1.1 Interest (income) expense, net 90 0.1 (39) 0.0 Other (income) expense, net 2,899 3.5 2,525 3.1 Restructuring 247 0.3 266 0.3Earnings before provision for taxes on income 16,497 20.0 17,328 21.1 (4.8)Provision for taxes on income 1,783 2.2 2,209 2.7 (19.3)Net earnings 14,714$ 17.8 15,119$ 18.4 (2.7)
Net earnings per share (Diluted) 5.51$ 5.63$ (2.1)
Average shares outstanding (Diluted) 2,670.7 2,684.3
Effective tax rate 10.8 % 12.7 %
Adjusted earnings before provision for taxes and net earnings (1)
Earnings before provision for taxes on income 25,428$ 30.8 28,225$ 34.4 (9.9)Net earnings 21,433$ 26.0 23,310$ 28.4 (8.1)Net earnings per share (Diluted) 8.03$ 8.68$ (7.5)Effective tax rate 15.7 % 17.4 %
(1) See Reconciliation of Non-GAAP Financial Measures.
TWELVE MONTHS
2020 2019

Johnson & Johnson and SubsidiariesReconciliation of Non-GAAP Financial Measures
(Dollars in Millions Except Per Share Data) 2020 2019 2020 2019Net Earnings, after tax- as reported $1,738 $4,010 $14,714 $15,119
Pre-tax Adjustments Intangible Asset Amortization expense 1,234 1,142 4,660 4,528Litigation expense, net 2,902 264 5,112 5,096IPR&D 37 - 181 890Restructuring related 85 251 448 611Acquisition and Integration related ¹ 14 90 (1,073) 319Unrealized (gains)/losses on securities (373) (350) (547) (567)Medical Device Regulation 2 55 - 144 - Other - 13 6 20
Tax AdjustmentsTax impact on special item adjustments 3 (606) (123) (1,608) (1,977)Tax legislation and other tax related (121) (270) (604) (729) Adjusted Net Earnings, after tax $4,965 $5,027 $21,433 $23,310Average shares outstanding (Diluted) 2,669.2 2,669.1 2,670.7 2,684.3Adjusted net earnings per share (Diluted) $1.86 $1.88 $8.03 $8.68Operational adjusted net earnings per share (Diluted) $1.82 $8.00
Notes:1
2
3
Prior year amounts have been reclassified to conform to current year disclosure
The tax impact related to special item adjustments reflects the current and deferred income taxes associated with the above pre-tax special items in arriving at adjusted earnings.
Fourth Quarter Twelve Months Ended
Acquisition and integration related costs for 2020 primarily includes a Contingent Consideration reversal of $1,148M related to the timing of certain developmental milestones associated with the Auris Health acquisition.
European Medical Device Regulation (MDR) costs represent one-time compliance costs for the Company’s previously registered products. MDR is a replacement of the existing European Medical Devices Directive regulatory framework, and manufacturers of currently marketed medical devices are required to comply with EU MDR beginning in May 2021. The Company considers the adoption of EU MDR to be a significant one-time regulatory change and is not indicative of on-going operations. The Company has excluded only external third-party regulatory and consulting costs from its Medical Devices operating segments' measures of profit and loss used for making operating decisions and assessing performance.

Johnson & Johnson and SubsidiariesReconciliation of Non-GAAP Financial Measure
Consumer Health Pharmaceutical Medical Devices Total
WW As Reported 1.4% 16.3% (0.7)% 8.3%U.S. 2.7% 15.3% 1.5% 9.6%International 0.5% 17.7% (2.6)% 7.0%
WW Currency (0.6) 1.7 1.5 1.2U.S. - - - -International (1.0) 4.2 2.9 2.7
WW Operational 2.0% 14.6% (2.2)% 7.1%U.S. 2.7% 15.3% 1.5% 9.6%International 1.5% 13.5% (5.5)% 4.3%
General SurgeryAdvanced Sterilization Products 0.6 0.2U.S. 0.0 0.0International 1.0 0.4
All Other Acquisitions and Divestitures 0.1 0.0 0.1 0.1U.S. 0.1 (0.1) 0.2 0.0International 0.1 0.2 0.0 0.1
WW Adjusted Operational 2.1% 14.6% (1.5)% 7.3%U.S. 2.8% 15.2% 1.7% 9.6%International 1.6% 13.7% (4.4)% 4.8%
Adjusted Operational Sales GrowthFOURTH QUARTER 2020 ACTUAL vs. 2019 ACTUAL
Segments
Note: Percentages are based on actual, non-rounded figures and may not sum

Johnson & Johnson and SubsidiariesReconciliation of Non-GAAP Financial Measure
Consumer Health Pharmaceutical Medical Devices Total
WW As Reported 1.1% 8.0% (11.6)% 0.6%U.S. 9.0% 7.8% (10.9)% 2.5%International (4.6)% 8.3% (12.2)% (1.3)%
WW Currency (1.9) (0.2) (0.2) (0.6)U.S. - - - -International (3.3) (0.5) (0.4) (1.1)
WW Operational 3.0% 8.2% (11.4)% 1.2%U.S. 9.0% 7.8% (10.9)% 2.5%International (1.3)% 8.8% (11.8)% (0.2)%
Skin Health / BeautyDr. Ci Labo - Japan (0.1) 0.0U.S. 0.0 0.0International (0.2) 0.0
General SurgeryAdvanced Sterilization Products 0.8 0.3U.S. 0.6 0.2International 1.0 0.4
Baby CareBaby Center 0.2 0.0U.S. 0.5 0.1International 0.0 0.0
All Other Acquisitions and Divestitures 0.0 0.2 0.0 0.1U.S. 0.0 0.0 0.0 0.0International (0.1) 0.3 0.0 0.1
WW Adjusted Operational 3.1% 8.4% (10.5)% 1.5%U.S. 9.5% 7.8% (10.2)% 2.8%International (1.5)% 9.1% (10.9)% 0.2%
Note: Percentages are based on actual, non-rounded figures and may not sum
Adjusted Operational Sales GrowthTWELVE MONTHS 2020 ACTUAL vs. 2019 ACTUAL
Segments

REPORTED SALES vs. PRIOR PERIOD ($MM) REPORTED SALES vs. PRIOR PERIOD ($MM)FOURTH QUARTER TWELVE MONTHS
2020 2019 Reported Operational (1) Currency 2020 2019 Reported Operational (1) Currency
CONSUMER HEALTH SEGMENT (2,3)
OTCUS 543$ 542 0.1% 0.1% - 2,460$ 2,010 22.4% 22.4% - Intl 642 653 -1.7% -2.9% 1.2% 2,364 2,434 -2.9% -1.2% -1.7%WW 1,185 1,195 -0.8% -1.5% 0.7% 4,824 4,444 8.5% 9.4% -0.9%
SKIN HEALTH / BEAUTY(4)
US 583 582 0.2% 0.2% - 2,350 2,392 -1.7% -1.7% - Intl 594 568 4.6% 5.0% -0.4% 2,100 2,201 -4.6% -2.3% -2.3%WW 1,177 1,150 2.4% 2.6% -0.2% 4,450 4,593 -3.1% -2.0% -1.1%
ORAL CAREUS 173 159 8.3% 8.3% - 683 621 9.9% 9.9% - Intl 264 233 13.5% 14.5% -1.0% 958 906 5.7% 9.6% -3.9%WW 437 393 11.4% 12.0% -0.6% 1,641 1,528 7.4% 9.7% -2.3%
BABY CAREUS 97 85 14.3% 14.3% - 376 362 3.7% 3.7% - Intl 310 336 -7.8% -3.6% -4.2% 1,141 1,313 -13.1% -7.3% -5.8%WW 407 421 -3.4% 0.0% -3.4% 1,517 1,675 -9.4% -4.9% -4.5%
WOMEN'S HEALTHUS 3 3 11.8% 11.8% - 13 12 8.2% 8.2% - Intl 234 250 -6.5% -3.1% -3.4% 888 974 -8.8% -2.9% -5.9%WW 237 253 -6.3% -2.9% -3.4% 901 986 -8.6% -2.7% -5.9%
WOUND CARE / OTHERUS 110 98 11.8% 11.8% - 480 441 8.9% 8.9% - Intl 65 57 12.4% 13.0% -0.6% 240 230 4.1% 7.3% -3.2%WW 175 155 12.0% 12.2% -0.2% 720 671 7.2% 8.3% -1.1%
TOTAL CONSUMER HEALTHUS 1,509 1,470 2.7% 2.7% - 6,362 5,839 9.0% 9.0% - Intl 2,109 2,097 0.5% 1.5% -1.0% 7,691 8,059 -4.6% -1.3% -3.3%WW 3,618$ 3,567 1.4% 2.0% -0.6% 14,053$ 13,898 1.1% 3.0% -1.9%
See footnotes at end of schedule
% Change% Change

REPORTED SALES vs. PRIOR PERIOD ($MM) REPORTED SALES vs. PRIOR PERIOD ($MM)FOURTH QUARTER TWELVE MONTHS
PHARMACEUTICAL SEGMENT (2,5) 2020 2019 Reported Operational (1) Currency 2020 2019 Reported Operational (1) Currency
IMMUNOLOGYUS 2,845$ 2,517 13.0% 13.0% - 10,175$ 9,641 5.5% 5.5% - Intl 1,261 1,005 25.4% 21.1% 4.3% 4,880 4,309 13.2% 14.0% -0.8%WW 4,105 3,522 16.6% 15.3% 1.3% 15,055 13,950 7.9% 8.2% -0.3%
REMICADEUS 656 755 -13.1% -13.1% - 2,508 3,079 -18.5% -18.5% - US Exports (6) 25 68 -62.4% -62.4% - 346 294 18.0% 18.0% - Intl 220 212 3.3% 2.7% 0.6% 893 1,007 -11.4% -8.6% -2.8%WW 901 1,035 -12.9% -13.1% 0.2% 3,747 4,380 -14.4% -13.8% -0.6%
SIMPONI / SIMPONI ARIAUS 315 302 4.4% 4.4% - 1,155 1,159 -0.3% -0.3% - Intl 261 213 22.9% 18.8% 4.1% 1,088 1,029 5.8% 7.0% -1.2%WW 576 515 12.1% 10.4% 1.7% 2,243 2,188 2.6% 3.1% -0.5%
STELARAUS 1,572 1,194 31.6% 31.6% - 5,240 4,346 20.6% 20.6% - Intl 672 506 32.7% 27.2% 5.5% 2,467 2,015 22.4% 22.2% 0.2%WW 2,244 1,700 31.9% 30.3% 1.6% 7,707 6,361 21.1% 21.1% 0.0%
TREMFYAUS 276 199 39.1% 39.1% - 926 764 21.3% 21.3% - Intl 105 71 48.1% 40.0% 8.1% 421 248 69.9% 67.9% 2.0%WW 382 270 41.5% 39.3% 2.2% 1,347 1,012 33.2% 32.7% 0.5%
OTHER IMMUNOLOGYUS - - - - - - - - - - Intl 2 2 -19.7% -14.5% -5.2% 11 10 6.4% 12.8% -6.4%WW 2 2 -19.7% -14.5% -5.2% 11 10 6.4% 12.8% -6.4%
INFECTIOUS DISEASESUS 470 435 7.9% 7.9% - 1,735 1,597 8.6% 8.6% - Intl 442 430 2.8% -2.6% 5.4% 1,839 1,815 1.3% 2.2% -0.9%WW 912 866 5.4% 2.7% 2.7% 3,574 3,413 4.7% 5.2% -0.5%
EDURANT / rilpivirineUS 11 14 -17.9% -17.9% - 44 50 -11.2% -11.2% - Intl 236 209 13.4% 6.2% 7.2% 920 812 13.3% 11.9% 1.4%WW 248 222 11.4% 4.7% 6.7% 964 861 11.9% 10.5% 1.4%
PREZISTA / PREZCOBIX / REZOLSTA / SYMTUZAUS 433 390 11.1% 11.1% - 1,587 1,422 11.6% 11.6% - Intl 136 155 -12.4% -17.1% 4.7% 597 689 -13.4% -10.7% -2.7%WW 569 544 4.4% 3.1% 1.3% 2,184 2,110 3.5% 4.4% -0.9%
OTHER INFECTIOUS DISEASESUS 25 32 -20.4% -20.4% - 104 126 -17.6% -17.6% - Intl 71 67 5.2% 3.3% 1.9% 323 315 2.6% 5.6% -3.0%WW 96 99 -3.0% -4.3% 1.3% 427 441 -3.2% -1.0% -2.2%
% Change % Change

REPORTED SALES vs. PRIOR PERIOD ($MM) REPORTED SALES vs. PRIOR PERIOD ($MM)FOURTH QUARTER TWELVE MONTHS
2020 2019 Reported Operational (1) Currency 2020 2019 Reported Operational (1) CurrencyNEUROSCIENCEUS 806 747 7.9% 7.9% - 3,091 2,919 5.9% 5.9% - Intl 892 819 9.0% 6.2% 2.8% 3,457 3,409 1.4% 2.2% -0.8%WW 1,698 1,566 8.5% 7.0% 1.5% 6,548 6,328 3.5% 3.9% -0.4%
CONCERTA / MethylphenidateUS 33 37 -9.7% -9.7% - 183 233 -21.4% -21.4% - Intl 120 115 4.2% 1.4% 2.8% 439 463 -5.1% -4.5% -0.6%WW 153 152 0.9% -1.2% 2.1% 622 696 -10.6% -10.2% -0.4%INVEGA SUSTENNA / XEPLION /INVEGA TRINZA / TREVICTAUS 610 564 8.1% 8.1% - 2,314 2,107 9.8% 9.8% - Intl 355 308 15.7% 10.8% 4.9% 1,339 1,224 9.4% 9.1% 0.3%WW 965 871 10.8% 9.0% 1.8% 3,653 3,330 9.7% 9.6% 0.1%RISPERDAL CONSTAUS 76 77 -2.5% -2.5% - 296 314 -5.9% -5.9% - Intl 92 82 11.0% 7.7% 3.3% 346 374 -7.5% -6.9% -0.6%WW 167 160 4.4% 2.7% 1.7% 642 688 -6.8% -6.4% -0.4%OTHER NEUROSCIENCEUS 88 70 27.4% 27.4% - 298 266 12.4% 12.4% - Intl 326 314 3.7% 3.1% 0.6% 1,334 1,349 -1.1% 0.7% -1.8%WW 414 383 8.0% 7.5% 0.5% 1,632 1,614 1.1% 2.6% -1.5%
ONCOLOGYUS 1,469 1,153 27.4% 27.4% - 5,092 4,299 18.5% 18.5% - Intl 1,965 1,563 25.7% 20.9% 4.8% 7,275 6,393 13.8% 14.0% -0.2%WW 3,434 2,716 26.4% 23.7% 2.7% 12,367 10,692 15.7% 15.8% -0.1%
DARZALEXUS 692 444 55.6% 55.6% - 2,232 1,567 42.4% 42.4% - Intl 561 385 45.4% 41.3% 4.1% 1,958 1,430 36.9% 38.0% -1.1%WW 1,253 830 50.9% 49.0% 1.9% 4,190 2,998 39.8% 40.3% -0.5%ERLEADAUS 176 103 70.8% 70.8% - 583 297 96.1% 96.1% - Intl 64 13 * * * 176 35 * * *WW 241 116 * * * 760 332 * * *IMBRUVICAUS 492 392 25.8% 25.8% - 1,821 1,555 17.1% 17.1% - Intl 625 483 29.3% 24.8% 4.5% 2,307 1,856 24.3% 25.1% -0.8%WW 1,117 875 27.8% 25.3% 2.5% 4,128 3,411 21.0% 21.5% -0.5%VELCADEUS - - - - - - - - - - Intl 97 115 -15.2% -18.5% 3.3% 408 751 -45.7% -45.8% 0.1%WW 97 115 -15.2% -18.5% 3.3% 408 751 -45.7% -45.8% 0.1%ZYTIGA / abiraterone acetateUS 89 194 -54.3% -54.3% - 373 810 -54.0% -54.0% - Intl 533 483 10.2% 4.3% 5.9% 2,097 1,985 5.6% 4.7% 0.9%WW 622 677 -8.3% -12.5% 4.2% 2,470 2,795 -11.6% -12.3% 0.7%OTHER ONCOLOGYUS 20 19 2.6% 2.6% - 83 70 19.2% 19.2% - Intl 86 84 1.5% -2.1% 3.6% 330 336 -1.9% -1.4% -0.5%WW 105 104 1.7% -1.2% 2.9% 413 407 1.7% 2.2% -0.5%
PULMONARY HYPERTENSIONUS 592 388 52.5% 52.5% - 2,133 1,684 26.6% 26.6% - Intl 273 235 16.8% 12.5% 4.3% 1,015 939 8.2% 8.0% 0.2%WW 865 623 39.0% 37.4% 1.6% 3,148 2,623 20.0% 20.0% 0.0%
OPSUMITUS 279 185 52.1% 52.1% - 1,008 766 31.7% 31.7% - Intl 173 143 21.2% 16.9% 4.3% 631 562 12.3% 12.3% 0.0%WW 452 326 38.6% 36.7% 1.9% 1,639 1,327 23.5% 23.5% 0.0%
UPTRAVIUS 263 178 48.2% 48.2% - 955 714 33.8% 33.8% - Intl 38 30 25.5% 20.1% 5.4% 138 105 30.9% 30.5% 0.4%WW 301 208 44.9% 44.1% 0.8% 1,093 819 33.5% 33.4% 0.1%OTHER PULMONARY HYPERTENSIONUS 49 26 84.9% 84.9% - 169 205 -17.6% -17.6% - Intl 63 62 2.4% -1.2% 3.6% 247 272 -9.2% -9.4% 0.2%WW 112 88 26.6% 24.1% 2.5% 416 476 -12.8% -12.9% 0.1%
CARDIOVASCULAR / METABOLISM / OTHERUS 935 930 0.6% 0.6% - 3,509 3,734 -6.0% -6.0% - Intl 317 327 -2.6% -5.4% 2.8% 1,369 1,458 -6.1% -4.8% -1.3%WW 1,253 1,256 -0.2% -1.0% 0.8% 4,878 5,192 -6.0% -5.7% -0.3%
XARELTOUS 629 609 3.1% 3.1% - 2,345 2,313 1.4% 1.4% - Intl - - - - - - - - - - WW 629 609 3.1% 3.1% - 2,345 2,313 1.4% 1.4% - INVOKANA / INVOKAMETUS 159 125 27.7% 27.7% - 564 536 5.2% 5.2% - Intl 58 52 11.5% 8.9% 2.6% 231 199 16.3% 17.6% -1.3%WW 217 177 22.9% 22.1% 0.8% 795 735 8.2% 8.6% -0.4%PROCRIT / EPREXUS 62 118 -46.9% -46.9% - 277 505 -45.1% -45.1% - Intl 66 65 2.0% -1.1% 3.1% 274 285 -3.8% -3.6% -0.2%WW 129 183 -29.5% -30.6% 1.1% 552 790 -30.2% -30.1% -0.1%OTHERUS 85 78 9.4% 9.4% - 323 380 -15.1% -15.1% - Intl 194 209 -7.6% -10.3% 2.7% 864 974 -11.3% -9.7% -1.6%WW 278 286 -3.0% -5.0% 2.0% 1,186 1,353 -12.4% -11.2% -1.2%
TOTAL PHARMACEUTICALUS 7,116 6,169 15.3% 15.3% - 25,735 23,874 7.8% 7.8% - Intl 5,152 4,379 17.7% 13.5% 4.2% 19,837 18,324 8.3% 8.8% -0.5%WW 12,268$ 10,548 16.3% 14.6% 1.7% 45,572$ 42,198 8.0% 8.2% -0.2%
See footnotes at end of schedule
% Change % Change

REPORTED SALES vs. PRIOR PERIOD ($MM) REPORTED SALES vs. PRIOR PERIOD ($MM)FOURTH QUARTER TWELVE MONTHS
MEDICAL DEVICES SEGMENT (2,5) 2020 2019 Reported Operational (1) Currency 2020 2019 Reported Operational (1) Currency
INTERVENTIONAL SOLUTIONSUS 433$ 377 14.8% 14.8% - 1,452 1,443 0.6% 0.6% - Intl 460 398 15.7% 10.8% 4.9% 1,594 1,554 2.6% 2.0% 0.6%WW 893 774 15.3% 12.8% 2.5% 3,046 2,997 1.6% 1.3% 0.3%ORTHOPAEDICS
US 1,352 1,369 -1.3% -1.3% - 4,779 5,319 -10.2% -10.2% - Intl 839 904 -7.3% -11.3% 4.0% 2,984 3,520 -15.2% -15.4% 0.2%WW 2,191 2,273 -3.7% -5.3% 1.6% 7,763 8,839 -12.2% -12.3% 0.1%
HIPSUS 229 230 -0.7% -0.7% - 793 863 -8.2% -8.2% - Intl 143 147 -2.2% -5.8% 3.6% 487 575 -15.3% -15.1% -0.2%WW 372 377 -1.3% -2.7% 1.4% 1,280 1,438 -11.0% -11.0% 0.0%KNEESUS 216 239 -9.5% -9.5% - 743 889 -16.4% -16.4% - Intl 129 156 -17.2% -20.6% 3.4% 427 591 -27.8% -28.0% 0.2%WW 345 395 -12.5% -13.9% 1.4% 1,170 1,480 -21.0% -21.1% 0.1%TRAUMAUS 454 413 10.0% 10.0% - 1,648 1,652 -0.2% -0.2% - Intl 268 273 -2.0% -6.2% 4.2% 966 1,068 -9.6% -9.7% 0.1%WW 722 686 5.2% 3.6% 1.6% 2,614 2,720 -3.9% -3.9% 0.0%SPINE, SPORTS & OTHER(7)
US 453 488 -7.1% -7.1% - 1,595 1,915 -16.7% -16.7% - Intl 299 329 -9.2% -13.6% 4.4% 1,104 1,286 -14.1% -14.6% 0.5%WW 752 817 -7.9% -9.7% 1.8% 2,699 3,201 -15.7% -15.9% 0.2%
SURGERYUS 1,002 961 4.3% 4.3% - 3,249 3,828 -15.1% -15.1% - Intl 1,427 1,481 -3.7% -5.9% 2.2% 4,983 5,673 -12.2% -11.2% -1.0%WW 2,429 2,442 -0.5% -1.9% 1.4% 8,232 9,501 -13.4% -12.8% -0.6%
ADVANCEDUS 456 428 6.5% 6.5% - 1,535 1,637 -6.2% -6.2% - Intl 660 647 2.1% -0.9% 3.0% 2,304 2,458 -6.2% -5.6% -0.6%WW 1,116 1,076 3.8% 2.0% 1.8% 3,839 4,095 -6.2% -5.8% -0.4%GENERALUS 546 534 2.5% 2.5% - 1,714 2,192 -21.8% -21.8% - Intl 767 834 -8.1% -9.8% 1.7% 2,679 3,215 -16.7% -15.5% -1.2%WW 1,312 1,366 -4.0% -5.0% 1.0% 4,392 5,406 -18.8% -18.0% -0.8%
VISIONUS 397 428 -7.3% -7.3% - 1,557 1,794 -13.2% -13.2% - Intl 679 713 -4.7% -6.2% 1.5% 2,362 2,830 -16.5% -16.2% -0.3%WW 1,076 1,141 -5.7% -6.6% 0.9% 3,919 4,624 -15.2% -15.1% -0.1%
CONTACT LENSES / OTHERUS 289 311 -7.4% -7.4% - 1,213 1,304 -7.0% -7.0% - Intl 507 522 -2.7% -4.1% 1.4% 1,781 2,088 -14.7% -14.4% -0.3%WW 796 833 -4.4% -5.3% 0.9% 2,994 3,392 -11.7% -11.5% -0.2%SURGICALUS 108 117 -7.1% -7.1% - 344 490 -29.7% -29.7% - Intl 172 191 -10.3% -12.0% 1.7% 581 742 -21.7% -21.5% -0.2%WW 280 309 -9.1% -10.1% 1.0% 925 1,232 -24.9% -24.7% -0.2%
TOTAL MEDICAL DEVICESUS 3,184 3,135 1.5% 1.5% - 11,036 12,384 -10.9% -10.9% - Intl 3,405 3,497 -2.6% -5.5% 2.9% 11,923 13,579 -12.2% -11.8% -0.4%WW 6,589$ 6,632 -0.7% -2.2% 1.5% 22,959$ 25,963 -11.6% -11.4% -0.2%
* Percentage greater than 100% or not meaningful (6) Reported as U.S. sales(1) Operational growth excludes the effect of translational currency (7) Previously referred to as Spine & Other(2) Unaudited(3) Previously referred to as Consumer(4) Previously referred to as Beauty(5) Certain prior year amounts have been reclassified to conform to current year product disclosures
Note: Columns and rows within tables may not add due to rounding. Percentages have been calculated using actual, non-rounded figures and, therefore, may not recalculate precisely.
% Change % Change