Embed Size (px)
Citation preview
JOHNS HOPKINS HOSPITAL NEW CLINICAL BUILDING
Baltimore, Maryland
Dan Weiger Architectural Engineering, 5th Year Construction Management Option Final Report Advisor: Dr. John I. Messner April 7, 2009

Project Team‐ Owner: Johns Hopkins Hospital
General InformationGeneral Information
p p‐ Architect: Perkins + Will‐ Structural Engineer: Thornton‐Tomasseti‐MEP Engineer: Bard, Rao + Athanas‐ GC: Clark/Banks, A Joint Venture
Cost‐ GMP of $573 Million
Schedule‐ Oct. 2006 to Dec. 2010
Delivery Method‐ Design‐Bid‐Build
Location‐ Baltimore, MD
Overview ‐ Total size = 1.5 million sq. ft.Two connected towers @ 15 stories each
ArchitectureArchitectureSystem‐ Offsite Central Plant provides chilled water
MechanicalMechanical
‐ Two connected towers @ 15 stories each‐ 355 Adult beds‐ 205 Pediatric beds‐ 33 Operating rooms‐ 42 Radiological suites‐ 96 Emergency treatment Areas
Façade‐ 57% Aluminum Unitized Curtain Wall‐ 43% Precast concrete panels with brick
and high pressure steam‐ Variable Air Volume System‐ Reheat coils in VAV at every room
AHU/Location‐Main Mechanical Room on Levels 6 and 7‐ 19 AHUs: 11,000 ‐133,000 cfm‐ 50⁰F cooled air provided at all time
Unique FeaturesM di l O t d i li id b lk43% Precast concrete panels with brick
veneerRoof‐ 70% single‐ply membrane/30% green roof
Foundation System‐ 275 caissons
StructureStructure
‐Medical O2 gas stored in liquid bulk‐ 30.6% of the total construction cost
Feeder Service‐ 2‐15kV, 3 phase feeders
ElectricalElectrical
‐ 3’‐10’ dia. @ 30’‐50’ deep Framing System‐ Braced frame structural steel‐ 12,500 tons‐ 28’‐8” typical bay size
Floor System‐ CIP composite floor decks‐ 5 ½” – 11” normal weight reinforced concrete for levels B3 8
‐ Located on level 1 of each towerDistribution‐ Stepped down to 460V, 3 phase on Levels 6 and 7
‐ Total of 8 transformers‐ 2 electrical rooms per floor in each tower that step power down to 120/208/240/277V, 3 phase
concrete for levels B3‐8‐ 4 ¼” – 6 ¼” light weight reinforced concrete for levels 9‐roof
Redundancy‐ Emergency generators @ Central Plant‐ UPS provides immediate power backup
Dan Weiger – Construction Managementhttp://www.engr.psu.edu/ae/thesis/portfolios/2009/pdw5000/

Weiger – Final Report 2 | P a g e
Table of Contents
1.0 Acknowledgements………………………………………………………………………………………………………………………..4
2.0 Executive Summary………………………………………………………………………………………………………………………..5
3.0 Project Information & Background………………………………………………………………………………………………….6
3.1 Client Information……………………………………………………………………………………………………………….6 3.2 Delivery Method………………………………………………………………………………………………………………….8 3.3 Project Phasing………………………………………………………………………………………………………………….10 3.4 Schedule Summary…………………………………………………………………………………………………………….11 3.5 Cost Breakdown………………………………………………………………………………………………………………...17 3.6 Building Systems Summary………………………………………………………………………………………………..18 3.7 Site Plan of Existing Conditions…………………………………………………………………………………………..22 3.8 Staffing Plan………………………………………………………………………………………………………………………25 3.9 Local Conditions………………………………………………………………………………………………………………...27 3.10 Constructability Challenges………………………………………………………………………………………………28
4.0 Research Introduction…………………………………………………………………………………………………………………..32
5.0 Analysis 1: Alternative Project Delivery Method (MAE Requirement)……………………………………………..33
5.1 Background……………………………………………………………………………………………………………………….33 5.2 Problem Statement…………………………………………………………………………………………………………….33 5.3 Goal…………………………………………………………………………………………………………………………………..33 5.4 Resources………………………………………………………………………………………………………………………….33 5.5 Analysis…………………………………………………………………………………………………………………………….34 5.6 Conclusion…………………………………………………………………………………………………………………………44
6.0 Analysis 2: Chilled Beams Cost & Schedule Impact (Mechanical Breadth)………………………………………..45
6.1 Background……………………………………………………………………………………………………………………….45 6.2 Problem Statement…………………………………………………………………………………………………………….45 6.3 Goal…………………………………………………………………………………………………………………………………..45 6.4 Resources………………………………………………………………………………………………………………………….45 6.5 Analysis…………………………………………………………………………………………………………………………….46 6.6 Conclusion………………………………………………………………………………………………………………………...78
7.0 Analysis 3: Case Study ‐ Concrete Over‐pour on Decks Due to Steel Deflection (Structural Breadth)...80
7.1 Background……………………………………………………………………………………………………………………….80 7.2 Problem Statement…………………………………………………………………………………………………………….80 7.3 Goal…………………………………………………………………………………………………………………………………..80 7.4 Resources………………………………………………………………………………………………………………………….81 7.5 Analysis……………………………………………………………………………………………………………………………..81 7.6 Conclusion…………………………………………………………………………………………………………………………90

Weiger – Final Report 3 | P a g e
8.0 Research Conclusion ……………………………………………………………………………………………………………………92
Appendix A – Hygiene Chilled Beam Product Data Sheets…………………………………………………………………….93

Weiger – Final Report 4 | P a g e
1.0 Acknowledgements
I would like to extend my appreciation and gratitude towards those who contributed and supported me through my Sr. Thesis.
Clark Construction Group United Sheet Metal Mike Hartman Mike Topper Joe Salerno Marty McMahon Pierce Associates, Inc. Jim Salvino Dan Donaghy Jim Kinkead Katie Tworney SmithGroup Robin Givens Dave Varner John Bond Brian Flegel BR+A Lynore Arkin‐Yetter Mark Octeau Steve Dare Penn State University Thornton Tomasetti Dr. Michael Horman Zach Kates Dr. John Messner Dr. David Riley Turner Construction Dr. Moses Ling Jim Faust Dr. Linda Hanagan
KLMK Group, LLC Curtin Skolnick
JHH Facility Management Group Howard Reel Bob Singer Poole & Kent Donald Campbell
M.C. Dean Bill Knot
TROX USA Ken Loudermilk Chris Lawrence DADANCO Bill Rafferty

Weiger – Final Report 5 | P a g e
2.0 Executive Summary
The theme of the research conducted in this thesis is to explore alternatives and procedures that could have been implemented to avoid or reduce the impact of the changes and constructability challenges on the New Clinical Building.
Three technical issues relevant to the construction management aspects of this project are researched to determine if they can add value to the project by reducing the schedule and cost, while improving the constructability. The following three analyses were conducted.
Analysis 1: Alternative Project Delivery Method (MAE Requirement)
The current design‐bid‐build with early procurement project delivery method has resulted in 60 Construction Change Directives, 2,700 Request for Information, and 700 change orders to date. This has resulted in a cost escalation of approximately $250 million and an extension of 7 months to the original schedule. An alternative delivery method is researched to find a method that can more efficiently manage the changes while meeting the Owner’s project goals. The recommended delivery system is a traditional delivery method with early procurement, a project manager, integrated project delivery principles, and design‐build MEP contractors. This method would have reduced the risk of changes and managed the rest more efficiently.
Analysis 2: Chilled Beams Cost & Schedule Impact (Mechanical Breadth)
The mechanical system has suffered the most from the design changes. The result is a 7 month delay that will cost the Owner several million dollars. A new HVAC technology ‐ chilled beams is analyzed to determine the impact on cost and time. The findings are that it would have saved $3,207,684 initially and an additional $13.4 M ‐ $31.3 M over a 30 year life‐cycle. It would also allow JHH to generate an additional income of $18,125,537 per year. The system would also save an average of 31 working days on a typical floor. This would take the mechanical overhead off the critical path of the project schedule. This system would be able to absorb many of the changes and delays encountered thus far on the NCB project.
Analysis 3: Case Study Concrete Overpour on Decks Due to Steel Deflection (Structural Breadth)
One of the major constructability challenges on this project was the concrete over‐pour on metal decks from the steel deflection. This is a common problem on many projects. This analysis looks at what happened on the NCB and suggest ways to avoid the problem on future projects in each phase of the project delivery. The analysis found there was 1,200 CY of extra concrete poured that amounted to $100,000 of exposure to the concrete contractor. Further projects can avoid this problem by working with the structural engineer to determine the expected deflections. An allowance should be carried by the contractor to avoid the financial risk associated with this problem.

Weiger – Final Report 6 | P a g e
3.0 Project Information & Background
3.1 Client Information
Owner Overview Johns Hopkins Medicine is the parent name that unites The Johns Hopkins University School of Medicine and The Johns Hopkins Hospital to make up the broad Johns Hopkins Health System. The $4.1 billion organization was founded in Baltimore, MD in 1876.
The Johns Hopkins School of Medicine is consistently ranked one of the top two medical schools in the country. The Johns Hopkins Hospital has been ranked the #1 hospital in the United States since 1992 by U.S. News & World Report.
Below is a summary profile of the organization according to statistics in 2007.
Figure 1: Johns Hopkins Pocket Guide, 2007
Building Objective The current campus dates back to 1889 with outdated buildings that are regarded as pre‐WWII. The hospital’s physical plant is 50% older than the average hospital in the U.S. In research, Johns Hopkins Hospital (JHH) generates 62% more revenue per sq. ft. than comparable facilities which is a sign of overcrowding not efficiency. Fixing these outdated facilities has begun a 10 year campus redevelopment plan that will modernize the facilities.
Weiger – Final Report 7 | P a g e
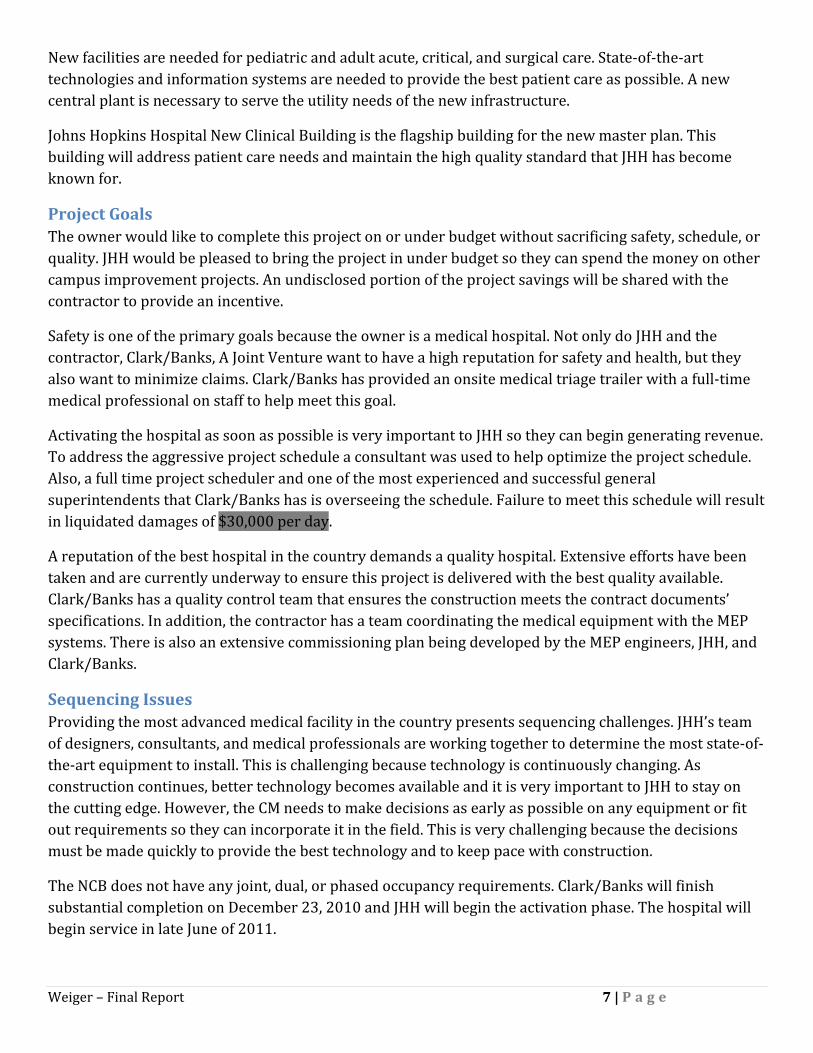
New facilities are needed for pediatric and adult acute, critical, and surgical care. State‐of‐the‐art technologies and information systems are needed to provide the best patient care as possible. A new central plant is necessary to serve the utility needs of the new infrastructure.
Johns Hopkins Hospital New Clinical Building is the flagship building for the new master plan. This building will address patient care needs and maintain the high quality standard that JHH has become known for.
Project Goals The owner would like to complete this project on or under budget without sacrificing safety, schedule, or quality. JHH would be pleased to bring the project in under budget so they can spend the money on other campus improvement projects. An undisclosed portion of the project savings will be shared with the contractor to provide an incentive.
Safety is one of the primary goals because the owner is a medical hospital. Not only do JHH and the contractor, Clark/Banks, A Joint Venture want to have a high reputation for safety and health, but they also want to minimize claims. Clark/Banks has provided an onsite medical triage trailer with a full‐time medical professional on staff to help meet this goal.
Activating the hospital as soon as possible is very important to JHH so they can begin generating revenue. To address the aggressive project schedule a consultant was used to help optimize the project schedule. Also, a full time project scheduler and one of the most experienced and successful general superintendents that Clark/Banks has is overseeing the schedule. Failure to meet this schedule will result in liquidated damages of $30,000 per day.
A reputation of the best hospital in the country demands a quality hospital. Extensive efforts have been taken and are currently underway to ensure this project is delivered with the best quality available. Clark/Banks has a quality control team that ensures the construction meets the contract documents’ specifications. In addition, the contractor has a team coordinating the medical equipment with the MEP systems. There is also an extensive commissioning plan being developed by the MEP engineers, JHH, and Clark/Banks.
Sequencing Issues Providing the most advanced medical facility in the country presents sequencing challenges. JHH’s team of designers, consultants, and medical professionals are working together to determine the most state‐of‐the‐art equipment to install. This is challenging because technology is continuously changing. As construction continues, better technology becomes available and it is very important to JHH to stay on the cutting edge. However, the CM needs to make decisions as early as possible on any equipment or fit out requirements so they can incorporate it in the field. This is very challenging because the decisions must be made quickly to provide the best technology and to keep pace with construction.
The NCB does not have any joint, dual, or phased occupancy requirements. Clark/Banks will finish substantial completion on December 23, 2010 and JHH will begin the activation phase. The hospital will begin service in late June of 2011.

Weiger – Final Report 8 | P a g e
Keys to a Successful Project Highest quality of construction in order to provide the best care available is the key to completing a successful project. The entire project team must be committed to this idea and must all work towards this common goal.
In order for Clark/Banks to be successful on this project they need to do several things:
1. Maintain the schedule and adapt quickly to design changes and donor enhancements 2. Work closely with the design team so they can complete construction documents as soon as
possible 3. Minimize ongoing changes to reduce repeat work 4. Need to get paid fairly and promptly for changes
a. Subcontractors cannot fund large portions of work; they need to get paid for completed change orders in a timely manner to maintain cash flow
5. Maintain a safe work environment 6. Work closely with local labor unions and associations to provide adequate labor supply 7. Provide superior construction quality by managing and documenting work closely 8. Maintain building enclosure schedule
a. Delays in enclosing the building will delay the MEP work, finishes, controls, and commissioning which would push the schedule
b. Cost impacts for added temporary heating 9. Coordinate with city inspection officials to efficiently work through the inspection process 10. Timely and complete coordination of MEP systems and medical equipment to avoid impacting the
MEP schedule
3.2 Delivery Method
Delivery Method The project delivery method is design‐bid‐build with a fast‐track schedule. Originally it was structured as a CM‐at‐Risk with preconstruction and construction services, however the first contractor was terminated early in Phase I. Clark/Banks, A Joint Venture was brought in as a general contractor to complete the construction services for Phase I and II.
Control over the design was the primary reason for selecting this delivery method. The original contractor was used in the preconstruction phase to provide constructability analysis, cost estimates, value engineering, and scheduling. JHH felt that using this method had less risk because there is one party responsible for construction, a check‐and‐balance system, and less chance of cost growth.
Contractor Selection Process The first contractor was procured by a competitive bidding process. Clark/Banks was procured by a negotiated GMP. The selection was based on experience, cost, capabilities, and staff.
Clark/Banks procured all of the subcontractors through a competitive bid. Selection was determined by cost, experience with Clark/Banks, JHH and healthcare projects. Input from JHH was considered as well.

Weiger – Final Report 9 | P a g e
Project Team Organization Chart Below is an organization chart for the project team. Solid lines indicate direct contractual agreements and dashed lines show direct communication. The design team and the owner’s consultants did not wish to disclose their contracting method.
GMP
GMP
LS
LS
LS
LS
LS
LS
LS
LS
Figure 2: Project Team Organization Chart

Weiger – Final Report 10 | P a g e
Contractual Agreements The general contractor holds a guarantee maximum price (GMP) contract with the owner. If the cost comes in over the GMP, the contractor is liable for all costs. Any savings will be shared between the contractor and the owner.
A minority participation of 15% is required for this project. There are no wage scale or Buy America requirements. The GMP does include a contingency and weather day allowances.
The joint venture contract between Clark Construction Group, LLC and Banks Contracting Company, LLC requires each party to provide staffing comparable to their stake in the project. Clark/Banks would not disclose the stake each party holds.
All subcontractors with the exception of one hold a lump sum contract with the GC. The mechanical contractor holds a GMP contract. This was done because the mechanical design was not complete when the contractor was procured.
Bond and Insurance Requirements Clark/Banks requires all subcontractors with a contract over $100,000 to provide a payment and performance bond. JHH does not require the general contractor to carry a bond.
Every subcontractor (and their subcontractors) must be enrolled in the Contractor Controlled Insurance Program (CCIP) if they provide onsite labor. The advantage to a CCIP is that Clark/Banks can purchase coverage at a more competitive rate than individual subcontractors. This is due to the size of Clark/Banks which allows them to purchase better coverage and higher limits of insurance than individual subcontractors for less cost.
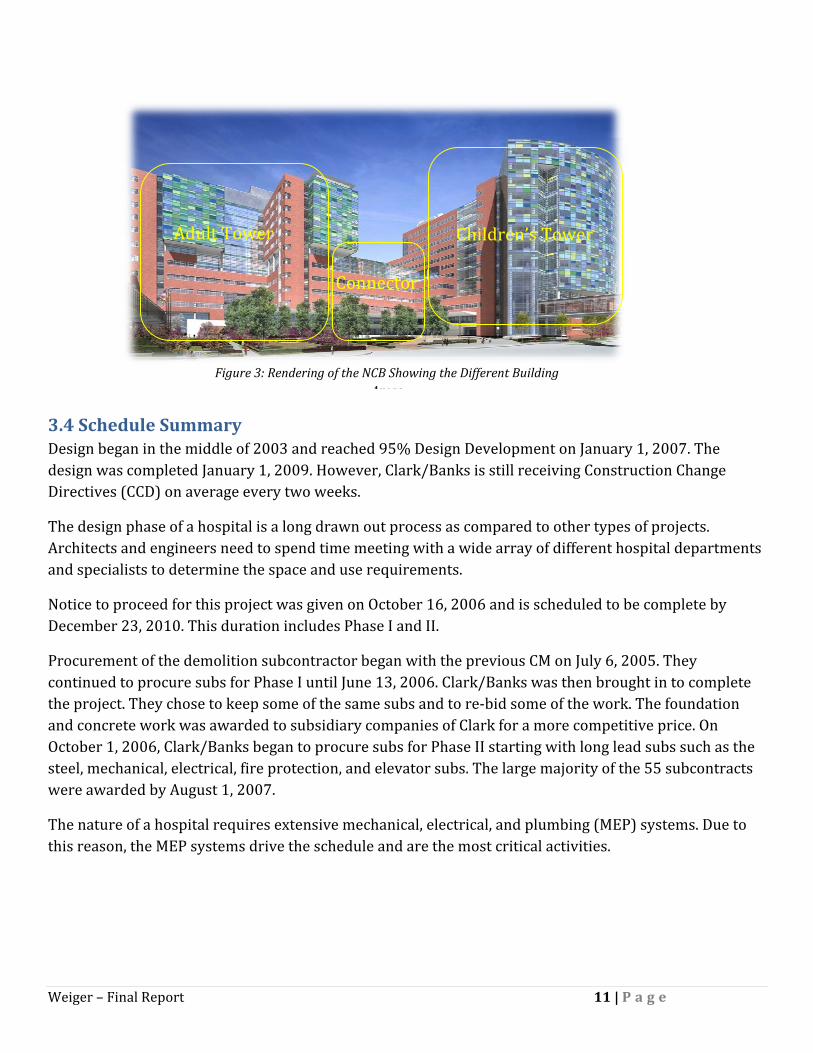
3.3 Project Phasing The project is divided into 2 phases. Phase I includes the demolition of existing structures, excavation, foundation, site utilities, and all work for B3, B2, and B1 basement levels. Phase II includes all work to complete the project from level 1 to the roof as well as site landscaping.
By design, the project is divided into two distinct towers – the Children’s Hospital, referred to as the Children’s Tower (CT) and the Cardiovascular and Critical Care Hospital, referred to as the Adult Tower (AT). The Adult Tower includes all work west of the expansion joint, N/P line. This includes the high‐rise structure of the Cardiovascular and Critical Care Hospital and the “Connector” which houses the emergency care unit. The Connector is defined as the 8 story structure that connects the CT and AT between J and N line. The Children’s Tower includes all work east of N/P line. This includes the high‐rise structure of the Children’s Hospital.
Weiger – Final Report 11 | P a g e
3.4 Schedule Summary Design began in the middle of 2003 and reached 95% Design Development on January 1, 2007. The design was completed January 1, 2009. However, Clark/Banks is still receiving Construction Change Directives (CCD) on average every two weeks.
The design phase of a hospital is a long drawn out process as compared to other types of projects. Architects and engineers need to spend time meeting with a wide array of different hospital departments and specialists to determine the space and use requirements.
Notice to proceed for this project was given on October 16, 2006 and is scheduled to be complete by December 23, 2010. This duration includes Phase I and II.
Procurement of the demolition subcontractor began with the previous CM on July 6, 2005. They continued to procure subs for Phase I until June 13, 2006. Clark/Banks was then brought in to complete the project. They chose to keep some of the same subs and to re‐bid some of the work. The foundation and concrete work was awarded to subsidiary companies of Clark for a more competitive price. On October 1, 2006, Clark/Banks began to procure subs for Phase II starting with long lead subs such as the steel, mechanical, electrical, fire protection, and elevator subs. The large majority of the 55 subcontracts were awarded by August 1, 2007.
The nature of a hospital requires extensive mechanical, electrical, and plumbing (MEP) systems. Due to this reason, the MEP systems drive the schedule and are the most critical activities.
Connector
Adult Tower Children’s Tower
Figure 3: Rendering of the NCB Showing the Different Building Areas

Weiger – Final Report 12 | P a g e
The following are key milestone dates that are of interest:
• Notice to Proceed – October 16, 2006 • CT Phase I Substantial Completion – August 9, 2007 • AT Phase I Substantial Completion – December 28, 2007 • CT Toping Out of Concrete – September 10, 2008 • AT Toping Out of Concrete – December 31, 2008 • CT Water Tight – May 8, 2009 • AT Water Tight – September 30, 2009 • CT Phase II Substantial Completion – September 17, 2010 • AT Phase II Substantial Completion – December 23, 2010 • Hospital Activation – June 21, 2011
The Children’s Tower is scheduled to be complete about 3 months before the Adult Tower. This was done to spread resources across the entire duration of the project. If both towers would have started at the same time it could have caused a shortage in the labor and material’s market in the area. By staggering the completion of each tower, it also spreads out the punch‐list items. On a project of this magnitude, a large punch‐list would be expected which if not managed properly could put a large strain on the A/E and CM staff.
On the following page is the project summary schedule. The schedule is broken down into the two construction zones and phases.
Note that this schedule may not be the most current schedule as design changes and donor enhancements have continuously changed it.

ID Task Name Duration Start Finish
1 JHH New Clinical Building 2102 days Jun 2 '03 Jun 21 '11
2 Design 1459 days Jun 2 '03 Jan 1 '093 Procurement 541 days Jul 6 '05 Aug 1 '074 Childrens Tower 1024 days Oct 16 '06 Sep 17 '10
5 Phase I 214 days Oct 16 '06 Aug 9 '076 Notice To Proceed 0 days Oct 16 '06 Oct 16 '067 Caissons 96 days Nov 13 '06 Mar 26 '078 Structural Steel 24 days May 18 '07 Jun 20 '079 Slab on Grade 19 days Jul 11 '07 Aug 6 '07
10 Phase I Substantial Completion 0 days Aug 9 '07 Aug 9 '0711 Phase II 809 days Aug 13 '07 Sep 17 '1012 Structural Steel 185 days Aug 13 '07 Apr 25 '0813 MEP 585 days Aug 13 '07 Nov 6 '0914 Metal Decking 185 days Aug 27 '07 May 9 '0815 Finishes 638 days Oct 30 '07 Apr 8 '1016 Concrete Decking 165 days Jan 24 '08 Sep 10 '0817 Top Out Concrete 0 days Sep 10 '08 Sep 10 '0818 Precast Panels 107 days May 30 '08 Oct 27 '0819 Curtain Wall 180 days May 30 '08 Feb 5 '0920 Commissioning 478 days Jul 23 '08 May 21 '1021 Elevators 400 days Sep 19 '08 Apr 1 '1022 Roofing 66 days Feb 6 '09 May 8 '0923 Water Tight 0 days May 8 '09 May 8 '0924 Phase II Substantial Completion 0 days Sep 17 '10 Sep 17 '1025 Adult Tower 1093 days Oct 16 '06 Dec 23 '10
26 Phase I 314 days Oct 16 '06 Dec 28 '0727 Notice To Proceed 0 days Oct 16 '06 Oct 16 '0628 Demolition of Jefferson Bldg 99 days Nov 9 '06 Mar 27 '0729 Caissons 89 days Feb 23 '07 Jun 27 '0730 Structural Steel 35 days Sep 12 '07 Oct 30 '0731 Slab on Grade 9 days Oct 31 '07 Nov 12 '0732 Phase I Substantial Completion 0 days Dec 28 '07 Dec 28 '0733 Phase II 811 days Nov 14 '07 Dec 23 '1034 Structural Steel 205 days Nov 14 '07 Aug 26 '0835 Metal Decking 210 days Dec 4 '07 Sep 22 '0836 MEP 698 days Dec 24 '07 Aug 25 '1037 Finishes 628 days Apr 16 '08 Sep 10 '1038 Concrete Decking 165 days May 15 '08 Dec 31 '0839 Top Out Concrete 0 days Dec 31 '08 Dec 31 '0840 Precast Panels 121 days Oct 3 '08 Mar 20 '0941 Commissioning 461 days Dec 23 '08 Sep 28 '1042 Curtain Wall 170 days Jan 12 '09 Sep 4 '0943 Elevators 400 days Apr 2 '09 Oct 13 '1044 Roofing 127 days Apr 7 '09 Sep 30 '0945 Water Tight 0 days Sep 30 '09 Sep 30 '0946 Phase II Substantial Completion 0 days Dec 23 '10 Dec 23 '1047 Hospital Activation 127 days Dec 27 '10 Jun 21 '11
48 Hospital Activation - Phase II 127 days Dec 27 '10 Jun 21 '11
10/16
8/9
9/10
5/89/17
10/16
12/28
12/31
9/3012/23
H1 H2 H1 H2 H1 H2 H1 H2 H1 H2 H1 H2 H1 H2 H1 H2 H12003 2004 2005 2006 2007 2008 2009 2010 2011
Task
Progress
Milestone
Summary
Rolled Up Task
Rolled Up Milestone
Rolled Up Progress
Split
External Tasks
Project Summary
Group By Summary
Deadline
Page 1
Project: JHH NEW CLINICAL BUILDING
Weiger – Final Report 14 | P a g e
Building the Schedule Joe Salerno, Vice President of Field Operations for Clark/Banks began developing the preliminary schedule while he was finishing his previous project at the McCormick Place Convention Center in Chicago, IL (+$1 Billion). As a +25 year veteran at Clark and previously as a manager of a large drywall contractor in New York City, Joe has had extensive experience developing schedules for projects of this size. Once he got the drawings for the NCB he roughed out a schedule of how he thought the building should be built. He then flew to Baltimore several times to meet with the key subcontractors to get their input on the sequence and duration of the activities. When he finally arrived on‐site at the beginning of the project he met with all the subcontractors to go over the schedule and get final input. After massaging the schedule to meet everyone’s needs, he then had every subcontractor “buy” into it.
This method of developing a schedule not only takes into account the expertise of the subcontractors but also makes every team member feel as if it’s their schedule, not the GC’s. Mr. Salerno claims that this method fosters team work amongst the trades and also puts more pressure on the subs to meet the schedule because they have a stake in it.
“Joe’s schedule” is the basis of how the job is built in the field. A blown up version hangs in the field trailer and is used daily for field coordination, scheduling, and planning. In order to meet the needs of the owner a more detailed schedule was developed with the help of a schedule consultant. This schedule was based on Joe’s schedule but goes into more detail planning with +20,000 activities.
Matrix Schedule The project is designed as two high‐rise structures. On average each floor is essentially the same with a few exceptions. This type of building lends itself nicely to using a matrix type schedule. Joe’s schedule is nothing more than a matrix that lists the sequence of activities, start dates, finish dates, and floors. The following page illustrates the matrix schedule being used on this project for the Children’s Tower (Figure 4) and the Adult Tower (Figure 5).
A matrix schedule is very effective at communicating a lot of information in a simple manner. If you look at each activity you can easily see when you should start work on each floor. Joe claims that the most important thing about running a project’s schedule is to make sure that each trade is starting work on time. If a trade starts work on time for each floor they will be forced to keep schedule so that they can start on time for the next floor. This means that the trades will have to provide the necessary resources to keep pace. Therefore, if the trade can meet the start date of the following floor and not impact the start date of the follow‐on trade, then inherently the job will stay on schedule.

Weiger – Final Report 15 | P a g e
Figure 4: Children’s Tower Matrix Schedule
Figure 5: Adult Tower Matrix Schedule

Weiger – Final Report 16 | P a g e
4D BIM Model A 4D model was initially developed as an effort to win the project. The 4D model helped the client visualize how Clark/Banks planned to build the NCB. Once the project was awarded to them they used Joe’s schedule to develop a final 4D model. This model was used as a final check of the project schedule. It also helped the team plan the sequencing of the steel and site logistics.
Below are snapshots from the 4D model that illustrate how the superstructure is built. Figure 6 shows the progress of construction as of August 2007. Figure 7 shows the progress of construction as of March 2008 with the steel/flatwork up to level 8 in the CT and level 4 of the AT. Also notice how the construction of the AT lags the CT. Figure 8 illustrates the progress of construction as of October 2008 with the steel/flatwork topped out in the CT and nearly topped out in the AT. A slight discrepancy in the 4D model is the construction of the pedestrian bridges for the AT and the CT. These structures will not be erected until middle of 2009.
Figure 7: Construction Progress as of March 2008Figure 6: Construction Progress as of August 2007
Figure 8: Construction Progress as of October 2008

Weiger – Final Report 17 | P a g e
3.5 Cost Breakdown
Construction Cost Clark/Banks is contracted to deliver the construction at a guarantee maximum price of $573 million. The cost includes the completion of Phase 1 and the construction of Phase 2. This cost does not include any change orders due to design changes and donor enhancements.
The construction square foot cost for this project is approximately $382/ sq. ft.
Total Project Cost Johns Hopkins Hospital will invest $950 million to complete the New Clinical Building. This cost includes design, construction, equipment, and fit‐out of the hospital. JHH already owned the land for this project so this is not included in the cost.
The total project square foot cost is approximately $633/ sq. ft.
This cost does not include recent donor enhancements which add approximately $250 million.
Building Systems Cost Below is a summary of the major building systems cost. Note that the MEP packages account for approximately 44.4% of the construction cost. This is not uncommon for a hospital project given the complexity of the MEP systems.
Trade Approximate Cost (Millions) S.F. Cost ($/SF)
% of Construction Cost
Mechanical/Plumbing $167 111.33 29.1 Electrical $78.7 52.47 13.7 Fire Protection $8.5 5.67 1.5 Steel $29.4 19.60 5.1 Concrete $18.6 12.40 3.2 Curtain Wall $28.1 18.73 4.9 Precast $9.2 6.13 1.6 Framing/Drywall $35.5 23.67 6.2 Elevator $18.7 12.47 3.3
D4Cost Estimate A D4Cost estimate was performed for this project by comparing the cost of similar hospital projects across the country. Projects were selected from the D4Cost database based on scope of work, materials, new type construction, and size. The software then analyzed the cost information from the database projects and created a “smart average” amongst all the projects. A time and location multiplier was used to correct for date of construction and location of project.
Table 1: Building Systems Approximate Cost

Weiger – Final Report 18 | P a g e
Below is a summary of the D4Cost Estimate. Notice that the total construction cost is 1.5% lower than the actual construction cost.
3.6 Building Systems Summary
Demolition All demolition of existing structures on site was performed by the previous contractor during Phase I. No information is available for this thesis.
Support of Excavation Most of the support of excavation was performed by the previous contractor during Phase I. No information is available for this thesis.
Table 2: D4Cost Estimate Summary of Construction Costs

Weiger – Final Report 19 | P a g e
Foundation System Design
• 275 caissons support the building o Diameter: 3’‐10’ o Depth: 30’‐50’ o 3,000 psi reinforced concrete
• Cast‐in‐place concrete foundation walls • Strip footing around the perimeter of building • Grade beams at high load areas – vehicle ramps, high axial load from columns, etc.
Structural Steel Design
• 12,500 tons of structural steel • 28’‐8” typical bay size • 16’ floor‐floor height from levels B3 – 8 • 14’ floor‐floor height from levels 9‐Roof • Braced frame shear system • Minimum moment connections – mainly used on cantilever structure • 18’‐4”W x 143’‐4”L radial cantilever from levels 4‐Roof • W16x26 typical beam • 2 large plate girders on level 3 of the Ambulance Bay area in the Children’s Tower
o 1 – 40’ long x 78” deep I‐Shape, 1 7/8” x 34” flange, 1 1/4” thick web o 1 – 57’‐4” long x 72” deep I‐Shape, 2 1/2” x 44” flange, 1” thick web
Construction
• 2 – Comansa Model 21LC550 tower cranes o 39,670 lbs maximum lift capacity o 1 tower crane located in the north‐center of the Children’s Tower o 1 tower crane located in the center of the Adult Tower
• 250 ton Kobelco luffer crane o Used to erect areas that cannot be reached by the tower cranes or for critical picks o Mainly used on the south elevation of the Adult Tower
• 150 ton Link‐Belt crawler crane o Used to erect areas that cannot be reached by the tower cranes and/or to work
simultaneously with other cranes o Mainly used on the east elevation of the Children’s Tower

Weiger – Final Report 20 | P a g e
CastinPlace Concrete Design
• Cast‐in‐place composite floor decks • 5 1/2” – 11” normal weight reinforced concrete slabs from levels B3 – 8 • 4 1/4” – 6 1/4” light weight reinforced concrete slabs from levels 9‐Roof
Construction
• No formwork was required • Primary method of placing was with a pump truck
o A slick line was used for areas that could not be reached by the pump truck • Secondary method of placing was with a buggy
o Used for smaller pours where it was not feasible to bring in a pump truck
Precast Concrete Design
• 1,350 large pieces weighting up to 32,000 lbs. • 6” thick precast concrete panels with brick veneer • 43% of building exterior = 201,000 sq. ft. • Panels are manufactured in Toronto, Canada • Bricks are manufactured in Germany • Design by subcontractor ‐ Artex
Construction
• Erection is by the steel erector o Uses the same cranes as the steel erection (see Structural Steel Frame – Construction
above) • Bolted connections • Panels are delivered by truck just in time for erection
Masonry There is no masonry on this project.
Curtain Wall Design
• Aluminum unitized curtain wall system • Various color glazing with random pattern • 57% of building exterior = 275,000 sq. ft. • Detail design by subcontractor ‐ Harmon Inc.

Weiger – Final Report 21 | P a g e
Construction
• Connection is by halfin anchors embedded in the concrete slabs • Erected by a 150 ton mobile hydraulic crane • Delivered in large preassembled sections just in time for erection
Mechanical System Air Conditioning System
• Offsite central plant supplies chilled water and high pressure steam o 24” Chilled water supply and return o 8” High pressure steam supply and return o Supply located on level B3 in the south‐west corner of the Adult Tower
• Main mechanical room locations are levels 6 and 7 • 19 Air Handling Units (AHU)
o CFM: 11,000 – 133,000 o Provides 55⁰F cooled air at all times o Located on levels B1, 6, and 7
• Variable Air Volume (VAV) system with VAVs in every room o VAV heats supplied air from AHU to temperature controlled by thermostat in room o Hot water supply heats air through reheat coil
• Rectangular and round ductwork distribute conditioned air throughout building
Hot Water System
• High pressure steam is used for heating hot water o Shell and tube heat exchangers on the 6th floor conditions water
• High pressure steam is also used for humidifying air and sterilizing hospital equipment
Domestic Water
• 2 – 8” domestic water supplies o Main supply at north‐east corner of the Children’s Tower on level B1 o Redundant supply at south‐west corner of the Adult Tower on level B1
Medical Gases
• Oxygen gas is stored offsite in liquid bulk • Medical air and vacuum are produced on level 6 in the mechanical room • Very sophisticated control and alarm system

Weiger – Final Report 22 | P a g e
Electrical System Power
• 2 – 15kV, 3 phase feeders o 15kV, 3 phase feeder located on level 1 of each tower
• Primary electrical rooms on levels 6 and 7 • 15kV power is distributed to levels 6 and 7 to step down voltage
o 3 transformers on level 6 in each tower o 2 transformers on level 7 in each tower o Transformers step down power to 460V, 3 phase
• 460V, 3 phase power is distributed to electrical rooms on each floor o 2 electrical rooms per floor in each tower o Power is stepped down to 120/208/240/277V, 3 phase
• 120/208/240/277V, 3 phase power is distributed about the floor to various electrical closets • Distribution is by copper or aluminum wire and bus ducts.
Redundancy
• Emergency generators are located at offsite central plant • Double ended switchboards are used to tie transformers together to provide redundancy • Uninterrupted Power Systems (UPS) are used to provide immediate power in the case of a power
outage o Batteries are used to store power o Provides power for a short amount of time until emergency generators can provide power
Fire Protection Design
• Primarily a wet sprinkler system • Pre‐action sprinkler system in electrical rooms • Fire pumps are located on level B2
3.7 Site Plan of Existing Conditions
Site Plan Overview The NCB is located in downtown Baltimore, Maryland along Rt. 40 (Orleans St.). Rt. 40 is a 4 lane street that runs through downtown Baltimore and connects to the beltway (I‐695) on the east and west side. The main construction entrance is located off this road. The access road has a horseshoe design that provides efficient flow of traffic. The left east‐bound lane of Rt. 40 is used as a staging lane for deliveries. All material deliveries are expected to access the jobsite by way of Rt. 40.
The project is surrounded on the north by the existing Johns Hopkins Hospital. During construction this hospital will remain fully functional. The hospital has a very active helipad on the roof at an elevation of

Weiger – Final Report 23 | P a g e
245 ft. OSHA regulations require that the tower cranes (or the highest part of the building) have marking lights so that the helicopter pilots can avoid any safety hazards. The helicopter flight patterns have been changed to land from the east or the west. The hospital also has an emergency care unit located just to the north‐east side of the site. North Wolfe Street is a one‐way street traveling south which forces the ambulances to come from the north. Fortunately this will not disrupt the jobsite significantly.
A large number of the JHH’s staff park in the parking garage just south of the site. An overhead pedestrian bridge connects the parking garage to the south side of the site. The sidewalks are closed around the entire site to avoid any safety hazards. Pedestrians traveling across the bridge must turn west which avoids the site. The existing site conditions show that 3 buildings are to be demolished in Phase I. There are no existing utilities shown on the site plan. It is assumed that all new utilities will be installed under Phase I work. The new utilities include storm waste, sanitary, domestic water, and chilled water loop. High pressure steam, chilled water, and electricity will travel through the underground tunnel to the Adult Tower from the central plant located to the south of the site.
Existing Conditions Site Plan On the following page is an existing conditions site plan. The drawing shows the proposed building site, utilities, temporary structures, vehicle traffic patterns, and neighboring buildings.

Orleans St. (Rt. 40)Orleans St. (Rt. 40)
Clark/BanksField Office
Mech. Sub Field Office
Elec. Sub Field Office
N. W
olfe
St.
N. W
ashi
ngto
n St
.
N. B
road
way
Jefferson St.
Jefferson St.
McElderry St.Emergency Care Unit
Medevac Heliport
El. 245 ft.
Phipps BuildingEl. 175 ft.
Nelson Harvey BuildingEl. 215 ft.
MRI BuildingEl. 112 ft.
Billings BuildingEl. 205 ft.
Maumenee BuildingEl. 184 ft.
Wilmer BuildingEl. 160 ft.
Woods BuildingEl. 160 ft.
Weinberg BuildingEl. 175 ft.
Parking GarageEl. 135 ft.
Proposed Children’s Tower
El. 320 ft.
Proposed ConnectorEl. 220 ft.
Proposed Adult Tower
El. 320 ft.
Maryland Laundry Building
(To Be Demolished)
Broadway Garage(To Be Demolished)
Jefferson St.(To Be Demolished)
Jefferson Building(To Be Demolished)
Proposed Pedestrian Bridge
Existing Pedestrian Bridge
Proposed Pedestrian Bridge
Existing Underground
Tunnel
Construction Access Road
Domestic Water
Proposed Chilled Water Campus Loop
Date: 9.29.08
Prepared by: Dan Weiger
C1.01
EXISTING CONDITIONS
SITE PLAN
Date: Revision
0 30 60 90 120
SCALE IN FEET
N
LEGEND
Temporary Power Shed
Traffic Signal
Pedestrian Walk
Fire Hydrant
Hospital
Proposed Storm Water Manhole
Proposed Storm Water Inlet
Proposed Storm Water Line
Proposed Sanitary Line
Proposed Chilled Water Line
Proposed Domestic Water
Construction Limits
Management Staff Parking Only

Weiger – Final Report 25 | P a g e
3.8 Staffing Plan
Staff Structure A functional organization structure is used for this project. Individuals have clear roles and special assigned tasks that have been prepared by the management staff. Individuals report to their superiors with set lines of communication.
The project’s executive management staff consists of Clark Construction’s President of the Mega Projects Division and the President of Banks Contracting. The Project Director reports directly to those individuals on a weekly basis.
Under the management of the Project Director, the staff is broken into 7 departments. The departments include Project Administration, Engineering Design/Coordination, MEP, Field Supervision, Quality Control, Safety, and Field Office Management.
Project Administration deals with cost control, document control, purchasing, and scheduling. The Engineering Design/Coordination department controls all the coordination, material tracking, and documentation for the project with the exception of MEP. The MEP staff coordinates, tracks, and documents all work related to the MEP systems. Construction in the field is managed by the Field Supervision department. The Quality Control staff ensures that all of the installed work meets the specifications of the contract documents. The insurance, jobsite safety training, and onsite safety staff are controlled by the Safety department. Finally the Field Office Management department supports all of the previous departments as well as oversees day to day project administration.
Staff Organization Chart On the following page the staff organization chart shows the functional structure of the general contractor. The lines indicate communication and the hierarchal relationship of the team.

Project Officer
Project Director
Clark Construction
Executive Management
Banks ContractingPresident
Project Administration
Project Executive
Field Office Manager
Engineering/Design
CoordinationProject Executive
Safety Manager Quality Control Manager
Field SupervisionVice President
MEP Project Executive
Cost Control/Design Control
Manager
Project Engineer
Project Engineer
Schedule Manager
Assistant Scheduler
Document Control Manager
Project Engineer
Purchasing Manager
Project Engineer
Community Relations Manager
Administrative Assitant
Executive Assistant
Receptionist
Sr. Project Manager
Civil/Structural/Enclosure
Sr. Project Manager
Children’s Tower
Sr. Project Manager
Adult Tower
Structural Coordinator
Civil/Structural Coordinator
BIM Modeler
Project ManagerChildren’s Tower
Project EngineerChildren’s Tower
Project ManagerAdult Tower
Project Engineer
Safety Inspector Assistant QC Manager
Sr. Superintendent
Children’s Tower
SuperintendentChildren’s Tower
Assistant Superintendent
Children’s Tower
Assistant Superintendent
Children’s Tower
Sr. Superintendent
Adult Tower
Superintendent Adult Tower
Assistant Superintendent
Adult Tower
Site Administrative
Assistant
Skin Superintendent
Assistant Superintendent
Adult Tower
Site Superintendent
Sr. Project Manager
MEP
Electrical Coordinator
Project Engineer
Mechanical Coordinator
Project Engineer
Medical Equipment
Coordinator
Weiger – Final Report 27 | P a g e
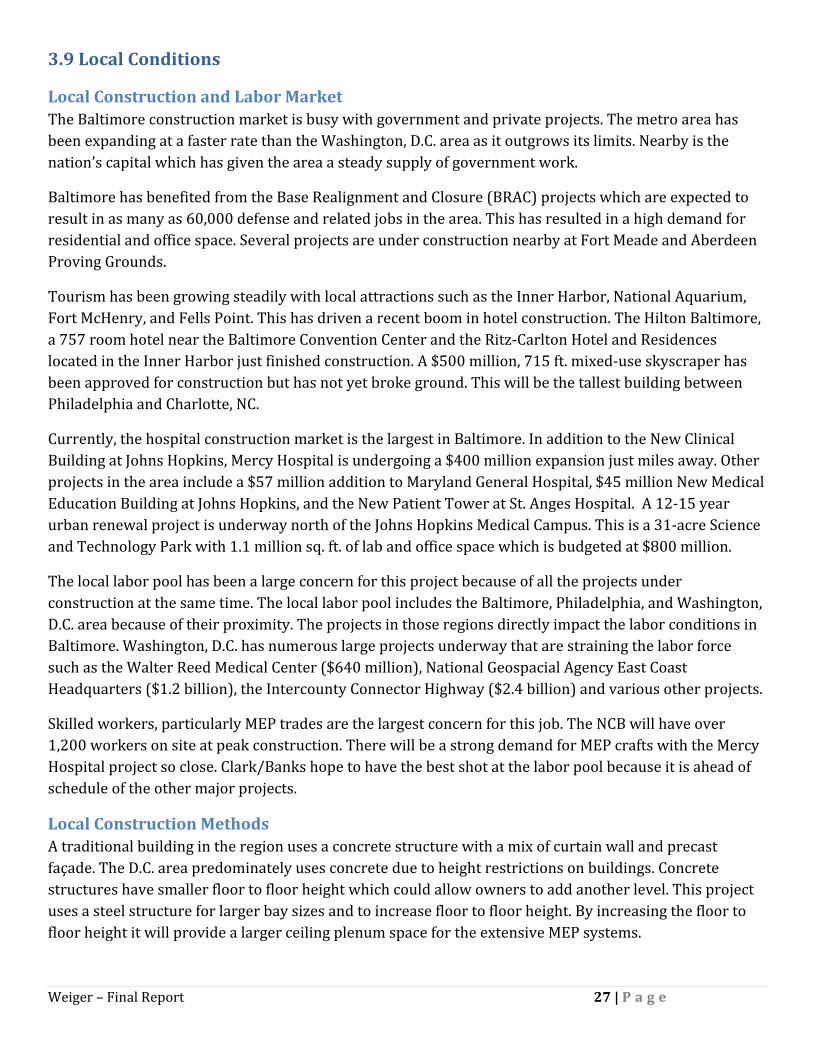
3.9 Local Conditions
Local Construction and Labor Market The Baltimore construction market is busy with government and private projects. The metro area has been expanding at a faster rate than the Washington, D.C. area as it outgrows its limits. Nearby is the nation’s capital which has given the area a steady supply of government work.
Baltimore has benefited from the Base Realignment and Closure (BRAC) projects which are expected to result in as many as 60,000 defense and related jobs in the area. This has resulted in a high demand for residential and office space. Several projects are under construction nearby at Fort Meade and Aberdeen Proving Grounds.
Tourism has been growing steadily with local attractions such as the Inner Harbor, National Aquarium, Fort McHenry, and Fells Point. This has driven a recent boom in hotel construction. The Hilton Baltimore, a 757 room hotel near the Baltimore Convention Center and the Ritz‐Carlton Hotel and Residences located in the Inner Harbor just finished construction. A $500 million, 715 ft. mixed‐use skyscraper has been approved for construction but has not yet broke ground. This will be the tallest building between Philadelphia and Charlotte, NC.
Currently, the hospital construction market is the largest in Baltimore. In addition to the New Clinical Building at Johns Hopkins, Mercy Hospital is undergoing a $400 million expansion just miles away. Other projects in the area include a $57 million addition to Maryland General Hospital, $45 million New Medical Education Building at Johns Hopkins, and the New Patient Tower at St. Anges Hospital. A 12‐15 year urban renewal project is underway north of the Johns Hopkins Medical Campus. This is a 31‐acre Science and Technology Park with 1.1 million sq. ft. of lab and office space which is budgeted at $800 million.
The local labor pool has been a large concern for this project because of all the projects under construction at the same time. The local labor pool includes the Baltimore, Philadelphia, and Washington, D.C. area because of their proximity. The projects in those regions directly impact the labor conditions in Baltimore. Washington, D.C. has numerous large projects underway that are straining the labor force such as the Walter Reed Medical Center ($640 million), National Geospacial Agency East Coast Headquarters ($1.2 billion), the Intercounty Connector Highway ($2.4 billion) and various other projects.
Skilled workers, particularly MEP trades are the largest concern for this job. The NCB will have over 1,200 workers on site at peak construction. There will be a strong demand for MEP crafts with the Mercy Hospital project so close. Clark/Banks hope to have the best shot at the labor pool because it is ahead of schedule of the other major projects.
Local Construction Methods A traditional building in the region uses a concrete structure with a mix of curtain wall and precast façade. The D.C. area predominately uses concrete due to height restrictions on buildings. Concrete structures have smaller floor to floor height which could allow owners to add another level. This project uses a steel structure for larger bay sizes and to increase floor to floor height. By increasing the floor to floor height it will provide a larger ceiling plenum space for the extensive MEP systems.

Weiger – Final Report 28 | P a g e
A CM‐at‐Risk is the primary delivery method in the area. A negotiated GMP contract is usually used to provide a best value approach.
Project Resources The NCB is located in downtown Baltimore with buildings and roads surrounding the perimeter. There is no room onsite for parking or jobsite trailers. All construction workers must find parking on nearby streets or parking garages.
Adjacent to the project is a city block that is being used as a jobsite trailer complex. Clark/Banks’ Project Management and Field Management trailers as well as all of the subcontractors’ trailers are located there.
Recycling is being used for office paper waste from the jobsite trailers. Metal construction waste is being separated onsite for recycling purposes. There are no contractual requirements (such as LEED) to recycle building materials.
All construction waste is being removed by onsite dumpsters that are pulled daily. Currently there are about 10 dumpster pulls a week. At peak construction this number is expected to grow to 20 pulls per week. Each pull costs on average $450.
Soil and Subsurface Water Conditions Soil boring logs indicated that the soil was a combination of sand and clay with little rock. Clark/Banks did not encounter any rock during excavation and no blasting was required. However, the soil was not generally suitable for backfill. RC6, a combination of recycled crushed concrete, imported soil, and #57 stone was used for backfill.
Building near the harbor raised concerns about hitting water during excavation. However, Clark/Banks did not expect to hit water because the building site sits on a small hill (EL. +100ft.) north of the harbor. No dewatering was required for this project.
3.10 Constructability Challenges
Project Changes and Enhancements By far the biggest challenge on this project is the amount of changes and enhancements that JHH has issued. Currently, the numbers of Construction Change Directives (CCDs) are approaching 60 and there are over 2,700 RFI’s, and the project is not even 1/3 complete. All of the changes and donor enhancements to date will add approximately $250 million to the original contract. The number of changes and enhancements are expected to continue to grow throughout the project.
As discussed in the Client Information section, JHH is rated as one of the best hospitals in the world which means they must maintain a very high reputation. Therefore, they must incorporate the latest and greatest medical equipment and technology in the building to meet this standard. This has been challenging because the medical equipment must be selected to finalize the design, especially the MEP design. However, JHH wants to wait to the very last moment to select the equipment so they can have the latest technology available. As such, the owner and A/E have been issuing CCDs and change orders to address the impact of the design due to the new equipment selection.

Weiger – Final Report 29 | P a g e
The structural steel boom supports in the ceiling of each operating room (see Figure 9 below for an example) are currently on hold because the owner cannot decide which type of boom they would like to use. This may seem like a small problem but one cannot simply use a conservative estimate of the weight to design the support because the booms’ articulating arms can create significant moments that vary depending on which boom you use. By keeping this equipment on hold, the medical gas supply cannot be run to the boom finish plate. As a result, the medical gas supply is terminated near the boom support until a decision is made. This holds up the extensive testing procedures that must be done on the medical gas distribution and also prevents the closing of the ceilings, delaying inspection, wall finishes, floor finishes, etc. There are also many different operating rooms that will perform various procedures which mean they will have different booms. Thus, the steel supports are different for each type of boom which makes coordinating all of the overhead MEP systems very challenging.
Another contributing factor is a large number of financial donations to the hospital to enhance the medical facility. As the building is being built, it has attracted a lot of attention and many individuals have contributed to the project. Most of the enhancements are architecturally oriented such as an upgraded lobby, lighting system and a high‐end precast façade.
The quality of construction documents has also contributed to the number changes. The designers have had difficulty coordinating their design with all of the consultants and engineers that are working on this project in such a short time. An example would be the location of a sink shown on the architectural plan that does not correspond to the location of the water supply and drain shown on the plumbing drawings. This is a common problem seen on nearly all construction projects, but the sheer number of conflicts and discrepancies are much higher than similar projects.
The affects of all the changes are difficult to manage and quantify. Currently, there are 700 change orders that have been processed and an average of 1 CCD every 2 weeks is being issued. The schedule impact has not been fully realized yet. Clark/Banks has decided to break the changes into 3 packages so they can better manage them. The 1st package will include all changes and enhancements up to CCD 38, the 2nd package will include CCDs 39‐48, and the 3rd package will include the remaining CCDs. Each package will be negotiated with the owner and A/E to finalize a cost and schedule impact.
Figure 9: Example of a Typical Operating Room Boom

Weiger – Final Report 30 | P a g e
Material Site Logistics A big concern for this project in the beginning was how to feed the job materials. The superstructure and building enclosure phase of the project are very congested and present many site logistic challenges. Also, the size and type of the building create some unique site logistic challenges.
With two tower cranes and two mobile cranes located on the relatively small site, planning the delivery and handling of materials around picks were crucial from a productivity and safety standpoint. The only construction access road to the project is located on the south‐side which runs right in front of both loading docks for the material hoists. Therefore, when a delivery truck is unloading they must block the access road. Not only does this cut off access onto and off the site, but restricts the flow of traffic on‐site by material handling vehicles. To help mitigate this issue Clark/Banks initiated detail planning and scheduling of deliveries. Every delivery was scheduled days in advance through the site superintendent. The site superintendent then scheduled these deliveries around critical crane picks, shakeouts, and concrete pours. Figure 10 depicts how congested the site is on a typical day.
Once the materials were brought and unloaded on‐site, the challenge was to distribute them to their necessary location. The materials needed to go two directions, vertical and horizontal. As already mentioned, a material hoist was installed on the AT and the CT to move the material vertically. The challenge was to find a location on the façade that had access to every floor and did not impact the schedule because the skin would have to be left off. The locations selected seem to have worked well except for the fact their location disrupts the site as mentioned above.
When the material is distributed to its respective floor it still must be taken to a location on that floor. This is a challenge that the project team continues to deal with because of the size of the building’s footprint. Before the wall studs went up, the materials could easily be transported with dollies. After the walls were framed, it created a maze through the floor which made it difficult to transport the material. For this reason, only the corridors and MEP rooms were framed first. The remaining walls were held off
Figure 10: Typical Site Congestion

Weiger – Final Report 31 | P a g e
until the last moment at which point the trades would have to transport the materials through the corridors. Today, most trades have several crews that are solely responsible for transporting and storing materials. This is an extremely inefficient and expensive method.
Another challenge that is unique to hospital projects is loading the hospital equipment into the building. There are hundreds of pieces of equipment that must be loaded into the building before it is closed up because of their size. For example, the hospital will have many MRI machines that will need to be hoisted in the building. MRI machines can weigh up to 50,000 lbs. and require significant planning with a structural engineer to determine how to load them into the building because only certain areas of the structure are designed to handle that kind of load. Clark/Banks is currently in the planning stages of determining how the equipment will be loaded into the building. Since JHH has not made many of the equipment decisions, Clark/Banks is struggling to make an accurate plan which could become a critical issue as the building skin continues to go up.
Elevated Concrete Deck Overpour Due to Deflection A constructability challenge that I experienced first‐hand while working on this project during my summer internship was the over‐pour of concrete on the elevated decks due to the steel deflecting. According to industry professionals this is a common construction problem when decks are not shored during pours as was the case on this project. When pouring concrete, the concrete actually acts as a live load to the structure and by code the deflection is limited to the span divided by 360, which is equal to 1” on this project.
The construction manager and structural engineer did not realize there was significant over‐pour on the decks until the concrete subcontractor was pouring the upper levels of the CT which included the cantilever on the south‐side. As the load from the concrete was placed on the cantilever it caused it to deflect. The concrete sub did not know that the steel was deflecting significantly because they were pouring to top of floor elevation, not thickness. However, as the steel subcontractor was erecting the steel on the cantilever on the floors above, they began to realize that the members were not lining up because the cantilever was sagging. Immediately this caused concern for the entire project team because the cantilever hung over Orleans Street. A survey was conducted by Clark/Banks and determined that the deflection was approaching 2” in some areas. The structural engineer ran the calculations with the extra concrete load and determined that the structure was within the factor of safety.
In order to address this issue, the remaining concrete pours would have to be poured to thickness plus or minus ¾” by wet sticking the concrete. This was challenging because the concrete specifications require the floor flatness to be 1/4” per 10’. Fortunately the floor flatness requirement was met because the structural engineer allowed the ¾” thickness variation to level the floors. If this had not been allowed, the floor flatness would have had to be corrected because you would have easily seen the floors were not flat when the VCT or the Terrazzo was installed.
Weiger – Final Report 32 | P a g e
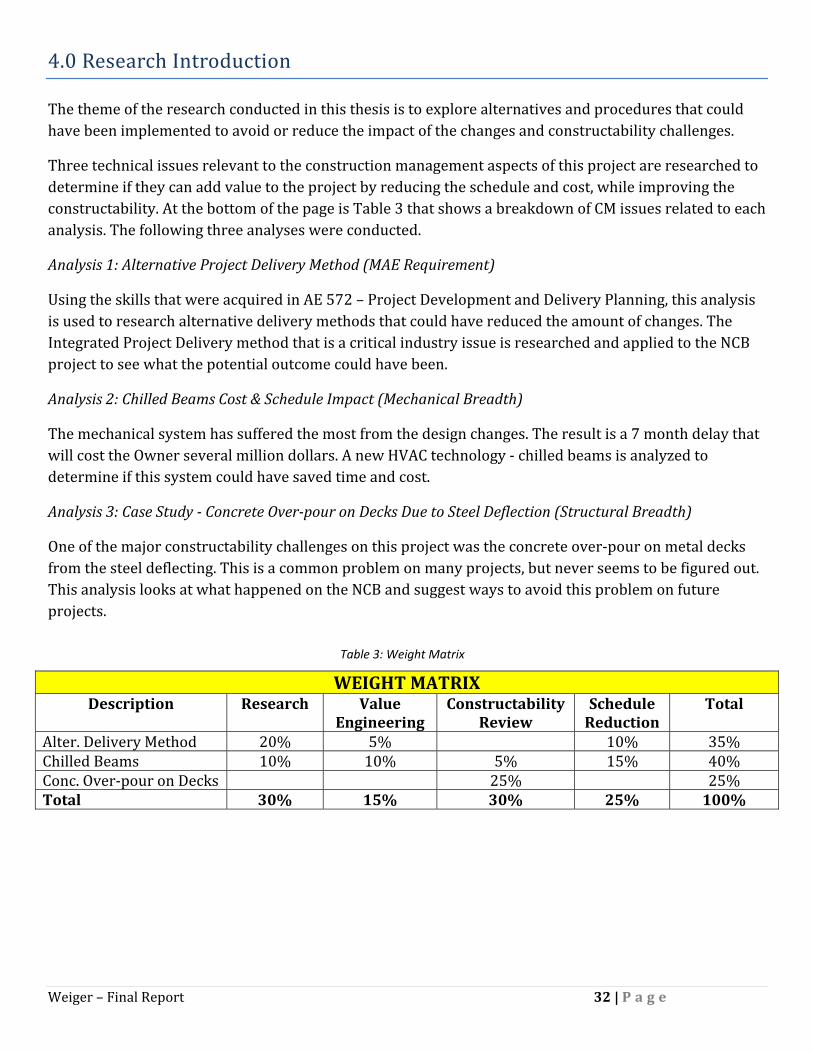
4.0 Research Introduction
The theme of the research conducted in this thesis is to explore alternatives and procedures that could have been implemented to avoid or reduce the impact of the changes and constructability challenges.
Three technical issues relevant to the construction management aspects of this project are researched to determine if they can add value to the project by reducing the schedule and cost, while improving the constructability. At the bottom of the page is Table 3 that shows a breakdown of CM issues related to each analysis. The following three analyses were conducted.
Analysis 1: Alternative Project Delivery Method (MAE Requirement)
Using the skills that were acquired in AE 572 – Project Development and Delivery Planning, this analysis is used to research alternative delivery methods that could have reduced the amount of changes. The Integrated Project Delivery method that is a critical industry issue is researched and applied to the NCB project to see what the potential outcome could have been.
Analysis 2: Chilled Beams Cost & Schedule Impact (Mechanical Breadth)
The mechanical system has suffered the most from the design changes. The result is a 7 month delay that will cost the Owner several million dollars. A new HVAC technology ‐ chilled beams is analyzed to determine if this system could have saved time and cost.
Analysis 3: Case Study Concrete Overpour on Decks Due to Steel Deflection (Structural Breadth)
One of the major constructability challenges on this project was the concrete over‐pour on metal decks from the steel deflecting. This is a common problem on many projects, but never seems to be figured out. This analysis looks at what happened on the NCB and suggest ways to avoid this problem on future projects.
WEIGHT MATRIX Description Research Value
Engineering Constructability
Review Schedule Reduction
Total
Alter. Delivery Method 20% 5% 10% 35% Chilled Beams 10% 10% 5% 15% 40% Conc. Over‐pour on Decks 25% 25% Total 30% 15% 30% 25% 100%
Table 3: Weight Matrix

Weiger – Final Report 33 | P a g e
5.0 Analysis 1: Alternative Project Delivery Method (MAE Requirement)
5.1 Background An owner who is beginning a construction project must make one of the most important decisions of the entire project in the very beginning – what method the project is going to be designed and constructed by. This overall strategy includes delivery, procurement, and contracting methods which is broadly referred to as project delivery.
The decision has become more difficult in recent years as new hybrid delivery methods are being explored and more research is being conducted on traditional methods. In the past, the primary delivery method has been design‐bid‐build with a lump sum contract. Several newer methods, known as “alternative delivery methods” have gained popularity as proponents claim these methods improve the traditional method in terms of cost, time, project control and disputes.
5.2 Problem Statement The current design‐bid‐build with early procurement project delivery method has resulted in 60 Construction Change Directives, 2,700 Request for Information, and 700 change orders to date. This has resulted in a cost escalation of approximately $250 million and an extension of 7 months to the original schedule. The change orders largely encompass 3 major areas: design omissions/errors, donor enhancements, and the incorporation of the latest and greatest medical equipment and technology in the design. When Clark/Banks was bidding the project they were pricing the job off of GMP documents. These design documents were supposed to be sufficient to provide accurate pricing with reasonable allowances for detail items. The final construction documents were supposed to be delivered in April of 2007. However, the final construction set did not arrive until January 2009. This has also contributed to the change orders and delays.
5.3 Goal Demonstrate that an alternative delivery method could have more effectively managed the changes while meeting the Owner’s goals.
5.4 Resources Penn State University – Dr. Michael Horman Penn State University – Dr. John Messner KLMK Group, LLC – Curtin Skolnick JHH Facility Management Group – Howard Reel JHH Facility Management Group – Bob Singer Clark Construction – Mike Hartman Clark Construction – John Bond Clark Construction – Brian Flegel

Weiger – Final Report 34 | P a g e
Poole & Kent – Donald Campbell M.C. Dean – Bill Knot
5.5 Analysis
Project Delivery and Contract Strategies Selection Tool This analysis will use a software program developed by the Construction Industry Institute (CII) to determine which project delivery methods would work best. The top three delivery methods that prove to have the most potential will be analyzed in detail by superimposing them on the NCB project. Finally, a delivery method will be recommended as the best way the project should have been delivered. The recommended delivery method will be compared to the current method to determine what the advantages and disadvantages are.
The CII developed the Project Delivery and Contract Strategies (PDCS) selection tool as a ways to quantitatively select a delivery method. The PDCS has 12 potential delivery method outcomes. Below is a list of the 12 possible delivery method outcomes with an explanation of each as explained by the CII.
1. Traditional Design‐Bid‐Build: Serial sequence of design and construction phases; procurement begins with construction; Owner contracts separately with designer and constructor.
2. Traditional with Early Procurement: Serial sequence of design and construction phases; procurement begins during design; Owner contracts separately with design, constructor, and supplier.
3. Traditional with Project Manager: Serial sequence of design and construction phases; procurement begins with construction; Owner contracts separately with designer and constructor; PM (Agent) assists Owner in managing project.
4. Traditional with Construction Manager: Serial sequence of design and construction phases; procurement begins with construction; Owner contracts separately with designer and constructor; CM (Agent) assists Owner in managing project.
5. Traditional with Early Procurement and CM: Serial sequence of design and construction phases; procurement begins during design; Owner contracts separately with designer and constructor; CM Agent assists Owner in managing project.
6. CM at Risk: Overlapped sequence of design and construction phases; procurement begins during design; Owner contracts separately with designer and CM @ RISK (constructor).
7. Design‐Build or EPC: Overlapped sequence of design and construction phases; procurement begins during design; Owner contracts with Design‐Build (or EPC) contractor.
8. Multiple Design‐Build or EPC: Overlapped sequence of design and construction phases; procurement begins during design; Owner contracts with two Design‐Build (or EPC) contractors, one for process and one for facilities.
9. Parallel Primes: Overlapped sequence of design and construction phases; procurement begins during design; Owner coordinates separate contracts with designer and multiple constructors (or D‐B contractor(s)).
10. Traditional with Staged Development: Multi‐stage, serial sequence of design and construction phases; separate contracts for each stage; procurement begins with construction; Project Manager (Agent) assists Owner with project management.
Weiger – Final Report 35 | P a g e
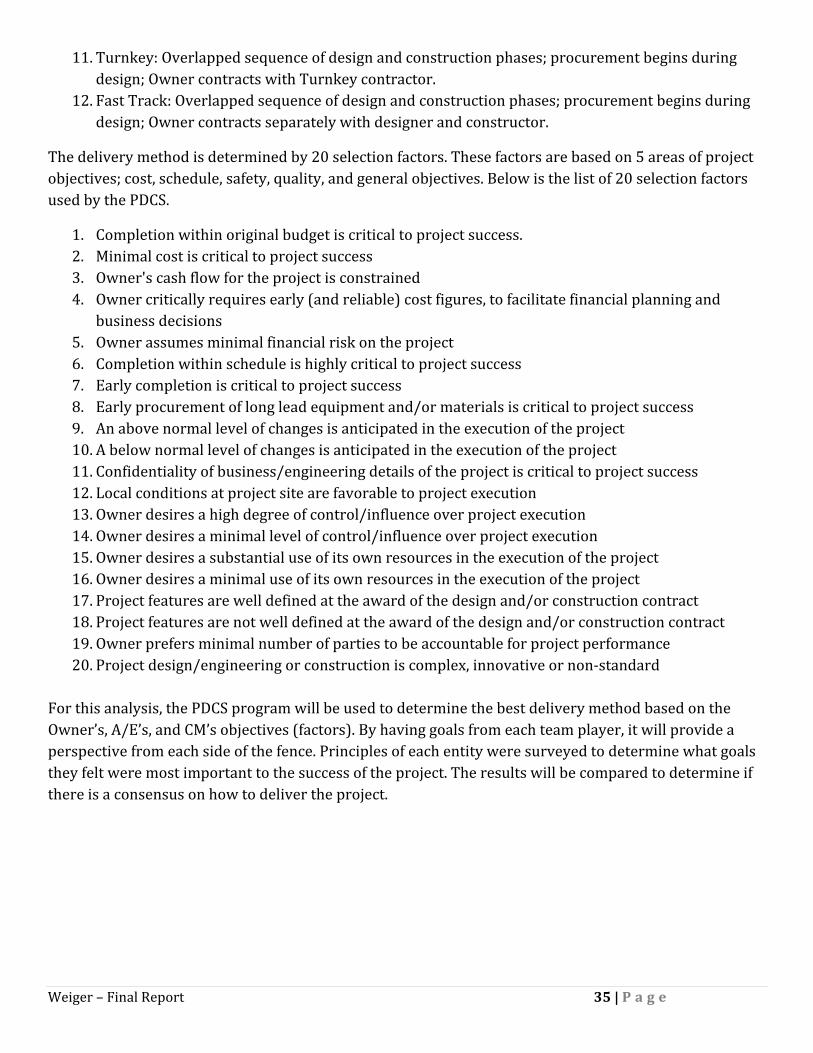
11. Turnkey: Overlapped sequence of design and construction phases; procurement begins during design; Owner contracts with Turnkey contractor.
12. Fast Track: Overlapped sequence of design and construction phases; procurement begins during design; Owner contracts separately with designer and constructor.
The delivery method is determined by 20 selection factors. These factors are based on 5 areas of project objectives; cost, schedule, safety, quality, and general objectives. Below is the list of 20 selection factors used by the PDCS.
1. Completion within original budget is critical to project success. 2. Minimal cost is critical to project success 3. Owner's cash flow for the project is constrained 4. Owner critically requires early (and reliable) cost figures, to facilitate financial planning and
business decisions 5. Owner assumes minimal financial risk on the project 6. Completion within schedule is highly critical to project success 7. Early completion is critical to project success 8. Early procurement of long lead equipment and/or materials is critical to project success 9. An above normal level of changes is anticipated in the execution of the project 10. A below normal level of changes is anticipated in the execution of the project 11. Confidentiality of business/engineering details of the project is critical to project success 12. Local conditions at project site are favorable to project execution 13. Owner desires a high degree of control/influence over project execution 14. Owner desires a minimal level of control/influence over project execution 15. Owner desires a substantial use of its own resources in the execution of the project 16. Owner desires a minimal use of its own resources in the execution of the project 17. Project features are well defined at the award of the design and/or construction contract 18. Project features are not well defined at the award of the design and/or construction contract 19. Owner prefers minimal number of parties to be accountable for project performance 20. Project design/engineering or construction is complex, innovative or non‐standard
For this analysis, the PDCS program will be used to determine the best delivery method based on the Owner’s, A/E’s, and CM’s objectives (factors). By having goals from each team player, it will provide a perspective from each side of the fence. Principles of each entity were surveyed to determine what goals they felt were most important to the success of the project. The results will be compared to determine if there is a consensus on how to deliver the project.

Weiger – Final Report 36 | P a g e
Each principle was asked to select 6 factors from the list of 20 and put them in order of importance. The 6 factors are then weighted, 1‐100% with 100% being the most important. The following are the results of the survey.
Owner’s Factors
100% ‐ Completion within schedule is highly critical to project success 100% ‐ An above normal level of changes is anticipated in the execution of the project 95% ‐ Completion within original budget is critical to project success 95% ‐ Early completion is critical to project success 90% ‐ Owner assumes minimal financial risk 50% ‐ Early procurement of long lead equipment and/or materials is critical
CM’s Factors
100% ‐ Completion within original budget is critical to project success 98% ‐ Completion within schedule is highly critical to project success 95% ‐ Project features are not well defined at the award of the design and/or construction contract 85% ‐ An above normal level of changes is anticipated in the execution of the project 75% ‐ Owner critically requires early (and reliable) cost figures, to facilitate financial planning and business decisions. 60% ‐ Early procurement of long lead equipment and/or materials is critical to project success A/E’s Factors
100% ‐ Completion within original budget is critical to project success 100% ‐ Completion within schedule is highly critical to project success 92% ‐ An above normal level of changes is anticipated in the execution of the project 90% ‐ Owner desires a high degree of control/influence over project execution 75% ‐ Owner desires a substantial use of its own resources in the execution of the project 65% ‐ Project features are not well defined at the award of the design and/or construction contract
The survey results show conclusive evidence that the project goals are shared by each party. Each party believes the project goals are broadly:
• On time • On Schedule • Above average number of changes • Substantial control/oversight by Owner • Not well defined features at award • Early procurement is critical

Weiger – Final Report 37 | P a g e
The factors that were identified in the survey were analyzed by the PDCS. The top 2 delivery methods with their ratings are listed below.
Owner’s PDCS Results
Turnkey – 81.13 Design‐Build or EPC – 77.64
CM’s PDCS Results
CM @ Risk – 68.05 Turnkey – 64.91
A/E’s PDCS Results
Traditional Design‐Bid‐Build – 76.25 Traditional with Construction Manager – 74.52
The results are rather surprising considering each entity had more‐or‐less the same project objectives. The objectives’ order of importance and weight were different in each case which resulted in a mix of project delivery methods.
The PDCS failed to take into account 3 major project constraints/objectives.
1. Project delivery familiarity in geographical region 2. Extensive user requirements from multiple tenants 3. High quality of construction
The familiarity of project delivery is a significant constraint when selecting a delivery method. For example, a Turnkey delivery method is not common in this geographical area or the commercial construction industry in general. Many of the potential bidders would hesitate to take on a project like this because the risk would be too great, especially because the construction industry was booming at the time of the contract award.
JHH has to coordinate with hundreds of end users who all have different requirements. Technology and equipment is constantly changing which means that the detail design will be held off as long as possible. JHH will require as much control as possible to be able to dictate last minute changes.
The quality of construction is significantly above average. Much of the project’s financing comes from donors who have contributed millions of dollars. Some of the large donors have their own architects to ensure they are getting what they want. This requires a robust quality control and assurance program for all team players.
Based on the PDCS results, research, and industry interviews the top 3 delivery methods that offer the most potential to meet the project goals while managing the project changes efficiently are:
1. Integrated Project Delivery 2. Design‐Build 3. Traditional with Early Procurement and Construction Manager

Weiger – Final Report 38 | P a g e
Integrated Project Delivery The Integrated Project Delivery (IPD) method was not included in the PDCS analysis. This method is relatively new and is a critical industry issue in the current market.
Sutter Health System out of Sacramento, CA has used the delivery method with some promising results. On the Camino Medical Group Mountain View Medical Center ($98 million), Sutter Health used the IPD. They believe the delivery method saved approximately $9 million and 6 months over a traditional delivery method.
The working definition as defined by the American Institute of Architects (AIA) is:
“Integrated Project Delivery (IPD) is a project delivery approach that integrates people, systems, business structures and practices into a process that collaboratively harnesses the talents and insights of all participants to optimize project results, increase value to the owner, reduce waste, and maximize efficiency through all phases of design, fabrication, and construction.”
Figure 11 below shows the relationship among all the team players.
The backbone of the IPD method is to build a team with collaboration and trust. This fundamental idea encourages parties to focus on project outcomes rather than their own goals. Achieving the benefits of IPD requires that all project parties follow the Principles of Integrated Project Delivery as defined by AIA.
1. Mutual Respect and Trust – all team players understand the value of collaboration and are committed to working as a team in the best interests of the project.
2. Mutual Benefit and Reward – compensation is based on the value added by an organization and it rewards “what’s best for project” behavior, such as providing incentives tied to achieving project goals.
3. Collaborative Innovation and Decision Making – information is freely exchanged between all participants and judged on merit, not the author’s status.
Figure 11: IPD Relationships Among Team Players
Weiger – Final Report 39 | P a g e
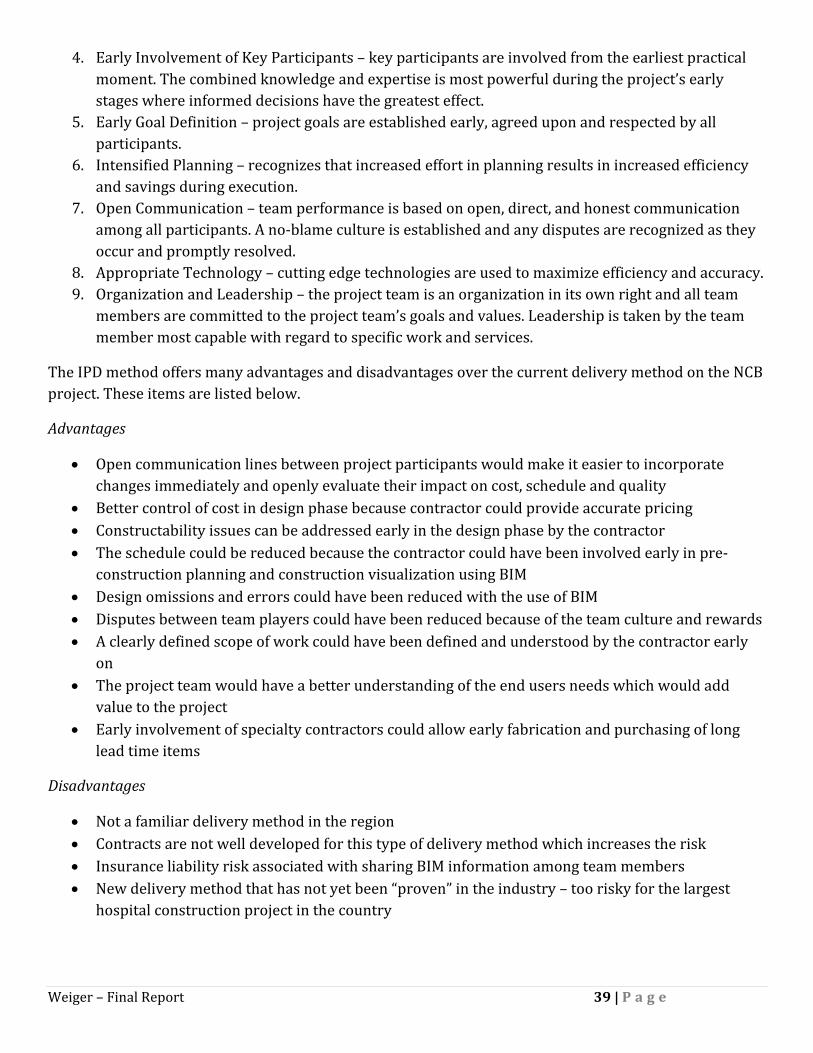
4. Early Involvement of Key Participants – key participants are involved from the earliest practical moment. The combined knowledge and expertise is most powerful during the project’s early stages where informed decisions have the greatest effect.
5. Early Goal Definition – project goals are established early, agreed upon and respected by all participants.
6. Intensified Planning – recognizes that increased effort in planning results in increased efficiency and savings during execution.
7. Open Communication – team performance is based on open, direct, and honest communication among all participants. A no‐blame culture is established and any disputes are recognized as they occur and promptly resolved.
8. Appropriate Technology – cutting edge technologies are used to maximize efficiency and accuracy. 9. Organization and Leadership – the project team is an organization in its own right and all team
members are committed to the project team’s goals and values. Leadership is taken by the team member most capable with regard to specific work and services.
The IPD method offers many advantages and disadvantages over the current delivery method on the NCB project. These items are listed below.
Advantages
• Open communication lines between project participants would make it easier to incorporate changes immediately and openly evaluate their impact on cost, schedule and quality
• Better control of cost in design phase because contractor could provide accurate pricing • Constructability issues can be addressed early in the design phase by the contractor • The schedule could be reduced because the contractor could have been involved early in pre‐
construction planning and construction visualization using BIM • Design omissions and errors could have been reduced with the use of BIM • Disputes between team players could have been reduced because of the team culture and rewards • A clearly defined scope of work could have been defined and understood by the contractor early
on • The project team would have a better understanding of the end users needs which would add
value to the project • Early involvement of specialty contractors could allow early fabrication and purchasing of long
lead time items
Disadvantages
• Not a familiar delivery method in the region • Contracts are not well developed for this type of delivery method which increases the risk • Insurance liability risk associated with sharing BIM information among team members • New delivery method that has not yet been “proven” in the industry – too risky for the largest
hospital construction project in the country

Weiger – Final Report 40 | P a g e
Clearly, the IPD method attempts to correct many of the inefficiencies in the construction industry. The guiding principles of the method are extremely valuable. The NCB project could benefit enormously just from having the team approach instead of the individual approach.
However, it is not realistic to think that the Owner would want to use a delivery method that is unproven and unfamiliar to many of the companies they consistently work with. Even though the method sounds very promising, it is not appropriate to use the IPD on a project of this magnitude.
DesignBuild The design‐build delivery method allows the owner to contract the design and construction aspects to a single entity known as a design‐build contractor. The entity is usually a contractor who has established a joint‐venture with a design firm or a contractor that has an in‐house design expertise.
The delivery of the project is accelerated because construction is overlapped with design. The actual time it takes to complete design and construction is often not accelerated. Also, the risk is minimized for the owner because only one contract is held. Figure 12 below shows the contractual relationships among the team players.
Figure 12: Design‐Build Relationship Structure

Weiger – Final Report 41 | P a g e
The design‐build delivery method offers many advantages and disadvantages over the current delivery method on the NCB project. These items are listed below.
Advantages
• Cost control could have been maximized early on because the design‐builder would take responsibility for protecting the budget
• Open communication lines between project participants would make it easier to incorporate changes immediately and openly evaluate their impact on cost, schedule and quality
• Team approach • Better control of cost in design phase because contractor could provide accurate pricing • Constructability issues can be addressed early in the design phase by the contractor • A clearly defined scope of work could have been defined and understood by the contractor early
on • Early involvement of specialty contractors could allow early fabrication and purchasing of long
lead time items • Quality control can be improved by recognizing problems early and working together to solve
them • Bidding time is reduced because redesign time is eliminated
Disadvantages
• Would not have accelerated the schedule because the current method is already fast tracked • One single entity would not allow the Owner to have enough control over design and construction • No checks and balance • Not as flexible to changes • Risk of sacrificing design quality to protect design‐builder’s profits • Owner is responsible for quality assurance
The design‐build approach has many of the same advantages as the IPD method. Specifically having the contractor involved from the beginning of the project to provide cost, schedule, and constructability analysis would have been very valuable for the NCB. This could have reduced the number of changes by identifying some of the issues that have caused problems in the field. Early procurement would have allowed the contractor time to find the best value source instead of trying to meet the schedule. This would have resulted in some cost savings.
The disadvantages of the delivery method make it unlikely choice for this project. JHH desires a lot of control over the design and the construction. Not having the check and balance system in place could jeopardize the quality of the project. This would have made it difficult to incorporate the large number of late changes in the project from donor enhancements.
Another approach to design‐build is to use specialty contractors in a design‐build capacity. On the NCB, most of the design omissions/errors and changes impacted the mechanical, electrical and plumbing (MEP) scope. Further research was conducted on the use of a design‐build mechanical and electrical contractor.

Weiger – Final Report 42 | P a g e
The GMP drawings that the MEP subs used to bid the job changed drastically when they were finally completed. When the contract was awarded to the MEP contractors in January of 2007, they expected the final construction drawings would be complete in April of 2007. However, the design/owner team was unable to meet this deadline. Instead, they issued Construction Change Directives (CCD) that had design complete on 2 floors for each package. This continued until the design was finally complete in January 2009.
The MEP subs have estimated that the changes/CCDs have increased their contract value by 17%. The constantly changing design has severely impacted the coordination of the MEP system and the prefabrication of components. Last minute drawings were often delivered right before the schedule had them installing the area. This took the entire float out of the schedule and in some cases, pushed the schedule.
If a design‐build mechanical and electrical contractor would have been used on this project, the initial cost would have increased by 5% according to the subcontractors. However, this would allow them to get involved early in the design (before construction started) to work with the mechanical engineer to provide value engineering, cost, and schedule input. This would have allowed them to get an early start on coordination, procurement of long lead items and prefabrication. Ultimately, the initial cost would have been saved because the number of changes could have been reduced dramatically.
Traditional with Early Procurement and Construction Manager This delivery method is exactly the same as the current method, with the exception of having a construction/project manager contracted directly to the owner to provide construction expertise. Figure 13 below shows the contract relationships in this delivery method.
Figure 13: Traditional with Early Procurement and Construction Manager Relationship Structure
Weiger – Final Report 43 | P a g e
KLMK Group, a project management company that specializes in healthcare projects was contacted to determine the cost associated with having a project manager. They estimated on a project of this size, the initial cost is 1% of the total building cost. However, they believe the value added from their expertise will pay that cost back during the delivery of the project.
A project management company such as KLMK would provide a team of 3‐4 people onsite during the planning, designing, and construction phases of the project. They would work with the project team to establish expectations, define the scope, set the budget and schedule, and help negotiate contracts during the bidding phase. They could also assist with regulatory agency approval and permitting for the facility.
The traditional with early procurement and construction manager delivery method offers many advantages and disadvantages over the current delivery method on the NCB project. These items are listed below.
Advantages
• PM has extensive experience with delivering similar projects • PM is familiar with designers/contractors/consultants/subcontractors in the healthcare field • Transparent approach to managing the project by sharing cost, schedule, quality, etc. information • PM would provide a check and balance of contractor pricing for change orders • Decreases the chances of disputes by promoting a team approach • PM could assist the Owner with managing changes • PM could manage the design process which has the potential to accelerate the design • PM would assist with close‐out and occupancy • PM would assist with master planning of entire campus and the affects of the NCB
Disadvantages
• Initial cost • May create hostile environment by challenging the contractor’s expertise • All participants must be cooperative and communicate well
The primary advantage of having a project manager on the team is the expertise they bring. Although, JHH has their own facility management group, they have not managed a project of this magnitude. The PM could provide significant value by managing the changes and reviewing the pricing. With the amount of changes on this project, it is likely there will be a dispute and a project manager could reduce the likelihood of that happening.
The obvious disadvantage is the extra cost associated with having another team member. If the Owner knew the project was going to have a lot of changes, then they could have assumed this method was a good investment.

Weiger – Final Report 44 | P a g e
5.6 Conclusion The PDCS did not identify the most appropriate delivery method in the author’s opinion. However, the process of working through the PDCS tool was helpful in identifying the team’s objectives. These objectives were used to evaluate multiple alternative delivery methods.
The three delivery methods that were researched all had many advantages and disadvantages. The current delivery method was selected by JHH because they were familiar with it and thought it had the least amount of risk. The comparison of the alternative delivery methods showed that the current delivery method was an inefficient method.
Hindsight is often 20‐20, but knowing how the project has played out thus far, an alternative delivery method would have been better suited. The recommended delivery method is a hybrid of all 3 methods researched. Since each method had their advantages and disadvantages, it was necessary to have a combination of each to have the perfect balance.
The recommended delivery method would have a relationship structure similar to the traditional with early procurement and construction manager. All project team players would have to buy into the principles outlined in the IPD method. A design‐build mechanical and electrical contractor would be used.
This hybrid delivery method attempts to solve the biggest problems on the NCB project. The project manager would be involved early in planning and could help manage the changes. Their expertise would be very valuable when selecting team members and providing cost, schedule, and quality information. Their initial cost would certainly be paid back in value added to the project.
The ideas of IPD are very progressive for the industry. However, behind closed doors many principles will agree the industry needs to take this direction. By promoting collaboration, trust, communication, technology and a fair reward system the project team would work more efficiently with fewer disputes. This would reduce the number of changes.
A design‐build mechanical and electrical contractor would certainly add value to the project. The delays in the MEP trades would have been reduced if their expertise would have been brought in at the beginning. The initial cost of having more personnel and resources for the MEP subs would have been offset by the reduction in changes and delays.
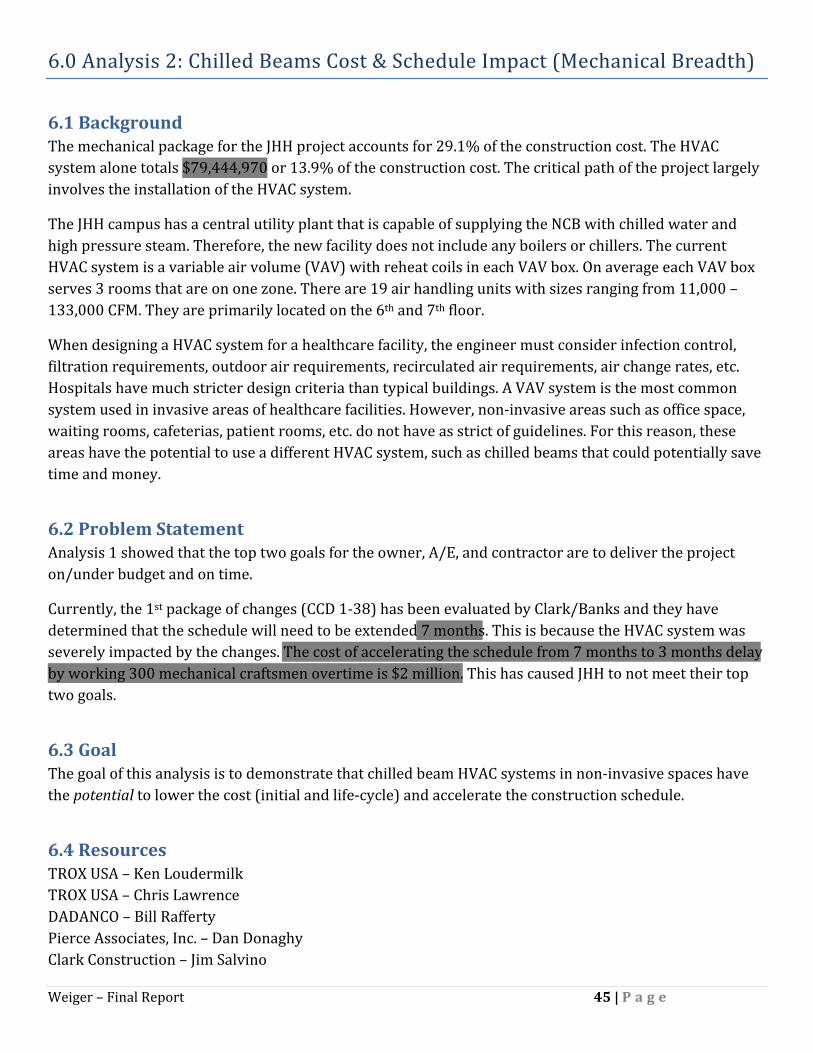
Weiger – Final Report 45 | P a g e
6.0 Analysis 2: Chilled Beams Cost & Schedule Impact (Mechanical Breadth)
6.1 Background The mechanical package for the JHH project accounts for 29.1% of the construction cost. The HVAC system alone totals $79,444,970 or 13.9% of the construction cost. The critical path of the project largely involves the installation of the HVAC system.
The JHH campus has a central utility plant that is capable of supplying the NCB with chilled water and high pressure steam. Therefore, the new facility does not include any boilers or chillers. The current HVAC system is a variable air volume (VAV) with reheat coils in each VAV box. On average each VAV box serves 3 rooms that are on one zone. There are 19 air handling units with sizes ranging from 11,000 – 133,000 CFM. They are primarily located on the 6th and 7th floor.
When designing a HVAC system for a healthcare facility, the engineer must consider infection control, filtration requirements, outdoor air requirements, recirculated air requirements, air change rates, etc. Hospitals have much stricter design criteria than typical buildings. A VAV system is the most common system used in invasive areas of healthcare facilities. However, non‐invasive areas such as office space, waiting rooms, cafeterias, patient rooms, etc. do not have as strict of guidelines. For this reason, these areas have the potential to use a different HVAC system, such as chilled beams that could potentially save time and money.
6.2 Problem Statement Analysis 1 showed that the top two goals for the owner, A/E, and contractor are to deliver the project on/under budget and on time.
Currently, the 1st package of changes (CCD 1‐38) has been evaluated by Clark/Banks and they have determined that the schedule will need to be extended 7 months. This is because the HVAC system was severely impacted by the changes. The cost of accelerating the schedule from 7 months to 3 months delay by working 300 mechanical craftsmen overtime is $2 million. This has caused JHH to not meet their top two goals.
6.3 Goal The goal of this analysis is to demonstrate that chilled beam HVAC systems in non‐invasive spaces have the potential to lower the cost (initial and life‐cycle) and accelerate the construction schedule.
6.4 Resources TROX USA – Ken Loudermilk TROX USA – Chris Lawrence DADANCO – Bill Rafferty Pierce Associates, Inc. – Dan Donaghy Clark Construction – Jim Salvino
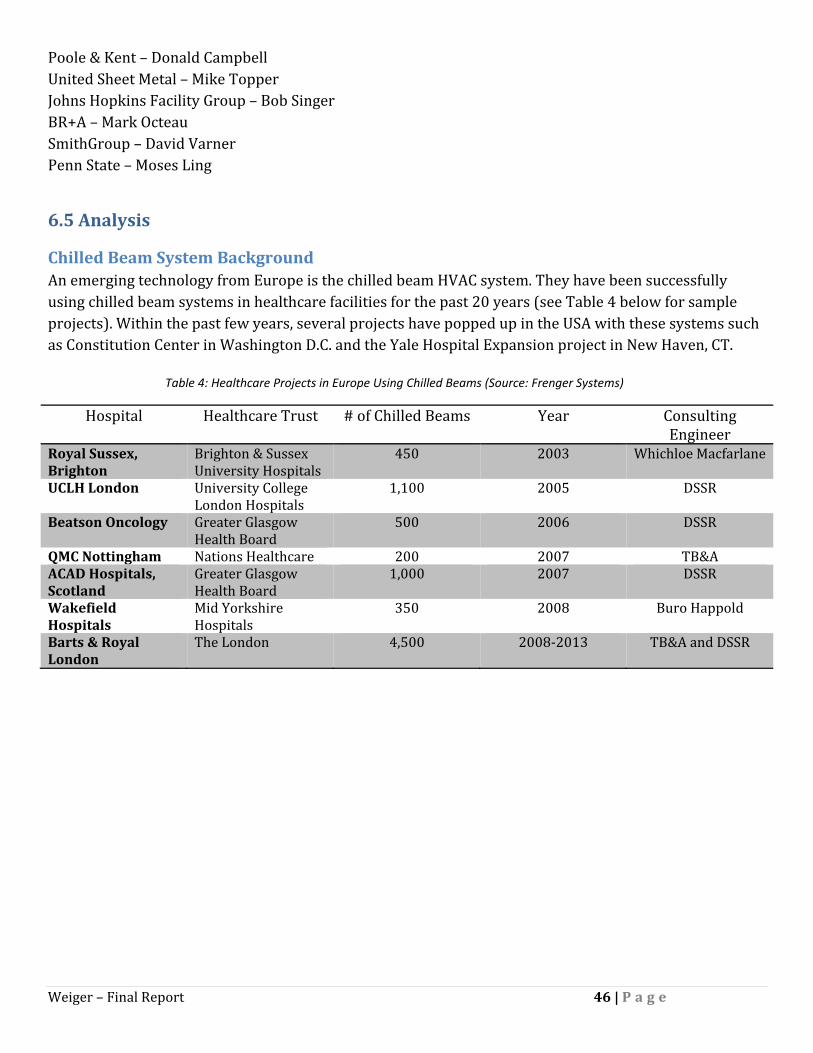
Weiger – Final Report 46 | P a g e
Poole & Kent – Donald Campbell United Sheet Metal – Mike Topper Johns Hopkins Facility Group – Bob Singer BR+A – Mark Octeau SmithGroup – David Varner Penn State – Moses Ling
6.5 Analysis
Chilled Beam System Background An emerging technology from Europe is the chilled beam HVAC system. They have been successfully using chilled beam systems in healthcare facilities for the past 20 years (see Table 4 below for sample projects). Within the past few years, several projects have popped up in the USA with these systems such as Constitution Center in Washington D.C. and the Yale Hospital Expansion project in New Haven, CT.
Hospital Healthcare Trust # of Chilled Beams Year Consulting Engineer
Royal Sussex, Brighton
Brighton & Sussex University Hospitals
450 2003 Whichloe Macfarlane
UCLH London University College London Hospitals
1,100 2005 DSSR
Beatson Oncology Greater Glasgow Health Board
500 2006 DSSR
QMC Nottingham Nations Healthcare 200 2007 TB&AACAD Hospitals, Scotland
Greater Glasgow Health Board
1,000 2007 DSSR
Wakefield Hospitals
Mid Yorkshire Hospitals
350 2008 Buro Happold
Barts & Royal London
The London 4,500 2008‐2013 TB&A and DSSR
Table 4: Healthcare Projects in Europe Using Chilled Beams (Source: Frenger Systems)

Weiger – Final Report 47 | P a g e
Chilled beam units have finned chilled water heat exchanger cooling coils, capable of providing 1,000 BTU/hr of sensible cooling per foot of beam. They take advantage of the fact that water can move energy more efficiently than air. Figure 14 below shows that a 1” diameter water pipe can carry the same cooling capacity as an 18” x 18” air duct. Thus, chilled beams can dramatically reduce AHU and duct sizes.
There are two main types of chilled beams – active and passive. Passive chilled beams use finned tube heat exchanger coil to provide convective cooling to the space. They do not use fans, ductwork, or any other component. Since they do not have a source of providing primary air to the space, another source of air is required for ventilation and humidity control.
Active chilled beams use a ducted primary air (conditioned) supply to induce room air across the cooling coil where it mixes with the primary air and discharges in the space. The chilled beam provides most of the sensible load while the primary air provides the ventilation and latent cooling. A Hygienic Active Chilled Beam is the recommended solution for this project (see Appendix A for product data sheets).
Figure 15 below shows a cross section through an active chilled beam. (1) Primary air is fed from a central AHU through a series of nozzles (2). The primary air creates an induction of room air (3) that passes through a cooling coil (4). The primary air and room air are then mixed and discharged to the space (5).
Figure 14: Cooling Energy Transport Economies of Air and Water
Figure 15: Active Chilled Beam Cross Section

Weiger – Final Report 48 | P a g e
Chilled beams have many advantages including low energy consumption, space savings, improved comfort, no regular maintenance, and easy commissioning. The design intent of chilled beams is to size the primary air to meet ventilation or latent load requirements and use the beams to provide the rest of the sensible cooling load. It is common to see 75‐85% reduction in circulated air when using chilled beams compared to all air systems according to DADANCO. This reduction in air can reduce the ductwork, fans, AHUs, etc. by the same proportioned amount. The downsizing of fans and AHUs results in less energy consumption because it is much more energy efficient to move water instead of air. This can save significantly on the life‐cycle cost of a building.
By reducing the ductwork by 75‐85% it frees up space in the ceiling plenum. Therefore, the floor‐floor height can be reduced. This can save money on structure and the façade. Another advantage could be in areas with height restrictions such as Washington, D.C. where it may be possible to add another floor. It also lends itself nicely to renovation projects where the ceiling plenum is restricted.
The room comfort is maintained by providing excellent air movement with uniform air temperatures (see Figure 16 and 17 below). This reduces unwanted drafts and hot spaces in the room. Full ventilation air requirements are delivered to the spaces at all times and loads. Humidity control is met as the constant volume primary air is delivered with the proper moisture content to satisfy the latent loads.
Figure 16: Air Movement Throughout the Room (Source: DADANCO)
Figure 17: Uniform Temperature Throughout the Room (Source: DADANCO)

Weiger – Final Report 49 | P a g e
Chilled beams do not have any moving parts which reduces the maintenance costs. In the recommended Hygiene Chilled Beam for this project, there is an inbuilt filter which will capture all the airborne bacteria as the air is recirculated. This will need to be replaced every 6 months which is the same as the current VAV system. Figure 18 below shows maintenance personnel cleaning a chilled beam.
The commissioning process is much easier than VAV systems. Chilled beams only require adjustments to the water balancing valves and primary air balancing dampers through static pressure readings. The adjustments can be made by turning regulating screws with an allen key with the underplate in position (see Figure 19 below).
Figure 18: Maintenance Personnel Cleaning a Chilled Beam
Figure 19: Adjustment for Regulating Air Amount and Speed

Weiger – Final Report 50 | P a g e
Sizing the Chilled Beam System For this analysis, the current VAV system design will be left untouched for the invasive spaces (i.e. operating rooms, trauma rooms, triage, exam rooms, etc.). The remaining non‐invasive spaces will be analyzed to determine the cost and schedule impact of using chilled beams.
The sheer size and complexity of the HVAC system makes it virtually impossible to analyze each aspect of the HVAC system for this thesis. Therefore, representative and typical spaces will be analyzed and their results will be extrapolated to the rest of the spaces in question.
The two main spaces that are representative of the non‐invasive spaces are the office and patient rooms. These areas make up the majority of the non‐invasive spaces. They also represent the two extremes of the design criteria for the non‐invasive spaces. The office spaces have the least amount of design restrictions while the patient rooms have the most. Analyzing these two spaces will provide a working average that can be used to analyze the entire impact.
Office Space
Level 6 was analyzed as the typical floor for the office spaces. The entire floor functions as faculty offices, meeting rooms, lounges, and filing rooms. Each VAV box serves a certain zone that ranges from 1‐ 9 rooms. The following assumptions were used for the calculation.
• The supply CFM shown on the drawings for each corresponding VAV box represents the design loads for that zone.
• Each room that is a part of the zone has similar loads. • By examining the entire floor, including the north, south, east, west and inside rooms provide
representative load conditions. • The number of seats or area to a room was used to estimate the number of people that would
occupy the room at maximum load. • Sizing is based on cooling load, not heating load
o Heating will only be required on perimeter spaces and can be accomplished by adding heating coils in the beams.
The following calculation is an example of how the chilled beams and primary air supply were sized.
VAV Box S6D‐1
• Total Supply for this VAV = 300 CFM • 6 people are expected to occupy the zone at maximum capacity • 1 room is served by this VAV • Room temperature design = 70˚F • Supply primary air temperature = 55˚F
1. Total Sensible Design Load = 1.08 x Total Supply CFM x (Room Temp – Supply Temp) = 1.08 x 300 CFM x (70˚F ‐ 55˚F) = 4,860 BTU/hr
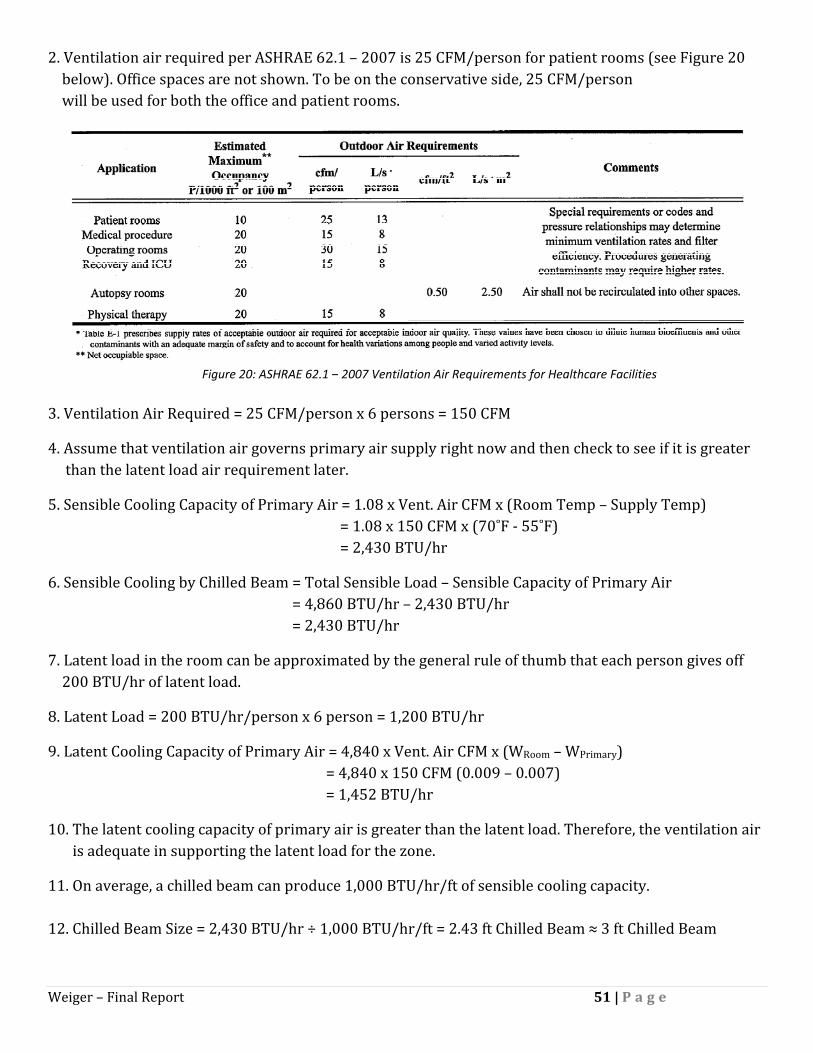
Weiger – Final Report 51 | P a g e
2. Ventilation air required per ASHRAE 62.1 – 2007 is 25 CFM/person for patient rooms (see Figure 20 below). Office spaces are not shown. To be on the conservative side, 25 CFM/person will be used for both the office and patient rooms.
3. Ventilation Air Required = 25 CFM/person x 6 persons = 150 CFM
4. Assume that ventilation air governs primary air supply right now and then check to see if it is greater than the latent load air requirement later.
5. Sensible Cooling Capacity of Primary Air = 1.08 x Vent. Air CFM x (Room Temp – Supply Temp) = 1.08 x 150 CFM x (70˚F ‐ 55˚F) = 2,430 BTU/hr
6. Sensible Cooling by Chilled Beam = Total Sensible Load – Sensible Capacity of Primary Air = 4,860 BTU/hr – 2,430 BTU/hr = 2,430 BTU/hr
7. Latent load in the room can be approximated by the general rule of thumb that each person gives off 200 BTU/hr of latent load.
8. Latent Load = 200 BTU/hr/person x 6 person = 1,200 BTU/hr
9. Latent Cooling Capacity of Primary Air = 4,840 x Vent. Air CFM x (WRoom – WPrimary) = 4,840 x 150 CFM (0.009 – 0.007) = 1,452 BTU/hr
10. The latent cooling capacity of primary air is greater than the latent load. Therefore, the ventilation air is adequate in supporting the latent load for the zone.
11. On average, a chilled beam can produce 1,000 BTU/hr/ft of sensible cooling capacity. 12. Chilled Beam Size = 2,430 BTU/hr ÷ 1,000 BTU/hr/ft = 2.43 ft Chilled Beam ≈ 3 ft Chilled Beam
Figure 20: ASHRAE 62.1 – 2007 Ventilation Air Requirements for Healthcare Facilities

Weiger – Final Report 52 | P a g e
13. Primary Air Reduction = 1 – (Primary Air CFM ÷ Total Current Supply CFM) = 1 – (150 CFM ÷ 300 CFM) = 50%
Table 4 on the following page shows all of the calculations for the typical office rooms. Below is a summary of the findings:
• Percent Reduction in Primary Air = 79% • Average Chilled Beam Size per Room = 5 ft • Total Cost of VAVs for Typical Area = $15,078 = $0.61/SF • Total Cost of Chilled Beams for Typical Area = $102,760 = $4.16/SF • Percent Increase of Chilled Beams over VAV Boxes = 682%

Weiger – Final Report 53 | P a g e
Table 5: Chilled Beam Load Calculations for Office Space
Weiger – Final Report 54 | P a g e
Patient Rooms
Level 8 was analyzed as the typical floor for patient rooms. The entire floor functions as patient rooms and nursing stations. Each VAV box serves a certain zone that ranges from 1‐ 5 rooms. The following assumptions were used for the calculation.
• The supply CFM shown on the drawings for each corresponding VAV box represents the design loads for that zone.
• Each room that is a part of the zone has similar loads. • By examining the entire floor (including the north, south, east, west and inside rooms) it will
provide representative load conditions. • The number of seats or area to a room was used to estimate the number of people that would
occupy the room at maximum load. • Sizing is based on cooling load, not heating load
o Heating will only be required on perimeter spaces and can be accomplished by adding heating coils in the beams.
The following calculation is an example of how the chilled beams and primary air supply were sized.
VAV Box S8C‐33
• Total Supply for this VAV = 900 CFM • 12 people are expected to occupy the zone at maximum capacity • 4 rooms are served by this VAV • Room temperature design = 70˚F • Supply primary air temperature = 55˚F
1. Total Sensible Design Load = 1.08 x Total Supply CFM x (Room Temp – Supply Temp) = 1.08 x 900 CFM x (70˚F ‐ 55˚F) = 14,580 BTU/hr
2. Ventilation air required per ASHRAE 62.1 – 2007 is 25 CFM/person for patient rooms. 3. Ventilation Air Required = 25 CFM/person x 12 persons = 300 CFM
4. Assume that ventilation air governs primary air supply right now and then check to see if it is greater than the latent load air requirement later.
5. Sensible Cooling Capacity of Primary Air = 1.08 x Vent. Air CFM x (Room Temp – Supply Temp) = 1.08 x 300 CFM x (70˚F ‐ 55˚F) = 4,860 BTU/hr
6. Sensible Cooling by Chilled Beam = Total Sensible Load – Sensible Capacity of Primary Air = 14,580 BTU/hr – 4,860 BTU/hr = 9,720 BTU/hr
Weiger – Final Report 55 | P a g e
7. Latent load in the room can be approximated by the general rule of thumb that each person gives off 200 BTU/hr of latent load.
8. Latent Load = 200 BTU/hr/person x 12 person = 2,400 BTU/hr
9. Latent Cooling Capacity of Primary Air = 4,840 x Vent. Air CFM x (WRoom – WPrimary) = 4,840 x 300 CFM (0.009 – 0.007) = 2,904 BTU/hr
10. The latent cooling capacity of primary air is greater than the latent load. Therefore, the ventilation air is adequate in supporting the latent load for the zone.
11. Sensible Load on Chilled Beam per Room = 9,720 BTU/hr ÷ 4 = 2,430 BTU/hr
12. On average, a chilled beam can produce 1,000 BTU/hr/ft of sensible cooling capacity.
13. Chilled Beam Size per Room= 2,430 BTU/hr ÷ 1,000 BTU/hr/ft = 2.43 ft ≈ 3 ft Chilled Beam
13. Primary Air Reduction = 1 – (Primary Air CFM ÷ Total Current Supply CFM) = 1‐ (300 CFM ÷ 900 CFM) = 67%
Table 6 on the following page shows all of the calculations for the typical patient rooms. Below is a summary of the findings:
• Percent Reduction in Primary Air = 74% • Average Chilled Beam Size per Room = 6 ft • Total Cost of VAVs for Typical Area = $6,854 = $0.48/SF • Total Cost of Chilled Beams for Typical Area = $49,280 = $3.46/SF • Percent Increase of Chilled Beams over VAV Boxes = 719%

Weiger – Final Report 56 | P a g e
Table 6: Chilled Beam Load Calculations for Patient Rooms

Weiger – Final Report 57 | P a g e
Cost Impact An add‐deduct cost analysis will be used to determine the initial cost impact of using chilled beams in place of a VAV system. Then a life‐cycle cost analysis will be used to determine the payback period, if any.
Table 7 below is a summary of the current HVAC system costs for the entire building. Each line item will be reviewed to determine if there will be a cost change. The cost is broken down into material and labor cost. This is because savings in material costs will not be equal to savings in labor costs. Therefore, each will need to be addressed separately.
Description Material Labor Total % Total Variable Frequency Drives $1,019,375 $168,125 $1,187,500 1.5 Hydronic Pump Package $159,283 $85,702 $244,985 0.3 Condensate Pump Sets $31,035 $10,813 $41,848 0.1 Steam Specialties $537,011 $388,896 $925,907 1.2 VAV Boxes & Terminals $760,743 $267,290 $1,028,033 1.3 Fans & Accessories $503,782 $95,602 $599,384 0.8 Clean Steam Generators $134,086 $29,446 $163,520 0.2 Duct Humidifiers $41,002 $8,398 $49,400 0.1 Custom AHUs $5,772,000 $1,628,000 $7,400,000 9.3 Ductwork $15,368,723 $23,053,085 $38,421,808 48.4 Controls $3,591,315 $1,933,785 $5,525,100 7.0 Mechanical Insulation $1,320,602 $1,980,904 $3,301,506 4.2 Test & Balance ‐ $725,000 $725,000 0.9 Chilled Water Piping $3,366,041 $1,891,780 $5,257,821 6.6 Heating Hot Water Piping $4,883,147 $6,600,553 $11,483,700 14.5 Steam & Condensate Piping $1,312,869 $1,776,589 $3,089,458 3.9 Grand Total $38,801,014 $40,643,956 $79,444,970 100
Table 6 figures reflect the total area of the building. As mentioned, the chilled beams will only be used in the non‐invasive spaces. The project architect and owner’s representative was contacted to get a space program. The following square footages were determined:
• Total building size = 1,600,000 SF • Total circulation space including hallways, lobbies, waiting rooms, etc. = 48% of building size • Total invasive space including operating rooms, emergency rooms, trauma, etc. = 35% of building
size • Total non‐invasive space including offices, patient rooms, etc. = 17% of building size
Table 7: Summary of Current HVAC Costs for Entire Building

Weiger – Final Report 58 | P a g e
Based on these SF’s an assumption must be made on what percentage of the HVAC costs are impacted by the chilled beams. The circulation and non‐invasive spaces can use chilled beams. However, some hallways or lobbies may be right next to operating rooms or any other type of invasive space. It would not make sense to use chilled beams in these areas. Therefore, it can be assumed that 5% of the circulation space is not applicable to chilled beams. The result is 60% of the total space is applicable to chilled beams.
In order to analyze the costs associated with the current VAV system in the 60% of the total building space, the design must be understood. A typical operating room has approximately 25% more HVAC loads than the non‐invasive spaces, which is directly proportional to 25% more HVAC costs. Therefore, it can be assumed that the invasive spaces represent 50% of the total HVAC costs (40% x 1.25 = 50%).
Table 8 below represents the current HVAC costs associated with the non‐invasive spaces.
Description Material Labor Total % Total Variable Frequency Drives $509,688 $84,063 $593,750 1.5 Hydronic Pump Package $79,642 $42,851 $122,493 0.3 Condensate Pump Sets $15,518 $5,407 $20,924 0.1 Steam Specialties $268,506 $194,448 $462,965 1.2 VAV Boxes & Terminals $380,372 $133,645 $514,017 1.3 Fans & Accessories $251,891 $47,801 $299,692 0.8 Clean Steam Generators $67,043 $14,723 $81,760 0.2 Duct Humidifiers $20,501 $4,199 $24,700 0.1 Custom AHUs $2,886,000 $814,000 $3,700,000 9.3 Ductwork $7,684,362 $11,526,543 $19,210,904 48.4 Controls $1,795,658 $966,893 $2,762,550 7.0 Mechanical Insulation $660,301 $990,452 $1,650,753 4.2 Test & Balance ‐ $362,500 $362,500 0.9 Chilled Water Piping $1,683,021 $945,890 $2,628,911 6.6 Heating Hot Water Piping $2,441,574 $3,300,277 $5,741,850 14.5 Steam & Condensate Piping $656,435 $888,295 $1,544,729 3.9 Grand Total $19,400,507 $20,321,978 $39,722,485 100
Table 8: Summary of Current HVAC Costs for Non‐invasive Spaces

Weiger – Final Report 59 | P a g e
Chilled Beam Initial Cost Analysis
The following calculations are based on the non‐invasive areas and costs.
Ductwork
The sizing of the chilled beams and primary air calculations yielded a 74–79% reduction in air. A 75% reduction will be used to be on the conservative side. From this we can assume the following:
• The cross sectional area of the ductwork can be reduced by 75% • The ceiling plenum space can be reduced
o Therefore, the floor‐floor height can be reduced • AHUs, fans, etc. can be reduced by 75% capacity
Ductwork material cost is determined by the weight of sheet metal. The surface area is directly related to weight. Therefore we can calculate the material savings based on a 75% reduction in cross sectional area.
Assume a 10” x 10” duct.
Surface Area (Perimeter) = 10” + 10” + 10” = 10” = 40”
Cross sectional area = 10” x 10” = 100 in2
Reduced Cross Sectional Area = 100 in2 x 0.25 = 25 in2
Reduced Size = (25 in2) ^1/2 = 5 “ ‐> 5” x 5”
Reduced Surface Area (Perimeter) = 5” + 5” + 5” +5” = 20 in2
See Figure 21 below for an illustration of this calculation.
10”
10” Cross
Section =100 in2
Cross Section =25 in2
5”
5”
Figure 21: Illustration of Ductwork Reduction by 75%
Weiger – Final Report 60 | P a g e
From this calculation, we can conclude that there will be a 50% savings in ductwork material cost. However, this does not tell us anything about the labor savings. The labor costs to hang a duct that is 50% lighter and 75% smaller in cross section is not reduced by 50% because the craft still has to follow the same procedure. There will be some savings with handling and lifting the duct because it is lighter and smaller. Mike Topper, Project Manager for United Sheet Metal estimated a labor savings of 30% using the smaller duct.
Material Cost Savings = $7,684,362 x 0.5 = $3,842,181
Labor Cost Savings = $11,526,543 x 0.7 = $8,068,580
Total Ductwork Cost = $11,910,761
AHUs, Fans, and Variable Frequency Drives
The AHUs and Fans can be downsized by 75% because they only have to provide 25% of their design CFMs. The cost savings for material and labor were estimated by the mechanical subcontractor, Poole and Kent. Donald Campbell, Vice President estimated a savings of 60% for material and 40% for labor for the AHUs, Fans, and VFDs.
AHU Material Cost Savings = $2,886,000 x 0.4 = $1,154,400
AHU Labor Cost Savings = $814,000 x 0.6 = $488,400
Total AHU Cost = $1,642,800
Fans Material Cost Savings = $251,891 x 0.4 = $100,756
Fans Labor Cost Savings = $47,801 x 0.6% = $28,680
Total Fans Cost = $129,436
VFD Material Cost Savings = $509,688 x 0.4 = $203,875
VFD Labor Cost Savings = 84,063 x 0.6 = $50,438
Total VFD Cost = $254,313

Weiger – Final Report 61 | P a g e
Chilled Water Piping
As discussed in the chilled beam background, most of the cooling load will be delivered by chilled water pipes. The current VAV design has reheat coils in each VAV box which requires a hot water loop to be supplied to each floor. Based on the quantity and cost information for that, the chilled water pipe for the chilled beams can be estimated.
There is 160,000 linear feet of hot water piping at a cost of $11,483,700 with the current design. Therefore, the unit cost for material and labor is approximately $71.77/ft. For this estimate the cost of different size pipe will be ignored because it can be assumed that this unit cost is a representative average of the chilled water pipe sizes.
To estimate the quantity of chilled water piping for the chilled beam design, the typical spaces can be analyzed to get a quantity per square foot. The typical floor for the patient rooms has 14,248 SF of space. The typical patient room is 15’x12’ with 12’ corridors. The following assumptions can be made:
• At least 1 chilled beam will be in a room • The chilled water loop will run through the center of each room in the ceiling plenum • Branches from the main loop will run to the hallways • A 20% allowance will be used for supply lines from the pumps to the loop and for branches • 5% for waste • The typical space can be approximated by a rectangle area 114’x126’ = 14,364 SF
Figure 22 below is a drawing of a simplified typical floor. The red lines indicate the chilled/hot water pipe loops serving each chilled beam.
Figure 22: Simplified Typical Floor Piping Loop

Weiger – Final Report 62 | P a g e
From the assumptions on the previous page, the following calculations can be made:
Perimeter Loop = (2 x 99’) + (2 x 111’) = 420 lf
Interior Loops = (2 x 15’) + (2 x 72’) = 174 lf each
The perimeter loop will require a 4‐pipe system for supply/return of hot and chilled water. This is because heating coils will be required for the perimeter spaces. The interior loops will only require a 2‐pipe system for supply/return of chilled water.
Total Pipe = {(4 x 420’) + (2 x 2 x 174’)} x 1.05 x 1.2 = 2,994 lf
Total Pipe per Area = 2,994 lf ÷ 14,364 SF = 0.21 lf/SF
Non‐invasive Area = 1.6M SF x 60% = 960,000 SF
Cost of Chilled Water Pipe to Chilled Beam = 960,000 SF x 0.21 lf/SF x $71.77/lf = $14,468,832
The chilled water piping line item includes pipe from the central utility plant to the AHUs. The cost for this pipe will not change because the same amount of chilled water will be needed (the building loads have not changed).This cost can be included with the chilled water pipe for the chilled beams.
Total Cost of Chilled Water Piping = $14,468,832 + $2,628,911 = $17,097,743
Pumps
The increased quantity of pipe will require the pumps to be upsized for the increase in volumetric flow. The increase cost for pumps should be directly proportional to the increase cost of piping.
Percent Increase in Piping = $14,468,832/$5,741,850 = 252%
Total Cost of Pumps = $122,493 x 2.52 = $308,669

Weiger – Final Report 63 | P a g e
VAV Boxes/Chilled Beams
Table 9 below summarizes the findings in the Sizing the Chilled Beams section.
Office Rooms Patient Rooms Average VAV Boxes $0.61/SF $0.48/SF $0.55/SF Chilled Beams $4.16/SF $3.46/SF $3.81/SF % Increase 682% 721% 693%
The cost data presented in Table 23 was based on the following figures:
• VAV Box Unit Cost = $1,028,033 ÷ 3,000 units = $342.68 (includes diffusers) • Average Cost of Chilled Beam = $140/ft (Source: Pierces Associates) • Average Cost of Installing Chilled Beam = $140/ft (Source: Pierces Associates)
Note that the cost per SF is lower for patient rooms than the offices. This is because the number of people occupying each room at maximum load is much lower. The average unit costs will be used for this analysis to provide an accurate representation.
The estimate can be verified by checking the estimated unit cost of the VAV boxes against the actual budget amount.
Estimated VAV Box Cost = 960,000 SF x $0.55/SF = $528,000
Actual VAV Box Cost = $514,017
The estimate proves to be very accurate by a margin of error of 3%.
The cost of VAV boxes will be replaced by the cost of Chilled Beams. The following calculation is used to estimate the cost.
Total Cost of Chilled Beams = 960,000 SF x $3.81/SF = $3,657,600
Table 9: Cost Comparison of Chilled Beams vs. VAV Boxes
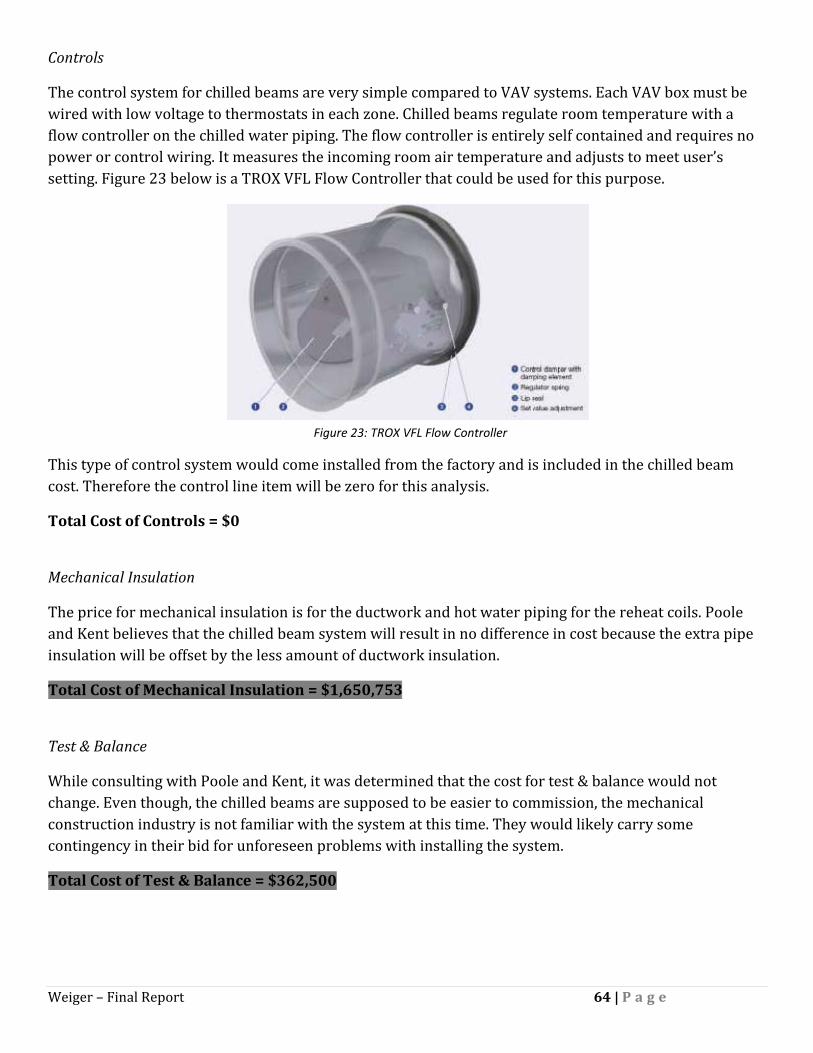
Weiger – Final Report 64 | P a g e
Controls
The control system for chilled beams are very simple compared to VAV systems. Each VAV box must be wired with low voltage to thermostats in each zone. Chilled beams regulate room temperature with a flow controller on the chilled water piping. The flow controller is entirely self contained and requires no power or control wiring. It measures the incoming room air temperature and adjusts to meet user’s setting. Figure 23 below is a TROX VFL Flow Controller that could be used for this purpose.
This type of control system would come installed from the factory and is included in the chilled beam cost. Therefore the control line item will be zero for this analysis.
Total Cost of Controls = $0
Mechanical Insulation
The price for mechanical insulation is for the ductwork and hot water piping for the reheat coils. Poole and Kent believes that the chilled beam system will result in no difference in cost because the extra pipe insulation will be offset by the less amount of ductwork insulation.
Total Cost of Mechanical Insulation = $1,650,753
Test & Balance
While consulting with Poole and Kent, it was determined that the cost for test & balance would not change. Even though, the chilled beams are supposed to be easier to commission, the mechanical construction industry is not familiar with the system at this time. They would likely carry some contingency in their bid for unforeseen problems with installing the system.
Total Cost of Test & Balance = $362,500
Figure 23: TROX VFL Flow Controller

Weiger – Final Report 65 | P a g e
Other Components
The following HVAC components will be unaffected by the change to a chilled beam system. These line items are for operating rooms, medical gas, and humidity control that are not a part of the chilled beam system. Therefore, their cost will remain unchanged.
Total Cost of Condensate Pump Sets = $20,924
Total Cost of Steam Specialties = $462,965
Total Cost of Clean Steam Generators = $81,760
Total Cost of Duct Humidifiers = $24,700
Total Cost of Steam & Condensate Piping = $1,544,729
Chilled Beam HVAC System Initial Cost
To finalize the cost impact on the HVAC system, the cost of the VAV must be added to the chilled beams cost. Table 10 on the following page outlines the cost associated with each system. The chilled beam HVAC costs are compared to the original VAV budget to evaluate the savings. The following observations can be made:
• A total savings in HVAC cost = $572,832 • Most of the savings came from labor • Significant savings in Ductwork = $7,300,143 • Savings was offset by increased cost of piping, water pumps and chilled beams

Weiger – Final Report 67 | P a g e
Building Façade Cost Impact
Floor‐to‐floor height for the NCB is on average 15’. The acoustical tile ceiling is to be located 8’‐10’ above finish floor, depending on which area of the building it is in. On average, the thickness of the decks is 8”.
That means that the ceiling plenum ranges from 6’‐4” to 4’‐4”. The limiting factor to how small you can make the ceiling plenum is the space under the steel girders. The typical girder on this project is a W21x57. That means that the clear space under the girder ranges from 4’‐7” to 2’‐7”. To be on the conservative side, 2’‐7” will be used for this analysis.
The mechanical overhead size is usually restricted by ductwork since it is the largest component. The 2’‐7” between the ceiling and the girder is necessary to allow the ductwork to pass. Since a Chilled Beam system allows the ductwork to be downsized by 50% in length/width, the space between the ceiling and girder can also be downsized by 50%. This results in a 1’‐4” space savings.
By reducing the ceiling plenum by 1’‐4”, the floor‐to‐floor height can also be reduced by the same amount. This will result in savings of precast and curtain wall. The following data is used to calculate the savings:
• Typical floor perimeter = 2,515 ft. • Number of floors = 15 • Precast cost = $45.77/SF (see Project Background) • Curtain Wall cost = $102.18/SF (see Project Background) • Precast accounts for 43% of façade • Curtain Wall accounts for 57% of façade
Only 60% of the façade SF can be reduced because the chilled beams are only used in non‐invasive spaces. This assumes that the chilled beams will be used throughout an entire floor space.
Total amount of façade SF reduced = 1’‐4”/floor x 15 floors x 2,515’ x 0.6 = 30,180 SF
Total amount of Precast SF reduced = 30,180 SF x 0.43 = 12,977 SF
Total amount of Curtain Wall SF reduced = 30,180 SF x 0.57 = 17,203 SF
Total Savings in Precast = 12,977 SF x $45.77/SF = $593,957
Total Savings in Curtain Wall = 17,203 SF x $102.18/SF = $1,757,803

Weiger – Final Report 68 | P a g e
Structural Steel Cost Impact
The structural steel package scope can be reduced due to reducing the floor‐to‐floor height by 1’‐4”. A manual takeoff indicates that a typical floor has 219 columns with an average weight of 91.6 lbs/ft. In the Project Background section of this thesis, it was found that the structural steel cost was $2,352/ton. The following calculation can be used to calculate the savings, which accounts for 60% of the building area:
Total Reduction in Steel Scope = 219 columns x 91.6 lbs/ft/column x 1’‐4”/floor x 15 floors x 0.6 = 120.3 tons
Total Savings in Structural Steel = 120.3 tons x $2,352/ton = $283,092

Weiger – Final Report 69 | P a g e
Chilled Beam Life Cycle Cost Analysis
Energy Savings
JHH estimates that the HVAC energy cost will be $2.35/SF annually. This equates to an annual energy bill of $3,760,000. As was determined in the previous section, 50% of the load will be used for the non‐invasive spaces. Therefore, only half of the estimated annual energy bill will be affected by this analysis.
In order to project the energy savings accurately, it would require a detail energy model to predict the efficiency of the chilled beam system over the current VAV design. However, an energy model is outside the scope of this thesis analysis. Therefore, it was necessary to reach out to industry experts to get an estimate. There was over‐whelming consensus that chilled beams would provide at least 20‐35% in HVAC energy cost savings. The only similar project in the same geographical area that could be found for comparison was Constitution Center in Washington, D.C. This project was located in the same climate zone with a similar chilled beam design and building enclosure. SmithGroup, the A/E for that project estimated that they saved 23.8% in energy consumption by using the chilled beams in place of a VAV system.
Since, the actual energy efficiency of the system is not known; a life‐cycle analysis will be conducted using 3 scenarios – 15%, 25%, and 35%. The life‐cycle savings in energy cost for the chilled beam system is summarized on the following pages in Table 11, 12, and 13 for 15%, 25%, and 35% energy savings, respectively. A 3% rate of inflation is used for the calculation.
The following is a summary of the findings:
• 5 Year Savings for 15% Efficiency = $1,497,176 • 5 Year Savings for 25% Efficiency = $2,495,294 • 5 Year Savings for 35% Efficiency = $3,493,411
• 10 Year Savings for 15% Efficiency = $3,232,814 • 10 Year Savings for 25% Efficiency = $5,388,023 • 10 Year Savings for 35% Efficiency = $7,543,233
• 20 Year Savings for 15% Efficiency = $7,577,446 • 20 Year Savings for 25% Efficiency = $12,629,076 • 20 Year Savings for 35% Efficiency = $17,680,706
• 30 Year Savings for 15% Efficiency = $13,416,267 • 30 Year Savings for 25% Efficiency = $22,360,445 • 30 Year Savings for 35% Efficiency = $31,304,624
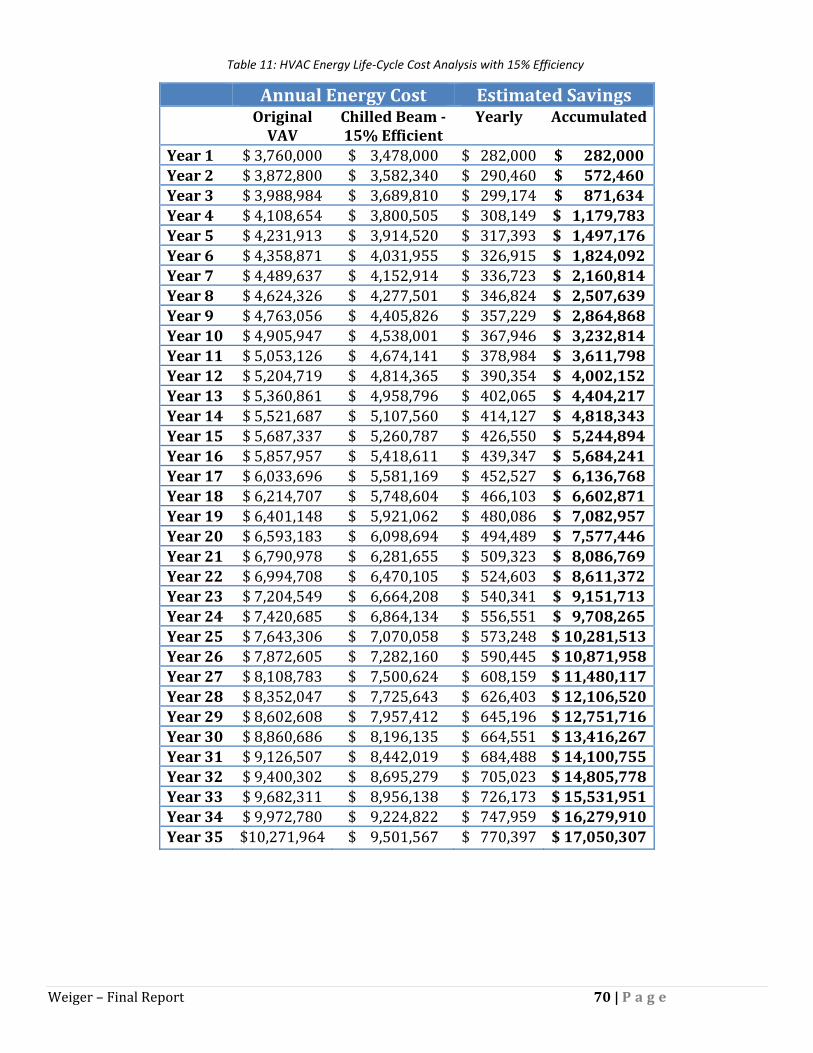
Weiger – Final Report 70 | P a g e
Annual Energy Cost Estimated Savings Original
VAV Chilled Beam 15% Efficient
Yearly Accumulated
Year 1 $ 3,760,000 $ 3,478,000 $ 282,000 $ 282,000 Year 2 $ 3,872,800 $ 3,582,340 $ 290,460 $ 572,460 Year 3 $ 3,988,984 $ 3,689,810 $ 299,174 $ 871,634 Year 4 $ 4,108,654 $ 3,800,505 $ 308,149 $ 1,179,783 Year 5 $ 4,231,913 $ 3,914,520 $ 317,393 $ 1,497,176 Year 6 $ 4,358,871 $ 4,031,955 $ 326,915 $ 1,824,092 Year 7 $ 4,489,637 $ 4,152,914 $ 336,723 $ 2,160,814 Year 8 $ 4,624,326 $ 4,277,501 $ 346,824 $ 2,507,639 Year 9 $ 4,763,056 $ 4,405,826 $ 357,229 $ 2,864,868 Year 10 $ 4,905,947 $ 4,538,001 $ 367,946 $ 3,232,814 Year 11 $ 5,053,126 $ 4,674,141 $ 378,984 $ 3,611,798 Year 12 $ 5,204,719 $ 4,814,365 $ 390,354 $ 4,002,152 Year 13 $ 5,360,861 $ 4,958,796 $ 402,065 $ 4,404,217 Year 14 $ 5,521,687 $ 5,107,560 $ 414,127 $ 4,818,343 Year 15 $ 5,687,337 $ 5,260,787 $ 426,550 $ 5,244,894 Year 16 $ 5,857,957 $ 5,418,611 $ 439,347 $ 5,684,241 Year 17 $ 6,033,696 $ 5,581,169 $ 452,527 $ 6,136,768 Year 18 $ 6,214,707 $ 5,748,604 $ 466,103 $ 6,602,871 Year 19 $ 6,401,148 $ 5,921,062 $ 480,086 $ 7,082,957 Year 20 $ 6,593,183 $ 6,098,694 $ 494,489 $ 7,577,446 Year 21 $ 6,790,978 $ 6,281,655 $ 509,323 $ 8,086,769 Year 22 $ 6,994,708 $ 6,470,105 $ 524,603 $ 8,611,372 Year 23 $ 7,204,549 $ 6,664,208 $ 540,341 $ 9,151,713 Year 24 $ 7,420,685 $ 6,864,134 $ 556,551 $ 9,708,265 Year 25 $ 7,643,306 $ 7,070,058 $ 573,248 $ 10,281,513 Year 26 $ 7,872,605 $ 7,282,160 $ 590,445 $ 10,871,958 Year 27 $ 8,108,783 $ 7,500,624 $ 608,159 $ 11,480,117 Year 28 $ 8,352,047 $ 7,725,643 $ 626,403 $ 12,106,520 Year 29 $ 8,602,608 $ 7,957,412 $ 645,196 $ 12,751,716 Year 30 $ 8,860,686 $ 8,196,135 $ 664,551 $ 13,416,267 Year 31 $ 9,126,507 $ 8,442,019 $ 684,488 $ 14,100,755 Year 32 $ 9,400,302 $ 8,695,279 $ 705,023 $ 14,805,778 Year 33 $ 9,682,311 $ 8,956,138 $ 726,173 $ 15,531,951 Year 34 $ 9,972,780 $ 9,224,822 $ 747,959 $ 16,279,910 Year 35 $10,271,964 $ 9,501,567 $ 770,397 $ 17,050,307
Table 11: HVAC Energy Life‐Cycle Cost Analysis with 15% Efficiency

Weiger – Final Report 71 | P a g e
Annual Energy Cost Estimated Savings VAV Chilled Beam
25% Efficient Yearly Accumulated
Year 1 $ 3,760,000 $ 3,290,000 $ 470,000 $ 470,000 Year 2 $ 3,872,800 $ 3,388,700 $ 484,100 $ 954,100 Year 3 $ 3,988,984 $ 3,490,361 $ 498,623 $ 1,452,723 Year 4 $ 4,108,654 $ 3,595,072 $ 513,582 $ 1,966,305 Year 5 $ 4,231,913 $ 3,702,924 $ 528,989 $ 2,495,294 Year 6 $ 4,358,871 $ 3,814,012 $ 544,859 $ 3,040,153 Year 7 $ 4,489,637 $ 3,928,432 $ 561,205 $ 3,601,357 Year 8 $ 4,624,326 $ 4,046,285 $ 578,041 $ 4,179,398 Year 9 $ 4,763,056 $ 4,167,674 $ 595,382 $ 4,774,780 Year 10 $ 4,905,947 $ 4,292,704 $ 613,243 $ 5,388,023 Year 11 $ 5,053,126 $ 4,421,485 $ 631,641 $ 6,019,664 Year 12 $ 5,204,719 $ 4,554,129 $ 650,590 $ 6,670,254 Year 13 $ 5,360,861 $ 4,690,753 $ 670,108 $ 7,340,362 Year 14 $ 5,521,687 $ 4,831,476 $ 690,211 $ 8,030,572 Year 15 $ 5,687,337 $ 4,976,420 $ 710,917 $ 8,741,490 Year 16 $ 5,857,957 $ 5,125,713 $ 732,245 $ 9,473,734 Year 17 $ 6,033,696 $ 5,279,484 $ 754,212 $ 10,227,946 Year 18 $ 6,214,707 $ 5,437,869 $ 776,838 $ 11,004,785 Year 19 $ 6,401,148 $ 5,601,005 $ 800,144 $ 11,804,928 Year 20 $ 6,593,183 $ 5,769,035 $ 824,148 $ 12,629,076 Year 21 $ 6,790,978 $ 5,942,106 $ 848,872 $ 13,477,948 Year 22 $ 6,994,708 $ 6,120,369 $ 874,338 $ 14,352,287 Year 23 $ 7,204,549 $ 6,303,980 $ 900,569 $ 15,252,855 Year 24 $ 7,420,685 $ 6,493,100 $ 927,586 $ 16,180,441 Year 25 $ 7,643,306 $ 6,687,893 $ 955,413 $ 17,135,854 Year 26 $ 7,872,605 $ 6,888,529 $ 984,076 $ 18,119,930 Year 27 $ 8,108,783 $ 7,095,185 $ 1,013,598 $ 19,133,528 Year 28 $ 8,352,047 $ 7,308,041 $ 1,044,006 $ 20,177,534 Year 29 $ 8,602,608 $ 7,527,282 $ 1,075,326 $ 21,252,860 Year 30 $ 8,860,686 $ 7,753,101 $ 1,107,586 $ 22,360,445 Year 31 $ 9,126,507 $ 7,985,694 $ 1,140,813 $ 23,501,259 Year 32 $ 9,400,302 $ 8,225,264 $ 1,175,038 $ 24,676,297 Year 33 $ 9,682,311 $ 8,472,022 $ 1,210,289 $ 25,886,585 Year 34 $ 9,972,780 $ 8,726,183 $ 1,246,598 $ 27,133,183 Year 35 $10,271,964 $ 8,987,968 $ 1,283,995 $ 28,417,178
Table 12: HVAC Energy Life‐Cycle Cost Analysis with 25% Efficiency

Weiger – Final Report 72 | P a g e
Annual Energy Cost Estimated Savings VAV Chilled Beam
35% Efficient Yearly Accumulated
Year 1 $ 3,760,000 $3,102,000 $ 658,000 $ 658,000 Year 2 $ 3,872,800 $3,195,060 $ 677,740 $ 1,335,740 Year 3 $ 3,988,984 $3,290,911 $ 698,072 $ 2,033,812 Year 4 $ 4,108,654 $3,389,639 $ 719,014 $ 2,752,827 Year 5 $ 4,231,913 $3,491,328 $ 740,585 $ 3,493,411 Year 6 $ 4,358,871 $3,596,068 $ 762,802 $ 4,256,214 Year 7 $ 4,489,637 $3,703,950 $ 785,686 $ 5,041,900 Year 8 $ 4,624,326 $3,815,068 $ 809,257 $ 5,851,157 Year 9 $ 4,763,056 $3,929,520 $ 833,535 $ 6,684,692 Year 10 $ 4,905,947 $4,047,406 $ 858,541 $ 7,543,233 Year 11 $ 5,053,126 $4,168,828 $ 884,297 $ 8,427,530 Year 12 $ 5,204,719 $4,293,893 $ 910,826 $ 9,338,355 Year 13 $ 5,360,861 $4,422,710 $ 938,151 $ 10,276,506 Year 14 $ 5,521,687 $4,555,391 $ 966,295 $ 11,242,801 Year 15 $ 5,687,337 $4,692,053 $ 995,284 $ 12,238,085 Year 16 $ 5,857,957 $4,832,814 $ 1,025,143 $ 13,263,228 Year 17 $ 6,033,696 $4,977,799 $ 1,055,897 $ 14,319,125 Year 18 $ 6,214,707 $5,127,133 $ 1,087,574 $ 15,406,698 Year 19 $ 6,401,148 $5,280,947 $ 1,120,201 $ 16,526,899 Year 20 $ 6,593,183 $5,439,375 $ 1,153,807 $ 17,680,706 Year 21 $ 6,790,978 $5,602,557 $ 1,188,421 $ 18,869,128 Year 22 $ 6,994,708 $5,770,633 $ 1,224,074 $ 20,093,201 Year 23 $ 7,204,549 $5,943,752 $ 1,260,796 $ 21,353,997 Year 24 $ 7,420,685 $6,122,065 $ 1,298,620 $ 22,652,617 Year 25 $ 7,643,306 $6,305,727 $ 1,337,579 $ 23,990,196 Year 26 $ 7,872,605 $6,494,899 $ 1,377,706 $ 25,367,902 Year 27 $ 8,108,783 $6,689,746 $ 1,419,037 $ 26,786,939 Year 28 $ 8,352,047 $6,890,438 $ 1,461,608 $ 28,248,547 Year 29 $ 8,602,608 $7,097,151 $ 1,505,456 $ 29,754,003 Year 30 $ 8,860,686 $7,310,066 $ 1,550,620 $ 31,304,624 Year 31 $ 9,126,507 $7,529,368 $ 1,597,139 $ 32,901,762 Year 32 $ 9,400,302 $7,755,249 $ 1,645,053 $ 34,546,815 Year 33 $ 9,682,311 $7,987,906 $ 1,694,404 $ 36,241,220 Year 34 $ 9,972,780 $8,227,543 $ 1,745,237 $ 37,986,456 Year 35 $10,271,964 $8,474,370 $ 1,797,594 $ 39,784,050
Table 13: HVAC Energy Life‐Cycle Cost Analysis with 35% Efficiency

Weiger – Final Report 73 | P a g e
Space Savings
There are 9 ‐ 8’x26’ mechanical shafts on each floor that can be reduced by 50% in size because the ductwork is going to decrease in size. Also, the mechanical room can be reduced in size because the AHU will either be smaller or some may be deleted. The savings in space in the mechanical room will be approximately 25%. JHH has indicated that any space savings would be used as additional space to generate revenue. A square foot of space in the NCB will generate approximately $983/year. Using this information, the following calculation can be used to determine the additional revenue generated by this extra space. Total Space Saving by Mechanical Shaft = 9 x 8’ x 26’ x 15 floors x 0.5 x 0.6 = 8,434 SF Total Revenue Generated by Mechanical Shaft = 8,434 SF x $983/SF/Year = $8,280,792/Year Total Space Saving by Mechanical Room = 80,118 SF x 0.25 x 0.5 = 10,015 SF Total Revenue Generated by Mechanical Room = 10,015 SF x $983/SF/Year = $9,844,745/Year Total Revenue from Space Savings = $8,280,792/Year + $9,844,745/Year = $18,125,537/Year

Weiger – Final Report 74 | P a g e
Schedule Impact The original baseline schedule was acquired from the mechanical contractor (see the following page). A typical floor overhead schedule was analyzed to find the schedule impact of switching to a chilled beam system. The only activities that required changes to the duration are listed below. The affect to each is noted next to them and was determined in the previous section of this analysis. Note the float on each activity on the baseline schedule.
1. Install Duct Risers in Shafts – Decrease by 30% 2. Install Duct Mains – Decrease by 30% 3. Install HVAC Equipment – Decrease by 40% 4. Install Duct Branches – Decrease by 30% 5. Install OH CHW/RHHW/Steam Mains ‐ Delete Reheat Hot Water (RHHW) and add 275% 6. Install OH CHW/RHHW/Steam Run Outs – Delete Reheat Hot Water (RHHW) and add 275% 7. Install OH CHW/RHHW/Steam Connections ‐ Delete Reheat Hot Water (RHHW) and add 275% 8. Install Grilles, Registers & Diffusers – Delete and add Install Chilled Beams

ID Task Name Duration Start Finish Float
1 Typ. Floor Mech. Overhead 347 days Mon 1/12/09 Tue 5/11/102 Overhead Dwg. Posting 10 days Mon 1/12/09 Fri 1/23/09 0
3 Coordinate Drawings 48 days Mon 1/19/09 Wed 3/25/09 78
4 Fab Branches 30 days Fri 1/23/09 Thu 3/5/09 83
5 Install Sanitary/Sorm and Vent Riser 17 days Thu 3/19/09 Fri 4/10/09 -29
6 Install Carriers 12 days Wed 4/1/09 Thu 4/16/09 84
7 Install Sanitary/Storm and Vent Piping 21 days Wed 4/1/09 Wed 4/29/09 -37
8 Install Duct Risers in Shafts 14 days Tue 4/7/09 Fri 4/24/09 63
9 Complete Test Sanitary/Storm 8 days Thu 4/16/09 Mon 4/27/09 193
10 Install Showers 12 days Thu 4/16/09 Fri 5/1/09 55
11 Install Duct Mains 30 days Thu 4/23/09 Wed 6/3/09 -104
12 Install Rack Piping (OH Domestic HW) 16 days Thu 5/14/09 Thu 6/4/09 -51
13 Install HVAC Equipment 31 days Thu 5/14/09 Thu 6/25/09 -105
14 Install Medical Gas Risers/Mains OH 15 days Tue 6/2/09 Mon 6/22/09 84
15 Install Water Run Outs 22 days Tue 6/2/09 Wed 7/1/09 143
16 Install Duct Branchees 35 days Thu 6/4/09 Wed 7/22/09 -106
17 Install Gas Run Outs 10 days Fri 6/12/09 Thu 6/25/09 80
18 Install OH CHW/RHHW/Steam Mains 31 days Fri 6/12/09 Fri 7/24/09 134
19 Complete Duct Testing 10 days Thu 6/25/09 Wed 7/8/09 116
20 Install OH CHW/RHHW/Steam Run Outs 26 days Mon 7/6/09 Mon 8/10/09 77
21 Install OH CHW/RHHW/Steam Connections 28 days Thu 7/23/09 Mon 8/31/09 70
22 Complete Test CHW and RH/HW 6 days Wed 8/12/09 Wed 8/19/09 70
23 Install In-Wall Plumbing 23 days Fri 9/11/09 Tue 10/13/09 -49
24 Public/Staff Toilet RI 5 days Fri 9/18/09 Thu 9/24/09 85
25 Complete Test Gas 5 days Mon 8/24/09 Fri 8/28/09 5
26 Complete Test Water 6 days Tue 9/29/09 Tue 10/6/09 78
27 Insulate Piping 30 days Tue 11/17/09 Mon 12/28/09 34
28 Insulate Ductwork 40 days Thu 12/10/09 Wed 2/3/10 29
29 Identify & Tag 30 days Mon 2/8/10 Fri 3/19/10 24
30 Install Plumbing Fixtures and Trim 23 days Fri 2/19/10 Tue 3/23/10 53
31 Install Grilles, Registers & Diffusers 30 days Wed 3/31/10 Tue 5/11/10 61
5 30 25 19 13 10 4 29 24 18 13 7 1 26 21 15 10 4 29 23 20 14 9 3Nov 2, ' Dec 28, Feb 22, Apr 19, Jun 14, Aug 9, ' Oct 4, ' Nov 29, Jan 24, Mar 21, May 1
Task
Split
Progress
Milestone
Summary
Project Summary
External Tasks
External Milestone
Deadline
Page 1
Project: JHH New Clinical BuildingSchedule: Baseline Typ. Floor Mech. OverheadDate: 4/7/09

Weiger – Final Report 76 | P a g e
The Install Grilles, Registers & Diffusers can be deleted because this will not be necessary with the chilled beams. The VAV boxes are included in the duration for Install Duct Branches. A new line item for Install Chilled Beams must be added. The following calculation can be used to determine the duration.
Typical Floor Area = 113,805 SF
Chilled Beam Cost per Floor = 113,805 SF x $3.81/SF = $433,597
Chilled Beams Cost per Foot = $280/lf
Total Amount of Linear Foot of Chilled Beams per Floor = $433,597 ÷ $280/lf = 1,549 lf
Typical Beam is 6ft
Quantity of Beams per Floor = 1,549 lf ÷ 6 ft/beam = 258 beams
Pierce Associates estimates that a crew can install 5 beams/day
Total Duration per Floor = 258 beams ÷ 5 beams/day = 52 days
With this information, the baseline can be adjusted to reflect the new durations. The Install Chilled Beams activity will follow the Install Overhead Chilled Water/Steam (OH CHW/Steam) Connections. This will push the Complete Test CHW activity back. However, there is enough float in that activity to absorb the extended duration.
After reevaluating the schedule, it was found that the activities that are accelerated (Ductwork and HVAC Equipment) are on the critical path while the activities that are extended have a great deal of float. The result is that the critical path is accelerated 31 working days while the extra time for piping reduces the float but still does not hit the critical path.
The following page shows the new chilled beam overhead schedule. Note the changes in float as compared to the original baseline schedule. The changes in durations are reflected in the days of float.

ID Task Name Duration Start Finish Float
1 Typ. Floor Mech. Overhead 312 days Mon 1/12/09 Tue 3/23/102 Overhead Dwg. Posting 10 days Mon 1/12/09 Fri 1/23/09 03 Coordinate Drawings 48 days Mon 1/19/09 Wed 3/25/09 784 Fab Branches 30 days Fri 1/23/09 Thu 3/5/09 835 Install Sanitary/Sorm and Vent Riser 17 days Thu 3/19/09 Fri 4/10/09 -296 Install Carriers 12 days Wed 4/1/09 Thu 4/16/09 847 Install Sanitary/Storm and Vent Piping 21 days Wed 4/1/09 Wed 4/29/09 -378 Install Duct Risers in Shafts 10 days Tue 4/7/09 Mon 4/20/09 679 Complete Test Sanitary/Storm 8 days Thu 4/16/09 Mon 4/27/09 19310 Install Showers 12 days Thu 4/16/09 Fri 5/1/09 5511 Install Duct Mains 21 days Thu 4/23/09 Thu 5/21/09 -9512 Install Rack Piping (OH Domestic HW) 16 days Thu 5/14/09 Thu 6/4/09 -5113 Install HVAC Equipment 19 days Thu 5/14/09 Tue 6/9/09 -9314 Install Medical Gas Risers/Mains OH 15 days Tue 6/2/09 Mon 6/22/09 8415 Install Water Run Outs 22 days Tue 6/2/09 Wed 7/1/09 14316 Install Duct Branchees 25 days Thu 6/4/09 Wed 7/8/09 -9617 Install Gas Run Outs 10 days Fri 6/12/09 Thu 6/25/09 8018 Install OH CHW/Steam Mains 85 days Fri 6/12/09 Thu 10/8/09 8019 Complete Duct Testing 10 days Thu 6/25/09 Wed 7/8/09 11620 Install OH CHW/Steam Run Outs 72 days Mon 7/6/09 Tue 10/13/09 3121 Install OH CHW/Steam Connections 77 days Thu 7/23/09 Fri 11/6/09 2122 Install Chilled Beams 52 days Wed 9/2/09 Thu 11/12/09 523 Complete Test CHW 6 days Fri 11/13/09 Fri 11/20/09 524 Install In-Wall Plumbing 23 days Fri 9/11/09 Tue 10/13/09 -4925 Public/Staff Toilet RI 5 days Fri 9/18/09 Thu 9/24/09 8526 Complete Test Gas 5 days Mon 8/24/09 Fri 8/28/09 527 Complete Test Water 6 days Tue 9/29/09 Tue 10/6/09 7828 Insulate Piping 30 days Tue 11/17/09 Mon 12/28/09 3429 Insulate Ductwork 40 days Thu 12/10/09 Wed 2/3/10 2930 Identify & Tag 30 days Mon 2/8/10 Fri 3/19/10 2431 Install Plumbing Fixtures and Trim 23 days Fri 2/19/10 Tue 3/23/10 53
5 30 25 19 13 10 4 29 24 18 13 7 1 26 21 15 10 4 29 23 20 14Nov 2, ' Dec 28 Feb 22, Apr 19, Jun 14, Aug 9, ' Oct 4, ' Nov 29 Jan 24, Mar 21
Task
Split
Progress
Milestone
Summary
Project Summary
External Tasks
External Milestone
Deadline
Page 1
Project: JHH New Clinical BuildingSchedule: Chilled Beam Typ. Floor Mech. OverheadDate: 4/7/09
Weiger – Final Report 78 | P a g e
Accelerating the typical floor overhead mechanical installation by 31 working days is significant. This equates to 9 floors (60% of the building) that save 31 working days each. Assuming that every floor had the same schedule (it does not, but assume this for calculation purposes) the entire overhead can be accelerated by 279 working days, or almost 13 months. In order to accurately determine the schedule impact, the entire building schedule must be analyzed. However, this is beyond the scope of this thesis.
What can be determined from this analysis is that the mechanical overhead installation would be taken off the critical path of the project if chilled beams are used. Another activity, like interior finishes would then be pushed to the critical path. This could potentially pick up a few days in the overall building schedule.
The most important part of this finding is that the affect of the mechanical system changes can be reduced. Using a chilled beam system could have reduced the delay because the system can be installed much faster.
6.6 Conclusion A Chilled Beam HVAC system proves to be a viable alternative to a VAV system for this project. The analysis proved there was significant savings in first cost as well as life‐cycle cost. The schedule impact of the new system showed that the mechanical overhead could be taken off the critical path if this system was used.
Ultimately, the owner’s two main goals – to deliver this project on/under budget and on time has the most potential to be met with the chilled beam system. Although it is too late to use this system on this project, it does show that if this system would have been analyzed in preconstruction, it could have been selected as the primary system for the non‐invasive spaces.
Although, many assumptions were made in this analysis, they were made in cooperation with industry experts and are appropriately accurate for an analysis of this level of detail. If this would have been done in the preconstruction phase, it would have determined the system is a viable alternative and would have required more research and calculations by industry experts.
During preliminary research for chilled beams, it was found that industry experts thought the initial cost of chilled beams would be 8‐12% more than a conventional VAV system. However, this project was much different than a typical building which made chilled beams cheaper initially. The NCB had access to a central utility plant where the resources of chilled water and steam were assumed to be adequate. For this reason, the HVAC costs did not include chillers, boilers, cooling towers, etc. The NCB’s ductwork costs accounted for 48% of the total budget, which is the area that saw the most cost savings. While, most of the savings were offset by increases in piping, the savings in floor‐to‐floor height yielded the largest initial cost savings.
The energy savings associated with the more efficient chilled beams proves to be the biggest savings to the owner. Assuming a very conservative 15% savings in energy cost demonstrated a substantial savings even in the first few years.

Weiger – Final Report 79 | P a g e
Possibly the most important part of the findings is the schedule savings. While more time was required to complete a typical floor because of the increase in piping (as seen in the increase cost of labor for piping), the critical activities were taken off the critical path. The result is the mechanical overhead is taken off the critical path of the entire project.
The changes in the mechanical system that have caused a 7 month delay in the project schedule would likely be absorbed in the savings in installation time with the chilled beams. Although, no detail analysis of the change orders and how they would directly affect the chilled beam system was conducted, the mechanical contractor felt it would provide significant savings.
This analysis concludes that chilled beams will likely become more popular in the U.S. marketplace. Further research on cost and schedule data is needed to accurately estimate the impact of a chilled beam system because the industry is relatively unfamiliar with the system.

Weiger – Final Report 80 | P a g e
7.0 Analysis 3: Case Study ‐ Concrete Over‐pour on Decks Due to Steel Deflection (Structural Breath)
7.1 Background A constructability issue that is not unique to this project is the over‐pouring of concrete on decks due to steel deflection in order to meet floor flatness (FF) and levelness (FL) specifications.
Some buildings require stricter floor flatness and levelness criteria than others. For example, a warehouse often requires strict guidelines because if a fork‐lift is hoisting material in the air, it is crucial that the floor is level so it does not cause the fork‐lift to overturn.
JHH NCB requires a moderately strict FF specification of 25 (equal to ¼” over 10’). There is no FL requirement in the specifications. However, the structural drawing notes call for the floors to be poured exactly level, regardless of deflection (see Figure 26 below). The main driving force for this specification is the sophisticated medical equipment throughout the building and the need to roll patient beds around the building.
7.2 Problem Statement The concrete subcontractor poured the concrete decks to finish floor elevation, not to deck thickness which is required per note CP‐4. The concrete acts as a live load during the pours and on this project caused the steel to deflect up to 2” in some cases because no shoring was required.
The concrete contractor was responsible for all over‐pour which amounted to 1,200 CY in concrete. This amounted to a substantial amount of money and labor. Another potential problem from this could have been overloading the floor which would have required reinforcing the structure. Finally, the deflection has the potential to impact the coordination of the MEP systems in the ceiling plenum. It is not yet known if that will be a problem on this project because the MEP is not installed in the problematic areas of the building.
7.3 Goal The goal of this analysis is to examine how the concrete over‐pour issue was addressed in the design, bid, and construction phases. This will require the calculation of deflection and over‐pour concrete for a typical bay. Finally, a strategy for addressing this problem in each of the phases will be suggested.
Figure 26: Structural Note CP‐4 on drawings

Weiger – Final Report 81 | P a g e
7.4 Resources Turner Construction – Jim Faust Thornton Tomasetti – Zach Kates (Structural Engineer) Clark Construction – Joe Salerno Clark Construction – Lynore Arkin‐Yetter Clark Concrete – Steve Dare Penn State – Dr. Linda Hanagan
7.5 Analysis
Design Phase The structural engineer for this project was contacted to discuss how this issue was incorporated in the design. The following is what was learned:
• Predicting deflection under loads is quite difficult because actual loads can vary significantly from design loads
• Only use camber on beams because the loads on their distributed area is predictable o Typically camber accounts for 75% of total deflection
• Cannot predict the loads on girders because the distributed area is much larger and unpredictable o Do not camber girders
• Typical to require level floors in hospital • Note CP‐4 is not common • No constructability consulting was done with a contractor • Engineer allowed 7 PSF for concrete over‐pour in construction load design

Weiger – Final Report 82 | P a g e
The typical bay is 28’‐8” by 28’‐8” with W21x57 (c=0”) girders and W16x26 (c=3/4”) beams with 3 equal spaces (see Figure 27 below).
Design Loads Construction Load = 85 PSF (includes 7 PSF for concrete over‐pour) Superimposed Load = 20 PSF Live Load = 100 PSF
28’‐8”
28’‐8
”
W16x26 c = ¾”
W16x26 c = ¾”
W16x26 c = ¾”
W16x26 c = ¾”
EQ.
EQ.
EQ.
EQ.
W21
x57 c = 0”
W21
x57 c = 0”
Figure 27: Typical Bay Plan
W16x26 c = ¾”
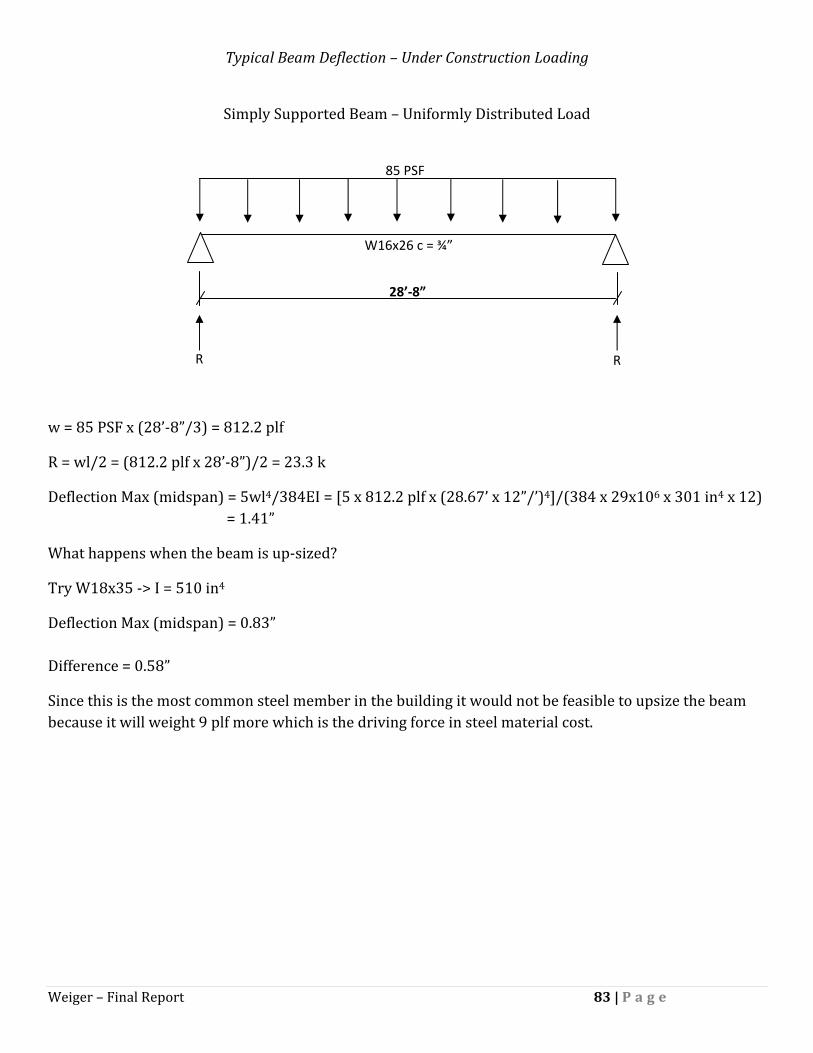
Weiger – Final Report 83 | P a g e
Typical Beam Deflection – Under Construction Loading
Simply Supported Beam – Uniformly Distributed Load
w = 85 PSF x (28’‐8”/3) = 812.2 plf
R = wl/2 = (812.2 plf x 28’‐8”)/2 = 23.3 k
Deflection Max (midspan) = 5wl4/384EI = [5 x 812.2 plf x (28.67’ x 12”/’)4]/(384 x 29x106 x 301 in4 x 12) = 1.41”
What happens when the beam is up‐sized?
Try W18x35 ‐> I = 510 in4
Deflection Max (midspan) = 0.83” Difference = 0.58”
Since this is the most common steel member in the building it would not be feasible to upsize the beam because it will weight 9 plf more which is the driving force in steel material cost.
W16x26 c = ¾”
28’‐8”
85 PSF
R R

Weiger – Final Report 84 | P a g e
Typical Girder Deflection – Under Construction Loading
Simply Supported Girder – 2 Equal Concentrated Loads Symmetrically Placed
R = P1 = P2 = 23.3 k
Deflection Max (midspan) = (Pa/24EI) x (3l2 – 4a2)
= {[(23.3 x 28.667 x 12)/3] / (24 x 29,000 x 1,170)} x [3(28.667 x 12)2 – 4(28.667 x 4)2]
= 0.99”
Allowable Deflection = L/360 = 0.96” Very Close – OK
What happens when the girder is up‐sized?
Try W24x55 ‐> I = 1,350 in4
Deflection Max (midspan) = 0.85” Difference = 0.15”
Assuming this member would still meet design shear and moment loads, it would not be worth going to a 3” deeper member because it would reduce the ceiling plenum space by 3”.
W21x57 c = 0”
28’‐8”
EQ. EQ. EQ.
P1 = 23.3k P2 = 23.3k

Weiger – Final Report 85 | P a g e
Total Volume of Deflection
Beam Deflection = 1.41” – 0.75” (camber) = 0.66” (See Figure 28 below)
Girder Deflection = 0.99” (See Figure 29 on the following page)
Total Deflection in the Center of the Bay = 1.65” (See Figure 30 on the following page)
Assumption: Deflection can be approximated as a triangle
∆ = 0.66”
∆ = 0.66”
Figure 28: Illustration of Beam Deflection (No Girder Deflection Shown)

Weiger – Final Report 86 | P a g e
∆ = 0.99”
∆ = 0.99”
Figure 29: Illustration of Girder Deflection (No Beam Deflection Shown)
Figure 30: Illustration of Total Deflection (No Center Beams Shown for Visualization)
∆Total = 0.1.65”
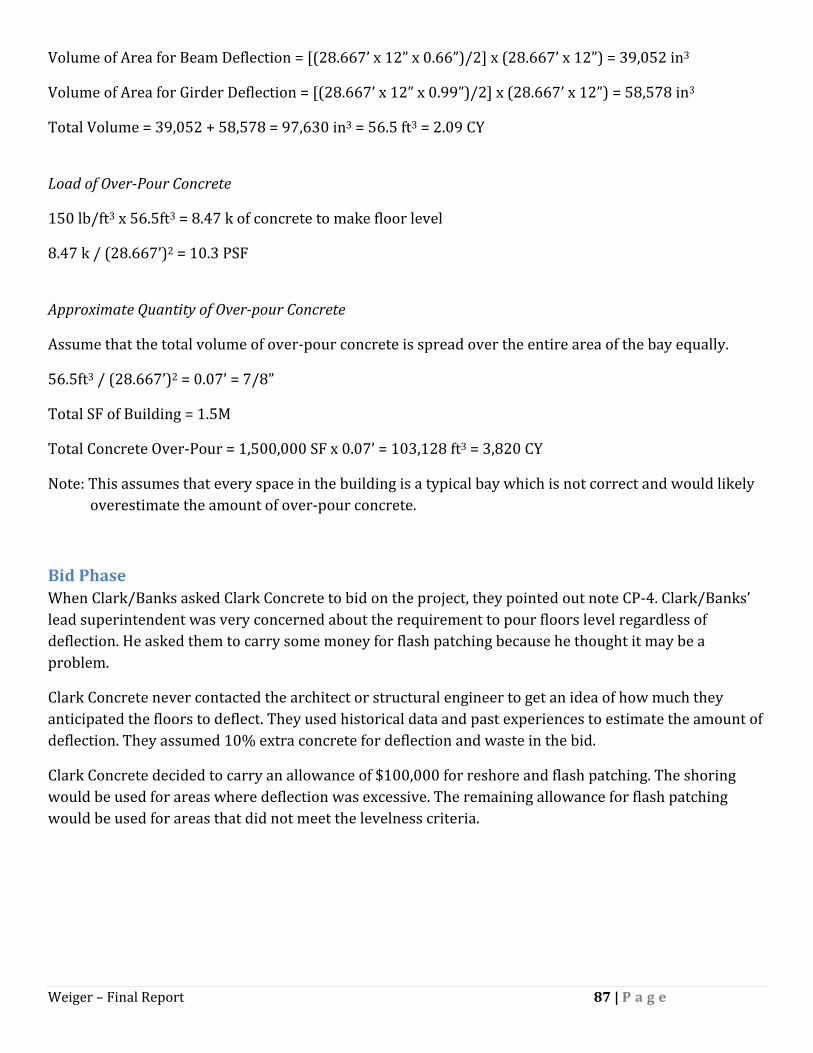
Weiger – Final Report 87 | P a g e
Volume of Area for Beam Deflection = [(28.667’ x 12” x 0.66”)/2] x (28.667’ x 12”) = 39,052 in3
Volume of Area for Girder Deflection = [(28.667’ x 12” x 0.99”)/2] x (28.667’ x 12”) = 58,578 in3
Total Volume = 39,052 + 58,578 = 97,630 in3 = 56.5 ft3 = 2.09 CY
Load of OverPour Concrete
150 lb/ft3 x 56.5ft3 = 8.47 k of concrete to make floor level
8.47 k / (28.667’)2 = 10.3 PSF
Approximate Quantity of Overpour Concrete
Assume that the total volume of over‐pour concrete is spread over the entire area of the bay equally.
56.5ft3 / (28.667’)2 = 0.07’ = 7/8”
Total SF of Building = 1.5M
Total Concrete Over‐Pour = 1,500,000 SF x 0.07’ = 103,128 ft3 = 3,820 CY
Note: This assumes that every space in the building is a typical bay which is not correct and would likely overestimate the amount of over‐pour concrete.
Bid Phase When Clark/Banks asked Clark Concrete to bid on the project, they pointed out note CP‐4. Clark/Banks’ lead superintendent was very concerned about the requirement to pour floors level regardless of deflection. He asked them to carry some money for flash patching because he thought it may be a problem.
Clark Concrete never contacted the architect or structural engineer to get an idea of how much they anticipated the floors to deflect. They used historical data and past experiences to estimate the amount of deflection. They assumed 10% extra concrete for deflection and waste in the bid.
Clark Concrete decided to carry an allowance of $100,000 for reshore and flash patching. The shoring would be used for areas where deflection was excessive. The remaining allowance for flash patching would be used for areas that did not meet the levelness criteria.

Weiger – Final Report 88 | P a g e
Construction Phase Before any of the decks were poured, Clark/Banks held a pre‐construction meeting with Clark Concrete. The structural engineer was not asked to attend. Three options were discussed as possible ways to address the problem:
1. Shore the steel to reduce deflection until the concrete cures and can support some tension 2. Pour concrete to thickness by wet‐sticking the concrete and coming back later to flash patch areas
that were not level 3. Pour concrete to level and pay for the extra concrete
Clark Concrete concluded that option 1 required extensive labor to set‐up shores and it was unclear how much creep could be expected after the shores were removed. Option 2 also required extensive labor. It would also mean that they would have to wait until the concrete cured before they could flash patch. By this time other trades may be working on the floor which would have made it difficult to work around them. Clark Concrete finally decided that option 3 was the best because it had the least amount of risk.
Clark Concrete began pouring the decks and kept track of the over‐pour concrete by checking the truck tickets. They found that deflection was a significant problem but they believed that they could cover the over‐pour concrete with the $100k allowance for reshore and flash patching.
While pouring concrete on the cantilever structure on the south face of the CT, the steel deflection began to become a serious problem. The cantilever structure is a truss system with cross bracing (see Figure 31 on the following page). As the lower levels of the cantilever were poured it became evident that the cantilever was sagging because the steel cross bracing on the floors above were not lining up with their bolt holes.
The connections were slip critical and had slotted bolt holes (see Figure 32 on the following page). A survey later conducted concluded that the steel was set in place by the crane and was not surveyed to make sure the steel was set level. The slotted holes in the connection allowed the steel to sag about ¼”. It was also found that the columns were set ¾” low. This could have been caused by settlement or the base plates may not have been grouted correctly. This all added up to a 1” sag in the cantilever.
The structural engineer required additional gusset plates to be welded on the connections to strengthen the structure. The following floors were surveyed during construction so the steel was set correctly.
Following these findings, Clark/Banks realized that steel deflection was a significant problem that had the potential to impact the MEP coordination. While all of the coordination was being done with 3D BIM, the tolerances were very close. Clark/Banks MEP coordination team decided to allow a 1 ½” buffer for steel deflection. To date they have not encountered any conflicts with MEP and steel deflection.
By the time that all of the concrete decks were poured out, Clark Concrete had poured 1,200 CY of extra concrete due to steel deflection. The extra cost was approximately $100,000 for the over‐pour concrete. Clark Concrete decided to use their allowance for reshore and flash patching to cover this instead of submitting a change order to the owner. During construction they had no difficulty meeting levelness and FF requirements so they did not have to use any of the money in this budget.

Weiger – Final Report 89 | P a g e
G
Figure 31: Structural drawing S6.03 depicting the cantilever structure on the south face of the CT
Figure 32: Structural Detail of Slip Critical Connection
Elongated Holes for Slip Critical Connection

Weiger – Final Report 90 | P a g e
After the decks were poured out the structural engineer conducted a survey of the concrete decks. They found that the typical bay deflected on average 1 ½” as predicted by the deflection calculations. The engineer ran the calculations and determined that the structure was capable of supporting the over‐pour concrete.
7.6 Conclusion The problem of over‐pour concrete due to steel deflection on metal deck floors is a common problem on construction sites. The degree of significance varies depending on FF, FL, bay size, steel members, and owner requirements. Most projects can get away with just wet sticking the concrete to thickness and still meet FF and FL requirements. The important point of this analysis is to be aware of the requirements and determine if it will a problem on the project in question.
It was clear from the beginning that the JHH project was going to have a steel deflection issue when constructing the decks. By examining what happened on this project, I have identified several areas of improvement. The following is a list of suggestions and recommendations that can be applied to any project.
Design
• Any FF, FL, or notes similar to note CP‐4 should be clearly called out in the specifications and drawings.
o An industry standard for location and format would be most beneficial • The structural engineer should calculate the predicted deflection for a typical bay and should
include that in the contract drawings as a guideline, not a specification. • In buildings that require strict FF and FL requirements such as hospitals and warehouses, the
engineer should consult with a contractor for a constructability review.
Bid
• The concrete contractor should request from the A/E the expected deflection for a typical floor. o The contractor should create an allowance based on this figure so that any cost under the
allowance can be given back to the owner and any cost over can be covered by the owner.
Construction
• The pre‐construction meeting should include the structural engineer, steel contractor, flooring contractor, and MEP coordination staff.
• After each floor is poured, a simple survey should be conducted to determine the amount of deflection to check to see if it is as expected.
o Consult with structural engineer to make sure that the structure is capable of handling extra concrete load.
• The camber in the beams should be checked in the shop and in the field to make sure the correct amount of camber exists.
• An allowance equal to the expected girder deflection (in most cases) should be included in the MEP coordination.

Weiger – Final Report 91 | P a g e
The biggest lesson learned from this case study is that a more integrated team approach from the beginning could have eliminated most of the risk and therefore the cost impact that goes along with this common constructability challenge.

Weiger – Final Report 92 | P a g e
8.0 Research Conclusions
The goal of this thesis was to identify ways to reduce the impact of changes and constructability challenges on the NCB project. The results are as follows: Analysis 1: Alternative Project Delivery Method (MAE Requirement)
A traditional delivery method with early procurement, a project manager, integrated project delivery principles, and design‐build MEP contractors would have reduced the risk of changes and managed the rest more efficiently.
Analysis 2: Chilled Beams Cost & Schedule Impact (Mechanical Breadth)
The Chilled Beam HVAC system used in non‐invasive spaces in the NCB would have saved $3,207,684 initially and an additional $13.4 M ‐ $31.3 M over a 30 year life‐cycle. It would also allow JHH to generate an additional income of $18,125,537 per year. The system would also save an average of 31 working days on a typical floor. This would take the mechanical overhead off the critical path of the building schedule. This system would be able to absorb many of the changes and delays encountered thus far on the NCB project.
Analysis 3: Case Study Concrete Overpour on Decks Due to Steel Deflection (Structural Breadth)
A failure to communicate early in the design, bid, and construction phases put the concrete contractor at financial risk. The NCB project had a strict levelness specification that required the contractor to over‐pour the decks. The result was 1,200 CY of extra concrete that amounted to $100,000 of exposure to the concrete contractor. Further projects can avoid this problem by working with the structural engineer to determine the expected deflections. An allowance should be carried by the contractor to avoid the financial risk associated with this problem.
This thesis was successful in meeting the goals outlined by the author. All areas identified as important skills for a CM were clearly demonstrated in the analyses. Areas of breadth were also demonstrated in the mechanical and structural fields.

Weiger – Final Report 93 | P a g e
Appendix A – Hygiene Chilled Beam Product Data Sheets
See the following page for product data sheets on the Frenger Pilot Active Chilled Beam.