Embed Size (px)
Citation preview

John Wood Group PLCAnnual Report and Accounts 2015

Contents
Strategic report
Our operations, strategy and business model and how we have performed during 2015
“Against a backdrop of significantly reduced customer activity, the Group delivered EBITA of $470m in line with expectations and 14.5% lower than 2014. Our continued actions to reduce costs, improve efficiency and broaden our service offering through organic initiatives and strategic acquisitions, position us as a strong and balanced business in both the current environment and for when market conditions recover”
Robin Watson, Chief Executive

Financial statementsGovernanceStrategic report
John Wood Group PLC Annual Report and Accounts 2015 01
Highlights
$5,852m
(2014: $7,616m)
23.2%
$470m
(2014: $550m)
14.5%
$5,001m
(2014: $6,574m)
23.9%
$320m
(2014: $414.5m)
22.8%
84.0cents
(2014: 99.6c)
15.7%
30.3
(2014: 27.5 cents)
10.2%
Total Revenue 1
Total EBITA 1
Revenue from continuing operations
Profit before tax and exceptional items
Adjusted diluted EPS
Total Dividend
Operational Highlights
X Relatively resilient performance. EBITA of $470m in line with expectations; 14.5% lower than 2014
X Management focus on operational utilisation
X Delivered overhead cost savings of over $148m which will sustain into 2016
X Underlying headcount reduced by over 8,000 people (c. 20%)
X Continued progress on strategic acquisitions including expansion into the US brownfield petrochemical market. Total cash expenditure on new acquisitions of $234m
X Strong balance sheet and cash generation. Net debt of $290m (0.5x 2015 EBITDA) and cash conversion of 119%
X Dividend up 10%. Dividend cover of 2.8 times. Intention remains to increase the dividend for 2016 by a double digit percentage
Wood Group Engineering
X Falls in activity in Upstream and Subsea
X Growth in Downstream and robust performance in Onshore Pipelines
X Breadth and diversity positions us well to provide project solutions to our clients
Wood Group PSN
Production Services X US onshore impacted by significant pressure on
volumes and pricing
X North Sea impacted by reduction in project and non-essential maintenance work and efficiency initiatives
X Relatively robust activity in our International business
X Good opportunities internationally and will benefit from completed acquisitions
Turbine Activities X Previously indicated exceptional non-cash impairment
of EthosEnergy of $159m
cents per share
1. Total revenue and Total EBITA include the contribution from joint ventures and, in 2014, activities classified as discontinued. Total EBITA represents operating profit including JVs on a proportional basis before the deduction of amortisation and net exceptional expense and is provided as it is a key unit of measurement used by the Group in the management of its business.
Financial Summary

John Wood Group PLC Annual Report and Accounts 201502
Our business
Clean energy
Operations, maintenance & modifications
Subsea & pipeline
Downstream, chemical process, automation & industrial
Unrivalled technical capability and experience
Talented, flexible and motivated workforce
Innovative, efficient and effective processes
Efficient capital allocation and robust balance sheet
Low risk commercial model
Strong core values
How we create and sustain valueBusiness model attributes
X Wood Group is an international projects, production and specialist technical solutions provider with around $6bn sales and 36,000 employees.
X We are focused primarily on the provision of engineering and production support solutions on a reimbursable basis to the upstream, midstream and downstream oil & gas sector.
X We help customers design, build, maintain and safely operate facilities through asset lifecycles.
X As an asset-light, people focused business, our track record on industry leading projects is driven by our expertise and capability.
Safety first attitude

Financial statementsGovernanceStrategic report
John Wood Group PLC Annual Report and Accounts 2015 03
Industrial services
Facility construction maintenance management Upstream
Decommissioning services
Unrivalled track record on industry leading projects
Leading engineering and production support solutions
Global reach with long-term customer relationships
Significant contribution to local employment and communities
Strong shareholder returns (AEPS 2002 to 2015 annualised growth of 13%)
Business outputs
Wood Group Engineering (c. 30% revenue)
Through Wood Group Mustang and Wood Group Kenny, we provide a wide range of specialist engineering services including conceptual studies, engineering, project & construction management (EPCM) and control systems upgrades to the upstream, subsea & pipeline, downstream, chemical process, automation & industrial and clean energy sectors.
35% 40% 25%
Business split:
Upstream Subsea & pipeline
Downstream, process & industrial
Customer Profile:
20% 25% 15% 40%
Independent IOC NOC Other
Wood Group PSN (c. 70% revenue)
We provide services to the upstream, midstream,downstream & industrial sectors through brownfield engineering and modifications, production enhancement, operations and maintenance, facility construction and maintenance management, industrial services, training and decommissioning services.
Business split:
North Sea Americas International
40% 40% 20%
Customer Profile:
45% 40% 5% 10%
Independent IOC NOC Other

John Wood Group PLC Annual Report and Accounts 201504
Measuring performance
We want to be recognised as the best technical services company to work with, work for, and invest in, with a relentless focus on excellence.
EBITA divided by average capital employed measures our ability to generate profits relative to the capital required to support our business.
The reduction in return on capital employed reflects the lower EBITA for the year.
We aim to deliver the highest standards of health and safety. Total recordable case frequency is the total of lost work cases, restricted work cases and medical treatment cases, per million man hours.
We had an 11% increase in our total recordable case frequency (TRCF) in 2015; although incidents reduced by 14% in the year, hours worked reduced by over 20%.
The cash conversion ratio is post working capital cash flow divided by EBITDA.
The Net debt: EBITDA ratio measures our ability to service our debt.
We remain at the lower end of our preferred net debt: EBITDA range of 0.5 to 1.5 times.
Net debt: EBITDA ratio
times
Lost work case frequency measures lost work cases per million man hours.
We had no fatalities in 2014 or 2015 and made positive progress in our lost work case frequency (LWCF) with an 11% improvement in 2015.
Adjusted diluted EPS represents earnings before exceptional items and amortisation, net of tax, divided by the weighted average number of shares during the year.
AEPS reduced 16% in 2015 reflecting reduced earnings.
Safety:
Lost work case frequency (LWCF)
per million man hours2015
0.40
0.65
2012
0.70
2013 2014
0.45
Total recordable case frequency (TRCF)
per million man hours
Financial:
Cash conversion
%0.3
0.5
2012 2013 2014
0.5
2015
0.5
EBITA margin demonstrates our ability to convert revenue into profit.
EBITA margin increased in the year, benefitting from a focus on utilisation, significant cost savings and non-recurring items which offset significant volume and pricing pressure.
The share of AEPS distributed to shareholders.
We delivered in line with our previously stated intention for 2015 of double digit growth.
EBITA margin
% 6.7 7.5
2012 2013 2014
7.2
2015
8.0 Dividend per ordinary share
cents
85.298.6
2012 2013 2014
99.6 Return on capital employed
%
Adjusted diluted EPS
cents19.3 19.4
2012 2013 2014
17.7
2015
16.3
1.99 1.81
2012 2013 2014
1.39
2015
1.54
2015
84.0
70
104
2012 2013 2014
98
2015
119
17.022.0
2012 2013 2014
27.5
2015
30.3

Financial statementsGovernanceStrategic report
John Wood Group PLC Annual Report and Accounts 2015 05
Chair’s statement
IntroductionDuring 2015, the Board focused on supporting the executive leadership team in its response to a tough trading environment. Overall, the Group performed in line with expectations, benefitting from the flexibility of an asset-light model and the delivery of significant and sustainable overhead cost savings, while continuing to invest in strategic acquisitions and organic growth.
MarketsConditions in the oil & gas markets became increasingly challenging in 2015. During the year, oil prices fell by around a further 30% and global exploration and production (E&P) capital expenditure was down approximately 20%. The expectation of a lower-for-longer commodity price environment has prompted many E&P customers to reassess capex and opex spending plans. Industry commentators are anticipating further spending reductions in 2016, which would represent the first consecutive annual declines in spending in more than 20 years. In other markets we have seen more resilient demand for our services.
DividendThe Board has recommended a final dividend of 20.5 cents per share, which makes a total distribution for the year of 30.3 cents, an increase of 10% in line with previously stated intentions. The dividend cover ratio was 2.8 times (2015: 3.6 times). There is no change to our dividend approach, and our intention is to increase the dividend per share for 2016 by a double digit percentage.
Executive Board changesAs planned, following the AGM in May, David Kemp assumed the role of Group CFO following an interim period as deputy CFO. David has been with the Group since 2013 in the position of Wood Group PSN CFO. David succeeded Alan Semple who retired from Wood Group on 13 May 2015, following 15 years in the CFO role. Alan was an excellent financial leader of the Group and the Board, and we are grateful for his noteworthy contribution.
In October, we announced the appointment of Robin Watson as Chief Executive, effective 1 January 2016. Robin has been with the Group since 2010 and has served on the Board since 2013, initially as CEO of Wood Group PSN and then, since April 2015, as Group COO. Robin succeeds Bob Keiller who retired from Wood Group on 31 December 2015. I would like to thank Bob for his significant contribution to the Group, both following the acquisition of PSN in 2011, and during his three years as CEO. Robin was identified as the stand-out candidate to succeed Bob as part of our succession planning process, and his appointment will ensure important continuity for our people and customers.
Wood Group is well placed to develop further its offering of technical solutions and I look forward to the Group’s continued success under the leadership and direction of Robin and his executive leadership team.
Ian Marchant, Chair
"The Group performed in line with expectations, benefitting from the flexibility of an asset-light model and the delivery of significant overhead cost savings, while continuing to invest in strategic acquisitions and organic growth."

John Wood Group PLC Annual Report and Accounts 201506
Chief Executive review
"My initial objectives for 2016 are simple: to control what we can control; to ensure our business is appropriately structured to improve delivery to customers; to continue to generate cost savings; to develop our best talent; to continue to invest both organically and through acquisition; and create value for shareholders."
Wood Group is a company with a rich heritage of providing smart, technical solutions that create and sustain value for customers. My initial objectives are simple: to ensure our business is appropriately structured to improve delivery to customers; to continue to generate cost savings; to develop our best talent; to continue to invest both organically and through acquisition; and create value for shareholders.
During 2015, in my role as COO, we faced a very challenging macro environment. Our principal focus was on controlling what we could control; we worked with customers to develop efficient solutions, stayed focused on managing our utilisation and ensuring the delivery of significant and sustainable overhead cost savings of $148m. Challenging conditions prevailed throughout the year and we had to make some tough decisions which had a direct and significant impact on our people. Our underlying headcount is down by over 8,000 people (20%) compared to December 2014.
These initiatives contributed to our relatively resilient financial performance in 2015, despite a 23% fall in revenues. Against a backdrop of significantly reduced activity across the oil services sector, the Group delivered EBITA of $470m in line with expectations, down 14.5% on 2014. Adjusted EPS of 84.0c was down 16%. EBITA margins rose by 0.8%. The delivery of overhead cost savings and strict management of utilisation in the face of reduced volumes and pricing pressure was supplemented by one-off credits in the first half. These related to the successful conclusion of downstream projects in Engineering, and the release of a provision for deferred consideration relating to a previously completed US onshore acquisition in Wood Group PSN.
We maintained our strong focus on strategic M&A in 2015 and, as anticipated, the environment for completing acquisitions improved in the second half. Following the earlier acquisitions of Automated Technology Group (ATG) and Beta Machinery Analysis, in December we acquired Infinity, creating a brownfield service offering to the buoyant US petrochemical market, and Kelchner, enhancing our US onshore footprint by adding exposure to the Marcellus gas basin as well as midstream and industrial markets. Total cash expenditure on new acquisitions in 2015 was $234m.
We continued to invest in our business, with $83m capex spent in the year on plant & infrastructure, design software and investment in ERP systems which has allowed us to consolidate and simplify our back office processes to improve service and reduce cost.
The Group continues to benefit from a strong balance sheet and we are comfortable with the flexibility, diversity and maturity of our funding following the extension earlier this year of our $950m bilateral facilities to 2020. Cash flow generation was strong in 2015, and net debt at the year-end was $290m, at the lower end of our typical range of 0.5 times to 1.5 times EBITDA. Cash conversion was 119%, calculated as post working capital cash flow divided by EBITDA. Our solid funding position facilitates productive reinvestment in our business. Organic investment and M&A remain our preferred uses of cash. There is no change to our dividend approach, and our intention is to increase the dividend per share for the full year 2016 by a double digit percentage in line with the increase in 2015.

Financial statementsGovernanceStrategic report
John Wood Group PLC Annual Report and Accounts 2015 07
2015 Group performance2015 2014
% Change
Total Revenue 1 $5,852m $7,616m (23.2)%
Total EBITA1 $470m $550m (14.5)%
EBITA margin 8.0% 7.2% 0.8pts
Revenue from continuing operations on an equity accounting basis $5,001m $6,574m (23.9)%
Profit from continuing operations before tax and exceptionals (after tax on JV profits) on an equity accounting basis
$320m $415m (22.8)%
Basic EPS 21.4c 87.9c (75.7)%
Adjusted diluted EPS2 84.0c 99.6c (15.7)%
Total dividend 30.3c 27.5c 10.2%
ROCE5 16.3% 17.7% (1.4)%
Note: The commentary on trading performance is presented based on proportionally consolidated numbers, which is the basis used by management to run the business. Total Revenue and Total EBITA include the contribution from joint ventures and, in 2014, activities classified as discontinued. Total EBITA represents operating profit including JVs on a proportional basis before the deduction of amortisation and net exceptional expense.
Outlook The challenging market conditions in the second half of 2015 have continued in the first quarter of 2016. Further spending reductions by customers will require continued focus on the controllable elements of our business. Our continued actions to reduce costs, improve efficiency and broaden our service offering through organic initiatives and strategic acquisitions, position us as a strong and balanced business in the current environment and when market conditions recover.
Robin Watson, Chief Executive

John Wood Group PLC Annual Report and Accounts 201508
Segmental review
2015 $m
2014 $m
% Change
Revenue 1,729 2,131 (18.9)%
EBITA 215 232 (7.5)%
EBITA margin 12.4% 10.9% 1.5pts
People3 8,900 11,200 (20.5)%
Wood Group Engineering
Through Wood Group Mustang and Wood Group Kenny, we provide a range of specialist engineering services including conceptual studies, engineering, project & construction management (EPCM); and control systems upgrades to the upstream, subsea & pipeline, downstream, chemical process automation & industrial and clean energy sectors. In Wood Group Engineering, revenue decreased by 19%, with significant falls in activity in Upstream and Subsea due to project deferrals and cancellations. This was partly offset by growth in downstream, process and industrial and robust performance in onshore pipelines. EBITA decreased by 7.5% however EBITA margin increased by 1.5pts to 12.4%. This reflected our focus on utilisation, overhead cost reduction initiatives, margin improvement in onshore pipelines and downstream and the successful completion of lump sum projects in downstream, process and industrial.
Our Upstream business accounted for around 35% of Engineering revenue. Throughout the year, we remained active on the Det Norske Ivar Aasen and Hess Stampede projects and will continue to provide operating support services into 2016, albeit diminishing through the year. We secured a number of longer-term contracts in the year including our six year Offshore Maintain Potential Programme contract with Saudi Aramco in June on which we have commenced work, and our six year c. $400m maintenance and modifications contract with Statoil in Norway. The market for new awards, particularly detailed design scopes, has been subdued as customers limit their capital expenditure, however we remain confident that early stage work is a good indicator of future activity. We are well positioned to continue to the detailed design phase following successful FEED work on Peregrino Phase II and Tengizchevroil.
Subsea & pipelines represented around 40% of Engineering revenue. We continued our activity on larger projects such as BP Shah Deniz and Quad 204, Tullow TEN and Chevron Gorgon, and won FEED work with Woodside and Shell on Browse, and Talisman in Vietnam. We continue to benefit from our long-term customer relationships, securing a five year contract with BP in October covering Norway, Gulf of Mexico and the Azerbaijan region and progressing to detailed design on the Greater Western Flank II for Woodside in Australia after the successful completion of the FEED work. Our US onshore pipelines business has performed robustly as customers look to improve transportation to downstream facilities, with activity on the ETC Dakota access pipeline expected to continue throughout 2016. The acquisition of Beta Machinery in June further strengthened the breadth of our services, specifically our integrity management capabilities which have been reinforced by the expansion of Beta into the UK.
Downstream, process & industrial activities accounted for around 25% of revenue. Following the successful completion of the front-end design of the Flint Hills refinery modification, we are progressing with the detailed engineering work which will continue throughout 2016. In September, we acquired UK-based Automated Technology Group, an independent provider of control and power solutions for industrial automation. ATG will complement our process automation capabilities which are currently centred in the US, and we started this expansion with the opening of an operation in Slovakia in December.
OutlookThe breadth and diversity of our Engineering business will continue to benefit us and we enter 2016 with backlog in a similar position to the previous year. Although there remains a lack of visibility of significant Upstream and Subsea projects, recent awards evidence continued customer support for our differentiated service offering. We remain well positioned to provide engineering project solutions to our balanced portfolio of clients, as they manage themselves through a prolonged period of challenging market conditions.

Financial statementsGovernanceStrategic report
John Wood Group PLC Annual Report and Accounts 2015 09
Turbine Activities2015
$m2014
$m%
Change
Turbine JVs 676 819 (17.4)%
Legacy EPC - 31 n/m
Total Revenue 676 850 (20.4)%
Turbine JVs 44 44 (1.1)%
Legacy EPC - (11) n/m
Total EBITA 44 33 32.7%
Total EBITA margin 6.5% 3.9% 2.6pts
Production Services2015
$m2014
$m%
Change
Revenue 3,448 4,636 (25.6)%
EBITA 258 342 (24.5)%
EBITA margin 7.5% 7.4% 0.1pts
People 23,900 26,600 (10.2)%
Wood Group PSN
We provide services to the upstream, midstream, downstream and industrial sectors through brownfield engineering and modifications, production enhancement, operations and maintenance, facility construction and maintenance management, industrial services, training, and decommissioning services.
In Wood Group PSN Production Services, revenue decreased by 26% and EBITA decreased by 25%. This decrease in turnover predominantly reflects lower activity in the North Sea and the Americas. Activity in other international markets remained relatively robust. EBITA margin was steady year-on-year, as utilisation management, significant overhead cost savings and the release of deferred consideration provisions helped to offset pricing pressure from customers and foreign exchange headwinds. Excluding the impact of businesses acquired in 2015, headcount was down by around 6,000 people (22%).
The Americas accounted for around 40% of Production Services’ revenue. Following a strong performance in 2014, our US onshore business was impacted by significant pressure on volumes and pricing in 2015. The pressure was most pronounced on our well site activities which are highly correlated to the decline in the rig count, with our infrastructure development and production related operations & maintenance activities being less affected. The acquisition of Kelchner, a provider of midstream and upstream construction and energy field services, in December, provides the Group with greater access to the Marcellus and Utica basins. This broadens our exposure for the longer-term opportunity in US shale. The acquisition of Infinity Group for an initial consideration of $155m was completed in December 2015, further broadening our US service offering. The Infinity Group is an industrial construction and maintenance provider to the petrochemical, refining and gas processing sectors based in the US Gulf Coast. This establishes a strong brownfield service offering in the petrochemical market which we believe offers attractive growth opportunities.
The North Sea business represented just below 40% of revenue, with volumes under longer-term contracts impacted by the reduction in project and non-essential maintenance work and efficiency initiatives, including updates to processes and changes in offshore rotation patterns. We continue to secure contracts with our long standing customer base including Total, Enquest and Chevron. Our industrial services business, established with the acquisition of Pyeroy in 2013, is performing well and has benefitted from several new contracts with existing and new customers. In December, we also commenced work on a new duty holder contract with Antin Infrastructure Partners operating the CATS pipeline and terminal. We remain fully aligned with customers looking to improve efficiency and we believe our record of cost leadership will be key as we address the operational challenges our customers are facing in this tough environment. In 2016, we have again revisited North Sea contractor rates resulting in the reduction of rates for over a third of our 600 contractors.
Performance in our international business has been robust, with increased activity in the Middle East offsetting lower performance in Africa. We have secured and commenced work on a number of important contracts over a wide geographical spread. We continued to increase our presence in the Middle East with the award of a three year contract in Iraq and moved further into the Caspian region with a 3 year contract for NCOC in Kazakhstan. Contracts in Australia and Papua New Guinea are progressing well and, in December, we were awarded a brownfield engineering contract with Conoco in Australia, including work on the Darwin LNG plant. Developing our relationships built in the US and North Sea, we are progressing with our work for Shell on the five year Gabon contract which was awarded in August and, in Brazil, we have commenced work with Statoil in the Peregrino field.
OutlookMarket conditions remain very challenging, particularly in our core onshore US and North Sea markets. Elsewhere, we continue to be encouraged by good opportunities internationally and we will benefit from a good contribution from the completed acquisitions of Infinity and Kelchner.
Through three joint venture arrangements, we provide industrial gas turbine and rotating equipment repair, maintenance, overhaul and power plant EPC services to the oil & gas and power sectors.
Our Turbine Activities consist of: two joint ventures with Siemens, EthosEnergy and RWG, and our joint venture with TransCanada, TransCanada Turbines (TCT) (together “Turbine JVs”). Turbine Activities also included Wood Group GTS EPC contracts in 2014.
In Turbine JVs, revenue fell 17% and EBITA fell 1.3%. Poor performance in EthosEnergy, which saw a reduction in major maintenance and low equipment sales, was offset by improved performance in RWG and TCT. As noted in December 2015, we have revised our expectations of near term performance in EthosEnergy and this has resulted in a non-cash impairment of the carrying value of our investment in EthosEnergy of $159m.
OutlookIn our Turbine Activities servicing the oil & gas markets we are focused on delivering efficiencies to support our customers and protect performance. On the power side, we are looking to drive performance with a continued focus on cost and efficiency.

John Wood Group PLC Annual Report and Accounts 201510
Financial review
Trading performanceTrading performance is presented based on proportionally consolidated numbers, which is the basis used by management to run the business. Total Revenue and Total EBITA include the contribution from joint ventures and activities classified as discontinued. A reconciliation to statutory measures of revenue and operating profit from continuing operations excluding joint ventures is included in note 1 to the financial statements.
2015 $m
2014 $m
Total Revenue 5,852.4 7,616.4
Total EBITA 469.7 549.6
EBITA margin % 8.0% 7.2%
Amortisation - software and system development (54.8) (40.2)
Amortisation - intangible assets from acquisitions (54.2) (61.0)
EBIT 360.7 448.4
Net finance expense (23.1) (24.2)
Profit before tax and exceptional items 337.6 424.2
Taxation before exceptional items (88.4) (115.5)
Profit before exceptional items 249.2 308.7
Exceptional items, net of tax – EthosEnergy impairment (159.1) -
Exceptional items, net of tax – other - 27.6
Profit for the year 90.1 336.3
Basic EPS (cents) 21.4c 87.9c
Adjusted diluted EPS (cents) 84.0c 99.6c
The review of our trading performance is contained within the Chief Executive Review.
Reconciliation of Total EBITA to operating profit per accountsThe table below sets out a reconciliation of EBITA to operating profit per the Group income statement before exceptional items. Operating profit on a post exceptional basis by segment is included in note 1 to the financial statements.
2015 $m
2014 $m
EBITA 469.7 549.6
Amortisation (109.0) (101.2)
EBIT 360.7 448.4
Tax and interest charges on joint ventures included within operating profit but not in EBITA
(19.7) (15.9)
Operating loss from discontinued activities - 4.3
Operating profit before exceptional items per accounts
341.0 436.8
David Kemp, CFO
"Our trading performance overall reflects our breadth, resilience, and flexibility in very tough conditions."

Financial statementsGovernanceStrategic report
John Wood Group PLC Annual Report and Accounts 2015 11
Financial performanceThe financial performance of the Group, adjusting for acquisitions and on a constant currency basis, is shown below. The 2014 results have been restated to include the results of acquisitions made in 2014 (Meesters, Cape, Sunstone, Agility and Swaggarts) as if they had been acquired on 1 January 2014 and also to apply the average exchange rates used to translate the 2015 results. The 2015 results have been restated to exclude the results of acquisitions made in 2015 since the date of acquisition (Beta, ATG, Infinity and Kelchner).
2015 Total
Revenue $m
2015 Total
EBITA $m
2014 Total
Revenue $m
2014 Total
EBITA $m
Wood Group Engineering 1,707.4 211.3 2,149.3 230.2
Wood Group PSN – Production Services
3,447.8 258.0 4,442.1 339.5
Wood Group PSN – Turbine Activities
676.0 44.2 810.8 30.7
Central costs - (47.2) - (55.9)
Pro forma 5,831.2 466.3 7,402.2 544.5
Acquisitions 21.2 3.4 (203.7) (20.2)
Constant currency - - 417.9 25.3
Total Revenue and EBITA as reported
5,852.4 469.7 7,616.4 549.6
Amortisation The amortisation charge for 2015 of $109.0m (2014: $101.2m) includes $54.2m (2014: $61.0m) of amortisation relating to intangible assets arising from acquisitions. Of this amount $18.4m (2014: $27.7m) is in respect of the PSN acquisition and $21.4m (2014: $21.4m) relates to the acquisitions of Elkhorn and Mitchells. Amortisation in respect of software and development costs was $54.8m (2014: $40.2m) with the increase relating to the investment in ERP system development, engineering software and the impact of acquired businesses. Included in the amortisation charge for the year above is $1.9m (2014: $2.3m) in respect of joint ventures.
Net finance expense Net finance expense is analysed further below.
2015 $m
2014 $m
Interest on debt 4.3 9.3
Bank fees and charges 8.6 11.6
Interest on US Private Placement debt 14.1 4.7
Total finance expense 27.0 25.6
Finance income (3.9) (1.4)
Net finance expense 23.1 24.2
Interest cover4 was 20.3 times (2014: 22.7 times). Interest on debt resulted from lower average debt levels during the year. Interest on US Private Placement debt issued in the second half of 2014 represents a full 12 months of cost in 2015. Included in the above are net finance charges of $2.3m (2014: $1.9m) in respect of joint ventures.
Exceptional expense/(income) 2015
$m 2014
$m
EthosEnergy impairment 159.1 -
Integration and restructuring charges 36.6 7.5
Onerous contract (14.1) (9.7)
Gain on divestment of Well Support division (10.4) -
Venezuela settlement - (58.4)
Transaction related costs - 23.0
Total exceptional items pre-tax 171.2 (37.6)
Tax on exceptional items (12.1) 10.0
Total exceptional items, net of tax 159.1 (27.6)
At 31 December 2015, the Group carried out an impairment review of its investment in the EthosEnergy joint venture. The recoverable amount of the investment of $192.2m is lower than the book value and therefore an impairment charge of $137.2m has been booked in the income statement. In addition, the Group has impaired its receivables by $9.3m in relation to a balance due by EthosEnergy and EthosEnergy has recorded an impairment charge of $12.6m relating to operations which it intends to divest or close during 2016.
In response to the lower oil price environment, the Group has taken action to reduce its cost base, including the restructuring of its business units to improve operational efficiency. In addition, a review of the Group’s property portfolio has identified onerous property leases in certain locations. In total, $36.6m of redundancy and onerous lease costs have been incurred and expensed in the income statement in 2015 of which $24.1m relate to redundancy and $12.5m relate to onerous lease costs.
In 2013, the Group made an onerous contract provision in respect of Wood Group PSN’s contract in Oman. During 2015, the contract was successfully transitioned and closed out and the remaining provision of $14.1m was written back to the income statement at the end of the year.
A tax credit of $9.0m has been recorded in respect of the exceptional items included in continuing operations.
In 2011, the Group made provisions in respect of the disposal of its Well Support business. These provisions have been reassessed at 31 December 2015 with $10.4m of the provision being released to the income statement and credited to exceptional items. A tax provision was also made in 2011 in relation to the disposal. This has also been reassessed at 31 December 2015 and $3.1m has been released to the income statement.

John Wood Group PLC Annual Report and Accounts 201512
Financial review continued
Taxation The effective tax rate on profit before tax and exceptional items including joint ventures and discontinued operations on a proportionally consolidated basis is set out below.
2015 $m
2014 $m
Profit from continuing operations before tax (pre-exceptional items)
337.6 424.2
Tax charge (pre-exceptional items) 88.4 115.5
Effective tax rate on continuing operations (pre-exceptional items)
26.2% 27.2%
The tax charge above includes $17.4m in relation to joint ventures (2014: $14.0m). We expect the 2016 effective tax rate, to remain around 26%.
The Group’s tax liabilities include $112.7m relating to uncertain tax positions where management has had to exercise judgement in determining the most likely outcome in respect of the relevant issue. The amount includes tax payable in relation to divestments and amounts provided in relation to recoverability of withholding tax and utilisation of tax losses.
The Group tax strategy, as approved by the Board, sets out the Group’s policy and approach to conducting its tax affairs and dealing with tax risk.
Earnings per share Adjusted diluted EPS for the year was 84.0 cents per share (2014: 99.6 cents). The average number of fully diluted shares used in the EPS calculation for the period was 379.3m (2014: 375.2m).
Adjusted diluted EPS adds back all amortisation. If only the amortisation related to intangible assets arising on acquisition is adjusted and no adjustment is made for that relating to software and development costs, the figure for 2015 would be 73.3 cents per share (2014: 91.8 cents).
DividendThe Board is recommending a final dividend of 20.5 cents per share, which, when added to the interim dividend of 9.8 cents per share makes a total distribution for the year of 30.3 cents per share (2014: 27.5 cents), an increase of 10%. The dividend is covered 2.8 times (2014: 3.6 times) by adjusted earnings per share.
Cash flow and net debt The cash flow and net debt position below has been prepared using equity accounting for joint ventures, and as such does not proportionally consolidate the assets and liabilities of joint ventures. The gross and net debt figures including joint ventures are given below.
2015 $m
2014 $m
Opening net debt (excluding JV’s) (326.6) (325.3)
Cash generated from operations pre working capital (excluding JV’s)
503.7 650.9
Working capital movements (excluding JV’s)
59.2 (106.0)
Cash generated from operations 562.9 544.9
Acquisitions (238.0) (262.9)
Capex and intangibles (82.6) (110.2)
Tax paid (96.6) (84.9)
Interest, dividends and other (113.0) (88.2)
Decrease/(increase) in net debt 32.7 (1.3)
Closing net debt (excluding JV’s) (293.9) (326.6)
JV net cash 3.6 30.9
Closing net debt (including JV’s) (290.3) (295.7)
Throughout the period the Group debt levels (including JV cash and debt) are set out below.
2015 $m
2014 $m
Average net debt 257.4 416.4
Average gross debt 572.1 643.4
Closing net debt 290.3 295.7
Closing gross debt 565.7 559.3 Cash generated from operations pre-working capital decreased by $147.2m to $503.7m and post-working capital increased by $18.0m to $562.9m.
The working capital inflow of $59.2m in 2015 was attributable to the reduction in activity in the year and the final settlement of the Dorad contract.
Expenditure on acquisitions of $238.0m includes $233.9m in relation to the acquisitions of Beta, ATG, Infinity and Kelchner. $4.1m relates to payments made in respect of companies acquired in prior periods.
Payments for capex and intangible assets were lower at $82.6m (2014: $110.2m) due in part to a planned reduction in capex spend in response to a challenging market. Expenditure included plant & infrastructure, design software and development expenditure on ERP systems across the Group.
Our tax strategy is available at: www.woodgroup.com/taxstrategy

Financial statementsGovernanceStrategic report
John Wood Group PLC Annual Report and Accounts 2015 13
Summary Balance SheetThe balance sheet below has been prepared using equity accounting for joint ventures, and as such does not proportionally consolidate the joint ventures assets and liabilities.
Dec 2015
$m
Dec 2014
$m
Non-current assets 2,656.8 2,739.6
Current assets 1,410.3 1,647.3
Current liabilities (849.5) (1,093.9)
Net current assets 560.8 553.4
Non-current liabilities (796.6) (733.7)
Net assets 2,421.0 2,559.3
Equity attributable to owners of the parent 2,398.3 2,546.2
Non-controlling interests 22.7 13.1
Total equity 2,421.0 2,559.3 The reduction in non-current assets during the year reflects the impairment of the investment in EthosEnergy, partly offset by the increase in goodwill and intangible assets resulting from the four new acquisitions in 2015.
Current assets and current liabilities are lower than 2014 reflecting the lower level of activity and net current assets are broadly in line with December 2014. The increase in non-current liabilities is largely due to the provision for deferred consideration on new acquisitions.
Total equity was impacted by exchange movements of $175.4m (2014: $147.4m) on retranslation of foreign currency net assets as a result of the US dollar strengthening against the main currencies to which the Group is exposed, in particular Sterling, the Australian dollar and the Canadian dollar.
Capital efficiency Net debt (including our share of JV net debt) to Total EBITDA was 0.55 times (2014: 0.48 times). The Board would generally expect net debt to EBITDA on this basis to be in a range of around 0.5 to1.5 times going forward and to be typically below 1.0 times.
The Group’s Return on Capital Employed (“ROCE”)5 reduced from 17.7% to 16.3% due to lower profits in the period.
The Group’s ratio of average Operating Capital Employed to Revenue (OCER) was the same as 2014 at 16.2%.
PensionsThe majority of the Group’s pension arrangements are on a defined contribution basis. The Group operates one UK defined benefit scheme which had 1,144 deferred, pensionable deferred or pensionable members at 31 December 2015. The scheme was closed to future accrual at 30 June 2014.
At 31 December 2015 the scheme had a surplus of $4.5m (2014: $27.0m deficit) before recognition of a deferred tax liability of $0.9m (2014: asset $5.4m). In assessing the potential liabilities, judgement is required to determine the assumptions around inflation, investment returns and member longevity. The reduction in the deficit from 2014 was due to the payment of additional contributions by the company and actuarial gains during the year.
AcquisitionsDuring the year, the Group completed a number of acquisitions, the initial cost of which amounted to $233.9m, net of cash acquired. The acquisitions completed were Beta Machinery Analysis ($9.2m), a Calgary-based engineering consultancy specialising in advanced vibration analysis; Automated Technology Group ($42.1m), an independent supplier of control and power solutions for industrial automation in the UK; Infinity Group ($155.4m), an industrial construction and maintenance contractor serving the petrochemical, refining and gas processing sectors in the Texas Gulf Coast; and Kelchner Inc ($27.2m), a US-based provider of construction and energy field services.
Goodwill of $135.9m has been recognised in relation to the companies acquired during the year.
Footnotes 1. Total EBITA represents operating profit including JVs on a proportional
basis of $189.5m (2014: $486.0m) before the deduction of amortisation of $109.0m (2014: $101.2m) and net exceptional expense of $171.2m (2014: income $37.6m) and is provided as it is a key unit of measurement used by the Group in the management of its business.
2. Adjusted diluted earnings per share (“AEPS”) is calculated by dividing earnings before exceptional items and amortisation, net of tax, by the weighted average number of ordinary shares in issue during the period, excluding shares held by the Group’s employee share ownership trusts and adjusted to assume conversion of all potentially dilutive ordinary shares.
3. Number of people includes both employees and contractors at 31 December 2015 and includes joint ventures.
4. Interest cover is EBITA divided by net finance expense.
5. Return of Capital Employed (“ROCE”) is EBITA divided by average capital employed.

John Wood Group PLC Annual Report and Accounts 201514
Our Core Values are at the heart of our business because they define who we are, how we work, what we believe in and what we stand for. They set out how we act and how we expect to be treated as part of Wood Group and provide a sound basis to make decisions.
Building a sustainable business
Find out more about our core values at: www.woodgroup.com/our-values
Our Core Values underpin the sustainability of our business.
2
5
4
1
31. Wood Group went above and beyond in fundraising efforts for The ARCHIE Foundation’s High 10 campaign, resulting in a grand total raised of over $380,000.
2. Prompted by the Wood Group 2015 Environment Day, our trainers and students in Equatorial Guinea took part in a carnival like clean-up.
3. Following the successful partnership with the Vine Trust, which combined our engineering expertise and fundraising efforts to send the Jubilee Hope vessel from Glasgow to Lake Victoria, in 2015, the Jubilee Hope completed 10 medical expeditions. The plan for 2016 includes an additional 3 expeditions with the target of providing 60,000 consultations.
4. In 2015, Wood Group launched the STEM+ initiative which aims to encourage, promote and improve knowledge in Science, Technology, Engineering & Maths in schools.
5. In 2015, Wood Group raised over $100,000 for Multiple Sclerosis, as part of the MS150 cycle in Houston, Texas. we were awarded the Circle of Distinction award for contributing over $1 million through participation in the MS150 to date.

Financial statementsGovernanceStrategic report
John Wood Group PLC Annual Report and Accounts 2015 15
Health, safety and security
Wood Group is committed to ensuring that our growth is inclusive of health, safety and security. Good safety is good business.
In 2015 we delivered measurable improvement in Health, Safety, Security and Environment (HSSE) performance, based upon our key performance indicators. Across our workforce of 33,000 employees (excluding JVs) we had zero fatalities and our Lost Work Case Frequency (LWCF) showed an 11% improvement on 2014 performance. We did however see an 11% increase in our Total Recordable Case Frequency (TRCF). Although incidents reduced by 14% in the year, hours worked reduced by 20%. This can be partly attributed to improved case recording across the Group.
Building on our vision of safety for everyone, everywhere, everyday, we continued to communicate our belief that accidents are preventable. We believe that clear communication is vital to improving our safety performance and are focused on active engagement sessions with senior leadership and our workforce to reinforce commitment and determine areas of continuous improvement.
Wood Group’s security team worked across the business to ensure that security risks were identified and addressed prior to starting new operations. The security team is structured to provide extensive regional support and expertise and in 2015 worked to further develop our security management capability and capacity through key activities that support our focus on sustainable and responsible business development with the safety and security of our people at the forefront.
The 2015-2017 HSSE Strategic Plan continues to build on our strong foundation, while at the same time recognising the challenges that a business of significant breadth and diversity presents and the impact that this brings to the HSSE system as a whole.
The Plan is centred on six core strategic objectives:
X Robust processes and systems
X Competent people
X Inspiring leadership
X Risk understanding, management and assurance
X Adapting to change
X Continuous learning
1.99 1.81
2012 2013 2014
1.39
2015
1.54
2015
0.40
0.65
2012
0.70
2013 2014
0.45
LWCF: lost work case frequency per million man hours
TRCF: total recordable case frequency per million man hours
Find out more about our safety performance and initiatives at: www.woodgroup.com/our-values/safety-assurance
We are commited to continuous improvement and in 2016, in line with our strategy, we will be focusing on:
X Back to basics: Reviewing and streamlining our Group standards
X Understanding risk: Setting a common standard for evaluating risk and assurance plans
X Leadership reset: Clarifying expectations and ensuring our leaders know how to meet these expectations
X Driving a learning culture: Sharing lessons learned and increasing the profile of high potential incidents.

John Wood Group PLC Annual Report and Accounts 201516
Environment
At Wood Group we aim to make a positive difference to the communities where we operate and seek ways to reduce or minimise the impact of our operations. We recognise that sustainability isn’t just important for people and the planet, but also vital for business success and responsible growth.
We manage environmental risks within our business by aligning our environmental management systems to ISO14001 and we drive heightened environmental awareness through HSE alerts and environmental initiatives. We ensure compliance with all regulatory requirements as well as participate in the voluntary Carbon Disclosure Project (CDP). The CDP is an independent not-for-profit organisation and the largest published registry of corporate GHG emissions in the world. Our performance in the 2015 submission saw Wood Group demonstrate continuous improvement on previous years and score higher than some of our key competitors, giving us a platform from which to proactively demonstrate our commitment to reducing the Group’s carbon footprint.
In 2015, we saw the introduction of the Energy Savings Opportunity Scheme (ESOS), which was developed as part of the UK’s responsibilities under the EU Energy Efficiency Directive. The ESOS is a mandatory energy assessment and energy saving identification scheme for companies with over 250 employees or annual turnover over $55 million. Under the scheme the Group was party to an energy compliance audit on 90% of the Group’s energy consumption in the UK, following which energy efficiency measures were identified for the Group to consider. At Wood Group, we understand that cutting energy costs through improved energy efficiency does not only benefit the environment but also makes us a more sustainable and competitive organisation.
In 2015 we continued to invest in a sustainable property portfolio for improved working conditions and energy efficiency, sourcing 100% Green electricity across our UK buildings and by upgrading and consolidating our existing locations, recently completing work on a new Wood Group Southern campus in Aberdeen. Our office in Melbourne Australia is the first premium building and second largest Victorian building to receive the six-start Green Star – Office As Built v2 certified rating by the Green Building Council of Australia (GBCA).
Our annual Environment Day in celebration of World Environment Day saw activities across our global footprint raise awareness around our impact on the environment with activities ranging from local area clean ups and garden planting to local community events, energy efficiency campaigns and informative presentations with a focus on sustainability.
We continue to develop our engineering, production support and renewable expertise to help reduce our customers’ environmental impact. In 2015 Wood Group launched our new Innovation Seed Fund which will aim to bring new innovative ideas to life. SgurrEnergy, our renewable energy consultancy, has already developed innovative models which will enhance and improve the operational performance of wind farms. This highlights our belief that the future of renewable energy is not only robust, but is a business sector in which we intend to grow, expand and develop further.
Find out more at: www.woodgroup.com/our-values/social-responsibility
Emissions from 2015 2014
Combustion of fuel and operation of facilities
23,319 tonnes of CO2e
36,189 tonnes of CO2e
Electricity, heat, steam and cooling purchased for own use
4,433 tonnes of CO2e
6,263 tonnes of CO2e
Company’s chosen intensity measurement: Emissions reported above normalised to per tonne of $100,000 revenue
0.8 1.0
Disclosures concerning greenhouse gas (GHG) emissions
Global GHG emissions data is shown for the year ended 31 December 2015 and totals 27,752 tonnes of CO2e split as per the below. The reduction in 2015 is mainly attributable to the reduction in US activity, alongside the consolidation and reduction of our property portfolio.
MethodologyWe have reported on all of the emission sources required under the Quoted Companies Greenhouse Gas Emissions (Directors’ Reports) Regulations 2013. We do not have responsibility for any emission sources that are not included in our consolidated financial statements and that we do not have managerial control over. This includes Scope 1 and Scope 2 emissions.
We have used the GHG Protocol Corporate Accounting and Reporting Standard (revised edition), data gathered to fulfil our requirements under the CRC Energy Efficiency scheme, and emission factors from UK Government’s GHG Conversion Factors for Company Reporting 2015.
Wood Group in the UK purchases 100% green electricity.

Financial statementsGovernanceStrategic report
John Wood Group PLC Annual Report and Accounts 2015 17
Society
Over 5,800 designated Business Ethics personnel, identified based on a range of roles and responsibilities, including those who liaise with customers and third parties, were required to compete online training and confirm their continued compliance in 2015.
We offer an external, confidential, multi-lingual Business Ethics helpline where anyone, anywhere can raise a concern or report a suspected violation of the Business Ethics Policy. Violations or complaints are investigated and any necessary action is taken.
A register of matters is maintained by the Group’s Chief Compliance Officer and the Board receives regular updates. During 2015 we conducted a number of internal investigations into allegations of unethical behaviour. Appropriate disciplinary action was taken based on the facts and circumstances, including the dismissal of 6 employees and 7 other cases where an employee left during or immediately upon completion of an investigation.
Community We believe in making a positive difference in the communities in which our businesses operate. With every new contract and new geography comes an opportunity to employ locally and to reinforce our relationship with the community.
We support a range of local and international charities and causes spanning health, education, the arts, medical research and the prevention and reduction of poverty. We foster long-term support for flagship charities – ARCHIES in the UK, MS in the US and the Vine Trust in Tanzania. We also support a wide range of local projects where we operate.
Specifically in 2015, we have launched the STEM+ initiative which aims to encourage, promote and improve knowledge in Science, Technology, Engineering & Maths in schools. Staff members, many of whom are graduates, visit local schools to assist with a variety of educational activities to support in the development of technical and behavioural skills and to provide young people with an insight into the industry.
Our PeopleOur people are the heart of our business. As an asset light business, our people are the foundation of our Group and we remain committed to being the best technical services company to work for.
Our success depends entirely on the strength of our people and our ability to identify, develop and retain our key talent. We strive to attract, develop, mobilise and retain talented and engaged employees from different backgrounds and cultures to provide solutions to our customers. This starts with our strategic resourcing function, where the focus is on recruiting the right people, at the right time, to the right location, at the right cost, to provide us with a flexible, diverse, talented and mobile workforce.
Over the last year, our leadership teams have committed to increased talent reviews as part of our broader talent management framework, conducting a deep dive into the strengths and development areas of our people. By taking a structured approach to talent and succession management, we ensure that we are building a robust pipeline of future leaders and promoting talent from within. This was evidenced in 2015 with the successful progression and transition of our COO into the Chief Executive position, and of our Wood Group PSN CFO into the Group CFO role, and the recent appointment and promotion of three new SBU CEOs all from within the business.
We recognise that in order to attract and retain the best people we need to offer challenging and exciting opportunities and ensure a fair and competitive reward. We implement benefit strategies that promote engagement, recognise the needs of our diverse workforce and support local business strategy. Our long-term reward programmes focus on driving business outcomes whilst rewarding and retaining key talent. In 2015 we launched the first phase of our new Employee Share Plan in the US, UK, UAE and Australia with the aim of promoting wider employee share ownership in Wood Group.
As we are a global Group with over 33,000 people (excluding JVs)working in more than 40 countries, localisation of the workforce is imperative. We are committed to nurturing local skills and sustainable community development, hiring and developing local people and working with local supply chains whenever we can. We provide training to local workers and support to local companies.
Our business model is built on flexibility; being able to flex our business in line with changes in the market. In 2015, market conditions have been challenging and as a result we have had to make the difficult decision to reduce our underlying headcount by over 8,000 people.
Ethical conductWood Group is committed to protecting and enhancing the human dignity of all personnel and everyone who has dealings with the Group worldwide. Our human rights policy respects and enforces the principles established in the Universal Declaration of Human Rights. This policy is supported by our commitment to Equal Opportunities across the Group.
We encourage and train our personnel to do the right thing, and we are proud of the reputation we have built on this. Our Business Ethics Policy highlights the importance of conducting business both ethically and legally. Compliance with our Business Ethics Policy is mandatory for our directors, officers and employees as well as all contractors, consultants, representatives, intermediaries and agents retained by Wood Group.
Our Human Rights Policy is available at: www.woodgroup.com/humanrights
Our Business Ethics Policy is available at: www.woodgroup.com/our-values/integrity
Gender diversity
Executive leadership team 10 people as at 31 December 2015: CEO, COO, CFO, WG Mustang CEO, WG Kenny CEO, WG PSN CEO, Group Head of HR, Group Head of HSSE, Group Head of Strategy & Development and General Counsel / Company Secretary.
30% 70%
15% 85%
Overall Around 33,000 people (excluding JVs) as at 31 December 2015.
Information on our Business Ethics Helpline is available at: www.woodgroup.com/ethics
We value and demonstrate equal opportunity in recruitment, career development, promotion, training and reward for all employees.

John Wood Group PLC Annual Report and Accounts 201518
Principal risks and uncertainties
The principal risks identified that face the Group are set out below. During the year the Board has carried out a robust assessment of these principal risks and monitored the Group’s risk management and internal control systems.
Risk managementThe Board is responsible for:
X determining the nature and extent of the principal risks faced
X determining the extent of those risks it is willing to take in achieving its strategic objectives (“its risk appetite”)
X performing a robust assessment of those risks
X monitoring and reviewing the risk management and internal control systems, and management’s process of monitoring and reviewing, and satisfying itself that they are functioning effectively and that corrective action is being taken where necessary
It is assisted in this assessment by the Audit and the Safety and Assurance committees, to which certain aspects are delegated.
Identification of principal risks The risk profile across each of our segments varies through the nature of our activities, specific customer contracts and geographic spread, and each segment operates under an established policy and procedural framework.
A bottom up and top down approach to identifying risks operates within the Group. Risk registers are developed at an individual contract or project level and rolled up in SBU risk registers, which are regularly reviewed by the SBU Leadership Teams, Chief Executive and CFO. The individual SBU registers are aggregated into a Group risk register which is reviewed by the Group Executive Leadership Team (ELT) in order to ensure that cross Group and appropriate strategic risks are included. The summary of Principal Risks is formally reviewed by the Board twice a year, with any emerging risks considered throughout the year. The principal risks identified and reviewed by the Board in February 2016 are set out on pages 19 and 20.
Risk appetite For each of the principal risks identified the Group’s risk appetite has been considered and this has been taken into account when determining the nature and extent of the key control mechanisms in place and the level of assurance activity required for each risk.
Robust assessment of principal risks The Board has carried out a robust assessment of the principal risks facing the Group. To support this, the Board and its committees received regular reports from key functions such as safety, compliance, finance, legal, IT, internal audit and HR along with operational reports from the SBUs, which include key risks and information on compliance with controls and reports on assurance activities where applicable. In addition throughout the year the Board received presentations from each of the SBUs on their project control processes which allowed a more detailed insight into a number of the principal risks.
The Board received six monthly updates on the key controls in place with respect to each of the principal risks, the level of assurance activity carried out and management’s assessment of the adequacy of the assurance provided and the effectiveness of the controls.
In certain areas the level of assurance that was being obtained was not considered to adequately reflect the stated risk appetite and as a result changes have been made to increase assurance activity in these areas. During the year, in line with best practice and as part of a continual improvement process, the board enhanced its oversight of the control environment around IT and cyber security. A dedicated resource in Internal Audit is now regularly reporting to the Audit Committee on risk and controls in IT. Enhancements have also been made to the assurance programme around our HSSE activities and the reporting line for the compliance function is in the process of changing to the Safety, Assurance and Business Ethics Committee to give it a clear route into the Board.
Overall the control environment was considered to be operating effectively.
Going concern The Group’s business activities, together with the factors likely to affect its future development, performance and position are set out in the Strategic Report on pages 5 to 20. The financial position of the Group, its cash flows, liquidity position and borrowing facilities are described in the Financial Review on pages 10 to 13. In addition, note 17 to the Group financial statements includes the Group’s objectives, policies and processes for managing its capital, its financial risk management objectives, details of its financial instruments and hedging activities, and its exposures to credit risk and liquidity risk.
The Group has considerable financial resources together with the cash inflows generated from its existing activities as set out in notes 13,15 and 26 to the Group financial statements. As a consequence, the directors believe that the Group is well placed to manage its business risks successfully. Having made the appropriate enquiries including a review of cash flow projections and key sensitivities, the directors consider, in accordance with the UK Corporate Governance Code (the Governance Code), that the business is a going concern. The directors also considered it appropriate to prepare the financial statements on the going concern basis, as explained in the Basis of Preparation paragraph in the Accounting Policies.

Financial statementsGovernanceStrategic report
John Wood Group PLC Annual Report and Accounts 2015 19
Analysis of principal risks
Risk profile Mitigation, monitoring and assurance
Health, Safety, Security & Environment (HSSE)
Major incident: Significant HSSE event leading to a major incident resulting in multiple loss of life, significant harm or damage to our reputation
• Priority Core Value underpinned by HSSE and integrity management systems
• Safe Home vision and Life Saving Rules which set a minimum standard for safe behaviour across the Group
• Dedicated Group HSSE Assurance team introduced
• Cross-SBU Standard on Risk Management and Assurance implemented
• Group Incident Review Panels for high potential and high severity incidents
Strategic
Reduction in demand: A significant and continued reduction in demand for our services due to market changes, investment decisions or major reduction in commodity prices resulting in a failure to grow. Our risk profile in this area has increased as a result of the prolonged lower oil price environment
• Maintain a broad customer base and balance of business between client capital and operating expenditure
• Extensive review of costs in the business, with a particular focus on cost relative to activity levels
Organisational change: Failure to successfully deliver structural changes within the business such as a common ERP and shared services
• Change management programmes instigated
• Roll ins to existing systems rather than new system builds
• Steering committees established
Undervaluation risk: Undervaluation of the business resulting in a loss of value for shareholders
• Active IR programme
• Board consideration of company valuation
• Annual Board defence review
Operational
Project execution risk: Ineffective project start up, new country entry or failure to successfully execute projects safely and to expected quality, on time and within budget
• Start up and execution plans for key projects supported by monitoring and reporting
• Group strategy & development team embed learnings from previous projects
• Quality assurance activity within all our businesses
Acquisition and integration risk: Failure to identify, assess, secure or integrate strategic acquisitions to support growth strategy
• Established mergers and acquisitions and diligence processes
• Integration plans and associated monitoring established for new acquisitions
• Dedicated teams assigned to new acquisitions to support integration
Viability statementThe directors have assessed the Group’s viability over a three year period to 31 December 2018. This is based on the period within which we have reasonable visibility of our operational backlog and is shorter than the period over which we have committed banking facilities.
In making their assessment the directors took account of the Group’s asset light and flexible business model, availability and tenure of financing and current trading position. They also assessed the potential financial and operational impacts in severe but plausible scenarios of the principal risks and uncertainties arising, including the degree of effectiveness of mitigating actions.
In order to make this assessment, the Board reviewed scenarios which stress-tested the viability of the business against those principal risks which were considered to have a material impact on viability.
As indicated in the table below these included, individually and in combination, multi-year reductions in demand, project execution and contracting risk, the impact of a catastrophic safety incident or the damage sustained by an ethical or regulatory breach. Based on the modelling performed the Board’s assessment was that the strength of our balance sheet and the flexibility of our business model meant that in all plausible scenarios considered the business would continue to be viable for at least three years.
Based on this assessment, the Directors have a reasonable expectation that the Group will be able to continue in operation and meet all its liabilities as they fall due up to 31 December 2018. In coming to this conclusion, the Directors assumed that current committed financing as set out in note 15 to the Group financial statements remains available.
Board assessment of change in risk from 2014:
No change in risk since 2014 Risk has decreased since 2014
Risk has increased since 2014 Considered as part of viability assessment

John Wood Group PLC Annual Report and Accounts 201520
Principal risks and uncertainties continued
Risk profile Mitigation, monitoring and assurance
Technology
Information security: Loss of data through unauthorised access, cyber attack or physical loss
• IT security standards and acceptable use policy
• Information security roadmap and associated investment
• Perimeter security application and end point protection
Commercial
Contracting risk: Weaknesses in the contract bidding and award process, inappropriate pricing, misalignment of contract terms, or failure to comply with contractual conditions could lead to reputational damage, or poor financial performance
• Established processes for the review and approval of key contracts terms including price, scope and subcontractor management
• Derogation from the Group’s contracting procedure is subject to a range of approvals
People
Availability of competent resources: Inability to effectively balance the need to maintain high levels of utilisation in order to protect margins, with the need to maintain core competency in areas of the Group
• Revised model to support identification and recruitment of suitable resource
• Line management succession planning process monitored by HR teams
• Training and development programmes refreshed under the Group leadership framework
• Management of people utilisation
Compliance
Bribery and corruption: Risk associated with a breach of bribery and corruption legislation through an improper payment (e.g bribe / facilitation payment). Heightened risk in relation to third parties working on our behalf or joint venture operations in countries with a risk of corruption
• Business ethics policy with identified responsible officers
• Annual training programme and associated annual certification
• Independent business ethics helpline
• Group Compliance monitoring programme
Major regulatory investigation: Regulatory investigation or proceedings relating to non-compliance with applicable legislation
• Integrity management and quality assurance mechanisms
• HSSE management standards including incident review panels
• Group legal and external counsel support as necessary
Trade sanctions: Trade with sanctioned countries leading to regulatory enforcement and financial penalties
• Watchlist of economic trade sanctioned countries maintained and distributed internally
• Processes established for Group Legal review and approval by Strategic Business Unit CEO and Group Chief Executive
Financial
Forecasting: Forecast information used to inform business decisions and external market varies materially from actual results. This risk has increased due to the challenging oil price environment
• Group and divisional review of budget and reforecast information
• Established budgeting and frequent reforecast process
• Bottom up and top down assessments of budgets and reforecasts
Working capital management: Material divergence from budgeted business unit cash collection and working capital management
• Reporting and monitoring of days sales outstanding performance and associated incentive plans
Credit risk: Customer fails to settle a significant debt. This risk has increased due to the challenging oil price environment
• Group credit policy in place
• Credit checks performed
• Credit limits in place for high risk customers
• Monthly monitoring and reporting of aged debt

Financial statementsGovernanceStrategic report
John Wood Group PLC Annual Report and Accounts 2015 21
The remit of the Group’s Safety & Assurance Committee was extended and its title is in the process of being changed to Safety, Assurance and Business Ethics Committee which will aim to enhance governance and assurance over compliance matters including inspection and regulatory reporting services. A new Group HSSE Assurance function has been formed and this will report to the Committee.
The Remuneration Committee continued to simplify and standardise the variable pay structure for executive directors and senior managers. In 2015, business unit level measures of performance were replaced with Group targets for all participants in the long-term incentive plans. The Committee also decided to refine the balance of performance measures for long-term incentive plan cycles commencing in 2016 and beyond to 50% AEPs and 50% TSR, resulting in a balance more suited to the cyclical nature of Wood Group’s business and that of our peer group. In addition, annual bonus and long-term incentive scheme rules were updated in line with best practice to include both clawback and malus provisions from 2015 onwards.
I am confident in the capabilities of Robin’s Executive Leadership Team to steer Wood Group through a challenging market environment in 2016 and continue to feel that the Board is well placed to ensure effective challenge, debate and decision making in the best long-term interests of the Group.
Ian Marchant, Chair 23 February 2016
Letter from the Chair of the Board
Dear ShareholderHaving marked, in 2014, a natural evolution of the Group’s stewardship with the appointment of the Group’s first independent non-executive chair, the difficult market conditions that prevailed throughout 2015 required that the Board focused more on the practicalities of effective corporate governance.
The Board responded by adjusting its agenda, devoting more time to challenging and to supporting the development of the executive’s strategic response to the ‘lower for longer’ oil price environment, with a particular focus on internal simplification and overhead cost reduction; leveraging balance sheet strength for strategic acquisitions and investing organically in the development of efficient solutions for customers.
The Board also devoted time to the Group’s longer-term strategic development, including growth opportunities beyond our core upstream oil & gas business.
Later in the year, the Nomination Committee considered Bob Keiller’s desire to retire having served for five years since the Group’s acquisition of the PSN business that he had led since 2006, ultimately recommending that this should take effect in December to ensure that the new CEO was fully installed ahead of what appears likely to remain a challenging trading environment in 2016. Robin Watson’s successful leadership of the Group’s largest division, Wood Group PSN, since 2013 and his assured performance as Group COO made him the Board’s unanimous choice as Bob’s successor. At the 2015 AGM, Michel Contie retired from the Board, having served 5 years as a non-executive director.
Having served as a non-executive director since 2007, David Woodward, our Senior independent non-executive director (SID) and Chair of the Remuneration Committee does not intend seek reappointment and will retire at the Annual General Meeting in May. Jann Brown will follow David as SID and Jeremy Wilson will assume the Chair of the Remuneration Committee. An externally led search for a new non-executive director is underway with the objective of broadening the Board’s expertise. The Board continues to comprise a majority of independent non-executive directors and we remain committed to ensuring that the Board retains the appropriate balance and diversity of skills, experience and personalities. The Board currently comprises 25% female directors, in line with the recommendations of the Davies Report.
"I am confident in the capabilities of Robin’s Executive Leadership Team to steer Wood Group through a challenging market environment in 2016 and continue to feel that the Board is well placed to ensure effective challenge, debate and decision making in the best long-term interests of the Group."

John Wood Group PLC Annual Report and Accounts 201522
Statement of Directors’ responsibilitiesThe directors are responsible for preparing the annual report, the Directors’ Remuneration Report and the Group and the John Wood Group PLC (the Company) financial statements in accordance with applicable law and regulations.
Company law requires the directors to prepare financial statements for each financial year. The directors have prepared the Group financial statements in accordance with International Financial Reporting Standards (IFRSs) as issued by the IASB and as adopted by the European Union, and the Company financial statements in accordance with IFRS as adopted by the European Union. The Group and Company financial statements are required by law to give a true and fair view of the state of affairs of the Company and the Group and of the profit or loss of the Group for that period.
In preparing those financial statements, the directors are required to:
X select suitable accounting policies and then apply them consistently
X make judgements and estimates that are reasonable and prudent
X state that the Group financial statements comply with IFRSs as issued by the IASB and as adopted by the European Union, subject to any material departures disclosed and explained in the financial statements.
The directors are responsible for keeping proper accounting records that disclose with reasonable accuracy at any time the financial position of the Company and the Group and to enable them to ensure that the financial statements and the Directors’ Remuneration Report comply with the Companies Act 2006 and, as regards the Group financial statements, Article 4 of the IAS Regulation. They are also responsible for safeguarding the assets of the Company and the Group and, hence, for taking reasonable steps for the prevention and detection of fraud and other irregularities.
The directors are responsible for the maintenance and integrity of the Company’s website. Legislation in the United Kingdom governing the preparation and dissemination of financial statements may differ from legislation in other jurisdictions.
Each of the directors, whose names and functions are listed on pages 24 and 25, confirms that, to the best of their knowledge:
X the Group financial statements, which have been prepared in accordance with IFRSs as issued by the IASB and as adopted by the EU, give a true and fair view of the assets, liabilities, financial position and profit of the Group, and
X the directors’ report includes a fair review of the development and performance of the business and the position of the Group, together with a description of the significant risks and uncertainties that it faces.
So far as the directors are aware, there is no relevant audit information of which the Company’s auditors are unaware. Relevant information is defined as ‘information needed by the Company’s auditors in connection with preparing their report’. Each director has taken all the steps that he ought to have taken as a director in order to make himself aware of any relevant audit information and to establish that the Company’s auditors are aware of that information.
Directors' report
The directors submit their report together with the audited financial statements of the Group for the year ended 31 December 2015.
The Group consolidated income statement for the year is set out on page 53. In respect of the year ended 31 December 2015 an interim dividend of 9.8 cents per share was paid on 24 September 2015 and the directors have proposed a final dividend of 20.5 cents per share to be paid on 17 May 2016. The full year dividend will therefore be 30.3 cents per share.
Further readingInformation relevant to and forming part of the report of the directors is to be found in the following sections of the annual report:
Pages
Statement of Directors’ responsibilities 22
Fair, balanced and understandable 23
Going concern 18
Viability statement 19
Risk management and internal control 23
Board of Directors and biographies 24 to 25
Principal activities and business review 02 to 13
Principal risks and uncertainties 18 to 20
Acquisitions and divestments 89 to 90
Principal subsidiaries and joint ventures 96 to 102
Corporate governance 26 to 31
Employment policies 17
Ethical conduct 17
Health, safety, security and the environment 15 to 16
Substantial shareholders 27
Share capital 86
Directors’ interests in options over ordinary shares 43
Directors’ interests in ordinary shares 42

Financial statementsGovernanceStrategic report
John Wood Group PLC Annual Report and Accounts 2015 23
Governance code complianceThe Board remains fully committed to maintaining high standards of corporate governance and believes that this is key to overall performance and integrity, consistent with our Core Values.
The Board also believes that good corporate governance extends beyond regulatory compliance and consistently monitors developments in best practice, including guidance published by investor groups.
This section of the annual report explains how the Group has applied the main principles of Leadership, Effectiveness, Accountability, Remuneration and Relations with shareholders outlined in the UK Corporate Governance Code issued in September 2014 (the Governance Code). A copy of the Governance Code is available at www.frc.org.uk. The directors consider that the Group has, throughout 2015, fully complied with the provisions of the Governance Code which applies to the year ended 31 December 2015.
Fair, balanced and understandableThe Board considers that the annual report and accounts, taken as a whole, is fair, balanced and understandable and provides the information necessary for shareholders to assess the Group’s position, performance, business model and strategy.
Risk management and internal controlThe Board has overall responsibility for the Group’s systems of internal control and risk management which is fundamental to the achievement of the Group’s strategic objectives.
Risk management The Board has established an ongoing process for identifying, evaluating and managing the significant risks faced by the Group, that has been in place for the year under review and up to the date of approval of this annual report. The process is regularly reviewed by the Board and is in accordance with the September 2014 edition of the Governance Code. The Group, for the purposes of applying the Code, comprises John Wood Group PLC and its subsidiaries1. For further details on the principal risks and uncertainties faced by the Group along with associated mitigations, monitoring and assurance please refer to pages 18 to 20.
Any system of internal control is designed to manage rather than eliminate the risk of failure to achieve business objectives and can only provide reasonable and not absolute assurance against material misstatement or loss.
The key elements of the ongoing procedures, which the directors have established to review the effectiveness of the system of internal control on an annual basis, are listed below. As a result of these ongoing procedures the Board’s assessment was that the overall internal control environment was operating effectively.
X Internal control structure
The Group has a clear organisational structure for the control and monitoring of its businesses, including defined lines of responsibility and delegation of authority. The Group has issued policies which define the standards of business conduct and include Accounting; Contract Risk Management and Review; Health, Safety, Security and Environment; and Business Ethics. A Group Business Ethics helpline, operated by an independent third party, is in place to enable staff and third parties to raise concerns in confidence about possible noncompliance with the Group’s Business Ethics Policy.
X Ongoing monitoring of internal control systems
The Board has agreed certain reporting procedures to monitor key risk areas on an ongoing basis, including safety, legal and financial matters. The Audit Committee has been delegated the responsibility to review the effectiveness of the internal financial and IT control systems implemented by management, and the Safety and Assurance committee has been delegated responsibility for the effectiveness of the Group’s safety policies and systems. At the end of 2015, responsibility for ethical and regulatory matters was in the process of being transferred to the Safety and Assurance committee, which will be renamed as the Safety, Assurance and Business Ethics Committee.
The Audit Committee is assisted by the internal audit function and, where appropriate, the external auditors. Where the internal or external auditors identify any significant deficiencies in the financial internal control system, a plan of action is agreed to remedy these and progress against them is tracked and reported with updates provided to the Audit Committee as necessary.
The Chairs of the Audit and Safety & Assurance Committees report regularly to the Board on their discussions.
The Wood Group PSN US business has expanded rapidly both through acquisition and organically. This has resulted in a degree of management stretch and pressure on the internal control environment which resulted in a relatively small number of control failures. During 2015 we took the opportunity to standardise and improve the internal control environment, and implementation will continue into 2016. As part of a wider Group initiative to simplify and consolidate our back office systems all US businesses will migrate to a single existing ERP system and transactional finance and HR activity will be transferred to service centres which will improve the consistency and effectiveness of the control environment in these areas. Operationally, improved management and reporting structures will aim to enhance compliance and the control environment in general. To provide assurance that these measures are operating effectively, an increased level of internal audit activity will be undertaken in 2016.
X Information and communication
The Group has a comprehensive system for reporting performance to the Board. This includes monthly and quarterly reports. The quarterly reports include a detailed financial review against budgets and latest forecasts. The Group ELT also receives detailed monthly financial reports and meets on a monthly basis to discuss financial performance and other operational matters. In addition, each SBU holds Quarterly Review Meetings (QRMs) involving the Group Chief Executive and the Group CFO.
Footnotes1. Subsidiaries include those entities which are under Group management and control.

John Wood Group PLC Annual Report and Accounts 201524
Mary Shafer-Malicki
Key experience: Public company boards, international oil & gas (including Europe, Asia and Africa)
Appointed: 2012 Worked for Amoco and BP for 26 years, latterly a Senior Vice President and CEO for BP Angola, with previous appointments in Vietnam, Aberdeen, Holland and the US, principally in upstream activities. She is currently a non-executive director of McDermott International, Inc. and of Ausenco Limited and is a member of industry councils at Oklahoma State University and the University of Wyoming.
Committee membership: Member of the Nomination, Safety & Assurance and Remuneration Committees
Jann Brown
Key experience: International oil & gas, public company boards, finance and public capital markets
Appointed: 2014 Spent her career in the accounting profession before moving into the oil industry, latterly as Managing Director and CFO of Cairn Energy PLC. She is immediate past President of the Institute of Chartered Accountants of Scotland (ICAS) and Chair of the Consultative Committee of Accountancy Bodies (CCAB), Audit Committee Chair of Troy Income and Growth Trust, a Trustee of Edinburgh University Development Trust and on the Board of the Scottish Ballet.
Committee membership: Chair of the Audit Committee and member of the Nomination Committee
David WoodwardIan Marchant
Thomas Botts
Jeremy Wilson
Board of Directors
Non-executive directors
Senior Independent DirectorChair
Key experience: Public company boards, power sector, finance and public capital markets, government and regulation
Appointed: 2006, Chair since 2014 Was Chief Executive of SSE plc, a leading UK energy utility company, for over 10 years until stepping down in mid 2013. He is currently a non-executive of Aggreko plc and Maggie’s Cancer Charity. Until December he was a Chairman of Infinis Energy plc and is the immediate past president of the Energy Institute.
Committee membership: Chair of the Nomination Committee
Key experience: International oil & gas (including North Sea, North America, Middle East and the Former Soviet Union)
Appointed: 2007 Retired in February 2016 from his role as Senior Management Adviser of Mubadala Petroleum LLC, a wholly owned subsidiary of Mubadala Development Company, a leading business development and investment company based in Abu Dhabi. Previously with BP for 36 years, latterly as President of BP Azerbaijan. In 2006 he was awarded the Companion of the order of St. Michael and St. George (CMG) for services to the international oil industry.
Committee membership: Chair of the Remuneration Committee and member of the Audit and Nomination Committees
Non-executive directors
Key experience: International oil & gas (including North America, Europe, South America, Middle East and Downstream)
Appointed: 2013 Formerly with Shell for 35 years, latterly as Global Head of Shell’s manufacturing business. He is a non-executive director of EnPro Industries, is Co-Chair of the Governor’s Task Force at the University of Wyoming, a Director of the University of Wyoming Foundation and is a long-standing member of the Society of Petroleum Engineers.
Committee membership: Chair of the Safety & Assurance Committee and member of the Nomination Committee
Key experience: Public company boards, finance and public capital markets
Appointed: 2011 Spent his career at J.P.Morgan, which he joined in 1987, until retiring in October 2013. He held a series of senior level positions at J.P.Morgan, including head of their European Mergers and Acquisitions Group, Global Co-Head of their Natural Resources and Diversified Industrial Group and latterly Vice Chair of the Energy Group, and was involved in a number of major oil & gas mergers over the years. He is a non-executive director of Tullow Oil plc and Chair of The Lakeland Climbing Centre.
Committee membership: Member of the Remuneration, Nomination and Audit Committees

Financial statementsGovernanceStrategic report
John Wood Group PLC Annual Report and Accounts 2015 25
Robin Watson David Kemp
Executive directors
Chief Executive Chief Financial Officer
Previous directors
Bob KeillerAppointed: 2011, retired December 2015 Group CEO since November 2012, formerly Chief Executive of Wood Group PSN from April 2011
Alan SempleAppointed: 2000, retired May 2015 Group CFO since 2000
Michel ContieAppointed: 2010, retired May 2015 Non-executive director and member of the Nomination, Remuneration and Safety & Assurance Committees
Executive Leadership Team
Dave StewartWG PSN CEO - 18 years with Wood Group
Michele McNicholWG Mustang CEO - 14 years with Wood Group
Bob MacDonaldWG Kenny CEO - 12 years with Wood Group
Sue McDonaldGroup Head of HR - 5 years with Wood Group
Nina SchofieldGroup Head of HSSE - 1 year with Wood Group
Steve WaymanGroup Head of Strategy & Development - 26 years with Wood Group
Find out more about our leaders at: www.woodgroup.com/about-us/our-leaders
Appointed: 2013 Group Chief Executive since January 2016. Formerly Chief Operating Officer from April 2015, CEO of Wood Group PSN and Managing Director of Wood Group PSN in the UK, having joined Wood Group in 2010. Prior to joining Wood Group served in a variety of leadership and management positions with Petrofac and Mobil. Serves as non-executive director of Oil & Gas UK, the Oil & Gas UK Contractors Council and the Scottish Business Board. Previously Work Group Co-Chair on the Step Change in Safety Leadership Team.
Committee membership: Safety & Assurance Committee
Appointed: 2015 Group CFO since May 2015, previously CFO of Wood Group PSN, having joined Wood Group in 2013. Prior to joining Wood Group served in executive roles at Trap Oil Group, Technip, Simmons and Company International, and Hess Corporation, working across Finance, M&A and Operations. Is a member of the Institute of Chartered Accountants of Scotland.
Committee membership: None

John Wood Group PLC Annual Report and Accounts 201526
Corporate governance
Role of the BoardThe Board focuses its time and energy on Group strategy, the annual budget, significant acquisitions, monitoring the performance of the management team, risk management, specifically focusing on principal risks and the overall system of internal control. The Executive Leadership Team is responsible for the implementation of Board decisions in these areas and all other aspects of managing the business.
Board compositionThe Board comprised 9 or 10 directors at various times during the year and decreased to 8 in 2016. At all times the non-executive directors comprised a majority of the Board (excluding the Chair) as recommended by the Governance Code.
A clear separation of the roles of the Chair and the Chief Executive has been agreed by the Board, in compliance with the Governance Code. The Chair is responsible for the leadership and effectiveness of the Board. He chairs the Board meetings, ensures the agendas are appropriate and is responsible for facilitating that all directors actively contribute to the determination of the Group’s strategy. The Chief Executive is responsible for the day-to-day management of the Group and implementation of the Group's strategy. He develops proposals for Board approval, and ensures that a regular dialogue with shareholders is maintained. Executive Board Members report directly to the Chief Executive.
Board independenceAfter careful consideration, the Board considers all of its non-executive directors to be independent in character and judgement and that there are no relationships or circumstances which are likely to affect, or could appear to affect, their judgement. Brief biographies of the directors appear on pages 24 to 25.
Board re-electionAll directors, other than David Woodward, will seek re-election at the 2016 AGM.
Board process and activityThere were six scheduled Board meetings during 2015, plus two unscheduled meetings. Four of the meetings were scheduled over two days and were held in London, Aberdeen and Houston. Safety and Assurance is always the first item on the agenda at Board meetings, and the Board also receive an HSSE update at each meeting. The Board received detailed presentations from senior operational and functional management across the Group’s businesses.
HSSE remains a focus at the Executive Leadership Team meetings which occur on a monthly basis. At these meetings, the Executive Leadership Team also receive updates on operational issues, finance, legal, business ethics & compliance, investor relations and HR.
On a more detailed basis, the strategic business unit CEOs conduct quarterly review meetings with the senior managers within their divisions, which are usually attended by the Group Chief Executive and the Group CFO.
A summary of the Group’s financial performance is made available to the Board on a monthly basis. The directors have access, via a secure intranet site, to presentations from the Group’s brokers which contain investors’ feedback, copies of relevant regulations, analyst research and appropriate administrative information.
Board programme & agenda
The Board schedules four two-day meetings and two calls on an annual basis. Within these meetings, the following are covered as standing agenda items: review of Governance and reports from Board Committees - Safety and Assurance, Audit and Remuneration, Chief Executive report, operations updates and functional updates - HSSE, HR, IT&S and Finance (including Acquisitions, Tax & Treasury and Investor Relations). The Board also receives a series of management presentations, and other matters arising which are set out in the table below:
Q1 Q2 Q3 Q4
2015 agenda items included
Review of preliminary results statement and annual report
AGM statement review Review of half year results and interim report
Viability Study
Strategy update Legal and Regulatory update Strategy update and review Group tax strategy
Annual Ethics presentation Risk review process Risk review Business level project controls review
Risk review Business level project controls review Strategy update and review
Dividend policy review
The Board allows for time on other items where necessary. In 2015, the Board devoted considerable time to discussing the market environment, including the implications of the uncertain market conditions. Potential acquisitions were discussed and the Board approved the acquisitions of Beta, ATG, Infinity and Kelchner.

Financial statementsGovernanceStrategic report
John Wood Group PLC Annual Report and Accounts 2015 27
Board performance evaluationThe Board evaluated its own performance and the performance of its Committees, individual directors, and the Chair during the year. In accordance with paragraph B.6.2. of the Governance Code, the Board retained Lintstock Limited (Lintstock) as advisers to facilitate the Board evaluation process. The evaluation involved directors completing detailed questionnaires, the results of which were analysed by the Chair and the Company Secretary and presented by way of a report for discussion at a Board meeting in December 2015 and in separate meetings between each director and the Chair.
The non-executive directors, led by the senior independent director, and taking into account the views of the executive directors, were responsible for evaluating the performance of the Chair. The directors met, in the absence of the Chair, in December 2015 to conclude these discussions, following which the senior independent director provided feedback to the Chair on his performance.
Key areas covered by the Board evaluation were the effectiveness of the Board and Committee meetings, individual director contribution and performance, and the nature & extent of the Board’s interaction with the management of the Group. The main observations from the evaluation were:
X The continued development of the Board's discussion of strategic considerations, industry trends and market factors, which will continue to be reflected in the Board schedule by prioritising time available at Board meetings for these deliberations
X A desire to continue to develop the Group’s material risk analysis with the Executive Leadership Team, focusing on risk appetite and likelihood, which is being addressed through the board’s ongoing risk review process
X A desire to continue the Board’s review of senior management succession planning, particularly below Executive Leadership Team level, which was subsequently considered at the Board’s meeting in February 2016.
Lintstock has no other connection to the Group.
Conflicts of interestThe Board requires directors to declare any appointments or other situations which would amount to a possible conflict of interest. The Board has procedures in place to deal with and, if necessary, approve any such conflicts.
Board developmentThe training needs of directors are periodically discussed at Board meetings and briefings arranged on issues relating to corporate governance. Arrangements are in place for newly appointed directors to undertake an induction process designed to develop their knowledge and understanding of the Group’s business. This includes briefing sessions during regular Board meetings, visits to Group operating sites and discussion of relevant business issues. Upon their appointment, directors are advised of their legal and other duties and their obligations as directors of a listed company and under the Companies Act 2006.
All directors are encouraged to attend relevant external seminars. There is a procedure for any director to take independent professional advice at the Group’s expense and all directors have access to the services of the Company Secretary, who is responsible for ensuring that the Board’s procedures are followed.
Board engagement with shareholdersOur investor relations activities are led by the Group’s Chief Executive and CFO, supported by the investor relations team and other members of senior management as appropriate. We provide the opportunity for significant shareholders to meet with the Chief Executive and CFO twice a year around the interim and final results announcements. In 2015, significant shareholders were also offered the opportunity to meet with the Chair. Our investor relations team organises ad-hoc meetings with management, manages capital markets day presentations for investors and analysts and maintains an ongoing dialogue with the financial community through analyst relationships.
The Company has been notified, in accordance with DTR 5, of the following major shareholdings in the Company as of 29 February 2016:
Name of shareholder
Number of voting rights
held% of issue
shares
Aberdeen Asset Management 41,619,373 10.98%
Schroder Investments 18,940,857 4.99%
APG Asset Management N.V. 18,914,688 4.99%
FIL Limited 18,868,227 4.98%
Ameriprise Financial 18,696,372 4.93%

John Wood Group PLC Annual Report and Accounts 201528
Corporate governance continued
Board and Committee meeting attendance 2015
Board
Safety & Assurance Committee
Nomination Committee
Audit Committee
Remuneration Committee
I Marchant 8/8 3/3
R Keiller 7/8 3/4
R Watson 8/8 3/3
D Kemp 6/6
T Botts 8/8 4/4 3/3
J Brown 8/8 3/3 4/4
M Shafer-Malicki 8/8 4/4 3/3 4/4
J Wilson 8/8 3/3 4/4 4/4
D Woodward 8/8 3/3 4/4 4/4
Committees of the Board
Safety & Assurance Committee
MembershipThe Committee comprises Thomas Botts, Chair, Mary Shafer-Malicki, the Group Chief Executive and Group Head of HSSE.
ResponsibilitiesThe Committee meets at least twice a year, and has written terms of reference (which are available on the Group’s website) setting out its responsibilities.
Main responsibilities are to review and make recommendations to the Board regarding:
X the Group’s Safety & Assurance strategy and performance
X the effectiveness of the Group’s policies and systems, and evidence of a prevalent safety culture
X Safety leadership development throughout the Group, particularly in frontline operations
“The Safety & Assurance Committee is responsible for overseeing the Group’s management of Safety and Assurance (including personal security), in line
with the Group’s core value commitment”
Thomas Botts Chair, Safety & Assurance Committee
The Board has delegated some of its responsibilities to Committees – the Safety & Assurance Committee, the Nomination Committee, the Audit Committee and the Remuneration Committee.
A summary of the Safety & Assurance, Nomination and Audit Committees' work is set out below. The report of the Remuneration Committee is included in the Directors’ Remuneration Report on pages 32 to 46. The Charters of the Board’s Committees are available on the Group’s website. Attendance by directors at the meetings of the Board and its Committees is summarised in the table. The dates of future Board meetings have now been agreed until the end of 2016.
X the quality and integrity of the Group’s internal and external reporting of Safety & Assurance performance and issues
X the Group’s preparedness for response to a major safety or security incident
X the process for and outcomes of investigations into major safety and security incidents and the effectiveness with which recommendations are assimilated throughout the Group
X the expertise and appropriateness of the structure of the Safety & Assurance function throughout the Group.
The Committee met four times in 2015.
The remit of the Group’s Safety and Assurance Committee has now been extended to include oversight of Business Ethics and will be known in 2016, as the Safety, Assurance and Business Ethics Committee.
Read the Safety & Assurance Committee terms of reference at: www.woodgroup.com/investors/charters
Financial statementsGovernanceStrategic report
John Wood Group PLC Annual Report and Accounts 2015 29
MembershipThe Nomination Committee comprises the Chair and all of the independent non-executive directors.
ResponsibilitiesThe Committee meets at least once a year, and met three times in 2015. It operates within a written charter setting out its roles and responsibilities.
Main responsibilities:
X reviewing Board structure, size and composition
X making recommendations to the Board with regard to any changes
X identifying and nominating candidates for the approval of the Board
X filling Board vacancies
X ensuring succession plans are in place.
The Committee met early in the year, to consider and recommend committee appointments and the renewal of Mary Shafer Malicki’s appointment as a non-executive director for a further term of three years. The committee also received an update from its advisers, Korn Ferry, on the search for further non-executive directors as a longer-term succession planning exercise.
In August the Committee reviewed executive succession planning. This included the timing of Chief Executive succession and recommended to the Board that Robin Watson should, at the appropriate time, succeed Bob Keiller as Chief Executive. Following further discussions with both Bob and Robin, the Board approved the change in October and a handover at the end of the year was agreed, allowing Robin to take full ownership of performance in 2016.
Nomination Committee
“The Nomination Committee met three times during the year to consider Board and Committee appointments and CEO succession planning.”
Ian Marchant Chair, Nomination Committee
In the final quarter of the year, the Committee again met to consider and recommend the renewal of Tom Botts’ appointment as a non-executive director for a further term of three years and the appointment of Bill Setter as Company Secretary. The committee also considered feedback on interviews with a number of short-listed candidates for appointment as a non-executive director.
Committee evaluationIn the final quarter of the year the Committee assessed its own performance during the year and concluded that it had benefitted from more frequent meetings during the year and would continue to meet on a more regular and structured basis.
The Committee is cognisant of the Governance Code’s requirement to pay due regard to the benefits of diversity, including gender when conducting a search for Board candidates. Wood Group is committed to remaining an equal opportunities employer.
Read the Nomination Committee charter at: www.woodgroup.com/investors/charters

John Wood Group PLC Annual Report and Accounts 201530
The Committee has a written charter of responsibilities which is reviewed on an annual basis, setting out its roles and responsibilities.
The Committee met four times in 2015. At each meeting the following was covered: compliance with financial reporting standards and relevant financial reporting requirements; the consideration of the internal financial control environment; the internal audit programme and results; and review of the external audit relationship and provision of non audit services.
Q1 Q2 Q3 Q4
Review of the 2014 Group Financial Statements including Going Concern review
Internal Audit succession planning Review of the 2015 Group Interim Financial Statements including Going Concern review
Review of upcoming year end issues
Review of 2014 external audit status and assessment of external audit effectiveness
Accounts Receivable update including a review of Credit Risk policy
Review of 2015 Interim external review status
Review of 2015 external audit plan and fees
Review of the 2014 Audit Committee Corporate Governance Report
Update from the Head of Tax and Treasury including a review of material tax provisions
Update from internal audit on IT Assurance
Review and response to Audit FRC quality review
Review of whistleblowing procedures Review of plan and timeline for the external Audit Tender
Review and approval of 2016 Internal Audit Plan
Review of future external audit tendering process
Review of sensitivities and stress testing scenarios related to the 2015 Viability Statement
Jann Brown Chair, Audit Committee
X Impairment reviews At both the half year and the year end the Committee considered where indicators of impairment existed and the results of any related impairment reviews. Annual reviews are routinely carried out in relation to goodwill and intangible assets, with the committee’s role being primarily to challenge the significant assumptions and estimates made to ensure that they are fit for purpose. Other than as set out below, no impairments were noted.
It became apparent in the second half of 2015 that the EthosEnergy JV was not performing in line with the forecasts provided for 2015. The Committee reviewed the assumptions, including growth rates and discount rates, which were used to calculate the revised carrying value of $192.2m and was satisfied with the calculation of the impairment charge of $159m. In subsequent periods the Committee will continue to monitor performance against this revised forecast.
The external auditors assessed this as an area of particular focus and the Committee received updates on related work undertaken by PwC.
X Review of significant contractsDuring 2015, the Committee reviewed the Group’s largest ongoing contracts including those executed on a fixed price and lump sum basis. Management judgement features in the recognition of revenue on all contracts, and of the profit or loss on lump sum and fixed price contracts, albeit these contracts only accounted for a small percentage of the Group’s revenue in 2015. During the year the Committee reviewed the status of significant contracts and the accounting for these.
Membership and responsibilitiesThe Audit Committee comprises Jann Brown (Chair, recent and relevant financial expertise), Jeremy Wilson, and David Woodward.
The Group CFO, Group Financial Controller, Group Head of Internal Audit and the external auditors, PricewaterhouseCoopers LLP (PwC) were invited to attend all Audit Committee meetings. During the year other relevant people from the business presented to the Committee on the topics set out in the table above. The Group Head of Internal Audit and PwC have the right of direct access to the Chair of the Committee at all times, and to meet the Committee without management present.
The Chair of the Committee reports to each Board meeting on the activity of the Committee.
During the year the Committee focused on the following areas:
Financial reporting and significant accounting issuesThere were no new accounting standards which had a material impact on the Group during the year, and the Committee focused on the application of our accounting policies and on the areas of judgement and estimation.
The primary areas of judgement and estimation considered by the Committee in relation to the 2015 financial statements and how they were addressed are outlined below.
Audit Committee
"Our meetings covered a wide range of topics including the effectiveness of the Group’s internal financial controls, the integrity of the Group’s financial reporting
and the effectiveness of the internal and external audit processes.”
Read the Audit Committee charter at: www.woodgroup.com/investors/charters
Corporate governance continued

Financial statementsGovernanceStrategic report
John Wood Group PLC Annual Report and Accounts 2015 31
X Current and deferred tax balancesThe Group operates in a number of different tax regimes and a range of judgements underpins the calculations for both current and deferred tax. In the Income Statement, these can have an impact on both the tax charge and the operating profit. The Committee receives detailed reporting on taxation from senior management and, where necessary, on the advice received from professional advisory firms. This has been recognised by PwC as an area of higher audit risk and the Committee received updates on related work undertaken by PwC.
X Review of provisionsThe Committee considers the appropriateness, adequacy and consistency of approach to provisioning at each meeting. All material provisions, including those made against uninsured legal claims and doubtful debts, are discussed and challenged. Given the uncertain economic climate for the oil and gas companies which form the core customer base of the Group, there was a focus in the year on the recoverability of receivables and on the processes in place to assess and monitor credit risk.
Internal financial controlThe Board is ultimately responsible for the Group’s system of internal control and for reviewing its effectiveness. The Audit Committee has been given the responsibility to review the effectiveness of the internal financial control systems implemented by management. This work is informed by regular updates from the Group Head of Internal Audit and the results of the financial risk self-assessment process undertaken across the Group. External audit also provide feedback on areas of financial control which they wish to bring to the Committee’s attention.
X Internal auditMonitoring the activity of the Group Internal Audit function is an agenda item at each Committee meeting. Each year, the Committee agrees the plan to be carried out and receives regular updates on progress against this plan, including a summary of the key findings from each of its reviews, an update on the status of actions agreed with management and a note of any themes or emerging risk areas to be considered by the Committee. In August 2015 the Committee received a presentation on the work performed by internal audit on the Group’s IT systems, processes and controls and this focus will continue into 2016.
The Chair of the Committee holds private discussions with the Group Head of Internal Audit as necessary during the year outside the formal Committee process.
X External auditAs part of the external audit process, PwC prepare an audit plan identifying their assessment of key audit risks. These risks are discussed during the year with input from management and the Group Head of Internal Audit as necessary, providing the Committee with an opportunity to understand, challenge and ultimately agree with the auditors which areas should be covered. The Committee assessed the effectiveness of the audit process through consideration of the reporting received from PwC at the half year and the year end, the robustness of the external auditors’ handling of key judgemental areas and the quality of the external auditors’ interaction with, and reporting to, the Committee.
The Committee also reviews the standing, experience and tenure of the external audit lead partner, the arrangements for ensuring the independence and objectivity of the external auditors and the nature and level of non-audit services provided. In addition, we conduct an annual exercise to seek feedback from around the Group on the effectiveness of the external audit process.
During the year PwC’s 2014 year-end audit file was selected for a quality review by their external regulator, the Financial Reporting Council (FRC). The Committee received a summary of the results of the review from the FRC. All points for improvement raised by the FRC were discussed and actions were agreed with the lead audit partner. The committee is satisfied that the appropriate follow up actions identified in the review have been addressed. Opportunities were provided for open dialogue and feedback between the external auditor and the Committee without management being present throughout the year.
X Appointment and independenceThe Committee has overall responsibility for ensuring that the external auditors’ independence and objectivity is not compromised.
The Committee considers the reappointment of the external auditor each year and also assesses their independence on an ongoing basis. During the year the committee received confirmation from the external auditors regarding their independence. In accordance with UK regulations and to help ensure independence, the auditors adhere to a rotation policy based on Auditing Practices Board standards that require the Group audit partner to rotate every five years. This is the third year that Lindsay Gardiner, the current lead audit partner, has been involved in the audit of the Group.
During the year and in compliance with the provisions of the UK Competition & Markets Authority (CMA) Order we decided to conduct a tender for the audit during 2016. To allow a transition of non audit services currently performed by firms tendering for the audit (see next section below), it is currently intended that the appointment would take effect for the audit of the year ending 31 December 2018. Although we remain satisfied with the effectiveness of the current external auditors, PwC, they have been in place since the Group became a publicly listed company in 2002. This means that they would be subject to mandatory rotation within four years of the new appointment, and for that reason they have not been asked to submit a tender. We have consulted our major shareholders on the process and on the firms we intend to invite to tender and the Committee will take the feedback received into account.
The Committee provided the Board with its recommendation to shareholders on the reappointment of PwC as external auditor for the year ending 31 December 2016. Accordingly a resolution proposing the reappointment of PwC as the Group’s external auditor will be put to shareholders at the 2016 AGM. There are no contractual obligations that restrict the Group’s choice of external auditors.
X Non-audit servicesOne of the key risks to external auditor independence is the provision of non-audit services by the external auditor. The Group’s policy in this area, which is set out in the Audit Committee’s terms of reference, is clear. The Committee considers and approves fees in respect of non-audit services provided by the external auditors in accordance with Policy and the cost of non-audit services provided in 2015 is reported in note 3 to the financial statements. In the opinion of the Committee, the provision of these non-audit services did not impair PwC’s independence.
Committee evaluationThe Committee’s activities formed part of the external review of Board and Committee effectiveness performed in the year. The key actions to be added to the Terms of Reference for the Committee in 2016 and beyond are:
X to monitor succession planning in the finance, tax & treasury and internal audit functions; and
X to ensure that the Committee is kept fully up to date on current developments relevant to its responsibilities.

John Wood Group PLC Annual Report and Accounts 201532
Directors’ Remuneration Report
Contents
32 Letter from the Chair of the Remuneration Committee
34 Remuneration Committee
35 Statement of shareholder voting
36 Part 1 Policy Report
36 Part 2 Annual Statement on Remuneration
36 2.1 Single figure of remuneration for each director *
40 2.2 Pension related benefits *
41 2.3 Long Term Plan interests awarded during the year *
41 2.4 Payments to past directors *
41 2.5 Payments for loss of office *
42 2.6 Statement of directors shareholding and share interests *
44 2.7 TSR performance summary & CEO remuneration
44 2.8 Percentage change in CEO remuneration
45 2.9 Relative importance of spend on pay
452.10 Statement of implementation of Remuneration Policy in the following financial year
* Audited Unless otherwise noted, the remaining sections of the Directors’ Remuneration Report are not subject to audit.
The Directors Remuneration Report (DRR) is the Board’s report to shareholders on directors’ remuneration for year ending December 2015 and is in three main sections:
The Board’s Report includes the Letter from the Chair of the Remuneration Committee reflecting on the activities of the Remuneration Committee for the year ending December 2015 and future application of the Group’s Directors’ Remuneration Policy. This section also provides details of the Remuneration Committee and the statement of shareholder voting.
Part 1: Policy Report, contains the agreed Directors Remuneration Policy, and
Part 2: Annual Statement on Remuneration contains the annual report on remuneration, which includes a summary of the key considerations and decisions taken by the Committee on Directors’ remuneration during the year ending December 2015.
Dear ShareholderOur well established remuneration policy continues to support our objective to provide a compensation package that promotes the long-term success of the Group. We do this through a balance of fixed and variable pay, which we intend will result in competitive total remuneration packages that attract and retain key executives while creating an appropriate alignment between incentivised executive performance and the interest of shareholders.
During 2015, our focus has been on setting plan targets which adequately incentivise and reward while reflecting Group performance. We determined the remuneration packages for the newly appointed Group Chief Executive and Group CFO and arrangements for their departing predecessors and consulted key shareholders on these proposals. We continued efforts to simplify and standardise the variable pay structure for executive directors and senior managers and to improve presentation and disclosure in the Directors Remuneration Report.
Conditions in oil and gas markets remained very challenging throughout 2015 and the financial performance of the Group reflects this. Against the continued market backdrop of low oil prices, increased focus on efficiency by oil & gas operators, generally, and the consequential reduction in investment in certain areas, Group EBITA was down 15% on 2014, which resulted in significantly reduced annual bonuses of between 37% and 40% of maximum being awarded to executive directors. The 2015 Group performance also contributed to a low long-term incentive plan (LTIP) pay-out for the performance period 2013 – 2015 as a result of a reduction of AEPS over the three year period and TSR second quartile performance against selected peer companies at 6 out of 16. Our relative performance against the TSR peer group reflects the Group’s commitment to cost discipline and the resilience and flexibility of our business model.
As part of our effort to simplify and standardise the variable pay structure for executive directors and senior managers, Group targets were applied to all participants in the long-term incentive plan for the performance period commencing 2015 with the performance measures being 75% AEPS and 25% TSR. In conjunction with a general review of arrangements for 2016, and consistent with feedback received from shareholders, we decided to adjust the balance of performance measures for long-term incentive plan performance periods commencing in 2016 and beyond to 50% AEPS and 50% TSR.
Letter from the Chair of the
Remuneration Committee

Financial statementsGovernanceStrategic report
John Wood Group PLC Annual Report and Accounts 2015 33
We believe this balance is more suited to the cyclical nature of Wood Group’s business and puts additional weighting on our performance relative to our peer group. We continue to ensure compliance with the UK Corporate Governance Code and our annual bonus and long-term incentive scheme rules contain both clawback and malus provisions from 2015 onwards.
We considered executive directors’ and senior executives’ remuneration packages for 2016 and concluded that there should be no general salary adjustment. On appointment of Robin Watson to the role of Group Chief Executive from 1 January 2016, we determined that his base salary would be increased to £600,000 with his annual bonus opportunity remaining at 125% of base salary and LTIP award at 150% of base salary. Robin’s notice period was increased to 12 months from 6 months in accordance with our policy. David Kemp was appointed to the role of Group CFO in May 2015 following the retirement of Alan Semple. We determined to increase his salary from £350,000 to £390,000 with effect from 1 January 2016 reflecting his progress to date and his expanded role within the new Executive Leadership Team structure to include responsibility for Group Legal; his annual bonus opportunity and LTIP award will remain at 125% of base salary.
We also determined the remuneration arrangements for Alan Semple as he stepped down from the Board on 13 May 2015, and subsequently retired from Wood Group on 30 June 2015; and Bob Keiller as he retired from Wood Group on 31 December 2015. These arrangements were in line with our agreed policy and are fully documented in this report.
In setting targets for the 2016 annual bonus and LTIP 2016-2018 performance period, we considered the continuing challenging market conditions in the oil & gas sector and the uncertainty that these conditions bring. We have also been mindful to support the long-term success of the company by ensuring the retention and incentivisation of a team of high calibre executive directors and other senior managers focused on delivery to shareholders. The targets for the LTP 2016-2018 performance period are provided in Part 2 of this report; 2016 annual bonus targets will be disclosed retrospectively in next year’s DRR.
During 2015 we supported the introduction of an all employee share plan in 2016 intended to broaden employee share ownership. A resolution on the share plan put to shareholders at the 2015 AGM received unanimous support with 100% of the vote in favour. Over 1,440 employees have chosen to invest in the Company during the first enrolment period of the plan; 88% of those who have enrolled have not previously participated in a Wood Group share based scheme.
Our remuneration policy is due for renewal at the 2017 AGM. During the course of 2016 we will reflect on whether our existing policy remains appropriate and whether any changes may be required. In line with our normal approach and our commitment to shareholder engagement, we will consult with shareholders in relation to any significant changes.
I trust that in the report for 2015 we have clearly explained our application and intentions regarding future implementation of the Group’s Directors’ Remuneration Policy and I hope you will be able to support the relevant resolution.
David Woodward Chair, Remuneration Committee Date: 22 February 2016

John Wood Group PLC Annual Report and Accounts 201534
Directors’ Remuneration Report continued
Remuneration CommitteeDuring 2015, the Remuneration Committee comprised the following independent non-executive directors: David Woodward (Chair), Michel Contie, Mary Shafer-Malicki and Jeremy Wilson. Mary Shafer-Malicki joined the Committee in February 2015; Michel Contie retired at the AGM in May 2015, and also stepped down from the Board.
The Remuneration Committee advises the Board on executive remuneration and sets the remuneration packages of each of the executive directors within the approved policy. The Committee has a written charter which is publicly available on the Group’s website.
Where appropriate, the Committee receives input from the Group Chair, Group Chief Executive, Group CFO, Group Head of Human Resources and the Director of Compensation & Benefits. This input never directly relates to their own remuneration. The Company Secretary attended the February 2015 Committee in his role as Secretary to the Committee; the Director of Compensation & Benefits was subsequently appointed Secretary to the Committee in May 2015.
The aim of the Committee is to establish an overall remuneration structure which will:
X promote the long-term success of the Group
X reflect the size and complexity of the Group’s business
X take account of executives’ individual responsibilities and geographical location
X attract, retain and motivate executives
X clearly align remuneration with the Group’s long-term strategy and the pursuit of maximising shareholder value
X take into account the broader setting of pay conditions elsewhere within Wood Group.
In setting remuneration policy the Committee gives full consideration to the relevant provisions of the Governance Code and relevant regulations enacted under the Companies Act 2006.
During 2015, the Committee met four times to discuss the remuneration issues arising and the operation of the remuneration policy. There was full Committee attendance at each of these meetings. The Committee considered the following matters during 2015:
Agenda Items Matters
Executive remuneration
Determined executive remuneration for 2015 and confirmed arrangements for 2016
Review of executive remuneration agreed, including executive risk review; recommendations considered
Annual Bonus
Confirmed executive 2014 annual bonus payment
2015 annual bonus objectives agreed
Reviewed bonus target setting philosophy
Considered projected annual bonus outcome for 2015
Reviewed summary of arrangements for 2016
LTIP/LTP
Approved LTIP payments for performance period 2012-2014 and deferred element for performance period 2010-2012 2015-2017 targets and participants agreed
Reviewed LTIP target setting philosophy
Progress against targets reviewed
Considered potential LTP awards for 2016
AGM / DRR Reporting
2014 Directors Remuneration Report approved
AGM preparation, including shareholder consultation
Agreed approach to 2015 DRR and first draft of the 2015 annual report for approval at 2016 AGM
Reviewed feedback from shareholder consultation
Committee matters
Reviewed and approved Committee charter
Completed Committee performance evaluation against 2015 objectives
Committee objectives for 2016 agreed
Other business Employee share plan structure and rules agreed
Approved Alan Semple and Bob Keiller retirement arrangements
During the year, the Committee took advice from Deloitte LLP, who was retained as external advisor to the Committee. Deloitte adhere to the Remuneration Consultants’ Group’s Code of Conduct. Deloitte received £24,650 for the provision of services to the Committee during the year. These fees consisted of core services (where the cost was agreed in advance) and additional services (which were charged on a time and materials basis). As well as advising the Remuneration Committee Deloitte provided tax consulting and global mobility services to the Group in 2015. The Committee has reviewed the remuneration advice provided by Deloitte during the year and is comfortable that it has been objective and independent. The Committee has reviewed the potential for conflicts of interest and judged that there were appropriate safeguards against such conflicts.
Read the Remuneration Committee charter at: www.woodgroup.com/investors/charters

Financial statementsGovernanceStrategic report
John Wood Group PLC Annual Report and Accounts 2015 35
Statement of shareholder votingThe Committee encourages shareholder engagement. Where there are a substantial number of votes against any resolution on directors’ remuneration, the Committee seeks to understand the reasons for any such vote, and will detail here any actions in response to it.
The following table sets out the 2014 AGM voting in respect of our remuneration matters:
Item For (a) AgainstNumber of
Abstentions (b)
Number of votes cast % of votes cast Number of votes cast % of votes cast
Advisory vote on the 2014 annual report on Remuneration (2015 AGM)
266,650,906 92.01% 23,160,732 7.99% 4,855,982
Approval of all employee share plan 275,531,521 100% 13,113 0% 19,122,986
Notes to the Statement of shareholding voting
(a) Discretionary votes have been added to “For” votes.
(b) A vote abstained is not a vote in law and is not counted in the calculation of the percentage of votes “For” or “Against” a resolution.
The Committee was pleased to note the significant reduction in the number of abstentions from voting in 2014 from 31 million to 4.85 million in 2015 with regard to the advisory vote on the 2014 annual report on Remuneration.

John Wood Group PLC Annual Report and Accounts 201536
Directors’ Remuneration Report continued
Part 1 Policy reportThe Group Directors’ Remuneration Policy was approved by shareholders on 14 May 2014 at the 2014 AGM and took effect from that date. There are no proposed changes to the policy for 2016, and therefore no requirement for a shareholder vote on this part of the DRR at the 2016 AGM.
Contained in Part 2 of this report, section 2.10, are details of how the Director’s Remuneration Policy will be applied in 2016; this part of the DRR will be subject to an advisory vote by shareholders at the 2016 AGM.
Part 2 Annual report on remuneration
2.1 Single figure of remuneration for each executive directorThe following table set out the single figure of remuneration for each of the executive directors, split between those based in the UK and the US.
Executive directors - UK based (£’000)
Year Salary (a) Benefits (b) Bonus (c)
Long-term incentives (d)
Pension related benefits (e) Total (f)
Bob Keiller 2015 £630 £14 £294 £114 £94 £1,146
2014 £560 £14 £378 £294 £84 £1,330
Robin Watson (g) 2015 £468 £14 £225 £57 £70 £834
2014 £379 £14 £304 £260 £57 £1,014
David Kemp (h) 2015 £222 £8 £107 £32 £35 £404
Executive directors - US based ($’000)
Alan Semple (i) 2015 $327 $8 $175 $82 $62 $644
2014 $653 $31 $392 $363 $151 $1,590
Notes to the single figure of remuneration (executive directors)
(a) Salary received during the year.
(b) Taxable benefits received during the year. Taxable benefits include company car or car allowance, private medical, dental and contributory health and welfare cover as applicable. For those directors based in the US, the cost of benefits reflects the amounts that would be chargeable to UK income tax if the director were resident in the UK for tax purposes.
(c) Bonus awarded in relation to the year inclusive of all amounts subject to further deferral.
(d) The value of long-term incentives which vested in respect of performance periods ending during the year inclusive of all amounts subject to further deferral; this figure also includes dividends. The LTIP award for performance period 2013-2015 accrues dividends which are paid as additional share options; 80% is paid following the end of the performance period and 20% deferred for two years. The deferred element may continue to attract dividends which will be reported in the period which they are received. The figures have been calculated using the number of share options that vested multiplied by the closing mid-market share price on 31 December 2015 of £6.125. The exchange rate at 31 December 2015 of £1 = $1.4739 was used for those executive directors paid in US dollars.
(e) Pension figure reflects cash value of Defined Contribution pension contribution or cash alternative or, for defined benefits style arrangements, figures are calculated in accordance with the basis set out in The Large and Medium-sized Companies and Groups (Accounts and Reports) (Amendment) Regulations 2013. Further detail in relation to individual pension arrangements is provided in section 2.2 on page 40.
(f) The single figure of remuneration, being the sum of columns (a) to (e) inclusive.
(g) Robin Watson’s annual salary and bonus was calculated using a hybrid salary. This was calculated pro rata and comprises of his role as CEO for WGPSN from 1 January 2015 to 5 April 2015, where his salary was £378,500; and his salary of £500,000 from 6 April 2015 onwards following his promotion to Group Chief Operating Officer.
(h) David Kemp was appointed as executive director from 13 May 2015; the information shown here reflects his remuneration arrangements as executive director with the exception of long-term incentives which is based on performance period 2013-2015 and reflects his salary at the commencement of the performance period. The pro-rata bonus is based on a hybrid annual salary comprising of £300,000 in his role as Deputy Group CFO from 1 January to 12 May 2015, and his salary of £350,000 as Group CFO from 13 May to 31 December. 125% maximum bonus opportunity applied.
(i) Alan Semple was based in the US and received his remuneration in US dollars. All figures in the above table are therefore expressed in US dollars. Alan Semple retired from the board on 13 May 2015; and subsequently from Wood Group on 30 June 2015. His remuneration for 2015 reflects the period up to his employment end date of 30 June 2015.
The Directors’ Remuneration Policy with updated scenario charts can be found at: www.woodgroup.com/rempolicy

Financial statementsGovernanceStrategic report
John Wood Group PLC Annual Report and Accounts 2015 37
Single figure remuneration % of total reward 2015
Bob Keiller
Salary 55%
Benefits 1%
Bonus 26%
Long-term incentives 10%
Pension related benefits 8%
Robin Watson
Salary 56%
Benefits 2%Bonus
27%
Long-term incentives 7%
Pension related benefits 8%
David Kemp
Salary 55%
Benefits 2%
Bonus 26%
Long-term incentives 8%
Pension related benefits 9%
Alan Semple
Salary 50%
Benefits 1%
Bonus 27%
Long-term incentives 13%
Pension related benefits 9%
Single figure remuneration for Chair and non-executive directors
The following table sets out the single figure of remuneration for the Chair and each of the non-executive directors. Further details on the non-executive director fee structure is set out on page 46.
Chair & non-executive directors single figure of remuneration (£’000)
Year Total Fees
Ian Marchant (a) 2015 £275
2014 £205
Thomas Botts 2015 £60.5
2014 £62
Jann Brown (b) 2015 £60.5
2014 £35
Michel Contie (c) 2015 £20.4
2014 £56
Mary Shafer-Malicki 2015 £55.5
2014 £56
Jeremy Wilson 2015 £55.5
2014 £54
David Woodward 2015 £65.5
2014 £69
Notes to the single figure of remuneration (Chair & non-executive directors)
(a) Ian Marchant was appointed Chair at the end of the AGM on 14 May 2014. His remuneration for 2014 includes fees received in his previous role as non-executive director up to 14 May 2014 and his remuneration as Chair from that date onwards.
(b) Jann Brown was appointed 15 May 2014.
(c) Michel Contie retired from the board at the AGM in May 2015. His fee reflects his service pro rata.

John Wood Group PLC Annual Report and Accounts 201538
Directors’ Remuneration Report continued
DSO
EBITA
Bonus For 2015, maximum bonus opportunity was 125% of base salary for all executive directors. Bonus measures were split between financial (60%) and non-financial (40%) measures illustrated in the chart below:
Relative weighting (% of bonus opportunity)
0% 10% 20% 30% 40% 50% 60% 70% 80% 90% 100%
financial measures 60% non-financial measures 40%
48% 12% 20% 20%
Corporate objectives
EBITA DSO Personal objectives
Financial measuresGroup financial targets applied to all executive directors. The financial measures consisted of EBITA (48%) and DSO (days sales outstanding) (12%), which is a key contributing factor to cash flow. The relationship between performance against financial targets and bonus achieved is set out and illustrated in the graphs.
For both financial measures, threshold performance must be met before any award will be paid. If the financial targets set are achieved, 70% of the potential bonus opportunity was paid. Maximum bonus opportunity was achievable when results met or exceeded maximum performance. Performance between threshold and target and between target and maximum resulted in a proportionate award calculated on a straight-line basis.
For DSO, threshold performance was 110% of the target set and maximum was 90%. The monthly average is taken over the year, and a lower DSO indicates better performance.
For EBITA, threshold performance was 90% and maximum bonus was achieved at 110% of the target set.
The financial targets for the bonus year ended 31 December 2015, and the extent to which they were achieved, are set out in the table below.
Measures Threshold Target Maximum Achieved%
achieved
Group EBITA $474.5m $527.2m $579.9m $469.7m 89.1%
Group DSO 69 days 63 days 57 days 66 days 104.8%

Financial statementsGovernanceStrategic report
John Wood Group PLC Annual Report and Accounts 2015 39
Non-financial measuresNon-financial measures total 40% and were split between corporate objectives (20%) and individual personal objectives (20%). Corporate objectives related to HSSE and assurance, business growth and strategic framework delivery. Personal objectives related to collaboration across the Group, executive succession and development, cost efficiency and customer and stakeholder engagement.
Achievement of non-financial objectives is considered by the Chair of the Board and the Remuneration Committee as part of the annual review process. Assessment against each of the objectives is based on demonstrable evidence of achievement during the year. Non-financial objectives and achievement as agreed by the Committee for the bonus year ended 31 December 2015 are set out in the table below:
Executive director Corporate Objectives Personal Objectives AchievementBob Keiller HSSE & Assurance:
increased focus on HSE assurance; embed HSE initiatives across the business
Business Growth: Group EBITA increase, a proportion of which to come from organic growth
Strategic framework: SG&A savings target Acquisition pipeline health
Ensure the regional shared service model is implemented & realising cost savings
Customers and stakeholder engagement
Executive team succession planning and development
Strategic framework: measure and report progress against focus areas
82.5%
Robin Watson WGPSN objectives: ensure WGPSN on course to deliver 2015 objectives
Succession and development: succession plan in place; new members of executive team
Collaboration: increase collaboration across the SBU’s; improve operational alignment
85.0%
David Kemp Succession and development: successful transition to Group CFO role
Cost efficiency: implementation of finance shared services; IT&S review
85.0%
Alan Semple Succession and development: ensure transition of Group CFO role; ensure wider functional succession plan in place across Group
96.2%
Achievement of personal objectives in 2015 recognised measurable improvement in HSSE performance, four successful acquisitions, delivery of overhead cost efficiency savings in excess of $148m across the Group, and successful transitions across the executive leadership team including Robin Watson’s move to Group Chief Executive, David Kemp’s move to Group CFO, and a number of internal promotions within the senior executive teams in the three SBUs.
Bonus award achievement summary:The table below shows overall bonus achievement for each of the executive directors. Payment of 50% of the total bonus was deferred in the form of nil cost share options for a further two years (based on an average share price computed using the 20 day trading average in the period running up to 31 December 2015), with continued employment a requirement to receive the deferred payment, other than for those classified as good leavers.
Executive Director
Financial award Non-financial award
Total award as % of salary
Total bonus payment
Total award as % of max bonus
opportunity% salary achieved Payment
% salary achieved Payment
Bob Keiller 5.5% £34,398 41.3% £259,875 46.7% £294,273 37.4%
Robin Watson 5.5% £25,566 42.5% £199,004 47.9% £224,570 38.4%
David Kemp (b) 5.5% £12,133 42.5% £94,444 47.9% £106,578 38.4%
Alan Semple (c) 5.5% $17,839 48.1% $157,022 53.5% $174,861 42.8%
Notes to bonus award achievement
(a) Robin Watson’s bonus award was calculated on a hybrid salary as detailed in note (g) to the single figure of remuneration table on page 36.
(b) David Kemp was appointed as executive director from 13 May 2015; his bonus achievement is pro rata and calculated on a hybrid salary as detailed in the note (h) to the single figure of remuneration table on page 36.
(c) Alan Semple retired from the Board 13 May 2015; his bonus achievement was pro rata up to his employment end date 30 June 2015.
Details relating to 2014 bonus awards can be found in the 2014 Annual Report: www.woodgroup.com/investors/annual-interim-reports

John Wood Group PLC Annual Report and Accounts 201540
Directors’ Remuneration Report continued
Long term incentives – Long Term Incentive Plan (LTIP) The figures set out in the single figure of remuneration table are related to awards under LTIP 2013-2015, which vested at 31 December 2015. Maximum awards and LTIP measures under the performance period 2013-2015 were as per the table below for the executive directors:
Name Participation Level
Performance Measures split
TSR AEPS EBITA
Bob Keiller 150% 25% 75%
Robin Watson 125% 25% 37.50% 37.5% WGPSN division
David Kemp 100% 25% 25% 50% WGPSN division
Alan Semple 125% 25% 75%
TSR is “Total Shareholder Return” and is a measure of the growth in Wood Group’s share price plus dividends and other shareholder returns over the period and performance is measured relative to a peer group of comparative companies. Each company is ranked and Wood Group’s position in this group is taken as a measure of success. The TSR comparator peer group for Wood Group in 2015 comprised Aker Solutions, AMEC Foster Wheeler, Chicago Bridge & Iron Company, Fluor, Jacobs Engineering, KBR, McDermott, Petrofac, Saipem, SBM Offshore, Sulzer, Technip, Weir Group, Worley Parsons and WS Atkins.
AEPS and EBITA are determined using actual foreign exchange rates. No adjustments are made to reflect changes in currency from the date the targets are set.
The targets for LTIP 2013-2015, and the extent to which they were achieved, are set out below. On reaching the threshold, 25% of the relevant measure becomes payable; and on reaching the maximum, 100% of the relevant measure becomes payable. For achievement between threshold and maximum, the allocation is on a straight line basis.
For the 2013 to 2015 cycle all vestings were made as nil cost options. For all participants, 80% is paid following the end of the performance period and 20% of the share options awarded is deferred for a further two years. This contributes to alignment with shareholders and aids retention, with continued employment a requirement to receive the deferred payment, other than for those classified as good leavers.
The LTIP award for performance period 2013-2015 accrues dividends which are paid as additional share options. The deferred element may continue to attract dividends which will be reported in the relevant period.
Financial measures Threshold Maximum Achieved
TSR 50th percentile 75th percentile 62.5th percentile
AEPS 110.0 cents 130.0 cents 84.0 cents
Divisional EBITA (Watson & Kemp) $319.0m $371.0m $258.0m
Divisional EBITA (Straughen(a)) $287.8m $337.8m $214.7m Notes to LTIP achievement
(a) Mike Straughen served as an executive director until he retired from the Board on 31 August 2014 and from Wood Group on 31 October 2015 with good leaver status. His LTIP achievement is detailed in section 2.4 Payments to Past Directors.
2.2 Pension related benefits All UK based executive directors are provided with pension benefits via the Wood Group, Group Personal Pension Plan (WG GPP) which is a defined contribution scheme. A Company contribution of 15% of base salary was split between pension contribution up to the UK HMRC annual allowance and a cash payment in lieu of pension above this.
Bob Keiller was provided with life assurance cover of eight times basic salary up to a maximum of £2,500,000. Robin Watson and David Kemp were provided with life assurance cover of four times basic salary up to a maximum of £1,500,000, in line with the remuneration policy.
Alan Semple, the only US based executive director, was provided with a cash payment of 15% of base salary in lieu of pension provision and 401k plan employer match in line with plan rules (maximum employer contribution of 5%, up to a maximum of $13,250 per annum) until his retirement from the Group at 30 June 2015. As Alan is a US resident, his pension arrangement was previously structured within a Supplemental Executive Retirement Plan (SERP) in line with common practice in the US; this benefit ceased to accrue under this arrangement in June 2014 (details can be found in the 2014 Annual Report). He was provided with life assurance cover of approximately four times basic salary.
Details relating to 2014 long-term incentive awards can be found in the 2014 Annual Report: www.woodgroup.com/investors/annual-interim-reports

Financial statementsGovernanceStrategic report
John Wood Group PLC Annual Report and Accounts 2015 41
2.3 Long Term Incentive Plan interests awarded during the yearThe following table sets out the awards made to each of the executive directors under the Group’s share based long-term incentive arrangements and the associated targets. Performance measures remain unchanged from the 2013-2015 performance period as TSR and AEPS, weighted 25% and 75% respectively.
Share incentive plan interests awarded during the year
Executive Director Type of award
Participation Level
Face value of the award
(000's)
Percentage vesting at threshold
Performance period
Holding period for
20% of award Targets
Bob Keiller (a)
Conditional award of
shares under the LTP
150%£945
25%1 Jan 2015 - 31 Dec 2017
Two years from vesting of the
award date
TSR threshold is set at 50th percentile, with maximum at 75th percentile; AEPS for the
2015-2017 performance period was set at 100 cents at threshold
and 120 cents at maximum
Robin Watson (b) £702
David Kemp (c) 125% £438
Notes to share incentive plan interests awarded during the year
(a) Bob Keiller retired 31 December 2015 and was not in employment for the minimum required period of 18 months of the performance period; he is therefore not entitled to receive any payment under this Award.
(b) Robin Watson’s award value was calculated based on a hybrid salary detailed in note (g) to single figure remuneration table.
(c) David Kemp’s award value for the performance period was calculated using his Group CFO salary of £350,000.
2.4 Payments to past directorsMike Straughen served as an executive director until he retired from the Board on 31 August 2014 with good leaver status, and has a pro rata entitlement of 61% for LTIP performance period 2013-2015 equating to £32,665 or 5,333 share options; dividend accrual was 381 share options. The figure has been calculated using the number of share options that vested multiplied by the closing mid-market share price on 31 December 2015 of £6.125. 20% of the share options awarded is deferred for a further two years. The participation level and performance measures are detailed below:
Name Salary (GBP 000’s) Participation Level Pro rata entitlement
Performance Measures split
TSR AEPS EBITA
Mike Straughen £336 125% 61% 25% 37.5% 37.5% ENG division
Mark S Dobler served as an executive director from 1 January 2013 until he stepped down from the Board on 9 October 2013 to lead EthosEnergy, the joint venture with Siemens AG. His long-term incentive award that was due to vest at 31 December 2015 lapsed on his move to the joint venture company and was replaced by a long-term cash plan designed to produce a broadly similar outcome. The value of the long-term cash plan award at vesting on 31 December 2015 was $79,493, inclusive of nominal dividends accrued.
Bob Keiller retired 31 December 2015 with good leaver status. A Payment in Lieu of Notice (PILON) of £477,346 was made in December 2015 and all benefit entitlement ceased as at retirement date. Bob was entitled to his full award for the 2015 annual bonus and LTIP performance period 2013-2015. All other entitlements to short and long-term plans will reflect his good leaver status and will be reported as payment to past director in the relevant reporting year.
There were no other payments made to past directors during 2015 which have not already been disclosed in previous Directors’ Remuneration Reports.
2.5 Payments for loss of officeThere were no payments made for loss of office to any director during 2015.

John Wood Group PLC Annual Report and Accounts 201542
Directors’ Remuneration Report continued
A summary of directors’ share interests and incentive plan interests are provided in the following two tables. The first table details directors’ interests in the ordinary shares of the Company at 31 December 2015 with and without performance conditions; declaration includes shares held by connected persons as defined for the purposes of section 96B (2) of the Financial Services and Markets Act 2000. The second table details directors’ interests in long-term incentive plans at 31 December 2015.
Directors’ interests in the ordinary shares of the Company at 31 December 2015.
Beneficial interestShares owned outright as
at 1 January 2015Shares owned outright as
at 31 December 2015
Interests in share incentive plans, awarded without
performance conditions at 31 December 2015
Interests in share incentive plans, awarded subject to
performance conditions at 31 December 2015
Executive Directors
Bob Keiller (a) 1,615,808 1,615,072 97,755 148,889
Robin Watson 78,179 135,852 39,855 192,590
David Kemp (b) - - 32,894 101,964
Alan Semple (c) 436,704 424,254 79,047 76,989
Non-executive Directors
Ian Marchant 22,777 22,777 – –
Thomas Botts 8,500 8,500 – –
Jann Brown 1,578 6,875 – –
Michel Contie (d) 4,634 n/a – –
Mary Shafer-Malicki 2,250 3,450 – –
Jeremy Wilson 10,000 10,000 – –
David Woodward 25,000 25,000 – –
Non-beneficial interest
Bob Keiller (a) 392,423 392,423 n/a n/a
Notes to share interests
(a) Bob Keiller retired from the Board on 31 December 2015. His details relate to shareholding and incentive plan interests at that date.
(b) David Kemp was appointed to the Board on 13 May 2015.
(c) Alan Semple retired from the Board on 13 May 2015 with an employment end date of 30 June 2015. His details relate to his shareholding and incentive plan interests at his employment end date.
(d) Michel Contie retired from the Board on 13 May 2015. His details relate to his shareholding interest at that date.
None of the directors had a material interest in any contract, other than a service contract, with the Company or any of its subsidiary undertakings. At the date of this report the interests of the directors in the shares of the Company remain as stated. Where applicable the December 2015 figures include interest in retained long-term plan awards.
2.6 Statement of directors’ shareholding and share interests
Shareholding guidelines were introduced at 1 July 2013 requiring the Group Chief Executive to hold shares valued at 150% of base salary and the other executive directors to hold shares valued at 100% of base salary. The holding is expected to be built up as quickly as after-tax share awards from long-term plans allow, and does not include shares held by connected persons. There have been no changes in the interests of directors between 31 December 2015 and 2 March 2016.
The extent to which each director met the shareholding guidelines is shown in the table below:
Executive directorShareholding at 31 Dec (not including connected persons)
Value of shares held as a % of salary (a)
Shareholding guideline met at 31 Dec
Bob Keiller (b) 1,615,072 1570.2 Achieved
Robin Watson 130,659 160.1 Achieved
David Kemp (c) 0 0.0 Accumulating
Alan Semple (d) 424,254 586.1 Achieved
Notes to shareholding guidelines achievement
(a) Calculated using the closing mid-market share price on 31 December 2015 of £6.125 and base salary levels at the same date. The exchange rate at 31 December 2015 of £1 = $1.4739 was used for those executive directors paid in US dollars.
(b) Bob Keiller retired on 31 December 2015. His details relate to his shareholding at his employment end date of 31 December 2015.
(c) David Kemp was appointed to the Board on 13 May 2015.
(d) Alan Semple retired from the Board on 13 May 2015, with an employment end date of 30 June 2015. His details relate to his shareholding at his employment end date.

Financial statementsGovernanceStrategic report
John Wood Group PLC Annual Report and Accounts 2015 43
Details of directors’ interests in long-term incentive and bonus plans at 31 December 2015:
Date of award/
performance period
Shares or share
options
Performance conditions
Y/N
Earliest exercise
date
Exercise price (per
share)
Market value at date of
exercise (per share)
Number as at 1
January 2015
Granted in 2015
Exercised in 2015
Lapsed in 2015
Dividends awarded as additional
share options (a)
Number as at 31
December 2015
Bob Keiller
LTIP 2011 - 2013 Share options N March 2014 0 – 15,881 – – – 861 16,742
LTIP (b) 2012 - 2014 Share options N March 2015 0 – 96,854 – – 47,588 – 49,266
LTP 2013 - 2015 Share options Y March 2016 0 – 111,572 – – 94,139 1,244 18,677
LTP (c) 2014 - 2016 Share options Y March 2017 0 – 130,212 – – – – 130,212
LTP (d) 2015 - 2017 Share options Y March 2018 0 – – 158,783 – 158,783 – 0
ABP 2014 (e) 01 March 2015 Share options N March 2017 0 – – 31,747 – – – 31,747
Total 354,519 190,530 0 300,510 2,105 246,644
Robin Watson
LTRP 26 May 2011 Share options N 26 May 2015 31/3p 573p 40,000 – 40,000 – – 0
LTIP 2011 - 2013 Share options N March 2014 0 – 5,311 – – – 288 5,599
LTIP (b) 2012 - 2014 Share options N March 2015 0 572p 58,113 – 34,867 14,529 – 8,717
LTP 2013 - 2015 Share options Y March 2016 0 – 55,852 – – 47,125 623 9,350
LTP 2014 - 2016 Share options Y March 2017 0 – 65,192 – – – – 65,192
LTP 2015 - 2017 Share options Y March 2018 0 – – 118,048 – – 118,048
ABP 2014 (e) 01 March 2015 Share options N March 2017 0 – – 25,539 – – 25,539
Total 224,468 143,587 74,867 61,654 911 232,445
David Kemp (e)
LTRP 13 April 2013 Share options N 13 April 2017 0 – 20,000 – – – – 20,000
LTP 2013 - 2015 Share options Y March 2016 0 – 31,519 – – 26,594 351 5,276
LTP 2014 - 2016 Share options Y March 2017 0 – 33,679 – – – – 33,679
LTP 2015 - 2017 Share options Y March 2018 0 – – 63,009 – – – 63,009
ABP 2014 (e) 01 March 2015 Share options N March 2017 0 – – 12,894 – – – 12,894
Total 85,198 75,903 0 26,594 351 134,858
Alan Semple (f)
LTIP 2011 - 2013 Share options N March 2014 0 – 17,907 – – – 971 18,878
LTIP 2012 - 2014 Share options N March 2015 0 – 76,774 – – 37,722 – 39,052
LTP 2013 - 2015 Share options Y March 2016 0 – 64,798 – – 56,361 602 9,039
LTP 2015 -2017 Share options Y March 2017 0 – 67,950 – – – – 67,950
ABP 2014 (e) 01 March 2015 Share options N March 2017 0 – 21,117 – – – 21,117
Total 227,429 21,117 0 94,083 1,573 156,036
Total for all executive directors 891,614 431,137 74,867 482,841 4,940 769,983
Notes to incentive plan interests
(a) The 20% deferred element for LTIP performance periods 2011-2013 and 2012-2014 attracts dividends which are paid as additional share options, For performance periods commencing 2013 onwards, dividend accrues on 100% of award; 80% is paid in March following the end of the performance period and 20% is deferred for two years. The deferred element may continue to attract dividends which will be reported in the relevant period
(b) Awards under the LTIP performance period 2012-2014 were granted at the end of the initial 3 year period. The number at 1 January 2015 represents the maximum number of shares that could have been awarded. The number at 31 December 2015 represents the total number of shares that vested based on achievement against the relevant performance conditions at the end of the initial 3 year performance period at which point the awards cease to be subject to performance conditions.
(c) Bob Keiller retired from the board and Wood Group employment 31 December 2015. The value of any award for LTIP performance cycle 2014-2016 will be determined at the end of the performance period. His entitlement to any award will be pro-rated to reflect his service up to 31 December 2015. Payment is made as nil cost share options; 80% of any award will be made in March 2017; 20% deferred for a further two years.
(d) Bob Keiller will not be in employment for the minimum required period of 18 months of the performance period; he is therefore not entitled to receive any payment under this award and share options granted in 2015 will therefore lapse.
(e) Payment of 50% of the total bonus for 2014 was deferred in the form of shares for a further two years; calculation was based on an average share price computed using the 20 day trading average in the period running up to 31 December 2014, with continued employment a requirement to receive the deferred payment other than for those classified as good leavers.
(f) Alan Semple retired from the Board on 13 May 2015 and subsequently from Wood Group 30 June 2015. His details relate to his incentive plan interests at his employment end date.
(g) David Kemp was appointed to the Board on 13 May 2015.

John Wood Group PLC Annual Report and Accounts 201544
2.7 TSR performance summary & CEO remunerationAs the Company is included in the UK FTSE 250 index, but has been included in the FTSE 100 index for part of the period under review, both the UK FTSE 250 and UK FTSE 100 indices are shown, by way of providing a reasonable TSR comparison. The graph below compares the TSR on a holding of shares in John Wood Group PLC with the TSR on a holding of shares in the companies in the UK FTSE 250 and 100 indices for the last eight financial years.
Directors’ Remuneration Report continued
CEO remunerationThe total remuneration for the CEO over the same period as the TSR performance graph detailed is listed in the table below. This table includes details of the annual bonus received in each year as a percentage of the maximum opportunity that was available, as well as the long-term incentives which vested in each year as a percentage of the maximum number of shares that could have been received.
CEO Year
CEO single figure of total remuneration
(£’000)
Annual bonus
award as a % of
maximum opportunity
Long term incentive
vesting rates as a % of maximum opportunity
Bob Keiller 2015 £1,147 37% 16%
Bob Keiller 2014 £1,330 48% 51%
Bob Keiller 2013 £1,624 60% 79%
Bob Keiller (a) 2012 £199 75% 25%
Allister Langlands (b) 2012 £2,276 76% 100%
Allister Langlands 2011 £3,338 87% 100%
Allister Langlands 2010 £1,314 84% 23%
Allister Langlands 2009 £1,417 60% 0%
Notes to CEO remuneration table
(a) Bob Keiller was appointed Group CEO at 1 November 2012. His remuneration for 2012 reflected his remuneration from appointment as Group CEO only. Long-term incentives vesting during the year were awarded during his time as Wood Group PSN CEO and vested based on performance targets linked to performance of that division.
(b) Allister Langlands was appointed Chair on 1 November 2012. His remuneration for 2012 related to his time as Group CEO only.
2.8 Percentage change in CEO remunerationThe following table provides a summary of the increases in remuneration for the Group CEO as compared with the average increase for all other UK based employees in the Group.
% change between 2014 and 2015
Salary Benefits Bonus
CEO (a) 12.5% -1.31% -22.1%
Average increase of all other UK employees in the Group
0% 5.3% -34%
Notes to the percentage change in CEO remuneration
(a) 12.5% increase in salary was awarded at 1 January 2014 but was deferred for 12 months and did not become effective until 1 January 2015. The reduction in benefits is related to medical insurance cover change from family to married status at renewal date April 2015.
(b) Given the wide variation in inflation rates across the various geographies in which the Group operates, the comparator group used is all other UK based employees to ensure a valid comparison is provided. UK based employees constituted approximately 28% of the overall workforce. Benefits increase is based on a sample employee on a salary of £50,000 per annum receiving taxable employee benefits including car allowance, private family medical and dental insurance. The average bonus increase is based on average bonus paid as a percentage of salary for 2014 for the noted comparator group against average bonus paid as a percentage of salary for 2015.
TSR Performance Chart:
264.6%
231.8%
82.0%

Financial statementsGovernanceStrategic report
John Wood Group PLC Annual Report and Accounts 2015 45
Bonus The maximum annual bonus opportunity for the executives will remain at 125% of salary in 2016. Bonus measures will be split between financial (60%) and non-financial (40%) measures as shown in the chart below; 10% of non-financial measures will relate directly to HSSE.
Financial measuresFor 2016, the weighting of financial measures is unchanged with EBITA 48% and DSO 12%; for EBITA, threshold performance is 85% of the target set. Maximum bonus is achieved when results exceed maximum target of 115%. If the financial targets set are achieved, 70% of the potential bonus opportunity is paid. Performance between threshold and target and between target and maximum will result in a proportionate award calculated on a straight-line basis.
For DSO, threshold performance is 110% and maximum is 90% of the target set. The monthly average is taken over the year, and a lower DSO indicates better performance.
The Committee has set the financial targets for the annual bonus plan for the year ending 31 December 2016 at its meeting in February 2016. It is the opinion of the Committee that these are comercially sensitive and in line with previous practice, the details of annual bonus targets and the extent to which the targets are met will be disclosed retrospectively in next year’s report.
2.9 Relative importance of spend on payThe table below is provided to assist shareholders in assessing the relative importance of the Group’s spend on pay. It contains details of the remuneration paid to or received by all employees of the Group as well as the value of distributions to shareholders by way of dividend and share buyback over the previous two years.
Item 2014 ($m) 2015 ($m)Difference
($m)% change
Remuneration paid to or received by all employees of the Group
3,256.70 2,669.7 587.0 -18.0%
Distributions to shareholders by way of dividend and share buyback
87.2 104.9 17.7 20.3%
2.10 Statement of implementation of remuneration policy in the following financial yearThis section provides an overview of how the Committee will implement the remuneration policy in 2016. The current policy can be found at: www.woodgroup.com/rempolicy
Base salaryThe table below shows base salaries for 2015 and 2016.
Executive2015 annual base salary
Annual base salary from 1 January 2016 % increase
Robin Watson (a) £500,000 £600,000 20.0%
David Kemp (b) £350,000 £390,000 11.4%
Notes to base salary table
(a) Robin Watson’s salary was increased from £378,500 following his appointment to Group Chief Operating Officer at 6 April 2015. His salary was further increased to £600,000 following his appointment to Group Chief Executive at 1 January 2016; more details can be found within the Chair’s letter.
(b) David Kemp’s salary was £350,000 from his appointment to Group CFO at 13 May 2015. From 1 January 2016 his scope of responsibility was increased to include Group legal; as a result his base salary was increased to £390,000.
BenefitsThe current executive directors will continue to participate in existing benefit arrangements in line with the agreed remuneration policy.
Relative weighting (% of bonus opportunity)
0% 10% 20% 30% 40% 50% 60% 70% 80% 90% 100%
financial measures 60% non-financial measures 40%
48% 12% 20% 20%
Corporate objectives
EBITA DSO Personal objectives

John Wood Group PLC Annual Report and Accounts 201546
Directors’ Remuneration Report continued
Non-financial measures Non-financial measures are summarised in the table below and consist of corporate and personal delivery milestones which are aimed at the achievement of the Group’s business strategy.
Executive director Corporate Objectives: 20% of bonus opportunity Personal Objectives: 20% of bonus opportunity
Robin Watson HSSE & Assurance:Deliver against the 2016 HSSE PlanZero work related fatalitiesTRCF improvementDelivery of assurance schedule as directed by the Group’s risk register
Strategic framework and priorities:Position the business for growth, coming through the current down-cycle Organic growth from established relationships and new contract wins Strategic acquisitions Cost Savings
Deliver organisational structure aligned for enhanced service delivery to our customers
Engage customers & stakeholders in dialogue about the potential of the Group
Embed the strength and continuing development of the Executive Leadership Team
Measure and report progress against delivery of the Group Strategy
David Kemp Deliver the 2016 shared services plan for finance, aligning to the ERP implementation programme
Implement further enhancements to the risk management framework and the Group financial compliance programme
Deliver Finance & Administration organisational change
Deliver Group overhead savings
Long Term Incentive Plan – LTIPFor 2016, awards made to the executive directors will be based on TSR and AEPS weighted 50% and 50% respectively, in line with policy. The Committee has determined to adjust the balance of performance measures in recognition of the cyclical nature of Wood Group’s business and following feedback from investors. The award to the Group Chief Executive, Robin Watson, will remain unchanged at up to 150% of salary and the award to the Group CFO, David Kemp, will remain unchanged at up to 125% of salary.
In setting the targets for the 2016–2018 performance period, the Committee took into consideration the current market conditions in the oil & gas sector and the uncertainties that a significantly reduced oil price will have on our customer’s spending patterns. The Committee believe that the uncertainty and more challenging markets are likely to persist throughout 2016, and possibly beyond. The AEPS targets for the 2016-2018 performance period were set at 80.0 cents at threshold and 100.0 cents at maximum. This represents a broadly flat position to the 2015 actual AEPS of 84.0 cents at threshold and 6.4% compound annual growth from 2015 actual AEPS at maximum. As at the date of this report, analyst consensus of 2016 AEPS was 69.3 cents and as such the range selected represents 7.4% compound annual growth on 2016 consensus at threshold and 20.1% compound annual growth on 2016 consensus at maximum.
Consideration has been given to the long standing TSR group. Recognising changes in the Group’s makeup, competitive landscape, and the peer group against which the investment community considers our performance, the following changes have been made: Cape has been added due to its comparative North Sea service offering to Wood Group PSN and industrial services focus; Hunting has been added as it is a UK business with significant US onshore shale exposure; Sulzer has been removed to rebalance away from turbine related activity which is now a less material part of Wood Group.
The TSR peer group will therefore increase by one and from 2016 onwards will comprise: Aker Solutions, AMEC Foster Wheeler, Cape, Chicago Bridge & Iron Company, Fluor, Hunting, Jacobs Engineering, KBR, McDermott, Petrofac, Saipem, SBM Offshore, Technip, Weir Group, Worley Parsons and WS Atkins.
No awards are made for less than the threshold performance for AEPS and the 50th percentile for TSR. On reaching the threshold or 50th percentile, 25% of the AEPS or TSR-related element becomes payable and on reaching the maximum performance for AEPS or 75th percentile for TSR, 100% of the AEPS or TSR element becomes payable. For achievement level between threshold and maximum for AEPS or between the 50th and 75th percentile performance for TSR, the allocation is on a straight line basis.
Pension related benefitsThe executive directors will continue to participate in existing pension arrangements in line with the agreed remuneration policy.
Chair and non-executive director (NED) remunerationThe Chair and NED fee structure for 2016 will be unchanged from 2015 as set out below:
2016 fees per annum
Chair of the Board remuneration £275,000
Annual non-executive director fee inclusive of all Committee attendance
£55,500
Additional fee for senior independent director £5,000
Additional fee for Audit / Remuneration / Safety & Assurance Chairs
£5,000

Financial statements
Financial statementsGovernanceStrategic report
John Wood Group PLC Annual Report and Accounts 2015 47
Group financial statements

John Wood Group PLC Annual Report and Accounts 201548
Independent auditor’s report to the members of John Wood Group PLC (the ‘Group’)
Report on the group financial statements
Our opinionIn our opinion, John Wood Group PLC’s Group financial statements (the ‘financial statements’):
X Give a true and fair view of the state of the Group’s affairs as at 31 December 2015 and of its profit and cash flows for the year then ended;
X Have been properly prepared in accordance with international Financial Reporting Standards (‘IFRSs’) as adopted by the European Union; and
X Have been prepared in accordance with the requirements of the Companies Act 2006 and Article 4 of the lAS Regulation.
Separate opinion in relation to IFRSs as issued by the IASBAs explained in the Accounting Policies Note to the financial statements, the Group, in addition to applying IFRSs as adopted by the European Union, has also applied IFRSs as issued by the International Accounting Standards Board (IASB).
In our opinion, the financial statements comply with IFRSs as issued by the IASB.
What we have auditedJohn Wood Group PLC’s financial statements, included within the Annual Report and Accounts (“the Annual Report”), comprise:
X The consolidated balance sheet as at 31 December 2015;
X The consolidated income statement and consolidated statement of comprehensive income for the year then ended;
X The consolidated cash flow statement for the year then ended;
X The consolidated statement of changes in equity for the year then ended; and
X The notes to the financial statements, which include a summaiy of significant accounting policies and other explanatory information.
Certain required disclosures have been presented elsewhere in the Annual Report, rather than in the notes to the financial statements. These are cross-referenced from the financial statements and are identified as audited.
The financial reporting framework that has been applied in the preparation of the financial statements is applicable law and IFRSs as adopted by the European Union.
Our audit approach
Materiality
Audit Scope
Area of focus
Overview
X Overall group materiality for the financial statements as a whole was $15.6 million, based on the Group’s profit before taxation from continuing operations after exceptional items, adding back the one-off impairment charge for EthosEnergy of $137.2 million.
X Audits of the financial information were carried out for significant locations such as Mustang in North America and PSN in the UK. In addition we performed audit procedures at a number of the Group’s other locations. In total, work was performed across 21 reporting units.
X We conducted audit work on-site in four countries — UK (including Guernsey), USA, Norway and Australia.
X Carrying value of investment in EthosEnergy joint venture
X Carrying value of goodwill
X Uncertain tax provisions
X Judgemental provisions

Financial statementsGovernanceStrategic report
John Wood Group PLC Annual Report and Accounts 2015 49
Independent auditor’s report continued
Areas on which our audit specifically focusedWe conducted our audit in accordance with International Standards on Auditing (UK and Ireland) (‘ISAs (UK & Ireland)’).
We designed our audit by determining materiality and assessing the risks of material misstatement in the financial statements. In particular, we looked at where the directors made subjective judgements, for example in respect of significant accounting estimates that involved making assumptions and considering future events that are inherently uncertain and in the classification of exceptional items. As in all our audits, we also addressed the risk of management override of internal controls and risk of fraud in revenue recognition, including evaluating whether there was evidence of bias by the directors that may represent a risk of material misstatement due to fraud.
The risks of material misstatement that had the greatest effect on our audit, including the allocation of our resources and effort, are identified as ‘areas of focus’ in the table below together with an explanation of how we tailored our audit to address these specific areas in order to provide an opinion on the financial statements as a whole, and any comments we make on the results of our procedures should be read in this context. This is not a complete list of all risks identified by our audit.
Area of focus How our audit addressed the area of focus
Carrying value of investment in EthosEnergy joint venture We tested Group management’s assessment of the carrying value of EthosEnergy at 31 December 2015. Our testing considered the future cash flow forecasts, the process by which they were produced and the history of forecasting accuracy; we also tested the underlying ‘value in use’ model. We engaged PwC valuation specialists to assess the appropriateness of specific inputs into the value in use model specifically the discount rate, long-term growth rate and terminal value.
We focused on profitability assumptions as these are the key drivers of the cash flows. Group management applied additional sensitivities to the forecasts prepared by EthosEnergy and we corroborated that approach by undertaking our own sensitivity analysis. We also considered the net working capital assumptions and EthosEnergy’s actions to achieve these.
We found no evidence that the assumptions used in the cash flow forecast were unreasonable. However, there is ongoing uncertainty around EthosEnergy’s ability to deliver on the forecast. As a result, we held extensive discussions with Group management and the Audit Committee around the adequacy of the detailed disclosures regarding assumptions and sensitivities which have been set out within note 10 of the financial statements. If EthosEnergy is not able to deliver on these forecasts, further impairment charges may result.
At 31 December 2015 (prior to impairment) the carrying value of the investment in the joint venture was $329.4m reflecting the value attributed to it on formation, adjusted for trading results and underlying foreign exchange adjustments since that date.
In 2015, EthosEnergy underperforned compared to expectations. Additionally, the trading outlook has become more challenging. Group management considered these to be indications that the investment may be impaired, and Group management performed an impairment assessment at 31 December 2015. This assessment resulted in an impairment charge of $137.2m, details of which are set out in note 10 of the financial statements.
Group management’s assessment of the remaining ‘value in use’ is judgemental because it is based on forecast results and uncertain outcomes.
Accordingly, this was an area of focus for our audit.
Carrying value of goodwill We tested management’s assessment of the carrying value of goodwill at 31 December 2015 as follows:
X We carried out an exercise to look back at the prior year to assess the history of forecasting accuracy, which confirmed our ability to rely on management’s forecast.
X We tested the underlying ‘value in use’ model by assessing the appropriateness of the inputs and key assumptions in relation to the short term cash flows included in the 2016 and 2017 forecast.
X We engaged valuation specialists to assess the appropriateness of the medium and long-term growth rate of 3%, pre-tax discount rates used which range from 12% to 15% and the terminal value calculation.
X We assessed the appropriateness of cash generating units.
X We reviewed the disclosures on the carrying value of goodwill in the financial statements for sufficiency.
We found sufficient evidence to support the assumptions used in management’s assessment of the carrying value of goodwill, and considered the sensitivities disclosed in the financial statements to be appropriate.
The carrying value of goodwill as at 31 December 2015 was $1,765m. This relates to a number of acquisitions, the most significant of which is the Group’s acquisition of PSN in 2011, as well as smaller acquisitions in recent years. The details of goodwill are set out in note 8 of the financial statements.
Management’s assessment of the ‘value in use’ of the Group’s Cash Generating Units (‘CGU’s’) involves judgements about the future results of the business and the discount rates applied to future cash flow forecasts. Given the current environment of lower commodity prices we believed there was an elevated risk of misstatement associated with the carrying value of goodwill.

John Wood Group PLC Annual Report and Accounts 201550
Independent auditor’s report continued
Area of focus How our audit addressed the area of focus
Uncertain tax provisions We reviewed the Group’s documentation of uncertain tax exposures and tested the more significant provisions for appropriateness by confirming the basis of provision, understanding the movements on the provision during the year, reviewing correspondence with relevant tax authorities and management’s calculation. We also utilised our own tax experts to assess the judgements taken by management.
This is an area which requires significant judgement. However, the evidence we obtained, including our testing of assumptions, was materially consistent with the overall level of provisioning in respect of tax.
The Group operates in multiple tax jurisdictions and has a number of ongoing discussions and investigations with tax authorities where uncertain tax positions and treatments may be successfully challenged at a later date. See note 5 of the financial statements.
There is judgement in assessing the level of provisions required to cover the risk of successful challenge over certain of the Group’s tax positions. Provisions are principally held in respect of current tax deductions previously taken, ongoing tax audits and uncertainties on the utilisation of deferred tax assets.
Judgemental provisions We reviewed the Group’s schedule of provisions and tested material provisions for accuracy by corroborating this with third party evidence where available. Our work also included meeting with the Group’s General Counsel to discuss legal cases and obtaining legal letters from external counsel. We also tested management’s calculations of earn out provisions by agreeing the financial targets to due diligence reports relating to the acquisitions and lease obligations by agreeing to lease agreements. We tested long outstanding accounts receivable (aged greater than 90 days) by agreeing to subsequent payments where available or supporting documentation.
This is an area which requires management judgement. However the evidence we obtained from our testing did not identify any material misstatements.
There are a number of provisions across the Group that require management judgement during the estimation process. Provisions include those made for earn outs, uninsured legal and warranty claims, doubtful debts and onerous leases. See note 18 of the financial statements.
How we tailored the audit scopeWe tailored the scope of our audit to ensure that we performed enough work to be able to give an opinion on the financial statements as a whole, taking into account the geographic structure of the Group, the accounting processes and controls, and the industry in which the Group operates.
We developed our audit procedures by firstly confirming the reporting units which were significant for an audit of their complete financial information for Group reporting based on contribution of profit to the Group. We then looked for reporting units where individual account balances were significant to the Group as a whole or had heightened risks of fraud or error and scoped these in for specified audit procedures for those account balances or areas.
We conducted work at 21 reporting units and used local PwC auditors in Australia, Norway and Guernsey. Together, the reporting units subject to audit procedures were responsible for 72% of the Group’s revenues. Where the work was performed by component auditors, we determined the level of involvement we needed to have in their audit work to be able to conclude whether sufficient appropriate audit evidence had been obtained as a basis for our opinion on the group financial statements as a whole. The group engagement team visited multiple reporting sites in North America, the UK and Norway and performed a desktop review of the audit file for Australia.
Further, specific audit procedures over central functions and areas of significant judgement, including taxation, goodwill, treasury, acquisitions, impairment analysis, post-retirement benefits and material litigation were performed at the Group’s head office.
MaterialityThe scope of our audit is influenced by our application of materiality. We set certain quantitative thresholds for materiality. These, together with qualitative considerations, helped us to determine the scope of our audit and the nature, timing and extent of our audit procedures on the individual financial statement line items and disclosures and in evaluating the effect of misstatements, both individually and on the financial statements as a whole.
Based on our professional judgement, we determined materiality for the financial statements as a whole as follows:
Overall group materiality $15.6 million (2014: $23 million)
How we determined it5% of profit before taxation from continuing operations after exceptional items, adding back the one-off EthosEnergy impairment charge of $137.2m.
Rationale for benchmark applied
We applied this benchmark, a generally accepted auditing practice, in the absence of indicators that an alternative benchmark would be more appropriate. In the prior year, the benchmark used was profit before taxation from continuing operations after all exceptional items. In 2015, we added back the impact of the EthosEnergy impairment as it is a one-off charge, giving us a more consistent year-on-year basis for our audit.
Component materialityFor each reporting unit subject to an audit of its financial information, we allocate a materiality that is less than our overall group materiality. Certain components were audited to a local statutory materiality that was also less than our overall group materiality.
We agreed with the Audit Committee that we would report to them misstatements identified during our audit above $0.8m (2014: $1m) as well as misstatements below that amount that, in our view, warranted reporting for qualitative reasons.

Financial statementsGovernanceStrategic report
John Wood Group PLC Annual Report and Accounts 2015 51
Independent auditor’s report continued
Going concernUnder the Listing Rules we are required to review the directors’ statement, set out on page 18, in relation to going concern. We have nothing to report having performed our review.
Under ISAs (UK & Ireland) we are required to report to you if we have anything material to add or to draw attention to in relation to the directors’ statement about whether they considered it appropriate to adopt the going concern basis in preparing the financial statements. We have nothing material to add or to draw attention to.
As noted in the directors’ statement, the directors have concluded that it is appropriate to adopt the going concern basis in preparing the financial statements. The going concern basis presumes that the Group has adequate resources to remain in operation, and that the directors intend it to do so, for at least one year from the date the financial statements were signed. As part of our audit we have concluded that the directors’ use of the going concern basis is appropriate. However, because not all future events or conditions can be predicted, these statements are not a guarantee as to the Group’s ability to continue as a going concern.
Other required reporting
Consistency of other information
Companies Act 2006 OpinionsIn our opinion, the information given in the Strategic Report and the Directors’ Report for the financial year for which the financial statements are prepared is consistent with the financial statements.
ISAs (UK & Ireland) ReportingUnder ISAs (UK & Ireland) we are required to report to you if, in our opinion:
X Information in the Annual Report is: - Materially inconsistent with the information in the audited financial statements; or - Apparently materially incorrect based on, or materially inconsistent with, our knowledge of the Group acquired in the course of performing our audit; or - Otherwise misleading.
We have no exceptions to report
X The statement given by the directors on page 22, in accordance with provision C.1.1 of the UK Corporate Governance Code (the ‘Code’), that they consider the Annual Report taken as a whole to be fair, balanced and understandable and provides the information necessary for members to assess the Group’s performance, business model and strategy is materially inconsistent with our knowledge of the Group acquired in the course of performing our audit.
We have no exceptions to report.
X The section of the Annual Report, as required by provision C.3.8 of the Code, describing the work of the Audit Committee does not appropriately address matters communicated by us to the Audit Committee.
We have no exceptions to report.
The directors’ assessment of the prospects of the Group and of the principal risks that would threaten the solvency or liquidity of the Group.
Under ISAs (UK & Ireland) we are required to report to you if we have anything material to add or to draw attention to in relation to:
X The directors’ confirmation on page 18 of the Annual Report, in accordance with provision C.2.1 of the Code, that they have carried out a robust assessment of the principal risks facing the Group, including those that would threaten its business model, future performance, solvency or liquidity.
We have nothing material to add or to draw attention to.
X The disclosures in the Annual Report that describe those risks and explain how they are being managed or mitigated.We have nothing material to add or to draw attention to.
X The directors’ explanation on page 19 of the Annual Report, in accordance with Provision C.2.2 of the Code, as to how they have assessed the prospects of the Group, over what period they have done so and why they consider that period to be appropriate, and their statement as to whether they have a reasonable expectation that the Group will be able to continue in operation and meet its liabilities as they fall due over the period of their assessment, including any related disclosures drawing attention to any necessary qualifications or assumptions.
We have nothing material to add or to draw attention to.
Under the Listing Rules we are required to review the directors’ statement that they have carried out a robust assessment of the principal risks facing the Group and the directors’ statement in relation to the longer-term viability of the Group. Our review was substantially less in scope than an audit and only consisted of making inquiries and considering the directors’ process supporting their statements; checking that the statements are in alignment with the relevant provisions of the Code; and considering whether the statements are consistent with the knowledge acquired by us in the course of performing our audit. We have nothing to report having performed our review.

John Wood Group PLC Annual Report and Accounts 201552
Independent auditor’s report continued
Adequacy of information and explanations receivedUnder the Companies Act 2006 we are required to report to you if, in our opinion, we have not received all the information and explanations we require for our audit. We have no exceptions to report arising from this responsibility.
Under the Companies Act 2006 we are required to report to you if, in our opinion, certain disclosures of directors’ remuneration specified by law are not made. We have no exceptions to report arising from this responsibility.
Corporate governance statementUnder the Listing Rules we are required to review the part of the Corporate Governance Statement relating to ten further provisions of the UK Corporate Governance Code. We have nothing to report having performed our review.
Responsibilities for the financial statements and the audit
Our responsibilities and those of the directorsAs explained more fully in the Directors’ Responsibilities Statement set out on page 22, the directors are responsible for the preparation of the financial statements and for being satisfied that they give a true and fair view.
Our responsibility is to audit and express an opinion on the financial statements in accordance with applicable law and ISAs (UK & Ireland). Those standards require us to comply with the Auditing Practices Board’s Ethical Standards for Auditors.
This report, including the opinions, has been prepared for and only for the company’s members as a body in accordance with Chapter 3 of Part 16 of the Companies Act 2006 and for no other purpose. We do not, in giving these opinions, accept or assume responsibility for any other purpose or to any other person to whom this report is shown or into whose hands it may come save where expressly agreed by our prior consent in writing.
What an audit of financial statements involvesAn audit involves obtaining evidence about the amounts and disclosures in the financial statements sufficient to give reasonable assurance that the financial statements are free from material misstatement, whether caused by fraud or error. This includes an assessment of:
X Whether the accounting policies are appropriate to the Group’s circumstances and have been consistently applied and adequately disclosed;
X The reasonableness of significant accounting estimates made by the directors; and
X The overall presentation of the financial statements.
We primarily focus our work in these areas by assessing the directors’ judgements against available evidence, forming our own judgements, and evaluating the disclosures in the financial statements.
We test and examine information, using sampling and other auditing techniques, to the extent we consider necessary to provide a reasonable basis for us to draw conclusions. We obtain audit evidence through testing the effectiveness of controls, substantive procedures or a combination of both.
In addition, we read all the financial and non-financial information in the Annual Report to identify material inconsistencies with the audited financial statements and to identify any information that is apparently materially incorrect based on, or materially inconsistent with, the knowledge acquired by us in the course of performing the audit. If we become aware of any apparent material misstatements or inconsistencies we consider the implications for our report.
Other matterWe have reported separately on the parent company financial statements of John Wood Group PLC for the year ended 31 December 2015 and on the information in the Directors’ Remuneration Report that is described as having been audited.
Lindsay Gardiner (Senior Statutory Auditor) for and on behalf of PricewaterhouseCoopers LLP Chartered Accountants and Statutory Auditors Aberdeen
22 February 2016
(a) The maintenance and integrity of the John Wood Group PLC website is the responsibility of the directors; the work carried out by the auditors does not involve consideration of these matters and, accordingly, the auditors accept no responsibility for any changes that may have occurred to the financial statements since they were initially presented on the website.
(b) Legislation in the United Kingdom governing the preparation and dissemination of financial statements may differ from legislation in other jurisdictions.

Financial statementsGovernanceStrategic report
John Wood Group PLC Annual Report and Accounts 2015 53
2015 2014Pre-
Exceptional Items
Exceptional Items
(note 4) Total
Pre- Exceptional
Items
Exceptional Items
(note 4) Total
Note $m $m $m $m $m $m
Revenue from continuing operations 1 5,000.6 - 5,000.6 6,574.1 - 6,574.1
Cost of sales (4,183.4) - (4,183.4) (5,564.7) - (5,564.7)
Gross profit 817.2 - 817.2 1,009.4 - 1,009.4
Administrative expenses (501.3) (45.9) (547.2) (592.9) 50.9 (542.0)
Impairment of investment in joint ventures 4/10 - (137.2) (137.2) - - -
Share of post-tax profit from joint ventures 10 25.1 1.5 26.6 20.3 9.7 30.0
Operating profit 1 341.0 (181.6) 159.4 436.8 60.6 497.4
Finance income 2 3.1 - 3.1 1.4 - 1.4
Finance expense 2 (23.9) - (23.9) (23.7) - (23.7)
Profit before taxation from continuing operations 3 320.2 (181.6) 138.6 414.5 60.6 475.1
Taxation 5 (71.0) 9.0 (62.0) (102.9) (10.0) (112.9)
Profit for the year from continuing operations 249.2 (172.6) 76.6 311.6 50.6 362.2
Profit/(loss) from discontinued operations, net of tax 4 - 13.5 13.5 (2.9) (23.0) (25.9)
Profit for the year 249.2 (159.1) 90.1 308.7 27.6 336.3
Profit attributable to:
Owners of the parent 238.1 (159.1) 79.0 299.9 22.1 322.0
Non-controlling interests 25 11.1 - 11.1 8.8 5.5 14.3
249.2 (159.1) 90.1 308.7 27.6 336.3
Earnings per share (expressed in cents per share)
Basic 7 64.5 (43.1) 21.4 81.9 6.0 87.9
Diluted 7 62.8 (42.0) 20.8 79.9 5.9 85.8
The notes on pages 58 to 102 are an integral part of these consolidated financial statements.
Consolidated income statement for the year to 31 December 2015

John Wood Group PLC Annual Report and Accounts 201554
2015 2014Note $m $m
Profit for the year 90.1 336.3
Other comprehensive income/(expense)
Items that will not be reclassified to profit or loss
Re-measurement gains/(losses) on retirement benefit scheme 29 24.9 (16.5)
Movement in deferred tax relating to retirement benefit scheme 5 (4.9) 3.3
Total items that will not be reclassified to profit or loss 20.0 (13.2)
Items that may be reclassified subsequently to profit or loss
Cash flow hedges 24 (0.1) (0.1)
Tax credit relating to foreign exchange on net investment in subsidiary 5 - 15.0
Exchange movements on retranslation of foreign currency net assets 24 (175.4) (147.4)
Exchange movements on retranslation of non-controlling interests 25 (0.5) (0.3)
Total items that may be reclassified subsequently to profit or loss (176.0) (132.8)
Other comprehensive expense for the year, net of tax (156.0) (146.0)
Total comprehensive (expense)/income for the year (65.9) 190.3
Total comprehensive (expense)/income for the period is attributable to:
Owners of the parent (76.5) 176.3
Non-controlling interests 10.6 14.0
(65.9) 190.3
Total comprehensive (expense)/income for the period is attributable to:
Continuing operations (79.4) 216.2
Discontinued operations 4 13.5 (25.9)
(65.9) 190.3
Exchange movements on the retranslation of net assets could be subsequently reclassified to profit or loss in the event of the disposal of a business.
The notes on pages 58 to 102 are an integral part of these consolidated financial statements.
Consolidated statement of comprehensive income for the year to 31 December 2015

Financial statementsGovernanceStrategic report
John Wood Group PLC Annual Report and Accounts 2015 55
2015Restated
2014 Note $m $m
Assets
Non-current assets
Goodwill and other intangible assets 8 2,004.5 1,943.5
Property plant and equipment 9 204.2 194.6
Investment in joint ventures 10 300.4 460.0
Long term receivables 12 80.7 79.2
Retirement benefit scheme surplus 29 4.5 -
Deferred tax assets 19 62.5 62.3
2,656.8 2,739.6
Current assets
Inventories 11 8.1 9.1
Trade and other receivables 12 1,176.0 1,470.1
Income tax receivable 21.7 11.5
Cash and cash equivalents 13 204.5 156.6
1,410.3 1,647.3
Liabilities
Current liabilities
Borrowings 15 29.9 14.7
Trade and other payables 14 753.9 969.1
Income tax liabilities 65.7 110.1
849.5 1,093.9
Net current assets 560.8 553.4
Non-current liabilities
Borrowings 15 495.0 495.0
Deferred tax liabilities 19 6.0 3.9
Retirement benefit scheme deficit 29 - 27.0
Other non-current liabilities 16 200.8 129.7
Provisions 18 94.8 78.1
796.6 733.7
Net assets 2,421.0 2,559.3
Equity attributable to owners of the parent
Share capital 21 23.8 23.7
Share premium 22 63.9 56.0
Retained earnings 23 2,162.4 2,142.8
Other reserves 24 148.2 323.7
2,398.3 2,546.2
Non-controlling interests 25 22.7 13.1
Total equity 2,421.0 2,559.3
The 2014 comparative figures for Trade and other receivables and cash and cash equivalents have been restated by $26.5m in relation to a restricted cash balance. See note 12 for further details.
The financial statements on pages 53 to 102 were approved by the board of directors on 22 February 2016 and signed on its behalf by:
Robin Watson, Director David Kemp, Director
The notes on pages 58 to 102 are an integral part of these consolidated financial statements.
Consolidated balance sheet for the year to 31 December 2015

John Wood Group PLC Annual Report and Accounts 201556
Note
Share capital
$m
Share premium
$m
Retained earnings
$m
Other reserves
$m
Equity attributable
to owners of the parent
$m
Non- controlling
interests $m
Total equity
$m
At 1 January 2014 23.6 56.0 1,856.6 471.2 2,407.4 8.9 2,416.3
Profit for the year - - 322.0 - 322.0 14.3 336.3
Other comprehensive income/(expense):
Re-measurement losses on retirement benefit scheme 29 - - (16.5) - (16.5) - (16.5)
Movement in deferred tax relating to retirement benefit scheme
5 - - 3.3 - 3.3 - 3.3
Cash flow hedges 24 - - - (0.1) (0.1) - (0.1)
Tax credit relating to foreign exchange on net investment in subsidiary
5 - - 15.0 - 15.0 - 15.0
Net exchange movements on retranslation of foreign currency net assets
24/25
- - - (147.4) (147.4) (0.3) (147.7)
Total comprehensive income/(expense) for the year - - 323.8 (147.5) 176.3 14.0 190.3
Transactions with owners:
Dividends paid 6/25 - - (87.2) - (87.2) (7.7) (94.9)
Transactions with non-controlling interests - - 8.5 - 8.5 (2.1) 6.4
Credit relating to share based charges 20 - - 19.5 - 19.5 - 19.5
Tax credit relating to share option schemes 5 - - 1.8 - 1.8 - 1.8
Shares allocated to employee share trusts 23 0.1 - (0.1) - - - -
Shares disposed of by employee share trusts 23 - - 11.2 - 11.2 - 11.2
Exchange movements in respect of shares held by employee share trusts
23 - - 8.7 - 8.7 - 8.7
At 31 December 2014 23.7 56.0 2,142.8 323.7 2,546.2 13.1 2,559.3
Profit for the year - - 79.0 - 79.0 11.1 90.1
Other comprehensive income/(expense):
Re-measurement gains on retirement benefit scheme 29 - - 24.9 - 24.9 - 24.9
Movement in deferred tax relating to retirement benefit scheme
5 - - (4.9) - (4.9) - (4.9)
Cash flow hedges 24 - - - (0.1) (0.1) - (0.1)
Net exchange movements on retranslation of foreign currency net assets
24/25 - - - (175.4) (175.4) (0.5) (175.9)
Total comprehensive income/(expense) for the year - - 99.0 (175.5) (76.5) 10.6 (65.9)
Transactions with owners:
Dividends paid 6/25 - - (104.9) - (104.9) (1.0) (105.9)
Credit relating to share based charges 20 - - 12.7 - 12.7 - 12.7
Tax credit relating to share option schemes 5 - - 7.5 - 7.5 - 7.5
Shares allocated to employee share trusts 23 0.1 7.9 (8.0) - - - -
Shares disposed of by employee share trusts 23 - - 5.6 - 5.6 - 5.6
Exchange movements in respect of shares held by employee share trusts
23 - - 7.7 - 7.7 - 7.7
At 31 December 2015 23.8 63.9 2,162.4 148.2 2,398.3 22.7 2,421.0
The notes on pages 58 to 102 are an integral part of these consolidated financial statements.
Consolidated statement of changes in equity for the year to 31 December 2015

Financial statementsGovernanceStrategic report
John Wood Group PLC Annual Report and Accounts 2015 57
2015Restated
2014Note $m $m
Cash generated from operations 26 562.9 544.9
Tax paid (96.6) (84.9)
Net cash generated from operating activities 466.3 460.0
Cash flows from investing activities
Acquisition of subsidiaries (net of cash acquired) 27 (238.0) (258.1)
Proceeds from divestment of subsidiaries - 1.7
Payments received from EthosEnergy 9.7 58.6
Purchase of property plant and equipment 9 (36.1) (59.0)
Proceeds from sale of property plant and equipment 1.8 2.9
Purchase of intangible assets 8 (46.5) (51.2)
Interest received 2.4 1.4
Repayment of loans from/(advances) to joint ventures 11.0 (78.0)
Net cash used in investing activities (295.7) (381.7)
Cash flows from financing activities
Proceeds from/(repayment of) bank loans 26 15.7 (331.0)
Proceeds from senior loan notes - 375.0
Acquisition of non-controlling interests - (4.8)
Proceeds from disposal of shares by employee share trusts 23 5.6 11.2
Interest paid (23.6) (13.2)
Dividends paid to shareholders 6 (104.9) (87.2)
Dividends paid to non-controlling interests 25 (1.0) (7.7)
Net cash used in financing activities (108.2) (57.7)
Net increase in cash and cash equivalents 26 62.4 20.6
Effect of exchange rate changes on cash and cash equivalents 26 (14.5) (9.0)
Opening cash and cash equivalents 156.6 145.0
Closing cash and cash equivalents 13 204.5 156.6
The notes on pages 58 to 102 are an integral part of these consolidated financial statements.
Consolidated cash flow statement for the year to 31 December 2015

John Wood Group PLC Annual Report and Accounts 201558
General informationJohn Wood Group PLC, its subsidiaries and joint ventures, provide services to the oil and gas and power generation industries worldwide. Details of the Group’s activities during the year are provided in the Strategic Report. John Wood Group PLC is a public limited company, incorporated and domiciled in Scotland and listed on the London Stock Exchange.
Accounting Policies
Basis of preparation These financial statements have been prepared in accordance with IFRS and IFRIC interpretations adopted by the European Union (‘EU’) and with those parts of the Companies Act 2006 applicable to companies reporting under IFRS. The financial statements are also in compliance with IFRS as issued by the International Accounting Standards Board. The Group financial statements have been prepared on a going concern basis under the historical cost convention as modified by the revaluation of financial assets and liabilities at fair value through the income statement.
Significant accounting policies The Group’s significant accounting policies adopted in the preparation of these financial statements are set out below. These policies have been consistently applied to all the years presented, unless otherwise stated.
Basis of consolidationThe Group financial statements are the result of the consolidation of the financial statements of the Group’s subsidiary undertakings from the date of acquisition or up until the date of divestment as appropriate. Subsidiaries are entities over which the Group has the power togovern the financial and operating policies and generally accompanies a shareholding of more than one half of the voting rights. All Group companies apply the Group’s accounting policies and prepare financial statements to 31 December.
Joint venturesA joint venture is a type of joint arrangement where the parties to the arrangement share rights to its net assets. Joint control is the contractually agreed sharing of control of an arrangement, which exists only when decisions about the relevant activities require unanimous consent of the parties sharing control. The considerations made in determining joint control are similar to those necessary to determine control over subsidiaries.
The Group’s interests in joint ventures are accounted for using equity accounting. Under the equity method, the investment in a joint venture is initially recognised at cost. The carrying amount of the investment is adjusted to recognise changes in the Group’s share of net assets of the joint venture from the acquisition date. The results of the joint ventures are included in the consolidated financial statements from the date the joint control commences until the date that it ceases. The Group includes its share of joint venture profit on the line ‘Share of post-tax profit from joint ventures’ in the Group income statement and its share of joint venture net assets in the ‘investment in joint ventures’ line in the Group balance sheet.
Critical accounting judgements and estimatesThe preparation of the financial statements requires the use of estimates and assumptions that affect the reported amounts of assets and liabilities at the date of the financial statements and the reported amounts of revenue and expenses during the year. These estimates are based on management’s best knowledge of the amount, event or actions and actual results ultimately may differ from those estimates. The estimates and assumptions that could result in a material adjustment to the carrying amounts of assets and liabilities are addressed below.
(a) Impairment of goodwillThe Group carries out impairment reviews whenever events or changes in circumstance indicate that the carrying value of goodwill may not be recoverable. In addition, the Group carries out an annual impairment review. An impairment loss is recognised when the recoverable amount of goodwill is less than the carrying amount. The impairment tests are carried out by CGU (‘Cash Generating Unit’) and reflect the latest Group budgets as approved by the Board. The budgets are based on various assumptions relating to the Group’s businesses including assumptions relating to market outlook, resource utilisation, contract awards and contract margins. The outlook for the Group is discussed in the CEO Review. Pre-tax discount rates of between 12% and 15% have been used to discount the CGU cash flows and a terminal value is applied using a 3% long-term growth rate. A sensitivity analysis has been performed allowing for possible changes to both the discount rate and long-term growth rate. See note 8 for further details.
(b) Impairment of investment in EthosEnergy joint ventureThe Group’s investment in the EthosEnergy joint venture is accounted for using equity accounting. An impairment review was carried out in December 2015 based on the latest forecasts for EthosEnergy. The recoverable amount of the investment per the review was lower than the book value and an impairment of $137.2m was recorded in the income statement. A sensitivity analysis has also been performed allowing for possible changes to both the discount rate and long-term growth rate. See note 10 for further details.
(c) Income taxesThe Group is subject to income taxes in numerous jurisdictions and judgement is required in determining the provision for income taxes. The Group provides for uncertain tax positions based on the best estimate of the most likely outcome in respect of the relevant issue. Where the final outcome on uncertain tax positions is different from the amounts initially recorded, the difference will have an impact on the Group’s tax charge. See note 5 for further details.
(d) Retirement benefit scheme surplus/deficitThe Group operates a defined benefit pension scheme in the UK which was closed to future accrual on 30 June 2014. The value of the Group’s retirement benefit scheme surplus/deficit is determined on an actuarial basis using a number of assumptions. Changes in these assumptions will impact the carrying value of the surplus/deficit. The Group determines the appropriate discount rate to be used in the actuarial valuation at the end of each financial year following consultation with the retirement benefit scheme actuary. In determining the rate used, consideration is given to the interest rates of high quality corporate bonds in the currency in which the benefits will be paid and that have terms to maturity similar to those of the related retirement benefit obligation. See note 29 for further details.
Notes to the financial statements for the year to 31 December 2015
Financial statementsGovernanceStrategic report
John Wood Group PLC Annual Report and Accounts 2015 59
Accounting Policies (continued)
(e) ProvisionsThe Group records provisions where it has a present obligation (legal or constructive) as a result of a past event, it is probable that an outflow of resources will be required to settle the obligation and a reliable estimate of the obligation can be made. Where the outcome is less than probable, but more than remote, no provision is recorded but a contingent liability is disclosed in the financial statements, if material. The recording of provisions is an area which requires the exercise of management judgement relating to the nature, timing and probability of the liability and typically the Group’s balance sheet includes provisions for doubtful debts, warranty provisions, contract provisions (including onerous contracts) and pending legal issues. See note 18 for further details.
Functional currencyThe Group’s earnings stream is primarily US dollars and the principal functional currency is the US dollar, being the most representative currency of the Group. The Group’s financial statements are therefore prepared in US dollars.
The following exchange rates have been used in the preparation of these financial statements:
2015 2014
Average rate £1 = $ 1.5289 1.6469
Closing rate £1 = $ 1.4739 1.5593
Foreign currenciesIncome statements of entities whose functional currency is not the US dollar are translated into US dollars at average rates of exchange for the period and assets and liabilities are translated into US dollars at the rates of exchange ruling at the balance sheet date. Exchange differences arising on translation of net assets in such entities held at the beginning of the year, together with those differences resulting from the restatement of profits and losses from average to year end rates, are taken to the currency translation reserve.
In each individual entity, transactions in overseas currencies are translated into the relevant functional currency at the exchange rates ruling at the date of the transaction. Where more than one exchange rate is available, the appropriate rate at which assets can be readily realised and liabilities can be extinguished is used. Monetary assets and liabilities denominated in foreign currencies are retranslated at the exchange rates ruling at the balance sheet date. Any exchange differences are taken to the income statement.
Goodwill and fair value adjustments arising on the acquisition of a foreign entity are treated as assets and liabilities of the foreign entity and translated at the exchange rate ruling at the balance sheet date.
The directors consider it appropriate to record sterling denominated equity share capital in the financial statements of John Wood Group PLC at the exchange rate ruling on the date it was raised.
Revenue recognition Revenue comprises the fair value of the consideration received or receivable for the provision of services in the ordinary course of the Group’s activities. Revenue is recognised only when it is probable that the economic benefits associated with a transaction will flow to the Group and the amount of revenue can be measured reliably. Revenue is recognised as the services are rendered, including where they are based on contractual rates per man hour in respect of multi-year service contracts. Incentive performance revenue is recognised upon completion of agreed objectives. Revenue is stated net of sales taxes (such as VAT) and discounts.
Revenue on fixed price or lump sum contracts for services, construction contracts and fixed price long-term service agreements is recognised according to the stage of completion reached in the contract by measuring the proportion of costs incurred for work performed to total estimated costs. An estimate of the profit attributable to work completed is recognised, on a basis that the directors consider to be appropriate, once the outcome of the contract can be estimated reliably, which is when a contract is not less than 20% complete. When it is probable that total contract costs will exceed total contract revenue, the expected loss is recognised immediately. The net amount of costs incurred to date plus recognised profits less progress billings is disclosed within trade and other receivables. Revenue from fixed price and lump sum contracts is not material in the current period.
Details of the services provided by the Group are provided on page 62 under the ‘Segmental Reporting’ heading.
Exceptional itemsExceptional items are those significant items which are separately disclosed by virtue of their size or incidence to enable a full understanding of the Group’s financial performance. Transactions which may give rise to exceptional items include gains and losses on divestment of businesses, write downs or impairments of assets including goodwill, restructuring costs or provisions, litigation settlements, provisions for onerous contracts and acquisition and divestment costs. See note 4 for full details of exceptional items.
Finance expense/incomeInterest income and expense is recorded in the income statement in the period to which it relates. Arrangement fees and expenses in respect of the Group’s debt facilities are amortised over the period which the Group expects the facility to be in place. Interest relating to the unwinding of the discount on deferred and contingent consideration liabilities is included in finance expense. Interest relating to the Group’s retirement benefit scheme is also included in finance expense.
DividendsDividends to the Group’s shareholders are recognised as a liability in the period in which the dividends are approved by shareholders. Interim dividends are recognised when paid.
Goodwill The Group uses the purchase method of accounting to account for acquisitions. Goodwill represents the excess of the cost of an acquisition over the fair value of the net assets acquired. Goodwill is carried at cost less accumulated impairment losses. Goodwill is not amortised. Acquisition costs are expensed and included in administrative expenses in the income statement.
Notes to the financial statements continued

John Wood Group PLC Annual Report and Accounts 201560
Accounting Policies (continued)
Intangible assetsIntangible assets are carried at cost less accumulated amortisation. Intangible assets are recognised if it is probable that there will be future economic benefits attributable to the asset, the cost of the asset can be measured reliably, the asset is separately identifiable and there is control over the use of the asset. Where the Group acquires a business, intangible assets on acquisition such as customer contracts are identified and evaluated to determine the carrying value on the acquisition balance sheet. Intangible assets are amortised over their estimated useful lives, as follows:
Software 3-5 years
Development costs and licenses 3-5 years
Intangible assets on acquisition (customer contracts and relationships) 5 years
Property plant and equipmentProperty plant and equipment (PP&E) is stated at cost less accumulated depreciation and impairment. No depreciation is charged with respect to freehold land and assets in the course of construction.
Depreciation is calculated using the straight line method over the following estimated useful lives of the assets:
Freehold and long leasehold buildings 25-50 years
Short leasehold buildings period of lease
Plant and equipment 3-10 years
When estimating the useful life of an asset group, the principal factors the Group takes into account are the durability of the assets, the intensity at which the assets are expected to be used and the expected rate of technological developments. Asset lives and residual values are assessed at each balance sheet date.
ImpairmentThe Group performs impairment reviews in respect of PP&E, investment in joint ventures and intangible assets whenever events or changes in circumstance indicate that the carrying amount may not be recoverable. In addition, the Group carries out annual impairment reviews in respect of goodwill. An impairment loss is recognised when the recoverable amount of an asset, which is the higher of the asset’s fair value less costs to sell and its value in use, is less than its carrying amount.
For the purposes of impairment testing, goodwill is allocated to the appropriate cash generating unit (‘CGU’). The CGUs are aligned to the structure the Group uses to manage its business. Cash flows are discounted in determining the value in use.
InventoriesInventories, which include materials, work in progress and finished goods and goods for resale, are stated at the lower of cost and net realisable value.
Net realisable value is the estimated selling price in the ordinary course of business, less the estimated costs of completion and estimated selling expenses. Allowance is made for obsolete and slow-moving items, based upon annual usage.
Notes to the financial statements continued
Cash and cash equivalentsCash and cash equivalents include cash in hand and other short-term bank deposits with maturities of three months or less. Bank overdrafts are included within borrowings in current liabilities. Where the Group uses pooling arrangements with a right of set-off, overdrafts and cash are netted and included in the appropriate category depending on the net position of the pool.
Trade receivablesTrade receivables are recognised initially at fair value and subsequently measured at amortised cost using the effective interest method, less provision for impairment. A provision for impairment of trade receivables is established when there is objective evidence that the Group will not be able to collect all amounts due according to the original terms of the receivables. The provision is determined by reference to previous experience of recoverability for receivables in each market in which the Group operates.
Trade payablesTrade payables are recognised initially at fair value and subsequently measured at amortised cost.
BorrowingsBorrowings are recognised initially at fair value, net of transaction costs incurred. Borrowings are subsequently stated at amortised cost.
Deferred and contingent consideration Where deferred or contingent consideration is payable on the acquisition of a business based on an earn out arrangement, an estimate of the amount payable is made at the date of acquisition and reviewed regularly thereafter, with any change in the estimated liability being reflected in the income statement. Where deferred consideration is payable after more than one year the estimated liability is discounted using an appropriate rate of interest. Deferred and contingent consideration is recognised at fair value.
TaxationThe tax charge represents the sum of tax currently payable and deferred tax. Tax currently payable is based on the taxable profit for the year. Taxable profit differs from the profit reported in the income statement due to items that are not taxable or deductible in any period and also due to items that are taxable or deductible in a different period. The Group’s liability for current tax is calculated using tax rates enacted or substantively enacted at the balance sheet date.
Deferred tax is provided, using the full liability method, on temporary differences arising between the tax bases of assets and liabilities and their carrying amounts in the consolidated financial statements. The principal temporary differences arise from depreciation on PP&E, tax losses carried forward and, in relation to acquisitions, the difference between the fair values of the net assets acquired and their tax base. Tax rates enacted, or substantially enacted, at the balance sheet date are used to determine deferred tax.
Deferred tax assets are recognised to the extent that it is probable that future taxable profits will be available against which the temporary differences can be utilised.

Financial statementsGovernanceStrategic report
John Wood Group PLC Annual Report and Accounts 2015 61
Accounting Policies (continued)
Accounting for derivative financial instruments and hedging activitiesDerivatives are initially recognised at fair value on the date the contract is entered into and are subsequently re-measured at fair value.
Where hedging is to be undertaken, the Group documents the relationship between the hedging instrument and the hedged item at the inception of the transaction, as well as the risk management objective and strategy for undertaking the hedge transaction. The Group also documents its assessment, both at hedge inception and on an ongoing basis, of whether the derivatives that are used in hedging transactions are highly effective in offsetting changes in fair values or cash flows of the hedged items.
Cash flow hedgesThe effective portion of changes in the fair value of derivatives that are designated and qualify as cash flow hedges is recognised in the hedging reserve in equity. The gain or loss relating to the ineffective portion is recognised immediately in administrative expenses (in the case of forward contracts) or finance income/expense (in the case of interest rate swaps) in the income statement. When a hedging instrument expires or is sold, when a hedge no longer meets the criteria for hedge accounting, or when a forecast transaction is no longer expected to occur, the cumulative gain or loss that was reported in equity is immediately transferred to the income statement.
When appropriate, the Group also uses fair value and net investment hedges.
Fair value estimationThe fair value of interest rate swaps is calculated as the present value of their estimated future cash flows. The fair value of forward foreign exchange contracts is determined using forward foreign exchange market rates at the balance sheet date. The fair values of all derivative financial instruments are obtained from valuations provided by financial institutions.
The carrying values of trade receivables and payables approximate to their fair values.
The fair value of financial liabilities is estimated by discounting the future contractual cash flows at the current market interest rate that is available to the Group for similar financial instruments.
Operating leases
As lesseePayments made under operating leases are charged to the income statement on a straight line basis over the period of the lease. Benefits received and receivable as an incentive to enter into an operating lease are also spread on a straight line basis over the period of lease.
As lessorOperating lease rental income arising from leased assets is recognised in the income statement on a straight line basis over the period of the lease.
Finance leasesA lease that transfers substantially all the risks and rewards incidental to ownership to the Group is classified as a finance lease. Finance leases are capitalised at the commencement of the lease at the present value of the minimum lease payments. Lease payments are apportioned between finance expense and a reduction of the lease liability so as to achieve a constant rate of interest on the outstanding balance. Leased assets are depreciated over their estimated useful life.
Retirement benefit scheme surplus/deficitThe Group operates a defined benefit scheme and a number of defined contribution schemes. The surplus or deficit recognised in respect of the defined benefit scheme represents the difference between the present value of the defined benefit obligations and the fair value of the scheme assets. The assets of this scheme are held in separate trustee administered funds. The scheme was closed to future accrual on 30 June 2014.
The defined benefit scheme’s assets are measured using fair values. Pension scheme liabilities are measured annually by an independent actuary using the projected unit method and discounted at the current rate of return on a high quality corporate bond of equivalent term and currency to the liability. The increase in the present value of the liabilities of the Group’s defined benefit scheme expected to arise from employee service in the period is charged to operating profit. The interest income on scheme assets and the increase during the period in the present value of the scheme’s liabilities arising from the passage of time are netted and included in finance expense. Re-measurement gains and losses are recognised in the statement of comprehensive income in full in the period in which they occur. The defined benefit scheme’s surplus/deficit is recognised in full and presented on the face of the Group balance sheet.
The Group’s contributions to defined contribution schemes are charged to the income statement in the period to which the contributions relate.
The Group operates a pension arrangement in the US for certain employees. Contributions are paid into a separate investment vehicle and invested in a portfolio of US funds that are recognised by the Group as a long-term receivable with a corresponding liability in other non-current liabilities. Investments are carried at fair value. The fair value of listed equity investments and mutual funds is based on quoted market prices and so the fair value measurement can be categorised in Level 1 of the fair value hierarchy.
Provisions Provision is made for the estimated liability on all products and services still under warranty, including claims already received, based on past experience. Other provisions are recognised where the Group is deemed to have a legal or constructive obligation, it is probable that a transfer of economic benefits will be required to settle the obligation, and a reliable estimate of the obligation can be made. Where amounts provided are payable after more than one year the estimated liability is discounted using an appropriate rate of interest. See note 18 for further details.
Notes to the financial statements continued

John Wood Group PLC Annual Report and Accounts 201562
Accounting Policies (continued)
Share based charges relating to employee share schemesThe Group has recorded share based charges in relation to a number of employee share schemes.
Charges are booked to the income statement as an employee benefit expense for the fair value of share options expected to be exercised under the Executive Share Option Schemes (‘ESOS’) and the Long Term Retention Plan (‘LTRP’). Amounts are accrued over the vesting period with the corresponding credit taken to retained earnings.
Options are also awarded under the Group’s Long Term Plan (‘LTP’) which is the incentive scheme in place for executive directors and certain senior executives. The charge for options awarded under the LTP is based on the fair value of those options at the grant date, spread over the vesting period. The corresponding credit is taken to retained earnings. For awards that have a market related performance measure, the fair value of the market related element is calculated using a Monte Carlo simulation model.
For further details of these schemes, please see note 20 and the Directors Remuneration Report.
Share capitalJohn Wood Group PLC has one class of ordinary shares and these are classified as equity. Dividends on ordinary shares are not recognised as a liability or charged to equity until they have been approved by shareholders.
The Group is deemed to have control of the assets, liabilities, income and costs of its employee share trusts, therefore they have been consolidated in the financial statements of the Group. Shares acquired by and disposed of by the employee share trusts are recorded at cost. The cost of shares held by the employee share trusts is deducted from equity.
Segmental reportingThe Group has determined that its operating segments are based on management reports reviewed by the Chief Operating Decision Maker (‘CODM’), the Group’s Chief Executive. The Group’s reportable segments are Wood Group Engineering and Wood Group PSN. Following the formation of the EthosEnergy joint venture in 2014, all of the Group’s predominantly opex related turbine activities are carried out through joint ventures and now managed and reported as part of Wood Group PSN. In order to provide visibility over the performance of the turbine activities, they are included on a separate line (Wood Group PSN – Turbine activities) in the Group’s management information.
The Chief Executive measures the operating performance of these segments using ‘EBITA’ (Earnings before interest, tax and amortisation). Operating segments are reported in a manner consistent with the internal management reports provided to the Chief Executive who is responsible for allocating resources and assessing performance of the operating segments.
Wood Group Engineering provides a wide range of specialist engineering services including conceptual studies, engineering, project and construction management (EPCM) and control systems upgrades to the upstream, subsea and pipeline, downstream, chemical process, automation and industrial and clean energy sectors.
Wood Group PSN – Production Services provides services to the upstream, midstream, downstream and industrial sectors through brownfield engineering and modifications, production enhancement, operations and maintenance, facility construction and maintenance management, industrial services, training and decommissioning services.
Wood Group PSN – Turbine activities provides industrial gas turbine and rotating equipment repair, maintenance, overhaul and power plant EPC services to the oil and gas and power sectors.
Disclosure of impact of new and future accounting standards
(a) Amended standards and interpretationsIAS 19 ‘Employee benefits’ was amended with effect from 1 January 2015. The amendment does not have a material impact on the Group’s financial statements.
(b) Standards, amendments and interpretations to existing standards that are not yet effective and have not been early adopted by the GroupThe following standards have been published and are mandatory for the Group’s accounting periods beginning on or after 1 January 2018, but the Group has not early adopted them:
X IFRS 15 ‘Revenue from contracts with customers’ is effective for accounting periods beginning on or after 1 January 2018. The Group is in the process of assessing the likely impact of this standard on the financial statements.
X IFRS 9 ‘Financial instruments’ is effective for accounting periods on or after 1 January 2018. The Group does not expect the adoption of this standard to have a material impact on the financial statements.
X IFRS 16 ‘Leases’ is effective for accounting periods beginning on or after 1 January 2019. The Group is in the process of assessing the likely impact of this standard on the financial statements.
Amendments have also been made to the following standards effective 1 January 2016. The Group does not expect the amendments to have a material impact on the Group’s financial statements.
X IFRS 11 ‘Joint arrangements’
X IAS 16 ‘Property, plant and equipment’
X IAS 38 ‘Intangible assets’
X IAS 27 ‘Separate financial statements’
X IFRS 10 ‘Consolidated financial statements’
X IAS 1 ‘Presentation of financial statements’
All other amendments not yet effective and not included above are not material or applicable to the Group.
Notes to the financial statements continued

Financial statementsGovernanceStrategic report
John Wood Group PLC Annual Report and Accounts 2015 63
1 Segmental reporting The Group operates through two segments, Wood Group Engineering and Wood Group PSN. Following the formation of the EthosEnergy joint venture in 2014, all of the Group’s predominantly opex related turbine activities are carried out through joint ventures and now managed and reported as part of Wood Group PSN. In order to provide visibility over the performance of the turbine activities, they are included on a separate line in the table below (Wood Group PSN – Turbine activities). This presentation is consistent with the Group’s internal management reporting. Under IFRS 11 ‘Joint arrangements’, the Group is required to account for joint ventures using equity accounting, however for management reporting the Group continues to use proportional consolidation, hence the inclusion of the proportional presentation in this note.
The segment information provided to the Group’s Chief Executive for the reportable operating segments for the year ended 31 December 2015 includes the following:
Reportable Operating Segments (1)
Revenue EBITDA(1) EBITA(1) Operating profit
Year ended 31 Dec Year ended 31 Dec Year ended 31 Dec Year ended 31 Dec
2015 2014 2015 2014 2015 2014 2015 2014
$m $m $m $m $m $m $m $m
Wood Group Engineering 1,728.6 2,130.7 232.2 248.1 214.7 232.0 159.7 203.9
Wood Group PSN – Production Services 3,447.8 4,636.0 286.7 368.0 258.0 341.7 190.2 336.1
Wood Group PSN – Turbine activities 676.0 849.7 56.1 47.3 44.2 33.3 (116.7) 28.5
Well Support – divested - - - - - - 10.4 -
Central costs (2) - - (43.3) (52.8) (47.2) (57.4) (54.1) (82.5)
Total 5,852.4 7,616.4 531.7 610.6 469.7 549.6 189.5 486.0
Remove discontinued - (188.5) - (0.7) - 1.7 (10.4) 27.3
Remove share of joint ventures (851.8) (853.8) (59.9) (53.2) (46.7) (38.5) (46.3) (45.9)
Total continuing operations excluding joint ventures 5,000.6 6,574.1 471.8 556.7 423.0 512.8 132.8 467.4
Share of post-tax profit from joint ventures 26.6 30.0
Operating profit 159.4 497.4
Finance income 3.1 1.4
Finance expense (23.9) (23.7)
Profit before taxation from continuing operations 138.6 475.1
Taxation (62.0) (112.9)
Profit for the year from continuing operations 76.6 362.2
Profit/(loss) from discontinued operations, net of tax (3) 13.5 (25.9)
Profit for the year 90.1 336.3 Notes
1. A reconciliation of EBITA to Operating profit is provided in the table below. EBITDA represents EBITA before depreciation of property plant and equipment of $62.0m (2014 : $61.0m). EBITA and EBITDA are provided as they are units of measurement used by the Group in the management of its business.
2. Central costs include the costs of certain management personnel in both the UK and the US, along with an element of Group infrastructure costs. Central costs in 2014 are stated after deducting $23.0m of exceptional costs relating to the formation of the EthosEnergy joint venture.
3. Profit from discontinued operations, net of tax, for 2015 relates to the reassessment of amounts provided on the disposal of the Well Support business in 2011 (see note 4 for further details). Profit from discontinued operations in 2014 represents the profit from the Wood Group GTS businesses transferred to EthosEnergy from January to April 2014.
4. Revenue arising from sales between segments is not material.
Notes to the financial statements continued

John Wood Group PLC Annual Report and Accounts 201564
Notes to the financial statements continued
1 Segmental reporting (continued)
Reconciliation of EBITA to Operating Profit
2015 2014 $m $m
EBITA 469.7 549.6
Amortisation (109.0) (101.2)
Exceptional items included in continuing operations (181.6) 60.6
Discontinued operating loss - 4.3
Share of joint venture interest (2.3) (1.9)
Share of joint venture tax (17.4) (14.0)
Operating profit 159.4 497.4
Segment assets and liabilities
Wood Group Engineering
Wood Group PSN - Production Services
Wood Group PSN - Turbine activities Unallocated Total
At 31 December 2015 $m $m $m $m $mSegment assets 1,031.4 2,316.3 416.4 303.0 4,067.1
Segment liabilities 410.3 552.2 20.6 663.0 1,646.1
At 31 December 2014
Segment assets 1,094.5 2,345.3 675.3 271.8 4,386.9
Segment liabilities 524.9 635.3 34.4 633.0 1,827.6
Unallocated assets and liabilities include income tax, deferred tax and cash and cash equivalents and borrowings where this relates to the
financing of the Group’s operations.
Other segment items
Wood Group Engineering
Wood Group PSN - Production Services
Wood Group PSN - Turbine activities Unallocated Total
2015 $m $m $m $m $m
Capital expenditure
- Property plant and equipment 12.0 22.5 - 1.6 36.1
- Intangible assets 21.4 15.7 - 9.4 46.5
Non-cash expense- Depreciation of property plant and equipment
17.3 27.6 - 3.9 48.8
- Amortisation of intangible assets 41.2 59.0 - 6.9 107.1
- Exceptional items (non-cash element) 4.5 9.2 146.5 (10.4) 149.8
2014 $m $m $m $m $m
Capital expenditure
- Property plant and equipment 15.7 34.0 5.3 4.0 59.0
- Intangible assets 31.9 16.0 2.8 0.5 51.2
Non-cash expense
- Depreciation of property plant and equipment 15.6 23.5 2.6 4.6 46.3
- Amortisation of intangible assets 28.1 65.9 2.8 2.1 98.9
- Exceptional items (non-cash element) - 7.5 16.0 - 23.5
The figures in the tables above are prepared on an equity accounting basis and therefore exclude the share of joint ventures.
Depreciation in respect of joint ventures was $13.2m (2014: $14.7m) and joint venture amortisation was $1.9m (2014: $2.3m).

Financial statementsGovernanceStrategic report
John Wood Group PLC Annual Report and Accounts 2015 65
Notes to the financial statements continued
1 Segmental reporting (continued)
Geographical segments
Segment assets Continuing revenue 2015 2014 2015 2014
$m $m $m $m
UK 1,121.6 1,196.3 1,441.2 1,979.9US 1,618.7 1,684.1 1,940.0 2,397.2Rest of the world 1,326.8 1,506.5 1,619.4 2,197.0
4,067.1 4,386.9 5,000.6 6,574.1
Revenue by geographical segment is based on the location of the ultimate project. Revenue is entirely attributable to the provision of services.
2 Finance expense/(income)2015 2014
$m $m
Interest payable on borrowings including senior loan notes 20.9 15.7Amortisation of bank facility fees 0.6 4.3Interest relating to discounting of deferred and contingent consideration 1.5 1.9Interest expense – retirement benefit obligations (note 29) 0.9 1.8
Finance expense – continuing operations 23.9 23.7
Interest receivable (3.1) (1.4)
Finance income (3.1) (1.4)
Finance expense – continuing operations - net 20.8 22.3
Net interest expense of $2.3m (2014: $1.9m) has been deducted in arriving at the share of post-tax profit from joint ventures. In August 2014, the Group issued $375.0m of unsecured senior loan notes in the US private placement market. The notes were issued at a mix of 7, 10 and 12 year maturities at an average fixed rate of 3.74%. Interest on the senior loan notes is included in finance expense above.

John Wood Group PLC Annual Report and Accounts 201566
3 Profit before taxation2015 2014
$m $m
The following items have been charged in arriving at profit before taxation :
Employee benefits expense (note 28) 2,669.7 3,256.7Cost of inventories recognised as an expense - 30.6Depreciation of property plant and equipment (note 9) 48.8 46.3Amortisation of intangible assets (note 8) 107.1 98.9Loss on disposal of property plant and equipment 4.0 6.2Other operating lease rentals payable:- Plant and machinery 33.7 52.0- Property 90.3 79.3Foreign exchange losses 0.6 7.4
Depreciation of property plant and equipment is included in cost of sales or administrative expenses in the income statement. Amortisation of intangible assets is included in administrative expenses in the income statement. The information in the above table includes both continuing and discontinued operations and is prepared on an equity accounting basis.
Services provided by the Group’s auditors and associate firmsDuring the year the Group obtained the following services from its auditors and associate firms at costs as detailed below:
2015 2014
$m $m
Fees payable to the Group’s auditors and its associate firms for - Audit of parent company and consolidated financial statements
1.0
1.0
Audit of Group companies pursuant to legislation 2.0 1.9
Tax and other services 0.1 0.1
3.1 3.0
Notes to the financial statements continued

Financial statementsGovernanceStrategic report
John Wood Group PLC Annual Report and Accounts 2015 67
4 Exceptional items 2015 2014
$m $m
Exceptional items included in continuing operations
Impairment of investment in EthosEnergy (see note 10) 137.2 -
Impairment of Group receivables in relation to EthosEnergy 9.3 -
Impairment recorded by EthosEnergy 12.6 -
Restructuring charges 36.6 7.5
Venezuela settlement - (58.4)
Onerous contract (14.1) (9.7)
181.6 (60.6)
Tax (credit)/charge (9.0) 10.0
Continuing operations exceptional items, net of tax 172.6 (50.6)
Exceptional items included in discontinued operations
Gain on divestment – Well Support (10.4) -
Costs relating to EthosEnergy transaction - 23.0
(10.4) 23.0
Tax relating to Well Support divestment (3.1) -
Discontinued operations exceptional items, net of tax (13.5) -
Total exceptional charge/(credit), net of tax 159.1 (27.6)
At 31 December 2015, the Group carried out an impairment review of its investment in the EthosEnergy joint venture. The recoverable amount of the investment of $192.2m is lower than the book value and an impairment charge of $137.2m has been booked in the income statement. In addition, the Group has impaired its receivables by $9.3m in relation to a balance due by EthosEnergy and an impairment of $12.6m has been recorded by EthosEnergy relating to operations which it intends to divest or close during 2016. See note 10 for further details.
In response to the lower oil price environment, the Group has taken action to reduce its cost base, including the restructuring of its business units to improve operational efficiency. In addition, a review of the Group’s property portfolio has identified onerous property leases in certain locations. In total, $36.6m of redundancy and onerous lease costs have been incurred and expensed in the income statement in 2015.
In 2013, the Group made an onerous contract provision in respect of Wood Group PSN’s joint venture in Oman. During 2015, the contract was successfully transitioned and closed out and the remaining provision of $14.1m was written back to the income statement at the end of the year. See note 10.
A tax credit of $9.0m has been recorded in respect of the exceptional items included in continuing operations.
In 2011, the Group made a provision in respect of the disposal of its Well Support business. The provision has been reassessed at 31 December 2015 with $10.4m of the provision being released to the income statement and credited to exceptional items. A tax provision was also made in 2011 in relation to the disposal. This has also been reassessed at 31 December 2015 and $3.1m has been released to the income statement.
For further details of the 2014 exceptional items please refer to the 2014 Annual Report and Accounts.
Notes to the financial statements continued

John Wood Group PLC Annual Report and Accounts 201568
5 Taxation
2015 2014$m $m
Current tax
- Current year 74.1 142.6
- Adjustment in respect of prior years (2.3) 0.6
71.8 143.2
Deferred tax
- Current year (1.7) (15.0)
- Adjustment in respect of prior years (11.2) (16.7)
(12.9) (31.7)
Total tax charge 58.9 111.5
Comprising -
Tax on continuing operations before exceptional items 71.0 102.9
Tax on exceptional items in continuing operations (9.0) 10.0
Total tax on continuing operations 62.0 112.9
Tax on discontinued operations (3.1) (1.4)
Total tax on discontinued operations (3.1) (1.4)
Total tax charge 58.9 111.5
2015 2014
Tax (credited)/charged to equity $m $m
Deferred tax movement on retirement benefit liabilities 4.9 (3.3)
Deferred tax relating to share option schemes (5.5) 6.3
Current tax relating to share option schemes (2.0) (8.1)
Deferred tax relating to foreign exchange on net investment in subsidiary - (11.1)
Current tax relating to foreign exchange on net investment in subsidiary - (3.9)
Total (credited)/charged to equity (2.6) (20.1)
Notes to the financial statements continued

Financial statementsGovernanceStrategic report
John Wood Group PLC Annual Report and Accounts 2015 69
Notes to the financial statements continued
5 Taxation (continued)Tax is calculated at the rates prevailing in the respective jurisdictions in which the Group operates. The expected rate is the weighted average rate taking into account the Group’s profits in these jurisdictions. The expected rate has decreased in 2015 due to the change in mix of the tax jurisdictions in which the Group operates. The tax charge for the year is lower (2014: lower) than the expected tax charge due to the following factors:
2015 2014$m $m
Profit before taxation from continuing operations (excluding profits from and impairment of joint ventures) 249.2 445.1
Profit/(loss) before taxation from discontinued operations 10.4 (27.3)
Total profit before taxation 259.6 417.8
Profit before tax at expected rate of 25.4% (2014: 27.7%) 65.9 115.7
Effects of:
Adjustments in respect of prior years (13.5) (16.1)
Non-recognition of losses and other attributes 12.6 22.5
Effect of foreign taxes 9.1 (1.5)
Other permanent differences (15.2) (9.1)
Total tax charge 58.9 111.5
The adjustment in respect of prior years relates to provisions on inter-company write-offs that are now expected to be tax deductible when incurred. Other permanent differences include adjustments for share based charges, research and development allowances, changes in unrecognised tax attributes and expenditure which is not tax deductible. Tax losses are recognised where there is reasonable certainty that they can be utilised in future years.
Net income tax liabilities in the Group balance sheet include $112.7m relating to uncertain tax positions where management has had to exercise judgement in determining the most likely outcome in respect of the relevant issue. The larger amounts relate to tax payable in relation to divestments ($27.9m), recoverability of withholding taxes ($20.5m), and utilisation of tax losses ($17.6m). Where the final outcome on these issues differs to the amounts provided, the Group’s tax charge will be impacted.
Where corporate tax assets and liabilities are in the same jurisdictions, amounts are netted in the Group balance sheet.
6 Dividends
2015 2014
$m $m
Dividends on ordinary shares
Final dividend paid - year ended 31 December 2014: 18.6 cents (2014: 14.9 cents) per share 68.6 54.5
Interim dividend paid - year ended 31 December 2015: 9.8 cents (2014: 8.9 cents) per share 36.3 32.7
104.9 87.2
The directors are proposing a final dividend in respect of the financial year ended 31 December 2015 of 20.5 cents per share. The final dividend will be paid on 17 May 2016 to shareholders who are on the register of members on 8 April 2016. The financial statements do not reflect the final dividend, the payment of which will result in an estimated $75.9m reduction in equity attributable to owners of the parent.

John Wood Group PLC Annual Report and Accounts 201570
7 Earnings per share2015 2014
Earnings attributable to owners of the
parent $m
Number of shares (millions)
Earnings per share
(cents)
Earnings attributable to owners of the
parent $m
Number of shares
(millions)Earnings per share (cents)
Basic pre-exceptional 238.1 369.0 64.5 299.9 366.1 81.9
Exceptional items, net of tax and non-controlling interests
(159.1) - (43.1) 22.1 - 6.0
Basic 79.0 369.0 21.4 322.0 366.1 87.9
Effect of dilutive ordinary shares - 10.3 (0.6) - 9.1 (2.1)
Diluted 79.0 379.3 20.8 322.0 375.2 85.8
Exceptional items, net of tax and non-controlling interests
159.1 - 42.0 (22.1) - (5.9)
Diluted pre-exceptional items 238.1 379.3 62.8 299.9 375.2 79.9
Amortisation, net of tax 80.4 - 21.2 73.7 - 19.7
Adjusted diluted 318.5 379.3 84.0 373.6 375.2 99.6
Adjusted basic 318.5 369.0 86.3 373.6 366.1 102.0
Basic discontinued earnings per share for the year is 3.7 cents (2014: (7.1) cents) and diluted discontinued earnings per share is 3.6 cents (2014: (6.9) cents).
The calculation of basic earnings per share is based on the earnings attributable to owners of the parent divided by the weighted average number of ordinary shares in issue during the year excluding shares held by the Group’s employee share trusts. For the calculation of diluted earnings per share, the weighted average number of ordinary shares in issue is adjusted to assume conversion of all potentially dilutive ordinary shares. The Group’s dilutive ordinary shares comprise share options granted to employees under Executive Share Option Schemes and the Long Term Retention Plan and shares and share options awarded under the Group’s Long Term Incentive Plan and Long Term Plan. Adjusted basic and adjusted diluted earnings per share are disclosed to show the results excluding the impact of exceptional items and amortisation, net of tax.
Notes to the financial statements continued

Financial statementsGovernanceStrategic report
John Wood Group PLC Annual Report and Accounts 2015 71
Notes to the financial statements continued
8 Goodwill and other intangible assets
Goodwill
Software and development
costs
Intangible assets arising on acquisition Total
$m $m $m $m
Cost
At 1 January 2015 1,727.9 184.5 380.4 2,292.8
Exchange movements (97.7) (8.4) (24.3) (130.4)
Additions - 46.5 - 46.5
Acquisitions (note 27) 135.9 0.5 77.4 213.8
Disposals - (1.7) - (1.7)
Reclassifications - 12.1 - 12.1
At 31 December 2015 1,766.1 233.5 433.5 2,433.1
Aggregate amortisation and impairment
At 1 January 2015 1.2 109.3 238.8 349.3
Exchange movements (0.4) (5.1) (20.6) (26.1)
Amortisation charge for the year - 52.9 54.2 107.1
Disposals - (1.7) - (1.7)
At 31 December 2015 0.8 155.4 272.4 428.6
Net book value at 31 December 2015 1,765.3 78.1 161.1 2,004.5
Cost
At 1 January 2014 1,622.2 151.9 384.8 2,158.9
Exchange movements (86.4) (7.4) (32.0) (125.8)
Additions - 51.2 - 51.2
Acquisitions 200.0 7.0 27.6 234.6
Disposals (7.9) (23.1) - (31.0)
Reclassifications - 4.9 - 4.9
At 31 December 2014 1,727.9 184.5 380.4 2,292.8
Aggregate amortisation and impairment
At 1 January 2014 4.7 97.0 202.2 303.9
Exchange movements (0.3) (3.6) (24.4) (28.3)
Amortisation charge for the year - 37.9 61.0 98.9
Disposals (3.2) (22.0) - (25.2)
At 31 December 2014 1.2 109.3 238.8 349.3
Net book value at 31 December 2014 1,726.7 75.2 141.6 1,943.5
In accordance with IAS 36 ‘Impairment of assets’, goodwill was tested for impairment during the year. The impairment tests were carried out by Cash Generating Unit (‘CGU’), the CGU’s being aligned to the Group’s reporting structure.
The reclassifications line includes amounts that were wrongly classified as current assets in prior periods.

John Wood Group PLC Annual Report and Accounts 201572
8 Goodwill and other intangible assets (continued)Value-in-use calculations have been prepared for each CGU using the cash flow projections included in the financial budgets approved by management for 2016 and 2017. Cash flows beyond this period are extrapolated using a growth rate of 3% per annum for a further three year period. A terminal value is applied thereafter in order to calculate long-term estimated cash flows using the same anticipated long-term growth rate of 3% across all CGUs. The growth rate used does not exceed the long-term average growth rates for the regions in which the CGUs operate. The cash flows have been discounted using pre-tax discount rates appropriate for each CGU.
Division Cash Generating Unit Goodwill carrying value ($m)
Wood Group EngineeringWood Group Mustang 479.0
Wood Group Kenny 85.5
Wood Group PSN – Production Services
WG PSN Asia Pacific 132.7
WG PSN Africa 117.3
WG PSN Middle East and ERC 5.2
WG PSN Americas 496.5
WG PSN UK 424.4
WG PSN Global Business 24.7
Total Goodwill 1,765.3
The pre-tax discount rates used range from 12-15% and the average for the businesses is 14%.
The impairment tests are carried out using the latest Group budgets as approved by the Board. The budgets are based on various assumptions including market outlook, resource utilisation, contract backlog, contract margins and assumed contract awards. A terminal value is calculated using a long-term growth rate of 3%. The value-in-use is then compared to the carrying value for each CGU to determine whether any impairment charge is required. No goodwill has been written off during the current or prior year.
A sensitivity analysis has been performed on the basis that the expected long-term growth rate falls to 2% and that the discount rates are 1% higher than those above in order to assess the impact of reasonable possible changes to the assumptions used in the impairment review. This analysis did not identify any impairment.
Intangibles arising on acquisition include the valuation of customer contracts and customer relationships recognised on business combinations. As part of the impairment review, the Group has reviewed these contracts and relationships and no impairment was identified.
Notes to the financial statements continued

Financial statementsGovernanceStrategic report
John Wood Group PLC Annual Report and Accounts 2015 73
Notes to the financial statements continued
9 Property plant and equipment
Land and BuildingsLong
leasehold and freehold
Short leasehold
Plant and equipment Total
$m $m $m $m
Cost
At 1 January 2015 57.8 20.9 245.8 324.5
Exchange movements (6.6) (0.7) (13.8) (21.1)
Additions 2.7 5.6 27.8 36.1
Acquisitions (note 27) - 1.3 17.8 19.1
Disposals (1.6) (6.4) (51.0) (59.0)
Reclassifications - - 16.2 16.2
At 31 December 2015 52.3 20.7 242.8 315.8
Accumulated depreciation and impairment
At 1 January 2015 20.1 11.8 98.0 129.9
Exchange movements (1.8) (0.4) (11.7) (13.9)
Charge for the year 3.5 3.2 42.1 48.8
Disposals (0.3) (5.4) (47.5) (53.2)
At 31 December 2015 21.5 9.2 80.9 111.6
Net book value at 31 December 2015 30.8 11.5 161.9 204.2
Cost
At 1 January 2014 54.4 19.8 224.9 299.1
Exchange movements (2.0) (0.7) (6.2) (8.9)
Additions 7.1 3.6 48.3 59.0
Acquisitions - - 12.9 12.9
Disposals (1.7) (1.8) (24.2) (27.7)
Divestment of businesses - - (5.0) (5.0)
Reclassification to intangible assets - - (4.9) (4.9)
At 31 December 2014 57.8 20.9 245.8 324.5
Accumulated depreciation and impairment
At 1 January 2014 18.9 9.9 83.0 111.8
Exchange movements (0.7) (0.4) (5.0) (6.1)
Charge for the year 3.5 3.2 39.6 46.3
Disposals (1.6) (0.9) (16.1) (18.6)
Divestment of business - - (3.5) (3.5)
At 31 December 2014 20.1 11.8 98.0 129.9
Net book value at 31 December 2014 37.7 9.1 147.8 194.6
Included in table above are $4.2m of assets under construction at 31 December 2015 (2014: nil).
Reclassifications of plant and machinery in 2015 include $11.5m of vehicles capitalised as finance leases that were treated as operating leases in the prior year financial statements. Liabilities have also been adjusted by a similar amount.

John Wood Group PLC Annual Report and Accounts 201574
10 Investment in joint ventures The Group operates a number of joint ventures companies, the most significant of which are its turbine JV’s, EthosEnergy Group Limited and RWG Limited. A full list of subsidiary and joint venture entities is included in note 34. The Group’s share of its joint venture assets, liabilities, income and expenses is shown below.
2015 2014$m $m
Non-current assets 101.7 254.2Current assets 551.4 667.3Current liabilities (320.4) (375.1)Non-current liabilities (32.3) (86.4)
Net assets 300.4 460.0
Revenue 851.8 853.8Cost of sales (719.3) (724.8)Administrative expenses (87.7) (92.8)Exceptional income 1.5 9.7
Operating profit 46.3 45.9Net finance expense (2.3) (1.9)
Profit before tax 44.0 44.0Tax (17.4) (14.0)
Share of post-tax profit from joint ventures 26.6 30.0
The assets, liabilities, income and expenses of the Group’s two most significant joint ventures, EthosEnergy and RWG are shown below.
Ethos Energy (100%) RWG (100%)2015 2014 2015 2014
$m $m $m $mNon-current assets 112.0 396.9 42.6 47.4Current assets 706.5 859.8 150.2 165.6Current liabilities (425.5) (457.6) (49.0) (53.0)Non-current liabilities (16.1) (92.7) (0.2) -
Net assets 376.9 706.4 143.6 160.0
Wood Group share 192.2 360.2 71.8 80.0
Revenue 916.9 725.3 246.6 246.4Cost of sales (783.9) (614.3) (179.8) (184.2)Administrative expenses (117.8) (98.8) (34.0) (57.2)Exceptional expense (24.7) - - -
Operating (loss)/profit (9.5) 12.2 32.8 5.0Net finance expense (4.1) (2.9) - (0.2)
(Loss)/profit before tax (13.6) 9.3 32.8 4.8Tax (17.6) (13.1) (7.2) (2.4)
Post-tax (loss)/profit (31.2) (3.8) 25.6 2.4
Wood Group share (16.0) (2.0) 12.8 1.2
Notes to the financial statements continued

Financial statementsGovernanceStrategic report
John Wood Group PLC Annual Report and Accounts 2015 75
10 Investment in joint ventures (continued)The movement in investments in joint ventures is shown below.
$m
At 1 January 2015 460.0
Exchange movements on retranslation of net assets (25.4)
Share of profit after tax 26.6
Impairment of investments (137.2)
Dividends (23.6)
At 31 December 2015 300.4
During 2015, trading in the EthosEnergy joint venture, which is part of the Wood Group PSN – Turbine activities segment, was behind plan and it became apparent to the directors in the second half of the year that the business would be unlikely to meet the future profit forecasts which were made when the JV was formed in April 2014, and had previously supported its carrying value. As a result, an impairment charge of $137.2m has been taken against our investment in EthosEnergy. In addition, the Group has provided $9.3m against a receivable from EthosEnergy which management believes is unlikely to be fully recovered. Both of these items have been treated as exceptional items in the financial statements (see note 4). EthosEnergy has also recognised impairment losses of $12.6m relating to operations which it intends to divest or close during 2016 and this is reflected in the exceptional income line in the table above.
In arriving at the post impairment carrying value, the directors have established a value in use based on the Group’s share of the joint ventures future expected cash flows. These have been discounted at a pre-tax discount rate of 15%, which is higher than the Group’s weighted average cost of capital to reflect the risks inherent in this business, and the discounted value has been compared to the carrying value of the investment. In calculating the value in use, the joint venture’s forecasts assume revenue growth into 2016 of 13% and a further 8% into 2017, which is supported by recent contract awards for 2016 and sales pipeline for 2017. In finalising their forecast the directors have added contingency against the profits arising from these contracts to significantly reduce their impact. The forecasts also assumes working capital inflows of $28m and $42m in 2016 and 2017 respectively, which are supported by recent contract awards and strategic plans to reduce inventory levels and assumes that further overhead cost savings will be delivered in the near term, improving net margins. Longer term growth rates are assumed at 3% which represents our assessment of the long-term average growth rates in the markets and countries in which the joint venture operates. If these growth, working capital or cost assumptions are not met then a further impairment may be required in future years.
A sensitivity analysis was performed on the basis that the expected long-term growth rate falls to 2% and the discount rate is increased by 1% in order to assess the impact of reasonable possible changes to the assumptions used in the impairment review. The sensitivity analysis showed that a 1% reduction in the terminal growth rate would have resulted in an additional impairment of $13.8m and a 1% increase in the discount rate would have resulted in an additional impairment of $18.9m.
The joint ventures have no significant contingent liabilities to which the Group is exposed, nor has the Group any significant contingent liabilities in relation to its interest in the joint ventures.
11 Inventories2015 2014
$m $m
Materials 2.9 4.6
Work in progress 1.6 0.6
Finished goods and goods for resale 3.6 3.9
8.1 9.1
Notes to the financial statements continued

John Wood Group PLC Annual Report and Accounts 201576
12 Trade and other receivables
2015Restated
2014$m $m
Trade receivables 955.0 1,122.5
Less: provision for impairment of trade receivables (39.6) (47.5)
Trade receivables – net 915.4 1,075.0
Amounts recoverable on contracts 26.1 91.8
Prepayments and accrued income 44.1 60.1
Loans due from joint ventures 104.7 132.4
Restricted cash 26.5 26.5
Other receivables 59.2 84.3
Trade and other receivables – current 1,176.0 1,470.0
Long term receivables 80.7 79.2
Total receivables 1,256.7 1,549.3
The Group’s trade receivables balance is shown in the table below.
Trade receivables
- GrossProvision for
impairment
Trade receivables
– NetReceivable
days
31 December 2015 $m $m $m
Wood Group Engineering 347.0 (27.9) 319.1 68
Wood Group PSN – Production Services 608.0 (11.7) 596.3 61
Total Group 955.0 (39.6) 915.4 63
31 December 2014
Wood Group Engineering 401.0 (23.2) 377.8 59
Wood Group PSN – Production Services 720.0 (24.3) 695.7 58
Wood Group PSN – Turbine activities 1.5 - 1.5 n/a
Total Group 1,122.5 (47.5) 1,075.0 58
Receivable days are calculated by allocating the closing trade receivables balance to current and prior year revenue including sales taxes. A receivable days calculation of 63 indicates that closing trade receivables represent the most recent 63 days of revenue.
A provision for the impairment of trade receivables is established when there is objective evidence that the Group will not be able to collect all amounts due according to the terms of the original receivables.
The ageing of the provision for impairment of trade receivables is as follows:
2015 2014$m $m
Up to 3 months 15.0 14.1
Over 3 months 24.6 33.4
39.6 47.5
Notes to the financial statements continued

Financial statementsGovernanceStrategic report
John Wood Group PLC Annual Report and Accounts 2015 77
12 Trade and other receivables (continued)The movement on the provision for impairment of trade receivables is as follows:
Wood Group Engineering
Wood Group PSN
- Production Services Total
2015 $m $m $m
At 1 January 23.2 24.3 47.5
Exchange movements (0.7) (0.1) (0.8)
Movement in provision 5.4 (12.5) (7.1)
At 31 December 27.9 11.7 39.6
2014
At 1 January 15.3 10.1 25.4
Exchange movements (0.5) (0.1) (0.6)
Movement in provision 8.4 14.3 22.7
At 31 December 23.2 24.3 47.5
The other classes within trade and other receivables do not contain impaired assets.
Included within gross trade receivables of $955.0m above (2014: $1,112.5m) are receivables of $172.0m (2014: $230.9m) which were past due but not impaired. These relate to customers for whom there is no recent history or expectation of default. The ageing analysis of these trade receivables, net of provisions, is as follows:
2015 2014$m $m
Up to 3 months overdue 125.8 163.1
Over 3 months overdue 46.2 67.8
172.0 230.9
The restricted cash of $26.5m (2014: $26.5m) is cash that is subject to an attachment order. The Group cannot access this cash until it receives a release letter from the Courts and as a result the cash balance is presented in receivables. Management believe it is appropriate to include the restricted cash balance in the Group’s net debt figure (see note 26). 2014 comparative figures have been restated to show the restricted cash as a receivable.
13 Cash and cash equivalents
2015Restated
2014$m $m
Cash at bank and in hand 142.9 120.1
Short-term bank deposits 61.6 36.5
204.5 156.6
The effective interest rate on short-term deposits was 0.4% (2014: 0.2%) and these deposits have an average maturity of 13 days (2014: 21 days).
At 31 December 2015, the Group held $10.0m of cash (2014: $10.0m) in its insurance captive subsidiary to comply with local regulatory requirements.
The comparative figure for cash has been restated by $26.5m in relation to the restricted cash referred to in note 12.
Notes to the financial statements continued

John Wood Group PLC Annual Report and Accounts 201578
14 Trade and other payables
2015 2014 $m $m
Trade payables 224.2 297.2
Other tax and social security payable 51.1 54.6
Accruals and deferred income 438.2 548.3
Deferred and contingent consideration 9.2 3.0
Other payables 31.2 66.0
753.9 969.1
15 Borrowings
2015 2014$m $m
Bank loans and overdrafts due within one year or on demand
Unsecured 29.9 14.7
Non-current bank loans
Unsecured 120.0 120.0
Senior loan notes
Unsecured 375.0 375.0
Total non-current borrowings 495.0 495.0
Bank loans are denominated in a number of currencies and bear interest based on LIBOR or foreign equivalents appropriate to the country in which the borrowing is incurred.
During 2014, the Group issued $375.0m of unsecured senior loan notes in the US private placement market. The notes were issued at a mix of 7, 10 and 12 year maturities at an average fixed rate of 3.74%.
The effective interest rates on the Group’s bank borrowings at the balance sheet date were as follows: 2015 2014
% %
US Dollar 1.87 1.96
Other 4.37 3.14
The carrying amounts of the Group’s borrowings are denominated in the following currencies: 2015 2014
$m $m
US Dollar 503.5 499.5
Other 21.4 10.2
524.9 509.7
The Group is required to issue trade finance instruments to certain customers. These include tender bonds, performance bonds, retention bonds, advance payment bonds and standby letters of credit. At 31 December 2015, the Group’s bank facilities relating to the issue of bonds, guarantees and letters of credit amounted to $645.0m (2014: $689.2m). At 31 December 2015, these facilities were 35% utilised (2014: 49%).
Notes to the financial statements continued

Financial statementsGovernanceStrategic report
John Wood Group PLC Annual Report and Accounts 2015 79
15 Borrowings (continued)
Borrowing facilitiesThe Group has the following undrawn borrowing facilities available at 31 December:
2015 2014$m $m
Expiring within one year 82.0 108.8
Expiring between two and five years 830.0 830.0
912.0 938.8
All undrawn borrowing facilities are floating rate facilities. The facilities expiring within one year are annual facilities subject to review at various dates during 2016. The Group was in compliance with its bank covenants throughout the year. In January 2015, the Group extended its $950m bilateral bank facilities until January 2020.
16 Other non-current liabilities2015 2014
$m $m
Deferred and contingent consideration 90.4 40.6
Other payables 110.4 89.1
200.8 129.7
Deferred and contingent consideration represents amounts payable on acquisitions made by the Group and is expected to be paid over the next four years.
17 Financial instrumentsThe Group’s activities give rise to a variety of financial risks: market risk (including foreign exchange risk and cash flow interest rate risk), credit risk and liquidity risk. The Group’s overall risk management strategy is to hedge exposures wherever practicable in order to minimise any potential adverse impact on the Group’s financial performance.
Risk management is carried out by the Group Treasury department in line with the Group’s Treasury policies. Group Treasury, together with the Group’s business units identify, evaluate and where appropriate, hedge financial risks. The Group’s Treasury policies cover specific areas, such as foreign exchange risk, interest rate risk, use of derivative financial instruments and investment of excess cash.
Where the Board considers that a material element of the Group’s profits and net assets are exposed to a country in which there is significant geo-political uncertainty a strategy is agreed to ensure that the risk is minimised.
(a) Market risk
(i) Foreign exchange riskThe Group is exposed to foreign exchange risk arising from various currencies. The Group has a number of subsidiary companies whose revenue and expenses are denominated in currencies other than the US dollar. Where possible, the Group’s policy is to eliminate all significant currency exposures on revenues at the time of the transaction by using financial instruments such as forward currency contracts. Changes in the forward contract fair values are booked through the income statement, except where hedge accounting is used in which case the change in fair value is recorded in equity.
The Group does not have any financial instruments in place to hedge foreign currency movements in its balance sheet. However, strategies such as payment of intercompany dividends are used to minimise the amount of net assets exposed to foreign currency revaluation.
The Group carefully monitors the economic and political situation in the countries in which it operates to ensure appropriate action is taken to minimise any foreign currency exposure.
Notes to the financial statements continued

John Wood Group PLC Annual Report and Accounts 201580
17 Financial instruments (continued)
The Group’s largest foreign exchange risk relates to movements in the sterling/US dollar exchange rate. Movements in the sterling/US dollar rate impact the translation of sterling profit earned in the UK and the translation of sterling denominated net assets. The potential impact of changes in the sterling/US dollar exchange rate is summarised in the table below. As the Group reports in US dollars a strengthening of the pound has a positive impact on translation of its sterling companies’ profits and net assets.
2015 2014
$m $m
Impact of 10% change to average £/$ exchange rate on profit after tax 6.0 12.3
Impact of 10% change to closing £/$ exchange rate on equity 75.2 72.9
10% has been used in these calculations as it represents a reasonable possible change in the sterling/US dollar exchange rate. The Group also has foreign exchange risk in relation a number of other currencies, in particular, the Australian dollar, the Canadian dollar, the Euro and the Norwegian kroner.
(ii) Interest rate riskThe Group finances its operations through a mixture of retained profits and debt. The Group borrows in the desired currencies at floating rates of interest and then uses interest rate swaps into fixed rates to generate the desired interest profile and to manage the Group’s exposure to interest rate fluctuations. At 31 December 2015, 80% (2014: 89%) of the Group’s bank borrowings were at fixed rates after taking account of interest rate swaps. If the senior loan notes are taken into account the percentage of debt at fixed rate increases to 94%.
The Group is also exposed to interest rate risk on cash held on deposit. The Group’s policy is to maximise the return on cash deposits whilst ensuring that cash is deposited with a financial institution with a credit rating of ‘A’ or better, where possible. If average interest rates had been 1% higher or lower during 2015 (2014: 1%), post-tax profit for the year would have been $0.2m lower or higher respectively (2014: $2.7m). 1% has been used in this calculation as it represents a reasonable possible change in interest rates.
(iii) Price riskThe Group is not exposed to any significant price risk in relation to its financial instruments.
(b) Credit riskThe Group’s credit risk primarily relates to its trade receivables. The Group’s operations comprise Wood Group Engineering and Wood Group PSN, each of which is made up of a number of businesses. Responsibility for managing credit risks lies within the businesses with support being provided by Group and divisional management where appropriate. In 2015, the Group issued a new Group credit risk policy to enhance and improve existing controls. There is significant management focus on receivables in the current challenging market.
A customer evaluation is typically obtained from an appropriate credit rating agency. Where required, appropriate trade finance instruments such as letters of credit, bonds, guarantees and credit insurance will be used to manage credit risk.
The Group’s major customers are typically large companies which have strong credit ratings assigned by international credit rating agencies. Where a customer does not have sufficiently strong credit ratings, alternative forms of security such as the trade finance instruments referred to above may be obtained.
The Group has a broad customer base and management believe that no further credit risk provision is required in excess of the provision for impairment of trade receivables.
Management review trade receivables across the Group based on receivable days calculations to assess performance. A table showing trade receivables and receivable days is provided in note 12. Receivable days calculations are not provided on non-trade receivables as management do not believe that this information is a relevant metric. The Group also has credit risk in relation to cash held on deposit. The Group’s policy is to deposit cash at institutions with a credit rating of ‘A’ or better where possible. 100% of cash held on deposit at 31 December 2015 (2014: 100%) was held with such institutions.
(c) Liquidity riskWith regard to liquidity, the Group’s main priority is to ensure continuity of funding. At 31 December 2015, 94% (2014: 97%) of the Group’s borrowings (including senior loan notes) were due to mature in more than one year. Based on the current outlook the Group has sufficient funding in place to meet its future obligations.
During 2014, the Group issued $375m of unsecured senior loan notes in the US private placement market. The notes were issued at a mix of 7, 10 and 12 year maturities. In January 2015, the Group extended its bilateral facilities of $950m to January 2020.
Notes to the financial statements continued

Financial statementsGovernanceStrategic report
John Wood Group PLC Annual Report and Accounts 2015 81
17 Financial instruments (continued)
(d) Capital riskThe Group seeks to maintain an optimal capital structure. The Group monitors its capital structure on the basis of its gearing ratio, interest cover and when applicable, the ratio of net debt to EBITDA. These ratios are calculated using the proportionally consolidated figures used for management reporting.
Gearing is calculated by dividing net debt by equity attributable to owners of the parent. Gearing at 31 December 2015 was 12.1% (2014: 11.6%).
Interest cover is calculated by dividing total EBITA by net finance expense. Interest cover for the year to 31 December 2015 was 20.3 times (2014: 22.7 times).
The ratio of net debt to total EBITDA at 31 December 2015 was 0.55 (2014: 0.48).
Financial liabilitiesThe table below analyses the Group’s financial liabilities into relevant maturity groupings based on the remaining period from the balance sheet date to the contractual maturity date. The amounts disclosed in the table are the contractual undiscounted cash flows. Drawdowns under the bilateral bank facilities are for periods of three months or less and therefore loan interest payable is excluded from the amounts below.
At 31 December 2015
Less than 1 year
$m
Between 1 and 2 years
$m
Between 2 and 5 years
$m
Over 5 years
$m
Borrowings 43.9 14.0 162.1 429.7
Trade and other payables 702.8 - - -
Other non-current liabilities - 55.0 151.2 -
At 31 December 2014
Borrowings 28.7 14.0 162.1 447.5
Trade and other payables 914.5 - - -
Other non-current liabilities - 37.8 94.2 -
Fair value of non-derivative financial assets and financial liabilitiesThe fair value of short-term borrowings, trade and other payables, trade and other receivables, short-term deposits and cash at bank and in hand approximates to the carrying amount because of the short maturity of interest rates in respect of these instruments. Drawdowns under long-term bank facilities are for periods of three months or less and as a result, book value and fair value are considered to be the same.
Details of derivative financial instruments are not disclosed in the financial statements as they are not material.
Deferred and contingent considerationDeferred and contingent consideration is payable on the acquisition of businesses based on earn out arrangements and is initially recognised at fair value. The amount payable is dependent on the post-acquisition profits of the acquired entities and the provision made is based on the Group’s estimate of the likely profits of those entities. Where deferred and contingent consideration is payable after more than one year the estimated liability is discounted using an appropriate rate of interest. The fair value of contingent consideration is not based on observable market data and as such the valuation method is classified as level 3 under IFRS 13. The process for valuation is consistently applied to all acquisitions.
Notes to the financial statements continued

John Wood Group PLC Annual Report and Accounts 201582
18 Provisions
Warranty provisions
Other provisions Total
$m $m $m
At 1 January 2015 33.7 44.4 78.1
Exchange movements (1.9) (1.4) (3.3)
Charge to income statement 1.3 45.7 47.0
Released to income statement (5.1) (21.9) (27.0)
At 31 December 2015 28.0 66.8 94.8
Warranty provisionsThese provisions are recognised in respect of guarantees provided in the normal course of business relating to contract performance. They are based on previous claims history and it is expected that most of the costs in respect of these provisions will be incurred over the next two years.
Other provisionsAt 31 December 2015, other provisions of $66.8m (2014: $44.4m) have been recognised. This amount includes provisions for non-recoverable indirect taxes, provisions for legal claims, including claims in relation to inspection and maintenance services in the US and provisions relating to the divestment of businesses. It is expected that any payment required in respect of these provisions would be made within the next two years.
19 Deferred tax Deferred tax is calculated in full on temporary differences under the liability method using the tax rate applicable to the territory in which the asset or liability has arisen. The UK rate of corporation tax, currently 20%, will reduce to 19% in April 2017 and 18% in April 2020. The Group has provided deferred tax in relation to UK companies at 19.5% (2014: 20%). The movement on the deferred tax account is shown below:
2015 2014$m $m
At 1 January (58.4) (28.2)
Exchange movements 1.8 2.4
Credit to income statement (note 5) (12.9) (31.7)
Acquisitions (note 27) 7.5 5.9
Disposals - 1.3
Reclassification of current tax 6.1 -
Deferred tax relating to retirement benefit liabilities 4.9 (3.3)
Deferred tax relating to share option schemes (5.5) 6.3
Deferred tax relating to foreign exchange on net investment in subsidiary - (11.1)
At 31 December (56.5) (58.4)
Deferred tax is presented in the financial statements as follows:
Deferred tax assets (62.5) (62.3)
Deferred tax liabilities 6.0 3.9
(56.5) (58.4)
Notes to the financial statements continued

Financial statementsGovernanceStrategic report
John Wood Group PLC Annual Report and Accounts 2015 83
19 Deferred tax (continued)No deferred tax is recognised on the unremitted earnings of overseas subsidiaries and joint ventures. As these earnings are continually reinvested by the Group, no tax is expected to be payable on them in the foreseeable future.
The Group has unrecognised tax losses of $140.6m (2014: $93.7m) to carry forward against future taxable income. Tax losses are recognised where there is reasonable certainty that they can be utilised in future years.
Deferred tax assets and liabilities are only offset where there is a legally enforceable right of offset and there is an intention to settle the balances net.
The deferred tax balances are analysed below:-
Accelerated tax depreciation Pension
Share based charges
Short term timing
differences Losses Total2015 $m $m $m $m $m $m
Deferred tax assets 49.7 - (14.3) (71.8) (26.1) (62.5)
Deferred tax liabilities - 0.9 - 5.1 - 6.0
Net deferred tax asset 49.7 0.9 (14.3) (66.7) (26.1) (56.5)
2014
Deferred tax assets 44.5 (5.4) (10.7) (90.3) (0.4) (62.3)
Deferred tax liabilities - - - 3.9 - 3.9
Net deferred tax asset 44.5 (5.4) (10.7) (86.4) (0.4) (58.4)
20 Share based charges The Group currently has a number of share schemes that give rise to share based charges. These are the Executive Share Option Scheme (‘ESOS’), the Long Term Retention Plan (‘LTRP’), the Long Term Incentive Plan (‘LTIP’), the Long Term Cash Incentive Plan (‘LTCIP’) and the Long Term Plan (‘LTP’). The LTP replaced the LTRP, LTIP and LTCIP in 2013. The charge to operating profit in 2015 for these schemes amounted to $12.3m (2014: $17.4m). $12.7m (2014: $18.2m) relating to the charge has been credited to retained earnings and $0.4m (2014: $0.8m) has been deducted from liabilities reflecting a credit to operating profit for the year in respect of true-ups to the LTCIP, which is a cash settled scheme.
The assumptions made in arriving at the charge for each scheme are detailed below.
ESOS and LTRPFor the purposes of calculating the fair value of the share options, a Black-Scholes option pricing model has been used. Based on past experience, it has been assumed that options will be exercised, on average, six months after the earliest exercise date, which is four years after grant date, and there will be a lapse rate of between 20% for ESOS and 25% for LTRP. The share price volatility used in the calculation of 40% is based on the actual volatility of the Group’s shares since IPO as well as that of comparable companies. The risk free rate of return is based on the implied yield available on zero coupon gilts with a term remaining equal to the expected lifetime of the options at the date of grant.
Long Term Incentive PlanThe Group’s Long Term Incentive Plan (‘LTIP’) was in place from 2008 to 2012. Under this Scheme, the executive directors and certain senior executives were awarded shares or share options dependent upon the achievement of performance targets established by the Remuneration Committee. The performance measures for the LTIP were EBITA, OCER (ratio of operating capital employed to revenue), total shareholder return and adjusted diluted earnings per share. The LTIP awards are in the form of shares or share options and forfeitable restricted shares or share options. 20% of any award earned over the three year performance cycle is deferred for a further two years in the form of forfeitable restricted shares or share options.
Long Term PlanThe Group’s Long Term Plan (‘LTP’) was introduced during 2013 to replace the LTRP, LTIP and LTCIP. Two distinct awards will be made under LTP. Nil value share options will be awarded on the same basis as awards under the LTRP (see above). Awards to former LTIP and LTCIP participants will be made on a broadly similar basis to LTIP with the performance measures being EBITA, total shareholder return and adjusted diluted earnings per share. Participants may be granted conditional share awards or nil cost options at the start of the cycle. Performance is measured over a three year period and up to 80% of an award may vest based on the performance over that period. The vesting of at least 20% of any award is normally deferred for a further period of at least two years.
Notes to the financial statements continued

John Wood Group PLC Annual Report and Accounts 201584
20 Share based charges (continued)
Performance based awardsDetails of the LTIP/LTP awards are set out in the table below. The charge for market related performance targets has been calculated using a Monte Carlo simulation model taking account of share price volatility against peer group companies, risk free rate of return, dividend yield and the expected lifetime of the award. Further details of the LTIP/LTP are provided in the Directors’ Remuneration Report.
Cycle 4 (LTIP) Cycle 5 (LTIP) Cycle 6 (LTP) Cycle 7 (LTP) Cycle 8 (LTP)
Performance period 2011-13 2012-14 2013-15 2014-16 2015-17
Fair value of awards £5.10 £6.18 £7.53 £7.26 £5.95
Type of award Shares/options Shares/options Options Options Options
Outstanding at 31/12/15 190,172 171,339 1,811,688 2,124,052 3,218,309
The awards outstanding under cycles 4 and 5 represent 20% of the award at vesting which is deferred for two years.
Further details on the LTP are provided in the Directors’ Remuneration Report.
LTCIPThe share based charge for the LTCIP for cycle 4 and 5 was calculated using a fair value of £5.95. The fair value is calculated using a Black-Scholes option pricing model using similar assumptions to those used for ESOS and LTRP above.
Share optionsA summary of the basis for the charge for ESOS, LTRP and LTP options is set out below together with the number of options granted, exercised and lapsed during the year.
ESOS LTRP LTP
2015 2014 2015 2014 2015 2014
Number of participants 735 1,002 215 442 291 293
Lapse rate 25% 25% 20% 20% 10-20% 20%
Risk free rate of return on grants during year N/A 1.55% N/A - 1.09%-1.14% 1.55%
Share price volatility 40% 40% 40% 40% 40% 40%
Dividend yield on grants during year N/A 1.78% N/A - 2.69% 1.78%
Fair value of options granted during year N/A £2.27 N/A - £5.25-5.91 £7.03
Weighted average remaining contractual life 6.3 years 6.9 years 1.7 years 2.3 years 3.3 years 4.3 years
Options outstanding 1 January 6,868,494 8,736,827 1,845,558 3,421,120 962,396 11,500
Options granted during the year - 1,166,552 - - 565,769 973,000
Options exercised during the year (858,478) (1,872,405) (564,319) (1,139,828) (9,405) -
Options lapsed during the year (701,422) (1,162,480) (174,253) (435,734) (96,896) (22,104)
Options outstanding 31 December 5,308,594 6,868,494 1,106,986 1,845,558 1,421,864 962,396
No. of options exercisable at 31 December 1,976,732 1,612,803 111,000 160,552 - -
Weighted average share price of options exercised during year
£6.69 £7.67 £6.26 £7.48 £6.16 -
Notes to the financial statements continued

Financial statementsGovernanceStrategic report
John Wood Group PLC Annual Report and Accounts 2015 85
20 Share based charges (continued)
Executive Share Option SchemesThe following options to subscribe for new or existing shares were outstanding at 31 December:
Number of ordinary shares under option Exercise priceYear of Grant 2015 2014 (per share) Exercise period
2006 25,000 35,000 265¼p 2010-20162007 27,000 44,000 268½p 2011-20172008 42,000 77,658 381¾p 2012-20182008 5,000 8,986 354⅓p 2012-20182009 325,113 499,621 222p 2013-20192009 5,000 25,000 283⅔p 2013-20192010 571,152 922,538 377½p 2014-20202011 926,467 1,309,192 529½p 2015-20212012 1,093,308 1,313,636 680½p 2016-20222012 2,500 5,000 802p 2016-20222013 1,239,243 1,482,019 845⅓p 2017-20232013 4,000 4,000 812p 2017-20232014 1,042,811 1,141,844 767⅔p 2018-2024
5,308,594 6,868,494
Details of the Group’s Executive Share Option Schemes are set out in the Directors’ Remuneration Report. Share options are granted at an exercise price equal to the average mid-market price of the shares on the three days prior to the date of grant.
Long Term Retention PlanThe following options granted under the Group’s LTRP were outstanding at 31 December:
Number of ordinary shares under option Exercise priceYear of Grant 2015 2014 (per share) Exercise period
2010 - 160,552 3⅓p 2014-2015
2011 - 71,563 3⅓p 2015-2016
2011 111,000 394,799 42⁄7p 2015-2016
2012 459,469 583,811 42⁄7p 2016-2017
2013 536,517 634,833 42⁄7p 2017-2018
1,106,986 1,845,558
Options are granted under the Group’s LTRP at par value. The basis of the scheme is that an overall bonus pool is calculated annually based on performance criteria that consider the growth in the Group’s adjusted earnings per share in the prior year. There are no performance criteria attached to the exercise of options under the LTRP. Further details on the LTRP are provided in the Directors’ Remuneration Report.
Nil value share optionsThe following options granted under the Group’s LTP were outstanding at 31 December:
Number of ordinary shares under option Exercise priceYear of Grant 2015 2014 (per share) Exercise period
2013 11,500 11,500 0.00p 2017-2018
2014 844,595 950,896 0.00p 2018-2019
2015 330,769 - 0.00p 2017-2018
2015 235,000 - 0.00p 2019-2020
1,421,864 962,396
Options are granted under the Group’s LTP at nil value. There are performance criteria relating to the creation of the pool available but none relating to the exercise of the options. Further details on the LTP are provided in the Directors’ Remuneration Report.
Notes to the financial statements continued

John Wood Group PLC Annual Report and Accounts 201586
21 Share capital Ordinary shares of 42⁄7 pence each (2014: 42⁄7 pence) 2015 2014Issued and fully paid shares $m shares $m
At 1 January 376,975,384 23.7 375,075,384 23.6
Allocation of new shares to employee share trusts 1,900,000 0.1 1,900,000 0.1
At 31 December 378,875,384 23.8 376,975,384 23.7
22 Share premium
2015 2014
$m $m
At 1 January 56.0 56.0
Allocation of new shares to employee share trusts 7.9 -
At 31 December 63.9 56.0
The shares allocated to the trust during the year were issued at 42⁄7 pence and 529½ pence (2014: 42⁄7 pence).
23 Retained earnings
2015 2014$m $m
At 1 January 2,142.8 1,856.6
Profit for the year attributable to owners of the parent 79.0 322.0
Dividends paid (note 6) (104.9) (87.2)
Credit relating to share based charges (note 20) 12.7 19.5
Re-measurement gain/(loss) on retirement benefit liabilities (note 29) 24.9 (16.5)
Movement in deferred tax relating to retirement benefit liabilities (4.9) 3.3
Shares allocated to employee share trusts (8.0) (0.1)
Shares disposed of by employee share trusts 5.6 11.2
Tax credit relating to share option schemes 7.5 1.8
Tax credit relating to foreign exchange on net investment in subsidiary - 15.0
Transactions relating to joint ventures and non-controlling interests - 8.5
Exchange movements in respect of shares held by employee share trusts 7.7 8.7
At 31 December 2,162.4 2,142.8
Retained earnings are stated after deducting the investment in own shares held by employee share trusts. No options have been granted over shares held by the employee share trusts (2014: nil).
Notes to the financial statements continued

Financial statementsGovernanceStrategic report
John Wood Group PLC Annual Report and Accounts 2015 87
23 Retained earnings (continued)
Shares held by employee share trusts
2015 2014Shares $m Shares $m
Balance 1 January 9,489,797 139.1 11,640,553 158.9
New shares allocated 1,900,000 8.0 1,900,000 0.1
Shares issued to satisfy option exercises (1,432,202) (5.6) (3,012,233) (11.2)
Shares issued to satisfy awards under Long Term Incentive Plan (972,272) - (1,038,523) -
Exchange movement - (7.7) - (8.7)
Balance 31 December 8,985,323 133.8 9,489,797 139.1
Shares acquired by the employee share trusts are purchased in the open market using funds provided by John Wood Group PLC to meet obligations under the Employee Share Option Schemes, LTRP, LTIP and LTP. Shares are allocated to the employee share trusts in order to satisfy future option exercises at various prices.
The costs of funding and administering the trusts are charged to the income statement in the period to which they relate. The market value of the shares at 31 December 2015 was $81.1m (2014: $88.3m) based on the closing share price of £6.13 (2014: £5.96). The employee share trusts have waived their rights to receipt of dividends on ordinary shares.
24 Other reservesCapital
reduction reserve
Capital redemption
reserve
Currency translation
reserve Hedging
reserve Total$m $m $m $m $m
At 1 January 2014 88.1 439.7 (55.8) (0.8) 471.2
Exchange movements on retranslation of foreign currency net assets - - (147.4) - (147.4)
Cash flow hedges - - - (0.1) (0.1)
At 31 December 2014 88.1 439.7 (203.2) (0.9) 323.7
Exchange movements on retranslation of foreign currency net assets - - (175.4) - (175.4)
Cash flow hedges - - - (0.1) (0.1)
At 31 December 2015 88.1 439.7 (378.6) (1.0) 148.2
The currency translation reserve relates to the retranslation of foreign currency net assets on consolidation. This was reset to zero on transition to IFRS at 1 January 2004. The movement during the year relates to the retranslation of foreign currency net assets, including goodwill and intangible assets recognised on acquisition. The hedging reserve relates to the accounting for derivative financial instruments under IAS 39. Fair value gains and losses in respect of effective cash flow hedges are recognised in the hedging reserve.
Notes to the financial statements continued

John Wood Group PLC Annual Report and Accounts 201588
25 Non-controlling interests2015 2014
$m $m
At 1 January 13.1 8.9
Exchange movements (0.5) (0.3)
Share of profit for the year 11.1 14.3
Dividends paid to non-controlling interests (1.0) (7.7)
Other transactions with non-controlling interests - (2.1)
At 31 December 22.7 13.1
26 Cash generated from operations
2015Restated
2014Note $m $m
Reconciliation of operating profit to cash generated from operations:
Operating profit from continuing operations 159.4 497.4
Less share of post-tax profit from joint ventures (26.6) (30.0)
132.8 467.4
Operating profit/(loss) from discontinued operations 10.4 (27.3)
143.2 440.1
Adjustments for:
Depreciation 1 48.8 46.3
Loss on disposal of property plant and equipment 3 4.0 6.2
Amortisation of intangible assets 1 107.1 98.9
Share based charges 20 12.3 22.2
Increase in provisions 18 27.0 7.5
Dividends from joint ventures 10 23.6 20.3
Exceptional items - non cash impact 1 149.8 23.5
Changes in working capital (excluding effect of acquisition and divestment of subsidiaries)
Increase in inventories (0.6) (5.2)
Decrease/(increase) in receivables 333.8 (100.0)
Decrease in payables (274.0) (0.8)
Exchange movements (12.1) (14.1)
Cash generated from operations 562.9 544.9
Notes to the financial statements continued

Financial statementsGovernanceStrategic report
John Wood Group PLC Annual Report and Accounts 2015 89
26 Cash generated from operations (continued)
Analysis of net debtAt
1 January 2015
Cash flow
Exchange movements
At 31 December
2015$m $m $m $m
Cash and cash equivalents 156.6 62.4 (14.5) 204.5
Restricted cash 26.5 - - 26.5
Short-term borrowings (14.7) (15.7) 0.5 (29.9)
Long-term borrowings (495.0) - - (495.0)
Net debt (326.6) 46.7 (14.0) (293.9)
Net cash of $3.6m (2014: $30.9m) was held by joint ventures at 31 December.
The restricted cash of $26.5m (2014:$26.5m) is cash that is subject to an attachment order. The Group cannot access this cash until it receives a release letter from the Courts and as a result the cash balance is presented in receivables. Management believe it is appropriate to include the restricted cash balance in the Group’s net debt figure.
27 AcquisitionsThe assets and liabilities acquired in respect of business combinations were as follows:
Infinity Group Other Total $m $m $m
Property plant and equipment 10.0 9.1 19.1
Intangible assets recognised on acquisition 45.0 32.4 77.4
Other intangible assets - 0.5 0.5
Trade and other receivables 93.4 58.0 151.4
Cash and cash equivalents 10.3 8.2 18.5
Trade and other payables (20.0) (43.0) (63.0)
Deferred tax - (7.5) (7.5)
Total identifiable net assets acquired 138.7 57.7 196.4
Goodwill 52.9 83.0 135.9
Consideration 191.6 140.7 332.3
Consideration satisfied by:
Cash 165.7 90.8 256.5
Deferred and contingent consideration 25.9 49.9 75.8
191.6 140.7 332.3
The Group has used acquisition accounting for the purchases and, in accordance with the Group’s accounting policies, the goodwill arising on consolidation of $135.9m has been capitalised. The table reflects payments in respect of deferred and contingent consideration made in relation to acquisitions in prior periods.
In June, the Group acquired 100% of the share capital of Beta Machinery Analysis, a Calgary-based engineering consultancy specialising in advanced vibration analysis. In September, the Group acquired 100% of the share capital of the Automated Technology Group, an independent supplier of control and power solutions for industrial automation in the UK. In December, the Group acquired 100% of the share capital of the Infinity Group, an industrial construction and maintenance contractor serving the petrochemical, refining and gas processing sectors in the Texas Gulf Coast and 100% of the share capital of Kelchner Inc, a US based provider of construction and energy field services.
Notes to the financial statements continued

John Wood Group PLC Annual Report and Accounts 201590
27 Acquisitions (continued)
Contingent consideration has been provided in relation to all four of the acquisitions and is payable over the next three years. The amount payable is dependent on the post-acquisition profits of the acquired entities and the provision made is based on the Group’s estimate of the likely profits of those entities. Where deferred consideration is payable after more than one year the estimated liability is discounted using an appropriate rate of interest.
Due to its size, the acquisition of the Infinity Group is considered material and has been presented separately in the table above. The other acquisitions are not considered to be material on an individual basis and therefore have been aggregated above.
The acquired companies will be in a position to access the Group’s wider client base and use the Group’s resources to further grow and develop their businesses. The acquisitions expand the Group’s existing service lines and provide increased diversification and entry into new markets. These factors contribute to the goodwill recognised on the acquisitions.
The acquisition of Infinity gives the Group access to the downstream market and provides a platform to grow geographically into other US markets.
Intangible assets of $77.4m, representing the fair value of customer contracts and relationships, have been recorded in relation to the acquisitions made in the year. Provisional fair value adjustments of $11.5m have also been recorded. Trade and other receivables acquired of $151.4m are expected to be recovered in full. The accounting for these acquisitions will be finalised in the next accounting period. No deferred tax has been recognised on the Infinity acquisition as for tax purposes the transaction is treated as an asset purchase.
Acquisition costs incurred in relation to the companies acquired during the year are included in administrative expenses in the income statement.
The outflow of cash and cash equivalents in respect of acquisitions is analysed as follows:
$m
Cash consideration 256.5
Cash acquired (18.5)
Cash outflow 238.0
Included in the cash outflow above are contingent consideration payments of $4.1m made during the year in respect of acquisitions made in prior periods. Deferred and contingent consideration payments were reassessed during the year resulting in the release of $19.0m to the income statement. Total deferred and contingent consideration outstanding at 31 December amounted to $99.6m (2014: $43.6m).
The results of the Group, as if the above acquisitions had been made at the beginning of period, are presented in the table below. Note that total revenue and EBITA includes share of joint venture revenue and EBITA and is consistent with the presentation in note 1.
$m
Total Revenue 6,312.4
Total EBITA 510.2
From the date of acquisition to 31 December 2015, the acquisitions contributed $21.2m to revenue and $3.4m to EBITA.
Notes to the financial statements continued

Financial statementsGovernanceStrategic report
John Wood Group PLC Annual Report and Accounts 2015 91
28 Employees and directors
2015 2014Employee benefits expense $m $m
Wages and salaries 2,367.9 2,905.6
Social security costs 210.7 240.6
Pension costs – defined benefit schemes (note 29) - 3.5
Pension costs – defined contribution schemes (note 29) 78.8 89.6
Share based charges 12.3 17.4
2,669.7 3,256.7
Employee benefits expense includes both continuing and discontinued operations.
2015 2014Average monthly number of employees (including executive directors) No. No.
By geographical area:
UK 8,907 9,512
US 10,082 12,409
Rest of the World 9,186 10,019
28,175 31,940
The average number of employees excludes contractors and employees of joint venture companies.
2015 2014Key management compensation $m $m
Salaries and short-term employee benefits 8.5 8.4
Amounts receivable under long-term incentive schemes 1.3 1.6
Social security costs 0.8 1.1
Post-employment benefits 0.6 0.4
Share based charges 1.3 2.6
12.5 14.1
Key management compensation represents the charge to the income statement in respect of the remuneration of the Group board and Group Excom members.
2015 2014Directors $m $m
Aggregate emoluments 4.3 5.0
Aggregate amounts receivable under long-term incentive schemes 0.6 1.0
Aggregate gains made on the exercise of share options 0.7 1.4
Share based charges 0.6 1.7
6.2 9.1
At 31 December, two directors (2014: three) had retirement benefits accruing under a defined contribution pension plan and no directors (2014: none) had benefits accruing under the Group’s defined benefit pension scheme. Further details of directors’ emoluments are provided in the Directors’ Remuneration Report.
Notes to the financial statements continued

John Wood Group PLC Annual Report and Accounts 201592
29 Retirement benefit scheme surplus/deficitThe Group operates a defined benefit pension scheme in the UK, the John Wood Group PLC Retirement Benefits Scheme, which is contracted out of the State Scheme, and a number of defined contribution plans. The assets of the defined benefits scheme are held separately from those of the Group, being invested with independent investment companies in trustee administered funds. On 30 June 2014, the scheme was closed to future accrual.
The most recent actuarial valuation of the scheme was carried out at 5 April 2013 by a professionally qualified actuary. The Group has agreed to pay deficit reduction contributions of £1.7m per annum until 2021, although this will be reviewed at the time of the next actuarial valuation. As a result of the actuarial gains arising during the year, the scheme is in surplus at 31 December 2015. Management believe that the Group will benefit from the surplus and any future funding and an asset has therefore been recognised in the Group balance sheet.
At 31 December 2015, there were no active members (2014: nil), 370 pensioners (2014: 330) and 774 deferred members (2014: 837) of the scheme.
The principal assumptions made by the actuaries at the balance sheet date were:
2015 2014% %
Discount rate 3.9 3.6
Rate of increase in pensions in payment and deferred pensions 3.2 3.1
Rate of retail price index inflation 3.2 3.1
Rate of consumer price index inflation 2.2 2.3
At 31 December 2015, the mortality assumption used to determine pension liabilities is based on the most recent mortality tables which consider UK wide mortality data relevant to the Group’s pension scheme. The mortality rates are then adjusted to allow for expected future improvements in mortality using up to date projections. The mortality assumption used a base table of PXA00 with future improvements in line with CMI_2012 (1.25%).
The amounts recognised in the balance sheet are determined as follows:
2015 2014$m $m
Present value of funded obligations (249.7) (293.1)
Fair value of scheme assets 254.2 266.1
Net surplus/(deficit) 4.5 (27.0)
The major categories of scheme assets as a percentage of total scheme assets are as follows:
2015 2015 2014 2014$m % $m %
Equity securities 206.9 81.4 201.4 75.7
Corporate bonds 24.9 9.8 18.4 6.9
Gilts 13.2 5.2 19.4 7.3
Annuity policies 6.4 2.5 7.2 2.7
Cash 2.8 1.1 19.7 7.4
254.2 100.0 266.1 100.0
The amounts recognised in the income statement are as follows:2015 2014
$m $m
Current service cost included within employee benefits expense - 3.5
Past service gain - (6.7)
Interest cost 10.1 12.0
Interest income on scheme assets (9.2) (10.2)
Total included within finance expense 0.9 1.8
The employee benefits expense and past service gain are included within administrative expenses in the income statement.
Notes to the financial statements continued

Financial statementsGovernanceStrategic report
John Wood Group PLC Annual Report and Accounts 2015 93
29 Retirement benefit scheme surplus/deficit (continued)
Changes in the present value of the defined benefit liability are as follows:
2015 2014$m $m
Present value of funded obligations at 1 January 293.1 267.1
Current service cost - 3.5
Past service gain - (6.7)
Interest cost 10.1 12.0
Re-measurements:
- actuarial (gains)/losses arising from changes in financial assumptions (15.1) 37.5
- actuarial (gains)/losses arising from changes in experience (3.1) 7.0
Benefits paid (15.6) (9.2)
Settlement of unfunded liability (4.7) -
Exchange movements (15.0) (18.1)
Present value of funded obligations at 31 December 249.7 293.1
At 31 December 2015, the present value of funded obligations comprised $175.0m relating to deferred members and $74.7m relating to pensioners.
Changes in the fair value of scheme assets are as follows:2015 2014
$m $m
Fair value of scheme assets at 1 January 266.1 225.9
Interest income on scheme assets 9.2 10.2
Contributions 2.5 28.0
Benefits paid (15.6) (9.2)
Expenses paid (0.1) (0.5)
Re-measurement gain on scheme assets 6.7 28.0
Exchange movements (14.6) (16.3)
Fair value of scheme assets at 31 December 254.2 266.1
Analysis of the movement in the balance sheet (surplus)/deficit:
2015 2014$m $m
Liability at 1 January 27.0 41.2
Current service cost - 3.5
Past service gain - (6.7)
Finance expense 0.9 1.8
Contributions (2.5) (28.0)
Expenses paid 0.1 0.5
Re-measurement (gains)/losses recognised in the year (24.9) 16.5
Settlement of unfunded liability (4.7) -
Exchange movements (0.4) (1.8)
(Surplus)/deficit at 31 December (4.5) 27.0
The contributions expected to be paid during the financial year ending 31 December 2016 amount to $2.5m (£1.7m).
Notes to the financial statements continued

John Wood Group PLC Annual Report and Accounts 201594
29 Retirement benefit scheme surplus/deficit (continued)
Scheme risks The retirement benefit scheme is exposed to a number of risks, the most significant of which are –
VolatilityThe defined benefit obligation is measured with reference to corporate bond yields and if scheme assets underperform relative to this yield, this will create a deficit, all other things being equal. The scheme investments are well diversified such that the failure of a single investment would not have a material impact on the overall level of assets.
Changes in bond yieldsA decrease in corporate bond yields will increase the defined benefit obligation. This would however be offset to some extent by a corresponding increase in the value of the scheme’s bond asset holdings.
Inflation riskThe majority of benefits in deferment and in payment are linked to price inflation so higher actual inflation and higher assumed inflation will increase the defined benefit obligation.
Life expectancy The defined benefit obligation is generally made up of benefits payable for life and so increases to members’ life expectancies will increase the defined benefit obligation, all other things being equal.
Sensitivity of the retirement benefit obligationThe impact of changes to the key assumptions on the retirement benefit obligation is shown below. The sensitivity is based on a change in an assumption whilst holding all other assumptions constant. In practice, this is unlikely to occur, and changes in some of the assumptions may be correlated. When calculating the sensitivity of the defined benefit obligation to significant actuarial assumptions the same method has been applied as when calculating the pension obligation recognised in the Group balance sheet.
Assumption Change Impact on obligation
Discount rate 0.1% $4.7m
Rate of retail prices index inflation 0.1% $2.8m
Rate of consumer price index inflation 0.1% $1.3m
Life expectancy 1 year $6.6m
Defined contribution plansPension costs for defined contribution plans were as follows:
2015 2014$m $m
Defined contribution plans 78.8 89.6
There were no material contributions outstanding at 31 December 2015 in respect of defined contribution plans.
The Group operates a pension arrangement in the US for certain employees. During the year, the Group made contributions of $0.8m (2014: $0.9m) to the arrangement. Contributions are invested in a portfolio of US funds and the fair value of the funds at the balance sheet date are recognised by the Group as a long-term receivable. Investments held by the Group at 31 December amounted to $75.5m (2014: $71.7m) and will be used to pay benefits when employees retire. The corresponding liability is recorded in other non-current liabilities.
Notes to the financial statements continued

Financial statementsGovernanceStrategic report
John Wood Group PLC Annual Report and Accounts 2015 95
30 Operating lease commitments – minimum lease payments
Property
2015 Vehicles, plant and equipment Property
2014 Vehicles, plant
and equipment$m $m $m $m
Amounts payable under non-cancellable operating leases due:
Within one year 78.4 9.3 87.8 17.7
Later than one year and less than five years 251.7 11.4 268.1 14.5
After five years 232.2 - 188.2 -
562.3 20.7 544.1 32.2
The Group leases various offices and facilities under non-cancellable operating lease agreements. The leases have various terms, escalation clauses and renewal rights. The Group also leases vehicles, plant and equipment under non-cancellable operating lease agreements.
31 Contingent liabilities At the balance sheet date, the Group had cross guarantees without limit extended to its principal bankers in respect of sums advanced to subsidiaries.
From time to time, the Group is notified of claims in respect of work carried out. Where management believes we are in a strong position to defend these claims no provision is made.
The Group is aware of potential legal challenges which may affect historic and future employment costs and may have an impact on the Group. At this point it is not possible to make a reliable estimate of the liability, if any, that may arise and therefore no provision has been made.
32 Capital and other financial commitments
2015 2014$m $m
Contracts placed for future capital expenditure not provided in the financial statements 5.0 5.8
The capital expenditure above relates to property plant and equipment. In addition, joint venture companies have commitments amounting to $1.0m.
33 Related party transactionsThe following transactions were carried out with the Group’s joint ventures. These transactions comprise sales and purchases of goods and services and funding provided in the ordinary course of business. The receivables include loans to certain joint venture companies.
2015 2014$m $m
Sale of goods and services to joint ventures 47.6 57.5
Purchase of goods and services from joint ventures 11.6 15.6
Receivables from joint ventures 147.0 181.0
Payables to joint ventures 18.6 27.6
Key management compensation is disclosed in note 28.
Notes to the financial statements continued

John Wood Group PLC Annual Report and Accounts 201596
34 Subsidiaries and joint ventures
The Group’s related undertakings at 31 December 2015 are listed below. All subsidiaries are fully consolidated in the financial statements. Ownership interests reflect holdings of ordinary shares.
Name of subsidiary or joint venture Country of incorporation or registration Ownership interest %
AG Offshore Engineering (China) Ltd China 100%Altablue Australia Pty Ltd Australia 100%Altablue Inc. United States 100%AltaBlue Limited Jersey 100%Australian Skills Training Pte. Ltd. Singapore 100%Automated Technology Group Holdings Limited United Kingdom 100%Autotech Controls Limited United Kingdom 100%Baker Energy International Equatorial Guinea S.A. Equatorial Guinea 65%Beta Machinery Analysis Ltd. Canada 100%BMA Engineering Sdn. Bhd. Malaysia 100%BMA Global Ltd. Canada 100%BMA Investments Ltd. Canada 100%BMA Services, Inc. United States 100%BMA Solutions L.P. United States 100%Brazos M&E (Nevada), Inc United States 100%Brazos M&E Ltd United States 100%Brazos M&E Management, LLC United States 100%Caliber Holding, Inc United States 100%Caliber Services, LP United States 100%Cape Software, Inc. United States 100%CSGP, LLC United States 100%Dockside Services (Devonport) Limited United Kingdom 48%Eagle Pipeline Construction, Inc. United States 100%East Mediterranean Energy Services Limited United Kingdom 100%Elkhorn Construction, Inc. United States 100%Elkhorn Holdings, Inc. United States 100%Energy Logistics, Inc. United States 33%Erbus AS Norway 100%Ethos Energy Group Limited United Kingdom 51%EthosEnergy Sp ZOO Poland 41%EthosEnergy (Abu Dhabi) L.L.C. United Arab Emirates 25%EthosEnergy (Canada), Ltd Canada 51%EthosEnergy (GBR) Limited United Kingdom 51%EthosEnergy (MEA) Limited United Kingdom 51%EthosEnergy (Middle East) Limited United Kingdom 51%EthosEnergy (USA), LLC United States 51%EthosEnergy Accessories and Components, LLC United States 51%EthosEnergy AG Switzerland 51%EthosEnergy Australia Pty Ltd Australia 51%EthosEnergy B.V. Netherlands 51%EthosEnergy Component Repair, LLC United States 51%EthosEnergy de Colombia SAS Colombia 51%EthosEnergy de Mexico SA de CV Mexico 51%EthosEnergy Field Services, LLC United States 51%EthosEnergy GmbH Germany 51%EthosEnergy GTS Holdings (US), LLC United States 51%EthosEnergy Holdings (Ireland) Limited Ireland 51%EthosEnergy International Limited Jersey 51%EthosEnergy Investments Limited United Kingdom 51%EthosEnergy Italia SpA Italy 51%EthosEnergy Light Turbines Limited United Kingdom 51%EthosEnergy Light Turbines, LLC United States 51%EthosEnergy Oman Limited Jersey 51%
Notes to the financial statements continued

Financial statementsGovernanceStrategic report
John Wood Group PLC Annual Report and Accounts 2015 97
Name of subsidiary or joint venture Country of incorporation or registration Ownership interest %
EthosEnergy Overseas Limited United Kingdom 51%EthosEnergy Peru S.A.C. Peru 51%EthosEnergy Poland Spolka Akcyjna Poland 51%EthosEnergy Power Operations (Freeport), LLC United States 51%EthosEnergy Power Operations (West), LLC United States 51%EthosEnergy Power Plant Services, LLC United States 51%EthosEnergy Power Solutions, LLC United States 51%EthosEnergy TC Inc United States 51%EthosEnergy Thailand Limited Thailand 46%EthosEnergy US Group Inc. United States 51%EthosEnergy US Holdings Limited United Kingdom 51%EthosEnergy USA Holdings Inc. United States 51%Feng Neng Sgurr (Beijing) Renewable Energy Technology Co. Ltd China 75%Garlan Insurance Limited Guernsey 100%Gas Turbine Efficiency AB Sweden 51%Gas Turbine Efficiency Limited United Kingdom 51%Gas Turbine Efficiency Sweden AB Sweden 51%Gas Turbine Efficiency, Inc. United States 51%Gas Turbine Efficiency, LLC United States 51%Gas Turbine Fuel Systems Limited United Kingdom 100%Gentech Services Limited Virgin Islands, British 51%Ghabet El Iraq for General Contracting and Engineering Services, Engineering Consultancy (LLC)
Iraq 100%
Global Performance, LLC United States 100%Greenwell Services (UK) Limited United Kingdom 100%Grenland Group (China) Limited China 100%GTS Power Solutions Limited Jersey 100%H & L Accessory, LLC United States 51%Harwat International Finance Corporation N.V. Curaçao 100%Harwood Production Services Limited United Kingdom 100%Heart of Mustang United States 100%Hexagon Sociedad Anonima con Consejo de Administracion Equatorial Guinea 65%HFA Limited United Kingdom 100%Hoad, Inc. United States 100%ICGP, LLC; Infinity Construction Services, LP United States 100%Igranic Control Systems Limited United Kingdom 100%IMGP, LLC; Infinity Maintenance Services, LP United States 100%Infinity Construction Holding, LLC United States 100%Infinity Maintenance Holding, LLC United States 100%Innofield Services Pty Ltd Australia 100%Integrated Maintenance Services Limited United Kingdom 100%ISI Group, L.L.C. United States 90%ISI Mustang (Argentina) S.A. Argentina 91%ISI Mustang Bolivia S.R.L. Bolivia 90%ISI Mustang Chile SpA Chile 90%ISI Mustang Peru S.A.C. Peru 89%ISI Mustang Servicios de Ingenieria de Mexico, S de R.L. De C.V. Mexico 89%ISI Solutions Colombia Limitada Colombia 90%ISI Solutions, Inc. United States 90%J P Kenny Overseas Limited Cyprus 100%J P Kenny Technology Limited United Kingdom 100%J W G Trustees Limited United Kingdom 100%Jet Turbine Service LLC United States 51%John Brown E & C Ltd United Kingdom 100%John Wood Group B.V. Netherlands 100%John Wood Group Holdings B.V. Netherlands 100%John Wood Group US Company United Kingdom 100%
Notes to the financial statements continued

John Wood Group PLC Annual Report and Accounts 201598
Name of subsidiary or joint venture Country of incorporation or registration Ownership interest %
John Wood Group USA, Inc. United States 100%JWG 16 Limited United Kingdom 100%JWG 64 Limited United Kingdom 100%JWG Cooperatief B.A Netherlands 100%JWG Ireland CAD Ireland 100%JWG Ireland NOK Ireland 100%JWG Ireland USD Ireland 100%JWG Ireland USD 2 Ireland 100%JWG Ireland USD 3 Unlimited Company Ireland 100%JWG Netherlands 1 B.V. Netherlands 100%JWG Netherlands 2 B.V. Netherlands 100%JWG Netherlands 3 B.V. Netherlands 100%JWG Netherlands 4 B.V. Netherlands 100%JWG Nigeria Limited Nigeria 49%JWG Norway Investments Limited United Kingdom 100%JWGUS Company Limited United Kingdom 100%JWGUSA Holdings Limited United Kingdom 100%JWGUSA Holdings, Inc. United States 100%JWH Management Services Limited United Kingdom 100%Kelchner, Inc. United States 100%Kelfield, Inc. United States 100%Kelwat Investments Limited United Kingdom 100%KTR-WG Turbine Services LLP Kazakhstan 26%Leadgate Plant Hire Limited United Kingdom 95%Liberty Services, Inc. United States 33%Libyan-Australian Joint Venture Company for Safety Services Libya 50%M & O Global Pty Ltd Australia 100%M&O Pacific Limited New Zealand 100%Marine & Offshore Group Pty Limited Australia 100%Marine Computation Services Kenny Group Limited Ireland 100%Massy Wood Group Ltd. Trinidad and Tobago 50%MCS Kenny International (UK) Limited United Kingdom 100%MCS Kenny International Norge AS Norway 100%Melwat Finance Limited United Kingdom 100%Mitchell's Oil Field Services, Inc. United States 100%Multiphase Solutions Kenny Limited United Kingdom 100%Mustang and Faisal Jameel Al-Hejailan and Dar Al-Riyadh Consulting Company Saudi Arabia 56%Mustang Engineering (North Carolina) PC United States 100%Mustang Engineering Florida, Inc. United States 100%Mustang Engineering India Private Limited India 100%Mustang Engineering Limited United Kingdom 100%Mustang Engineering Pty. Ltd. Australia 100%Mustang International, L.P. United States 100%Mustang Malaysia Sdn. Bhd. Malaysia 100%Mustang of New Jersey, Inc. United States 80%Mustang Process and Industrial Inc. United States 100%Mustang Saudi Arabia Co. Ltd. Saudi Arabia 100%Mustang Subs GP, Inc. United States 100%Mustang Subs LP, Inc. United States 100%NDT Systems, Inc. United States 100%Northern Integrated Services Limited United Kingdom 50%O.T.S. Finance and Management Limited Vanuatu 100%ODL Canada Limited Canada 50%ODL PTY LTD Australia 100%ODL, Inc. United States 100%Offshore Design Limited United Kingdom 100%Onshore Pipeline Engineering, D.P.C. United States 100%
Notes to the financial statements continued

Financial statementsGovernanceStrategic report
John Wood Group PLC Annual Report and Accounts 2015 99
Name of subsidiary or joint venture Country of incorporation or registration Ownership interest %
OTS International Training Services Limited United Kingdom 100%Overseas Technical Service (Harrow) Limited United Kingdom 100%Overseas Technical Service International Limited Vanuatu 100%Overseas Technical Services Nigeria Limited Nigeria 83%Patrie Investments B.V. Netherlands 100%Prezioso Pyeroy Services Limited United Kingdom 95%Procesos y Disenos Energeticos SA Colombia 100%Production Services Network (UK) Limited United Kingdom 100%Production Services Network Angola Limitada Angola 49%Production Services Network Bangladesh Limited United Kingdom 100%Production Services Network Corporate Limited United Kingdom 100%Production Services Network Emirates LLC United Arab Emirates 49%Production Services Network Eurasia LLC Russian Federation 50%Production Services Network Gabon Sole Limited Gabon 100%Production Services Network International Limited Bermuda 100%Production Services Network Qatar LLC Qatar 24%Production Services Network Resource Corp Philippines 75%Production Services Network Sakhalin LLC Russian Federation 50%Proyectos Especializados de Generacion EEG, S.A. de C.V. Mexico 51%PSJ Fabrications Ltd United Kingdom 100%PSN (Angola) Limited United Kingdom 100%PSN (Philippines) Limited United Kingdom 100%PSN Asia Limited United Kingdom 100%PSN KazStroy JSC Kazakhstan 50%PSN Overseas Holding Company Limited United Arab Emirates 100%PSN Overseas Limited United Kingdom 100%PSN Overseas Romania SRL Romania 100%PSN Production Services Network Philippines Corp Philippines 60%PT Australian Skills Training Indonesia 95%PT. Wood Group Kenny Indonesia Indonesia 90%Pyeroy (Ireland) Limited Ireland 95%Pyeroy Limited United Kingdom 95%RWG (Repair & Overhauls) Limited United Kingdom 50%RWG (Repair & Overhauls) USA, Inc. United States 50%RWG OTEC Sdn. Bhd. Malaysia 25%RWG Reparacao E Revisao Limitada Brazil 50%Sakhalin Technical Services Network LLC Russian Federation 40%Santos Barbosa Tecnica Comercio e Servicios Ltda Brazil 100%SARL Wood Group Algeria Algeria 100%SD FortyFive Limited United Kingdom 100%Servicios EHC Training C.A. Venezuela 50%SgurrControl Limited United Kingdom 39%SgurrEnergy Inc. United States 60%SgurrEnergy India Pvt. Ltd India 38%SgurrEnergy Limited United Kingdom 76%Shanahan Engineering (Switzerland) GmbH Switzerland 51%Shanahan Engineering Group Ireland 49%Shanahan Engineering Limited Ireland 51%Shanahan Engineering Turkey Insaat Sanayive Ticaret Limited Sirket Turkey 51%Shanahan Engineering, Inc. United States 51%Ship Support Services Limited United Kingdom 48%Sigma 3 (North Sea) Limited United Kingdom 63%Simco Venezuela 90%SKS Wood Sdn Bhd Brunei 43%Sulzer Wood Limited United Kingdom 49%Swaggart Brothers, Inc. United States 100%Swaggart Logging & Excavation LLC United States 100%
Notes to the financial statements continued

John Wood Group PLC Annual Report and Accounts 2015100
Name of subsidiary or joint venture Country of incorporation or registration Ownership interest %
The Automated Technology Group Limited United Kingdom 100%The Igranic Group Limited United Kingdom 100%TransCanada Turbines (UK) Limited United Kingdom 50%TransCanada Turbines Australia Pty Limited Australia 50%TransCanada Turbines Ltd. Canada 50%TransCanada Turbines, Inc. United States 50%Turbocare S.p.A Poland 51%United Electrical & Instrumentation (Nevada), Inc United States 100%United Electrical & Instrumentation Management, Ltd United States 100%United Electrical & Instrumentation, Ltd United States 100%Vista-Mustang JV Corp. Canada 50%W L S Holdings Limited United Kingdom 100%WG International Services Limited Cyprus 100%WG Intetech Holdings Limited United Kingdom 90%WG Power US Limited United Kingdom 100%WGD003 Limited United Kingdom 100%WGD004 Limited United Kingdom 100%WGD005 Limited United Kingdom 100%WGD006 Limited United Kingdom 100%WGD007 Limited United Kingdom 100%WGD008 Limited United Kingdom 100%WGD009 Limited United Kingdom 100%WGD010 Limited United Kingdom 100%WGD013 Limited United Kingdom 100%WGD014 Limited United Kingdom 100%WGD015 Limited United Kingdom 100%WGD016 Limited United Kingdom 100%WGD017 Limited United Kingdom 100%WGD018 Limited United Kingdom 100%WGD020 Limited United Kingdom 100%WGD021 Limited United Kingdom 100%WGD022 Limited United Kingdom 100%WGD023 Limited United Kingdom 100%WGD024 Limited United Kingdom 100%WGD025 Limited United Kingdom 100%WGD026 Limited United Kingdom 100%WGD027 Limited United Kingdom 100%WGD028 Limited United Kingdom 100%WGD029 Limited United Kingdom 100%WGD030 Limited United Kingdom 100%WGD031 Limited United Kingdom 100%WGD032 Limited United Kingdom 100%WGD034 Limited United Kingdom 100%WGD035 Limited United Kingdom 100%WGPF Contracting Limited Cyprus 100%WGPS International Limited Cyprus 100%WGPS Peru S.A.C. Peru 100%WGPSN (Holdings) Limited United Kingdom 100%WGPSN Eurasia Limited United Kingdom 50%WGPSN Queensland Pty Ltd Australia 100%Wood Group - CCC Limited Cyprus 100%Wood Group - Nobel Oil B.V. Netherlands 100%Wood Group (Canada) Limited Canada 100%Wood Group (South Africa) Pty Ltd South Africa 100%Wood Group Algeria Limited United Kingdom 100%Wood Group Algiers Limited United Kingdom 100%
Notes to the financial statements continued

Financial statementsGovernanceStrategic report
John Wood Group PLC Annual Report and Accounts 2015 101
Name of subsidiary or joint venture Country of incorporation or registration Ownership interest %
Wood Group Angola Limited Cyprus 100%Wood Group Annaba Limited United Kingdom 100%Wood Group Arzew Limited United Kingdom 100%Wood Group Asset Management Solutions Limited United Kingdom 100%Wood Group Australia PTY Ltd Australia 100%Wood Group de Chile S.A. Chile 51%Wood Group de Mexico S.A. de C.V. Mexico 100%Wood Group E & PF Holdings, Inc. United States 100%Wood Group Engineering & Operations Support Limited United Kingdom 100%Wood Group Engineering (Colombia) Ltd. British Virgin Islands 100%Wood Group Engineering (North Sea) Limited United Kingdom 100%Wood Group Engineering and Production Facilities Australia Pty Ltd Australia 100%Wood Group Engineering and Production Facilities Brasil Ltda Brazil 100%Wood Group Engineering and Production Facilities de Mexico S.A. de C.V. Mexico 100%Wood Group Engineering Contractors Limited United Kingdom 100%Wood Group Engineering International Limited United Kingdom 100%Wood Group Engineering Pte. Limited Singapore 100%Wood Group Engineering Sdn. Bhd Malaysia 100%Wood Group Engineering Services (France) SAS France 100%Wood Group Engineering Services (Middle East) Limited Jersey 100%Wood Group Engineering Services (North Africa) Limited Cyprus 100%Wood Group Engineering Services (Qatar) LLC Qatar 25%Wood Group Environmental Services Limited United Kingdom 100%Wood Group Equatorial Guinea Limited Cyprus 100%Wood Group ESP Saudi Arabia Limited Saudi Arabia 51%Wood Group Frontier Limited United Kingdom 100%Wood Group Gas Turbine Services & Partner LLC Oman 36%Wood Group Gas Turbine Services Holdings Limited United Kingdom 100%Wood Group Gas Turbines (Venezuela) Limited British Virgin Islands 51%Wood Group Gas Turbines De Venezuela, S.A. Venezuela 99%Wood Group Gas Turbines Limited United Kingdom 100%Wood Group Ghana Limited Ghana 49%Wood Group Hassi Messaoud Limited United Kingdom 100%Wood Group Holdings (International) Limited United Kingdom 100%Wood Group HR Limited United Kingdom 100%Wood Group Industrial Services Limited United Kingdom 95%Wood Group Integrity Management Pty Ltd Australia 100%Wood Group Integrity Management UK Limited United Kingdom 100%Wood Group International Limited United Kingdom 100%Wood Group International N.V. Curaçao 100%Wood Group International Services Pte. Ltd. Singapore 100%Wood Group Intetech Consultancy Limited United Kingdom 90%Wood Group Intetech Limited United Kingdom 90%Wood Group Intetech Overseas Holdings Company Limited United Kingdom 90%Wood Group Intetech Wells Limited United Kingdom 90%Wood Group Investments Limited United Kingdom 100%Wood Group Kazakhstan LLP Kazakhstan 100%Wood Group Kenny Australia Pty Ltd Australia 100%Wood Group Kenny Canada Ltd. Canada 100%Wood Group Kenny Corporate Limited United Kingdom 100%Wood Group Kenny do Brasil Servicos de Engenharia Ltda Brazil 100%Wood Group Kenny India Private Limited India 100%Wood Group Kenny Ireland Limited Ireland 100%Wood Group Kenny Limited United Kingdom 100%Wood Group Kenny Norge AS Norway 100%Wood Group Kenny SAS France 100%
Notes to the financial statements continued

John Wood Group PLC Annual Report and Accounts 2015102
Name of subsidiary or joint venture Country of incorporation or registration Ownership interest %
Wood Group Kenny Sdn Bhd Malaysia 100%Wood Group Kenny UK Limited United Kingdom 100%Wood Group Kenny, Inc. United States 100%Wood Group Kianda Limitada Angola 41%Wood Group Limited United Kingdom 100%Wood Group Management Services de Mexico S.A. de C.V. Mexico 100%Wood Group Management Services Limited United Kingdom 100%Wood Group Management Services, Inc. United States 100%Wood Group Mocambique, Limitada Mozambique 100%Wood Group Mustang (Canada) Construction Management Inc. Canada 100%Wood Group Mustang (Canada) Inc. Canada 100%Wood Group Mustang (M) Sdn. Bhd. Malaysia 100%Wood Group Mustang Holdings, Inc. United States 100%Wood Group Mustang Norway AS Norway 100%Wood Group Mustang Norway Operations AS Norway 100%Wood Group Mustang, Inc. United States 100%Wood Group Norway Holdings AS Norway 100%Wood Group O&M International, Ltd. Cayman Islands 100%Wood Group Offshore Services Limited Guernsey 100%Wood Group Oilfield Rentals Limited United Kingdom 100%Wood Group Operations Holdings Limited United Kingdom 100%Wood Group OTS International Inc. Cayman Islands 100%Wood Group Overseas N.V. Curaçao 100%Wood Group PDE Limited British Virgin Islands 100%Wood Group Peru S.A.C. Peru 100%Wood Group Power Investments Limited United Kingdom 100%Wood Group Pratt & Whitney Industrial Turbine Services, LLC United States 25%Wood Group Production And Consulting Services, Inc United States 100%Wood Group Production Facilities (Malaysia) Sdn. Bhd. Malaysia 48%Wood Group Production Facilities Limited Jersey 100%Wood Group Production Facilities Pty Limited Australia 100%Wood Group Production Services Global, Inc. United States 100%Wood Group Production Services UK Limited United Kingdom 100%Wood Group Production Technology Limited United Kingdom 100%Wood Group Properties Limited United Kingdom 100%Wood Group PSN Australia Pty Ltd Australia 100%Wood Group PSN Canada Inc. Canada 100%Wood Group PSN Commissioning Services, Inc United States 100%Wood Group PSN India Private Limited India 100%Wood Group PSN Lease Maintenance & Construction LLC United States 100%Wood Group PSN Limited United Kingdom 100%Wood Group PSN Uganda Limited Uganda 100%Wood Group PSN, Inc. United States 100%Wood Group Somias SPA Algeria 55%Wood Group Support Services, Inc. United States 100%Wood Group Trinidad & Tobago Limited Trinidad and Tobago 100%Wood Group US Holdings, Inc. United States 100%Wood Group US International, Inc. United States 100%Wood Group USA, Inc. United States 100%Wood Group Well Support, Inc. United States 100%Wood Group, LLC Iraq 100%Wood Group/MO Services, Inc. United States 100%Wood Group/OTS Limited United Kingdom 100%Woodhill Frontier Limited United Kingdom 100%Yeskertkish Kyzmet Kazakhstan LLP Kazakhstan 100%
Notes to the financial statements continued
Company financial statements
Financial statementsGovernanceStrategic report
John Wood Group PLC Annual Report and Accounts 2015 103
Company financial statements

John Wood Group PLC Annual Report and Accounts 2015104
Independent auditor’s report to the members of John Wood Group PLC
Report on the parent company financial statements
Our opinionIn our opinion, John Wood Group PLC’s parent company financial statements (the “financial statements”):
X give a true and fair view of the state of the parent company’s affairs as at 31 December 2015 and of its cash flows for the year then ended;
X have been properly prepared in accordance with International Financial Reporting Standards (“IFRSs”) as adopted by the European Union; and
X have been prepared in accordance with the requirements of the Companies Act 2006.
What we have auditedThe financial statements, included within the Annual Report, comprise:
X the balance sheet as at 31 December 2015;
X the statement of cash flows for the year then ended;
X the statement of changes in equity for the year then ended;
X the notes to the financial statements, which include a summary of significant accounting policies and other explanatory information.
Certain required disclosures have been presented elsewhere in the Annual Report, rather than in the notes to the financial statements. These are cross-referenced from the financial statements and are identified as audited.
The financial reporting framework that has been applied in the preparation of the financial statements is applicable law and IFRSs as adopted by the European Union.
In applying the financial reporting framework, the directors have made a number of subjective judgements, for example in respect of significant accounting estimates. In making such estimates, they have made assumptions and considered future events. Opinion on other matter prescribed by the Companies Act 2006In our opinion, the information given in the Strategic Report and the Directors’ Report for the financial year for which the financial statements are prepared is consistent with the financial statements. Other matters on which we are required to report by exception
Adequacy of accounting records and information and explanations received
Under the Companies Act 2006 we are required to report to you if, in our opinion:
X we have not received all the information and explanations we require for our audit; or
X adequate accounting records have not been kept by the parent company, or returns adequate for our audit have not been received from branches not visited by us; or
X the financial statements are not in agreement with the accounting records and returns.
We have no exceptions to report arising from this responsibility.
Directors’ remunerationUnder the Companies Act 2006 we are required to report to you if, in our opinion, certain disclosures of directors’ remuneration specified by law are not made. We have no exceptions to report arising from this responsibility.
Responsibilities for the financial statements and the audit
Our responsibilities and those of the directorsAs explained more fully in the Directors’ Responsibilities Statement, the directors are responsible for the preparation of the financial statements and for being satisfied that they give a true and fair view.
Our responsibility is to audit and express an opinion on the financial statements in accordance with applicable law and International Standards on Auditing (UK and Ireland) (“ISAs (UK & Ireland)”). Those standards require us to comply with the Auditing Practices Board’s Ethical Standards for Auditors.
This report, including the opinions, has been prepared for and only for the parent company’s members as a body in accordance with Chapter 3 of Part 16 of the Companies Act 2006 and for no other purpose. We do not, in giving these opinions, accept or assume responsibility for any other purpose or to any other person to whom this report is shown or into whose hands it may come save where expressly agreed by our prior consent in writing.
What an audit of financial statements involvesWe conducted our audit in accordance with ISAs (UK & Ireland). An audit involves obtaining evidence about the amounts and disclosures in the financial statements sufficient to give reasonable assurance that the financial statements are free from material misstatement, whether caused by fraud or error. This includes an assessment of:
X whether the accounting policies are appropriate to the parent company’s circumstances and have been consistently applied and adequately disclosed;
X the reasonableness of significant accounting estimates made by the directors; and
X the overall presentation of the financial statements. We primarily focus our work in these areas by assessing the directors’ judgements against available evidence, forming our own judgements, and evaluating the disclosures in the financial statements.
We test and examine information, using sampling and other auditing techniques, to the extent we consider necessary to provide a reasonable basis for us to draw conclusions. We obtain audit evidence through testing the effectiveness of controls, substantive procedures or a combination of both.
In addition, we read all the financial and non-financial information in the Annual Report to identify material inconsistencies with the audited financial statements and to identify any information that is apparently materially incorrect based on, or materially inconsistent with, the knowledge acquired by us in the course of performing the audit. If we become aware of any apparent material misstatements or inconsistencies we consider the implications for our report.
Other matterWe have reported separately on the group financial statements of John Wood Group PLC for the year ended 31 December 2015.
Lindsay Gardiner (Senior Statutory Auditor) for and on behalf of PricewaterhouseCoopers LLP Chartered Accountants and Statutory Auditors Aberdeen
22 February 2016

Financial statementsGovernanceStrategic report
John Wood Group PLC Annual Report and Accounts 2015 105
Company balance sheet as at 31 December 2015
Note2015
$m2014
$m2013
$m
Non-current assets
Investments 1 3,351.9 3,221.8 2,926.0
Retirement benefit scheme surplus 2 4.5 - -
Deferred tax 3 7.1 5.4 9.1
3,363.5 3,227.2 2,935.1
Current assets
Trade and other receivables 4 750.3 1,029.5 1,035.9
Income tax receivable 8.5 2.2 -
Cash and cash equivalents 5 25.3 1.7 -
784.1 1,033.4 1,035.9
Current liabilities
Borrowings 7 432.7 433.9 450.7
Trade and other payables 6 348.9 535.5 551.0
Income tax liabilities - - 4.4
781.6 969.4 1,006.1
Net current assets 2.5 64.0 29.8
Non-current liabilities
Borrowings 7 495.0 495.0 396.2
Retirement benefit scheme deficit 8 - 27.0 41.3
Other non-current liabilities 9 1,290.4 1,294.4 1,227.4
1,785.4 1,816.4 1,664.9
Net assets 1,580.6 1,474.8 1,300.0
Equity
Share capital 11 23.8 23.7 23.6
Share premium 12 63.9 56.0 56.0
Retained earnings 13 955.3 857.4 682.6
Other reserves 14 537.6 537.7 537.8
Total equity 1,580.6 1,474.8 1,300.0
The financial statements on pages 105 to 118 were approved by the board of directors on 22 February 2016, and signed on its behalf by:
Robin Watson, Director David Kemp, Director

John Wood Group PLC Annual Report and Accounts 2015106
Share capital
$m
Share premium
$m
Profit and loss account
$m
Other reserves
$m
Total equity
$m
At 1 January 2013 23.5 54.3 584.4 537.6 1,200.0
Profit for the year - - 176.0 - 176.0
Dividends paid - - (67.4) - (67.4)
Credit relating to share based charges - - 22.4 - 22.4
Fair value gains - - - 0.2 0.2
Re-measurement gain on retirement benefit scheme - - 16.5 - 16.5
Movement in deferred tax relating to retirement benefit scheme - - (3.8) - (3.8)
Shares purchased by employee share trusts - - (47.8) - (47.8)
Shares disposed of by employee share trusts - - 7.9 - 7.9
Shares allocated to employee share trusts 0.1 1.7 (1.8) - -
Exchange movement in relation to employee share trusts - - (4.5) - (4.5)
Other exchange movements - - 0.7 - 0.7
At 31 December 2013 23.6 56.0 682.6 537.8 1,300.0
Profit for the year - - 239.0 - 239.0
Dividends paid - - (87.2) - (87.2)
Credit relating to share based charges - - 17.4 - 17.4
Fair value losses - - - (0.1) (0.1)
Re-measurement loss on retirement benefit scheme - - (16.5) - (16.5)
Movement in deferred tax relating to retirement benefit scheme - - 3.3 - 3.3
Shares disposed of by employee share trusts - - 11.2 - 11.2
Shares allocated to employee share trusts 0.1 - (0.1) - -
Exchange movements in relation to employee share trusts - - 8.7 - 8.7
Other exchange movements - - (1.0) - (1.0)
At 31 December 2014 23.7 56.0 857.4 537.7 1,474.8
Profit for the year - - 166.4 - 166.4
Dividends paid - - (104.9) - (104.9)
Credit relating to share based charges - - 12.3 - 12.3
Fair value losses - - - (0.1) (0.1)
Re-measurement gain on retirement benefit scheme - - 24.9 - 24.9
Movement in deferred tax relating to retirement benefit scheme - - (4.9) - (4.9)
Shares disposed of by employee share trusts - - 5.6 - 5.6
Shares allocated to employee share trusts 0.1 7.9 (8.0) - -
Exchange movements in relation to employee share trusts - - 7.7 - 7.7
Other exchange movements - - (1.2) - (1.2)
At 31 December 2015 23.8 63.9 955.3 537.6 1,580.6
Statement of changes in equity for the year ended 31 December 2015
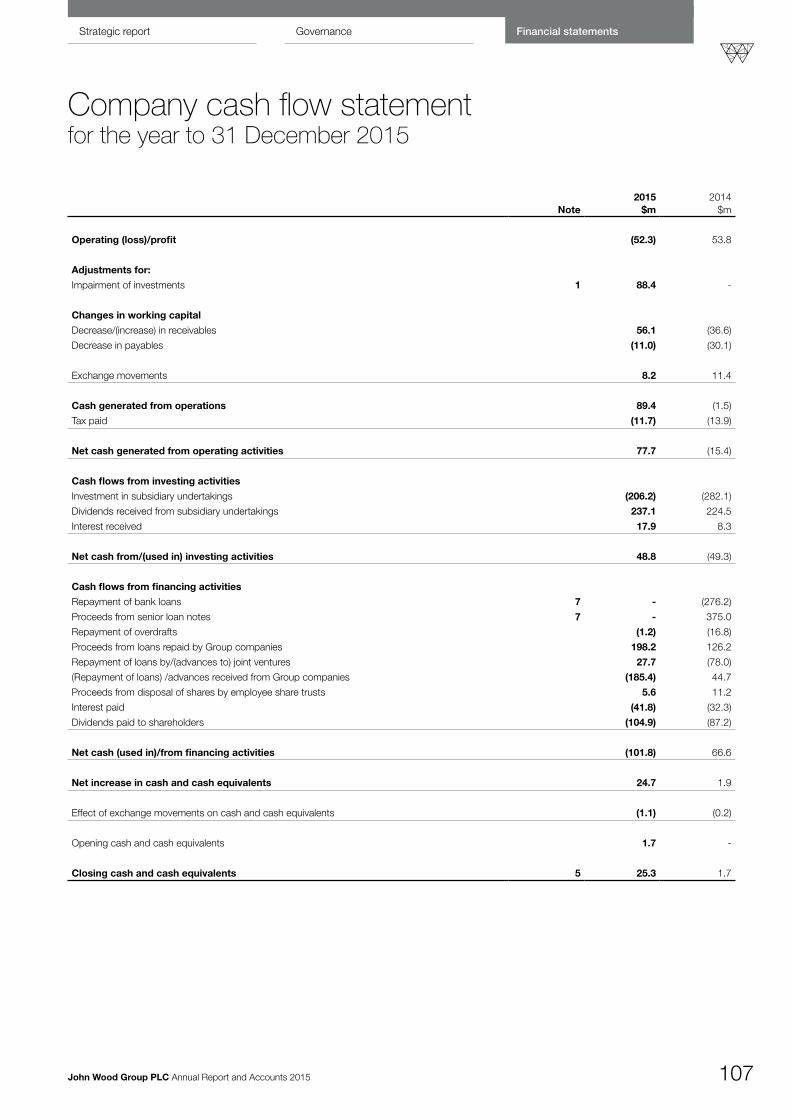
Financial statementsGovernanceStrategic report
John Wood Group PLC Annual Report and Accounts 2015 107
Note2015
$m2014
$m
Operating (loss)/profit (52.3) 53.8
Adjustments for:
Impairment of investments 1 88.4 -
Changes in working capital
Decrease/(increase) in receivables 56.1 (36.6)
Decrease in payables (11.0) (30.1)
Exchange movements 8.2 11.4
Cash generated from operations 89.4 (1.5)
Tax paid (11.7) (13.9)
Net cash generated from operating activities 77.7 (15.4)
Cash flows from investing activities
Investment in subsidiary undertakings (206.2) (282.1)
Dividends received from subsidiary undertakings 237.1 224.5
Interest received 17.9 8.3
Net cash from/(used in) investing activities 48.8 (49.3)
Cash flows from financing activities
Repayment of bank loans 7 - (276.2)
Proceeds from senior loan notes 7 - 375.0
Repayment of overdrafts (1.2) (16.8)
Proceeds from loans repaid by Group companies 198.2 126.2
Repayment of loans by/(advances to) joint ventures 27.7 (78.0)
(Repayment of loans) /advances received from Group companies (185.4) 44.7
Proceeds from disposal of shares by employee share trusts 5.6 11.2
Interest paid (41.8) (32.3)
Dividends paid to shareholders (104.9) (87.2)
Net cash (used in)/from financing activities (101.8) 66.6
Net increase in cash and cash equivalents 24.7 1.9
Effect of exchange movements on cash and cash equivalents (1.1) (0.2)
Opening cash and cash equivalents 1.7 -
Closing cash and cash equivalents 5 25.3 1.7
Company cash flow statement for the year to 31 December 2015

John Wood Group PLC Annual Report and Accounts 2015108
Accounting Policies
Significant accounting policies The principal accounting policies, which have been applied in the preparation of the Company financial statements, are set out below. These policies have been consistently applied to all the years presented.
Basis of preparationThese financial statements have been prepared in accordance with IFRS and IFRIC interpretations adopted by the European Union (‘EU’) and with those parts of the Companies Act 2006 applicable to companies reporting under IFRS. The Company financial statements have been prepared on a going concern basis under the historical cost convention as modified by the revaluation of fixed assets and liabilities at fair value through the income statement.
These are the first financial statements of the company prepared in accordance with IFRSs. The accounting policies set out below have been applied in preparing the financial statements for the year ended 31 December 2015, the comparative information presented in the financial statements for the year ended 31 December 2014 and in preparation of an opening IFRS balance sheet at 1 January 2014 (the Company’s date of transition). In preparing its opening IFRS balance sheet, the Company has adjusted the amounts reported previously in financial statements prepared under UK GAAP. An explanation of how the transition from UK GAAP to IFRSs has affected the Company’s financial position, financial performance and cash flows is set out in note 16.
The financial statements are presented in US dollars and all values are rounded to the nearest $0.1m except where otherwise indicated.
The financial position of the Company is shown in the balance sheet on page 105. Note 10 includes the Company’s objectives, policies and processes for managing its financial risks and details of its financial instruments and hedging activities, and its exposures to interest rate risk and liquidity risk. The Company adopts the going concern basis of accounting in preparing these financial statements.
Reporting currencyThe Company’s transactions are primarily US dollar denominated and the functional currency is the US dollar.
The following sterling to US dollar exchange rates have been used in the preparation of these financial statements:-
Average rate Closing rate
£1 = $ £1 = $
Year ended 31 December 2013 1.5673 1.6563
Year ended 31 December 2014 1.6469 1.5593
Year ended 31 December 2015 1.5289 1.4739
Investments in subsidiariesInvestments are measured initially at cost, including transaction costs, less any provision for impairment.
Impairment of assetsAt each balance sheet date, the Company reviews the carrying amounts of its investments to assess whether there is an indication that those assets may be impaired. If any such indication exists, the Company makes an estimate of the asset’s recoverable amount. An asset’s recoverable amount is the higher of an asset’s fair value less costs to sell and its value in use.
Notes to the Company financial statements for the year to 31 December 2015
If the recoverable amount of an asset is estimated to be less than its carrying amount, the carrying amount of the asset is reduced to its recoverable amount. An impairment loss is recognised immediately in the income statement.
Where an impairment loss subsequently reverses, the carrying amount of the asset is increased to the revised estimate of its recoverable amount, to the extent that the increased carrying amount does not exceed the carrying amount that would have been determined had no impairment loss been recognised for the asset in prior periods. A reversal of an impairment loss is recognised immediately in the income statement.
Foreign currenciesTransactions in foreign currencies are translated at the exchange rates ruling at the date of the transaction. Monetary assets and liabilities denominated in foreign currencies are retranslated at the exchange rates ruling at the balance sheet dates or at a contractual rate if applicable and any exchange differences are taken to the income statement.
The directors consider it appropriate to record sterling denominated equity share capital in the financial statements of John Wood Group PLC at the exchange rate ruling on the date it was raised.
Financial instrumentsThe accounting policy for financial instruments is consistent with the Group accounting policy as presented in the notes to the Group financial statements. The Company’s financial risk management policy is consistent with the Group’s financial risk management policy outlined in note 17 to the Group financial statements.
Employee share trustsThe Company is deemed to have control of the assets, liabilities, income and costs of its employee share trusts. They have therefore been included in the financial statements of the Company. The cost of shares held by the employee share trusts is deducted from equity.
Share based chargesThe Company has a number of share schemes as detailed in the Group accounting policies and note 20 to the Group financial statements. Details relating to the calculation of share based charges are provided in note 20 to the Group financial statements. In respect of the Company, the charge is shown as an increase in the Company’s investments, as the employees to which the charge relates are employed by subsidiary companies.
DividendsDividends to the Group’s shareholders are recognised as a liability in the period in which the dividends are approved by shareholders. Dividend income is credited to the income statement when the dividend has been approved by the board of directors of the subsidiary company making the payment.
Trade receivablesTrade receivables are recognised initially at fair value less an allowance for any amounts estimated to be uncollectable. An estimate for doubtful debts is made when there is objective evidence that the collection of the debt is no longer probable.
Interest-bearing loans and borrowingsAll interest-bearing loans and borrowings are initially recognised at the fair value of the consideration received less directly attributable transaction costs. Borrowing costs are expensed through the income statement.

Financial statementsGovernanceStrategic report
John Wood Group PLC Annual Report and Accounts 2015 109
Notes to the Company financial statements continued
Accounting Policies (continued)
De-recognition of financial assets and liabilitiesA financial asset is derecognised where the rights to receive cash flows from the asset have expired. A financial liability is derecognised when the obligation under the liability is discharged or cancelled or expires.
TaxationThe tax expense in the income statement represents the sum of taxes currently payable and deferred taxes. The tax currently payable is based on taxable profit for the year and the Company’s liability for current tax is calculated using tax rates that have been enacted or substantively enacted by the balance sheet date. Taxable profit differs from profit as reported in the income statement because it excludes items of income or expense that are taxable or deductible in other periods and it further excludes items that are never taxable or deductible.
Deferred tax is provided using the liability method on temporary differences at the balance sheet date between the tax bases of assets and liabilities and their carrying amounts for financial reporting purposes. Deferred tax liabilities are recognised for all taxable temporary differences.
Deferred tax assets are recognised only to the extent that it is probable that a taxable profit will be available against which the deductible temporary differences, carried forward tax credits or tax losses can be utilised. Deferred tax assets and liabilities are measured on an undiscounted basis at the tax rates that are expected to apply when the asset is realised or the liability is settled, based on tax rates and tax laws enacted or substantively enacted at the balance sheet date. Deferred tax assets and liabilities are offset, only if a legally enforceable right exists to set off current tax assets against current tax liabilities, the deferred taxes relate to the same taxation authority and that authority permits the Company to make a single net payment.
Tax is charged or credited directly to equity if it relates to items that are credited or charged to equity. Otherwise, tax is recognised in the income statement.
Retirement benefit scheme surplus/deficitThe Company is the sponsoring entity for the Group’s defined benefit pension scheme. The surplus or deficit recognised in respect of the defined benefit scheme represents the difference between the present value of the defined benefit obligations and the fair value of the scheme assets. The assets of this scheme are held in separate trustee administered funds. The scheme was closed to future accrual on 30 June 2014. See note 29 to the Group financial statements for full details.
Judgments and key sources of estimation or uncertaintyThe preparation of financial statements requires management to make judgments, estimates and assumptions that affect the amounts reported for assets and liabilities as at the balance sheet date and the amounts reported for revenues and expenses during the year. However, the nature of estimation means that actual outcomes could differ from those estimates.
Estimates and assumptionsThe key assumptions concerning the future and other key sources of estimation uncertainty at the balance sheet date, that have a significant risk of causing a material adjustment to the carrying amounts of assets and liabilities within the next financial year are discussed below.
Impairment of investmentsThe Company assesses whether there are any indicators of impairment of investments at each reporting date. Investments are tested for impairment when there are indicators that the carrying amounts may not be recoverable. Details of impairments recorded during the year and the carrying value of investments are contained in note 1.
Retirement benefit scheme surplus/deficitThe Company is the sponsoring entity for the Group’s defined benefit pension scheme in the UK which was closed to future accrual on 30 June 2014. The value of the retirement benefit scheme surplus/deficit is determined on an actuarial basis using a number of assumptions. Changes in these assumptions will impact the carrying value of the surplus/deficit. The Company determines the appropriate discount rate to be used in the actuarial valuation at the end of each financial year following consultation with the retirement benefit scheme actuary. In determining the rate used, consideration is given to the interest rates of high quality corporate bonds in the currency in which the benefits will be paid and that have terms to maturity similar to those of the related retirement benefit obligation. See note 29 of the Group financial statements for further details.
Disclosure of impact of new and future accounting standards
(a) Amended standards and interpretationsIAS 19 ‘Employee benefits’ was amended with effect from 1 January 2015. The amendment does not have a material impact on the Company’s financial statements.
(b) Standards, amendments and interpretations to existing standards that are not yet effective and have not been early adopted by the CompanyThe following standards have been published and are mandatory for the Company’s accounting periods beginning on or after 1 January 2018, but the Company has not early adopted them:
X IFRS 15 ‘Revenue from contracts with customers’ is effective for accounting periods beginning on or after 1 January 2018. The Company does not expect the adoption of this standard to have a material impact on the financial statements.
X IFRS 9 ‘Financial instruments’ is effective for accounting periods on or after 1 January 2018. The Company does not expect the adoption of this standard to have a material impact on the financial statements.
X IFRS 16 ‘Leases’ is effective for accounting periods beginning on or after 1 January 2019. The Company does not expect the adoption of this standard to have a material impact on the financial statements.
Amendments have also been made to the following standards effective 1 January 2016. The Company does not expect the amendments to have a material impact on the financial statements.
X IFRS 11 ‘Joint arrangements’
X IAS 16 ‘Property, plant and equipment’
X IAS 38 ‘Intangible assets’
X IAS 27 ‘Separate financial statements’
X IFRS 10 ‘Consolidated financial statements’
X IAS 1 ‘Presentation of financial statements’
All other amendments not yet effective and not included above are not material or applicable to the Company.

John Wood Group PLC Annual Report and Accounts 2015110
1 Investments
2015 2014 2013$m $m $m
CostAt 1 January 3,287.9 2,992.1 1,825.6
Exchange movements - (3.6) 1.1
Additions 218.5 299.4 1,172.2
Disposals - - (6.8)
At 31 December 3,506.4 3,287.9 2,992.1
Amounts provided
At 1 January 66.1 66.1 66.8
Provided during year 88.4 - -
Disposals - - (0.7)
154.5 66.1 66.1
Net book value
At 31 December 3,351.9 3,221.8 2,926.0
An impairment charge of $88.4m was recorded in 2015. This largely related to the Company’s investment in Wood Group Power Investments Limited which holds an investment in EthosEnergy Limited. The impairment was recorded following the Group’s decision to impair its investment in EthosEnergy and reflects the underlying carrying value of the business. See note 10 of the Group financial statements for additional information.
The directors believe that the carrying value of the investments is supported by their underlying net assets.
Notes to the Company financial statements continued

Financial statementsGovernanceStrategic report
John Wood Group PLC Annual Report and Accounts 2015 111
Notes to the Company financial statements continued
1 Investments (continued)The Company’s direct subsidiaries at 31 December 2015 are listed below. Ownership interests reflect holdings of ordinary shares. Details of other related undertakings are provided in note 34 to the Group financial statements.
Name of subsidiary Country of incorporation or registration Ownership interest %
Alta Blue Limited Jersey 100%Gas Turbine Fuel Systems Limited UK 100%Greenwell Services (UK) Limited UK 100%GTS Power Solutions Limited Jersey 100%John Wood Group Holdings BV The Netherlands 100%JPK Technology Limited UK 100%JWG Ireland USD Ireland 100%JWG Ireland USD 2 Ireland 100%JWG Ireland USD 3 Ireland 100%JWG Trustees Limited UK 100%JWGUSA Holdings Inc USA 100%JWGUSA Holdings Limited UK 100%JWH Management Services Limited UK 100%Kelwat Investments Limited UK 100%WGD003 Limited UK 100%WGD004 Limited UK 100%WGD006 Limited UK 100%WGD007 Limited UK 100%WGD008 Limited UK 100%WGD009 Limited UK 100%WGD010 Limited UK 100%WGD013 Limited UK 100%WGD014 Limited UK 100%WGD015 Limited UK 100%WGD017 Limited UK 100%WGD018 Limited UK 100%WGD020 Limited UK 100%WGD021 Limited UK 100%WGD022 Limited UK 100%WGD023 Limited UK 100%WGD027 Limited UK 100%W L S Holdings Limited UK 100%Wood Group Engineering Contractors Limited UK 100%Wood Group Engineering Services (Middle East) Limited Jersey 100%Wood Group Environmental Services Limited UK 100%Wood Group Gas Turbine Services Holdings Limited UK 100%Wood Group Gas Turbine Services Limited UK 100%Wood Group Holdings (International) Limited UK 100%Wood Group International Limited UK 100%Wood Group International NV Curacao 100%Wood Group Investments Limited UK 100%Wood Group Limited UK 100%Wood Group Management Services Limited UK 100%Wood Group Oilfield Rentals Limited UK 100%Wood Group Operations Holdings Limited UK 100%Wood Group Overseas NV Curacao 100%Wood Group Power Investments Limited UK 100%Wood Group Production Facilities Limited Jersey 100%Wood Group Properties Limited UK 100%Wood Group Well Support Inc USA 100%

John Wood Group PLC Annual Report and Accounts 2015112
Notes to the Company financial statements continued
2 Retirement benefit scheme surplus
2015 $m
2014 $m
2013 $m
At 31 December 4.5 - -
Full details of the retirement benefit scheme surplus is provided in note 29 to the Group financial statements.
3 Deferred taxThe deferred tax balance comprises -:
2015 $m
2014 $m
2013 $m
Deferred tax relating to retirement benefit scheme (surplus)/deficit (0.9) 5.4 9.1
Short term timing differences 8.0 - -
7.1 5.4 9.1
The movement in the deferred tax asset is shown below -:
2015 $m
2014 $m
2013 $m
At 1 January 5.4 9.1 12.7
Movement relating to retirement benefit scheme (4.9) 3.3 (3.8)
Credit/(charge) to income statement 6.6 (7.0) 0.2
At 31 December 7.1 5.4 9.1
4 Trade and other receivables2015
$m2014
$m2013
$m
Loans to Group companies 723.8 949.7 997.9
Trade receivables – Group companies 21.2 77.1 32.2
Other receivables 4.0 2.2 -
Prepayments and accrued income 1.3 0.5 5.8
750.3 1,029.5 1,035.9
Interest on loans to Group companies is charged at market rates.

Financial statementsGovernanceStrategic report
John Wood Group PLC Annual Report and Accounts 2015 113
Notes to the Company financial statements continued
4 Trade and other receivables (continued)
At 31 December 2015, $51.1m (2014: $63.1m) of the amounts owed by Group companies were impaired. These amounts relate to balances due from Group companies from whom there is no expectation of payment.
The ageing of these amounts is as follows:
2015 $m
2014 $m
2013 $m
Over 3 months 51.1 63.1 63.7
The movement on the provision for impairment is as follows:
2015 $m
2014 $m
2013 $m
At 1 January 63.1 63.7 11.3
Exchange movements (1.0) (0.6) 0.1
(Released)/charged during the year (11.0) - 52.3
At 31 December 51.1 63.1 63.7
$11.0m was recovered during the year in relation to amounts previously impaired. The creation or release of the provision for impairment is charged/(credited) to the income statement. The Company had no outstanding balances that were past due but not impaired at either 31 December 2015 or 31 December 2014. The other classes within receivables do not contain impaired assets.
5 Cash and cash equivalents
2015 $m
2014 $m
2013 $m
Cash and cash equivalents 25.3 1.7 -
6 Trade and other payables
2015 $m
2014 $m
2013 $m
Loans from Group companies 341.5 522.9 545.2
Other creditors 1.9 7.0 4.8
Accruals and deferred income 5.5 5.6 1.0
348.9 535.5 551.0

John Wood Group PLC Annual Report and Accounts 2015114
7 Borrowings2015
$m2014
$m2013
$m
Borrowings repayable on demand
Bank overdrafts 432.7 433.9 450.7
Non-current borrowings
Bank loans 120.0 120.0 396.2
Senior loan notes 375.0 375.0 -
495.0 495.0 396.2
The bank overdrafts relate to the Group’s cash pooling arrangements and interest is payable at market rates.
During 2014, the Group issued $375m of unsecured senior notes in the US private placement market. The notes were issued at a mix of 7, 10 and 12 year maturities at an average fixed rate of 3.74%.
Bank loans are unsecured, denominated in a number of currencies and bear interest based on LIBOR or foreign equivalents appropriate to the country in which the borrowing is incurred. The effective interest rates on the Company’s bank borrowings at the balance sheet date were as follows:
2015 %
2014 %
2013 %
US Dollar 1.87 1.87 1.14
Sterling - - 1.47
Euro - - 1.17
Canadian dollar - - 2.21
The carrying amounts of the Company’s long-term borrowings are denominated in the following currencies:
2015 $m
2014 $m
2013 $m
US Dollar 495.0 495.0 222.0
Sterling - - 63.9
Euro - - 61.3
Canadian dollar - - 49.0
495.0 495.0 396.2
8 Retirement benefit scheme deficit2015
$m2014
$m2013
$m
At 31 December - 27.0 41.3
Full details of the retirement benefit scheme deficit are provided in note 29 to the Group financial statements.
Notes to the Company financial statements continued

Financial statementsGovernanceStrategic report
John Wood Group PLC Annual Report and Accounts 2015 115
Notes to the Company financial statements continued
9 Other non-current liabilities
2015 $m
2014 $m
2013 $m
Amounts due to Group undertakings 1,290.4 1,294.4 1,227.4
The amounts due to Group undertakings are inter-company loans. Interest on these loans is charged at market rates.
10 Financial instruments
Financial risk factorsThe Company’s activities give rise to a variety of financial risks: market risk (including foreign exchange risk and cash flow interest rate risk), credit risk and liquidity risk. The Company’s overall risk management strategy is to hedge exposures wherever practicable in order to minimise any potential adverse impact on the Company’s financial performance.
Risk management is carried out by the Group Treasury department in line with the Group’s Treasury policies which are approved by the Board of Directors. Group Treasury identify, evaluate and where appropriate hedge financial risks. The Group Treasury policies cover specific areas, such as foreign exchange risk, interest rate risk, credit risk, use of derivative financial instruments and investment of excess cash.
(a) Market risk
(i) Foreign exchange riskThe Company is exposed to foreign exchange risk arising from various currencies. Where possible the Company’s policy is to eliminate all significant currency exposures at the time of the transaction by using financial instruments such as forward currency contracts. Changes in the forward contract fair values are recorded in the income statement.
(ii) Interest rate riskThe Company finances its operations through a mixture of retained profits and debt. The company borrows in the desired currencies at floating rates of interest and then uses interest rate swaps as cash flow hedges to generate the desired interest profile and to manage the Company’s exposure to interest rate fluctuations. At 31 December 2015, 100% (2014: 100%) of the Company’s long-term borrowings were at fixed rates after taking account of interest rate swaps.
The Company is also exposed to interest rate risk on cash held on deposit. The Company’s policy is to maximise the return on cash deposits whilst ensuring that cash is deposited with a financial institution with a credit rating of ‘A’ or better, where possible.
(iii) Price riskThe Company is not exposed to any significant price risk in relation to its financial instruments.
(b) Credit riskThe Company’s credit risk primarily relates to its inter-company loans and inter-company receivables. Management believe that no further risk provision is required in excess of the current provision for impairment.
The Company also has credit risk in relation to cash balances or cash held on deposit. The Company’s policy is to deposit cash at institutions with an ‘A’ rating or better where possible. 100% of the cash held on deposit at 31 December 2015 was held with such institutions.
(c) Liquidity riskWith regard to liquidity, the Group’s policy is to ensure continuity of funding. At 31 December 2015, 53% 2014: 53%) of the Company’s borrowing facilities (including bank overdrafts) were due to mature in more than one year. Based on the current outlook the Company has sufficient funding in place to meet its future obligations.
(d) Capital riskThe Company’s capital risk is determined by that of the Group. See note 17 to the Group financial statements.

John Wood Group PLC Annual Report and Accounts 2015116
Notes to the Company financial statements continued
10 Financial instruments (continued)
Maturity of financial liabilitiesThe table below analyses the Company’s financial liabilities into relevant maturity groupings based on the remaining period at the balance sheet to the contractual maturity date. The amounts disclosed in the table are the contractual undiscounted cash flows.
At 31 December 2015
Less than 1 year Between 1 and 2 years Between 2 and 5 years Over 5 years
$m $m $m $m
Bank loans and senior loan notes 14.0 14.0 162.1 429.7Bank overdrafts 432.7 - - -Trade and other payables 348.9 - - -Other non-current liabilities - - 1,290.4 -
At 31 December 2014
Bank loans and senior loan notes 14.0 14.0 162.1 447.5Bank overdrafts 433.9 - - -Trade and other payables 535.5 - - -Other non-current liabilities - - 1,294.4 -
At 31 December 2013
Bank loans - - 396.2 -Bank overdrafts 450.7 - - -Trade and other payables 551.0 - - -Other non-current liabilities - - 1,227.4 -
11 Share capital2015
$m2014
$m 2013
$m
Issued and fully paid
378,875,384 ordinary shares of 42⁄7p each (2014: 376,975,384 shares of 42⁄7 p each) 23.8 23.7 23.6
The additional information required in relation to share capital is given in note 21 to the Group financial statements.
12 Share premium2015
$m 2014
$m 2013
$m
At 1 January 56.0 56.0 54.3
Allocation of new shares to employee share trusts 7.9 - 1.7
At 31 December 63.9 56.0 56.0
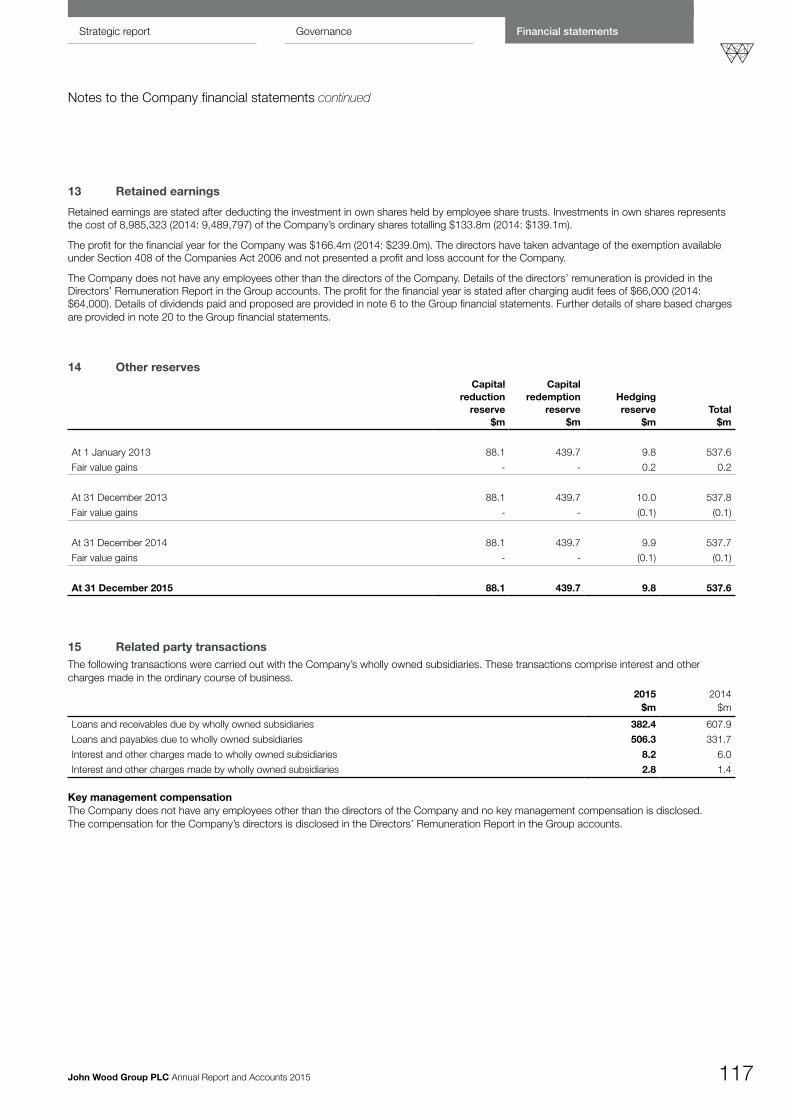
Financial statementsGovernanceStrategic report
John Wood Group PLC Annual Report and Accounts 2015 117
Notes to the Company financial statements continued
13 Retained earnings
Retained earnings are stated after deducting the investment in own shares held by employee share trusts. Investments in own shares represents the cost of 8,985,323 (2014: 9,489,797) of the Company’s ordinary shares totalling $133.8m (2014: $139.1m).
The profit for the financial year for the Company was $166.4m (2014: $239.0m). The directors have taken advantage of the exemption available under Section 408 of the Companies Act 2006 and not presented a profit and loss account for the Company.
The Company does not have any employees other than the directors of the Company. Details of the directors’ remuneration is provided in the Directors’ Remuneration Report in the Group accounts. The profit for the financial year is stated after charging audit fees of $66,000 (2014: $64,000). Details of dividends paid and proposed are provided in note 6 to the Group financial statements. Further details of share based charges are provided in note 20 to the Group financial statements.
14 Other reservesCapital
reduction reserve
$m
Capital redemption
reserve $m
Hedging reserve
$mTotal
$m
At 1 January 2013 88.1 439.7 9.8 537.6
Fair value gains - - 0.2 0.2
At 31 December 2013 88.1 439.7 10.0 537.8
Fair value gains - - (0.1) (0.1)
At 31 December 2014 88.1 439.7 9.9 537.7
Fair value gains - - (0.1) (0.1)
At 31 December 2015 88.1 439.7 9.8 537.6
15 Related party transactionsThe following transactions were carried out with the Company’s wholly owned subsidiaries. These transactions comprise interest and other charges made in the ordinary course of business.
2015 2014$m $m
Loans and receivables due by wholly owned subsidiaries 382.4 607.9
Loans and payables due to wholly owned subsidiaries 506.3 331.7
Interest and other charges made to wholly owned subsidiaries 8.2 6.0
Interest and other charges made by wholly owned subsidiaries 2.8 1.4
Key management compensation The Company does not have any employees other than the directors of the Company and no key management compensation is disclosed. The compensation for the Company’s directors is disclosed in the Directors’ Remuneration Report in the Group accounts.

John Wood Group PLC Annual Report and Accounts 2015118
Notes to the Company financial statements continued
16 Transition to IFRSOn transition to IFRS, the Group’s retirement benefit scheme has been recognised in the accounts of John Wood Group PLC, the sponsoring entity for the scheme.
A reconciliation of equity showing the adjustments on transition to IFRS is shown below –
1 January 2014
$m
31 December 2014
$m
Total equity as previously reported 1,332.2 1,518.8
Recognition of retirement benefit scheme deficit (41.3) (27.0)
Deferred tax relating to retirement benefit scheme 9.1 5.4
Amounts due to Group undertakings in respect of contributions to retirement benefit scheme - (22.4)
Equity per balance sheet 1,300.0 1,474.8 The transitional adjustments relate to the recognition of the Group’s defined benefit pension scheme deficit. There is no contractual arrangement to recharge pension costs so the scheme surplus/deficit is recognised in the Company as it is the sponsoring entity of the scheme. The amounts due to Group undertakings above reflects contributions made to the scheme by other Group companies.
A reconciliation of total comprehensive income for the year ended 31 December 2014 is shown below -
2014 $m
Total comprehensive income under UK GAAP 236.6
Pension adjustment recorded in income statement 0.8
Re-measurement loss on retirement benefit scheme (16.5)
Movement in deferred tax relating to retirement benefit scheme 3.3
Total comprehensive income under IFRS 224.2
There is no impact to the Company’s cash flows on transition to IFRS.
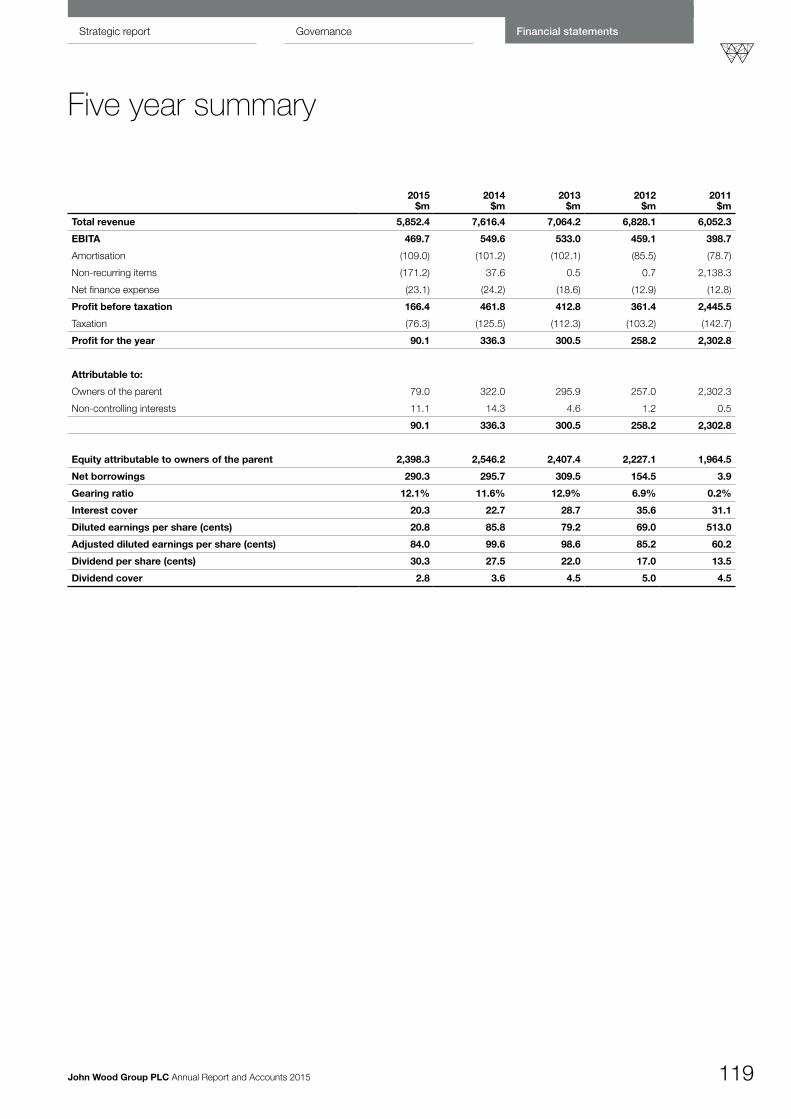
Financial statementsGovernanceStrategic report
John Wood Group PLC Annual Report and Accounts 2015 119
Five year summary
2015 $m
2014 $m
2013 $m
2012 $m
2011 $m
Total revenue 5,852.4 7,616.4 7,064.2 6,828.1 6,052.3
EBITA 469.7 549.6 533.0 459.1 398.7
Amortisation (109.0) (101.2) (102.1) (85.5) (78.7)
Non-recurring items (171.2) 37.6 0.5 0.7 2,138.3
Net finance expense (23.1) (24.2) (18.6) (12.9) (12.8)
Profit before taxation 166.4 461.8 412.8 361.4 2,445.5
Taxation (76.3) (125.5) (112.3) (103.2) (142.7)
Profit for the year 90.1 336.3 300.5 258.2 2,302.8
Attributable to:
Owners of the parent 79.0 322.0 295.9 257.0 2,302.3
Non-controlling interests 11.1 14.3 4.6 1.2 0.5
90.1 336.3 300.5 258.2 2,302.8
Equity attributable to owners of the parent 2,398.3 2,546.2 2,407.4 2,227.1 1,964.5
Net borrowings 290.3 295.7 309.5 154.5 3.9
Gearing ratio 12.1% 11.6% 12.9% 6.9% 0.2%
Interest cover 20.3 22.7 28.7 35.6 31.1
Diluted earnings per share (cents) 20.8 85.8 79.2 69.0 513.0
Adjusted diluted earnings per share (cents) 84.0 99.6 98.6 85.2 60.2
Dividend per share (cents) 30.3 27.5 22.0 17.0 13.5
Dividend cover 2.8 3.6 4.5 5.0 4.5

John Wood Group PLC Annual Report and Accounts 2015120
Payment of dividendsThe Company declares its dividends in US dollars. As a result of the shareholders being mainly UK based, dividends will be paid in sterling, but if you would like to receive your dividend in US dollars please contact the Registrars at the address below. All shareholders will receive dividends in sterling unless requested. If you are a UK based shareholder, the Company encourages you to have your dividends paid through the BACS (Banker’s Automated Clearing Services) system. The benefit of the BACS payment method is that the Registrars post the tax vouchers directly to the shareholders, whilst the dividend is credited on the payment date to the shareholder’s Bank or Building Society account. UK shareholders who have not yet arranged for their dividends to be paid direct to their Bank or Building Society account and wish to benefit from this service should contact the Registrars at the address below. Sterling dividends will be translated at the closing mid-point spot rate on 8 April 2016 as published in the Financial Times on 9 April 2016.
Officers and advisers
Secretary and Registered Office Registrars W G Setter Equiniti LimitedJohn Wood Group PLC Aspect House15 Justice Mill Lane Spencer RoadAberdeen LancingAB11 6EQ West Sussex BN99 6DA
Tel: 01224 851000 Tel: 0871 384 2649
Stockbrokers Independent AuditorsJPMorgan Cazenove Limited PricewaterhouseCoopers LLPCredit Suisse Chartered Accountants and Statutory Auditors 32 Albyn PlaceCompany Solicitors AberdeenSlaughter and May AB10 IYL
Financial calendar
Results announced 23 February 2016
Ex-dividend date 7 April 2016
Dividend record date 8 April 2016
Annual General Meeting 11 May 2016
Dividend payment date 17 May 2016
The Group’s Investor Relations website can be accessed at www.woodgroup.com
Information for shareholders

Printed by Pureprint Group who are certified to the ISO 14001 Environmental Management standard and FSC® Chain of Custody standard. This report is printed on stocks which are manufactured under strict environmental management systems. Each stock is certified in accordance with the FSC® (Forest Stewardship Council).
Designed and produced by Wood Group Creative Services team.

John Wood Group PLC
15 Justice Mill Lane Aberdeen AB11 6EQ UK
Tel +44 1224 851000
Visit our website at: www.woodgroup.com