Embed Size (px)
Citation preview

John Wells, SWRR Co-Chair July 10, 2012

A national collaboration of federal, state, local, corporate, non-profit
and academic interests
A committee of the USGS Advisory Committee on Water
Information

Our Mission To promote sustainability of the nation’s resources
through … Evaluation of information Development & use of indicators Targeting of research Engagement of people & partners

Outreach 600 participants from federal, state and local
governments; corporations; nonprofits and academia Meetings in California; Colorado; Maryland;
Michigan; Minnesota; Virginia; Washington, D.C. Web site http://acwi.gov/swrr/index.html 2005 Preliminary Report
http://acwi.gov/swrr/Rpt_Pubs/prelim_rpt/index.html 2010 SWRR Report
http://acwi.gov/swrr/Rpt_Pubs/SWRRReportMarch2010.pdf

Essential Relationships of Sustainability with Fisheries
Fisheries laws,
institutions, customs and communities
Aquatic & related
ecosystems
Social System
Biophysical Environment
Economic System
Markets, capital and labor

Capital and System Capacities Capital is the capacity to produce
value over time Environmental, social and economic
systems produce value through flows of services, experiences, or goods that meet human and ecosystem needs over time
We achieve sustainability by maintaining capital to meet needs

Ecosystem Processes & Societal Drivers
Natural Processes: Disturbance &
Response Energy Cycling Hydrologic Cycle &
Flow Regime Materials Cycling
Social & Economic Drivers:
Economic Development
Energy Production and Use
Land Use Population Growth Transportation
Ecosystems Society
Ecosystem
goods & services
Human alterations & discharges
time
time

Information Pyramid Fewer Pieces Of Information
More Pieces Of Information
Stories
Measurements
Criteria
Indicators

• Water availability • Water quality • Human uses and health • Environmental health • Infrastructure and institutions

California Water Plan Blueprint for Integrated Water Management & Sustainability
24

California Water
25
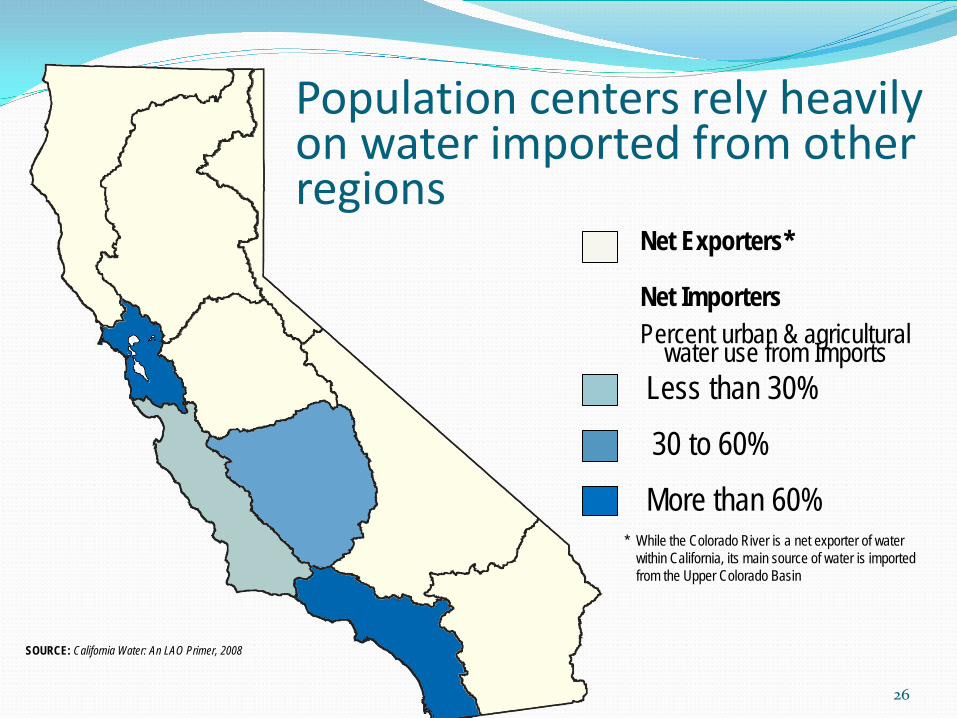
Population centers rely heavily on water imported from other regions
26
SOURCE: California Water: An LAO Primer, 2008
Net Exporters* Net Importers Percent urban & agricultural water use from Imports
Less than 30% 30 to 60%
More than 60% * While the Colorado River is a net exporter of water
within California, its main source of water is imported from the Upper Colorado Basin
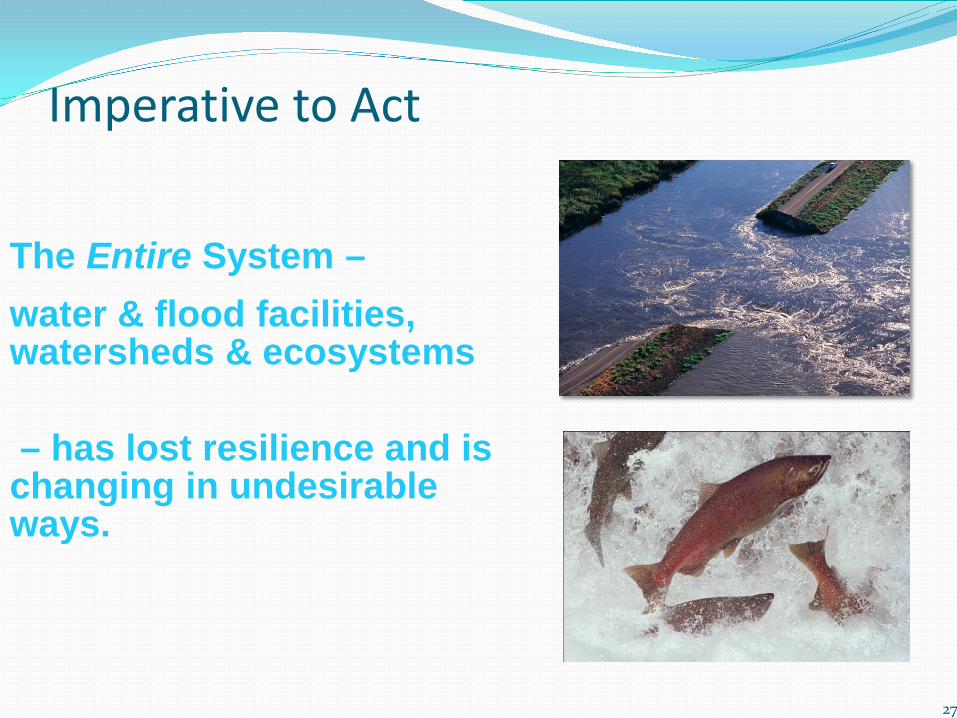
Imperative to Act
27
The Entire System – water & flood facilities, watersheds & ecosystems – has lost resilience and is changing in undesirable ways.

Imperative to Act to Keep Pace w/ Changes Population growth & movement Shift to permanent crops Increasing flood risk Declining Delta & watersheds Impaired water bodies Climate Change profoundly
impacting water systems Aging water & flood systems
challenged by legal remedies & regulatory protections
Growing economic & societal consequences of declining water reliability and degraded quality of surface & groundwater supplies
28

Sustainability Objective
Related CWP Objective and RMS
Example Indicators Relevance to Sustainability Objective
1. Improve water use efficiency, increase water recycling, and increase water conservation in order to improve water supply reliability, reduce energy demand, and restore and maintain aquatic ecosystems and processes.
CWP Objective 2, 9; RMS Reduce demand
Energy required per unit of clean drinking water
Reduce energy demand for providing water
Average water use per household,/capita, 20% reduction by 2020
Increase water conservation
Sufficient flows and timing of flows for maintaining historically-present native aquatic fauna
Restore and maintain native ecosystems
29

Sustainability Objective
Related CWP Objective and RMS
Example Indicators Relevance to Sustainability Objective
4. Protect and restore surface water and groundwater quality and the natural systems that maintain these services in order to safeguard human and environmental health and secure California water supplies.
CWP Objective 4; RMS on water quality; chapter 4 discussion of water quality sustainability indicators
Ratio of observed to expected native aquatic species
Protect and restore water quality for environmental health
Surface-water Water Quality Index
Surface water quality to safeguard human and environmental health
Groundwater Water Quality Index
Ground water quality to safeguard human health
30

Help monitor progress to meeting water sustainability objectives through the development and application of an analysis framework
31

Vision Goals Themes
Objectives Attributes & Processes
Indicators & Indices
Data & Data Analysis
Report Card Performance Evaluation
Knowledge Wisdom
Conceptual models
Spatial & temporal aggregation
Target selection
Status & trends
Regulatory requirement
Program performance
Agency mission
Stakeholder process
Selection criteria
Data management & provenance
Score aggregation
Behavioral change
Public policy
Tribes
Mission performance
Public education
32

ACWI and its Subgroups ACWI history and role – Wendy Norton, USGS National Water Quality Monitoring Council – Susan
Holdsworth, USEPA Ground Water – Bill Cunningham, USGS Hydrology – Richard Raione, USNRC Sedimentation – Amanda Cox, Colorado Water
Research Institute

ACWI Discussion Ideas Mission of collaboration is not focused on public
education Technology allows a single one-stop shop for data;
water quality portal is now available Sedimentation and the National Fish Habitat
Partnership Google Earth opportunities Amazed at the number of interesting and important
tasks of ACWI subcommittees

Army Water Security Observations Water management largely compliance-driven Less attention directed outward to sustainability of
regionally shared water sources Long-term water projections currently not factored
early into stationing decisions Chronic funding constraints means attention to Army-
owned and Army-operated infrastructure tends to be reactive
Long-term investment a challenge

Army Strategy Elements Assist host nations with water resources sustainability Assess the vulnerability of water and wastewater
infrastructure to natural mishaps Match water quality to water use Anticipate long-term water requirements Influence long-term water management outside the fence line

Army Net Zero … ENERGY Installation produces as much energy on site
as it uses, over the course of a year WATER Installation does not deplete ground water
and surface water resources in quantity or quality WASTE Installation converts waste streams to resource
values with zero solid waste to landfill INSTALLATION captures and commercializes the
resource value and/or enhances the ecological productivity of land, water and air

Water Sustainability at EPA • Urban waters and sustainable community pilots Healthy Watersheds Initiative Climate-ready estuaries Effective utility management Green Infrastructure Value of water and ecosystem services Modeling climate impacts and adaptation options Emerging approaches:
Water sustainability indicators Lifecycle costing

Enhancing Watershed Stewardship at the U.S. Forest Service How does climate and land use change shift water
distribution? Likely consequences of these changes to plants, animals,
and rural and urban communities? Scenarios for future forest disturbance regimes and aquatic
ecosystems? Best metrics for measuring watershed condition? Goal: To facilitate watershed -based partnerships that foster conservation and citizen stewardship
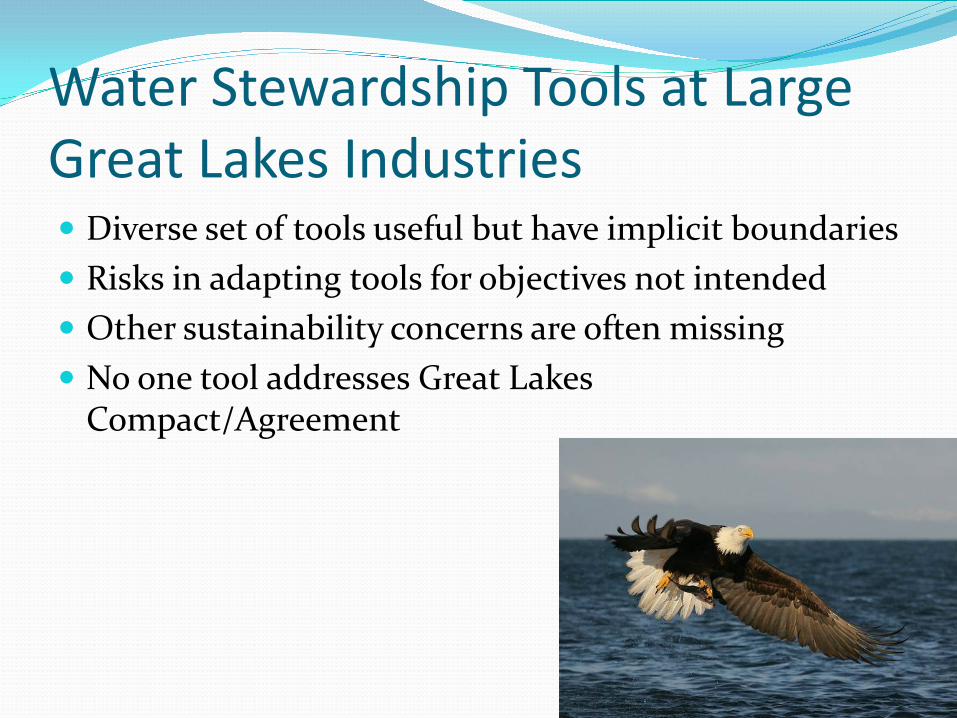
Water Stewardship Tools at Large Great Lakes Industries Diverse set of tools useful but have implicit boundaries Risks in adapting tools for objectives not intended Other sustainability concerns are often missing No one tool addresses Great Lakes
Compact/Agreement

Army Water Bootprint Estimates the amount of water embedded in the goods
and services the Army procures through the supply chain
Sums the water footprints of all the products the Army procures
Recommendations Incorporate producer water use requirements and risk
into Army policies and procedures Identify installations dependent on water-intensive
energy sources in areas of potential water scarcity

The Bellemeade Walkable Watershed 5th grade students identified the priority walking
routes to their school and community center Strategies put in Richmond’s Stormwater Plan Developed a sense of community centered around
the new school and the watershed Connected the neighborhood to the creek, the
regional trail, and the James River Lesson? Think beyond the project scale to a
watershed-wide strategy connecting multiple benefits

International Water Stewardship The Alliance for Water Stewardship’s International
Water Stewardship Standard – Ed Pinero, Chief Sustainability Officer, Veolia Water North America
To support water users in taking appropriate actions to evaluate and improve their impacts on watersheds

Business Benefits of a Standard Water risk mitigation
Identify and respond to physical water risks Remain in legal compliance Enhance community standing and brand value
Strategic opportunities Improved access to finance Potential for strategic partnerships and alliances Improved access to socially and environmentally responsible
markets Operational improvements
Drive innovation and new skill/technology development Engage and motivate staff

Next Steps for the SWRR Continue roundtable outreach
Build regional connections Add new private, nonprofit & public sector partners
Assist agencies in developing programs and in describing the need for programs to collect
indicator information • Develop the SWRR ideas package

SWRR Ideas A handbook for sustainable watershed management A sustainable watershed index generator A framework for indicators in any watershed at any
scale by any organization An evaluation of water footprint tools to help
organizations understand water sustainability A web-based inventory of water sustainability
indicators to share the best ways to grasp water trends
Contact Information SWRR Co-Chairs Rick Swanson, US Forest Service, [email protected] Robert Wilkinson, Bren School of Environmental Science
and Management, University of California, Santa Barbara, [email protected]
John Wells, 651-686-8615, John R. Wells and Associates, [email protected]
SWRR Manager and Facilitator David Berry, 703-741-0791, [email protected] Sustainable Water Resources Roundtable
http://acwi.gov/swrr