Embed Size (px)
Citation preview

John Smithson, WCER
Carolyn K. Eastman, CCSSO
Building Knowledge of Instructional Alignment using
SEC

How do we interpret SEC alignment?

Instruction
Assessment
Standards
Intersection of what is taught with what is tested.
Intersection of what is taught with what is in standards.
Intersection of whatis taught with what is in the standards
Taught,tested, and inthe standards
Alignment Relationships in Standards-based Reform
Target – Intended(e.g. Standards)Instruction (Enacted)
Alignment: The intersection of time spent in the enactedcompared to the relative emphasis placed in the intended.

Coarse GrainAlignmentCalculation
For K-12 MathEquals the sumof Cell Intersectionsacross 16 Content Areas by 5 Cognitive Demand Categories


‘Overall’ AlignmentCalculation
For K-12 MathEquals the sumof Cell Intersectionsacross 183 Content Topics by 5 Cognitive Demand Categories

‘Re-Centered’ AlignmentCalculation
For K-12 Math Equals the sum of Cell Intersectionsacross relevant Content Topics by 5 Cognitive Demand Categories, with results for each description “re-centered” to sum to 1.00
= 1


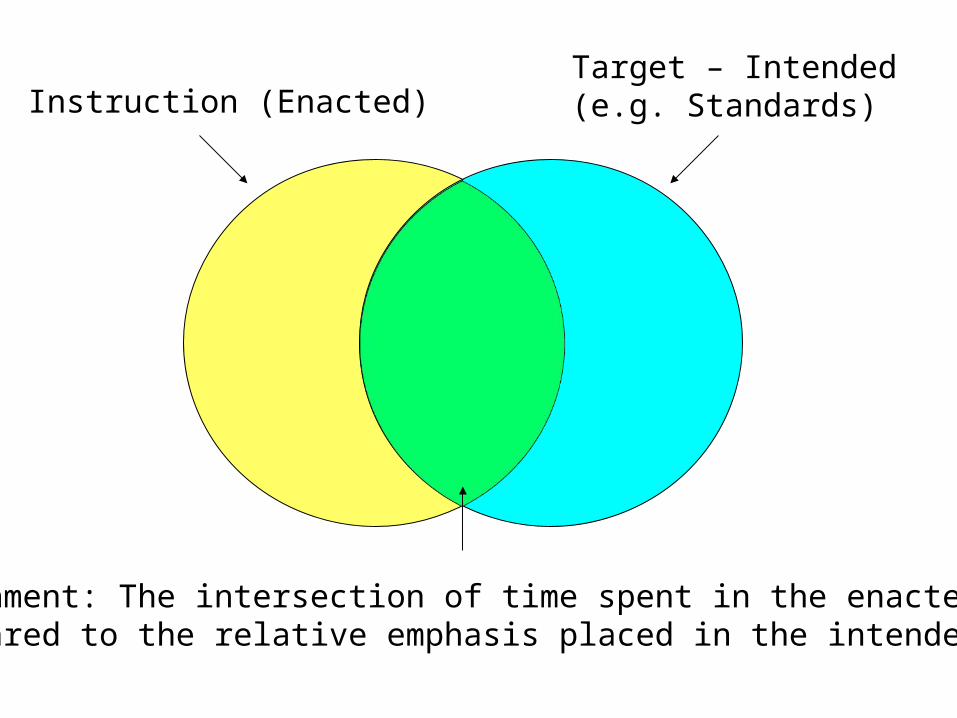
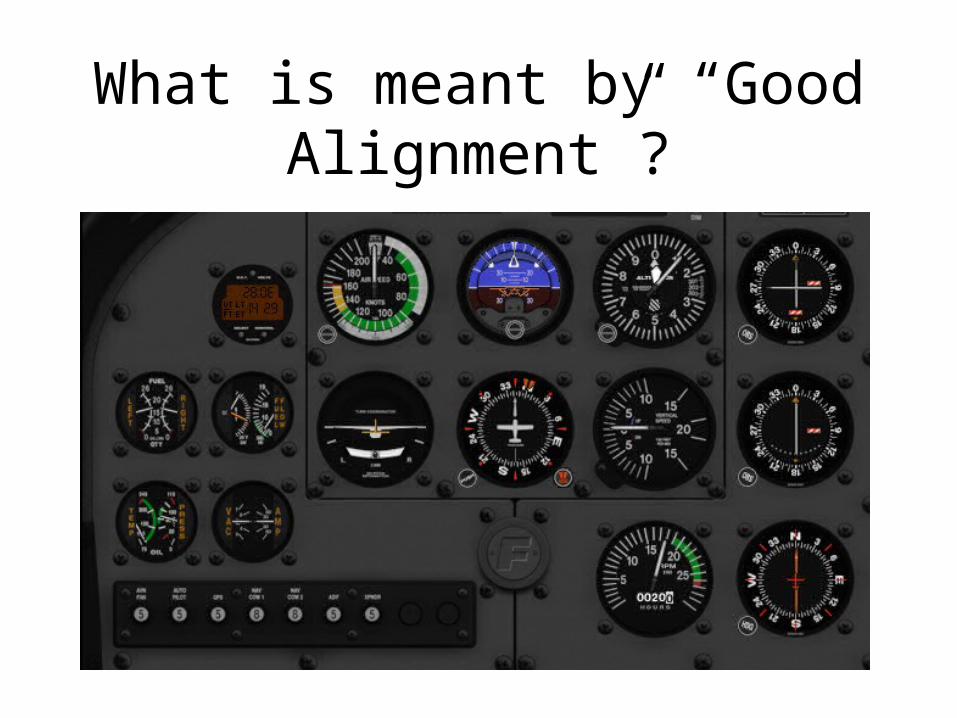
What is meant by “Good Alignment”?
Or At Least:
What is good enough?

We used to say this was good alignment

Now we say this is good alignment

What is meant by “Good Alignment”?
• Norm-referenced?
• Predictability?
• Is More Necessarily Better?
• Alignment = 1.00 is not the Goal?
What is meant by “Good Alignment”?

The answer is more a judgment call that considers alignment, time on topic, student achievement and other factors in relation to one another.
The underlying question should be: ‘Are we adequately preparing students to perform well on high-stakes assessments.
What is meant by “Good Alignment”?

What are the implications?
• Look over data
• Make sure you understand how to read the chart
• Discuss what you observe with a partner

More Context
• The teacher data includes grades 9-12 ELA teachers
• There is a grade 10 graduation test
• Now look at alignment to upper HS grade levels
• What do you think?


(Topics) (Cog. Dmnd.)
Massillon City (2007 Gr. 4) [11]TO: OH Indctrs Gr. 3 Alignment
Number Sense 0.29 0.12 0.45 0.49
Operations 0.28 -0.01 0.36 0.75
Measurement 0.30 -0.07 0.57 0.58
Consumer Applications #DIV/0! 0.00 #DIV/0! #DIV/0!
Basic Algebra 0.41 -0.01 0.53 0.78
Advanced Algebra #DIV/0! 0.00 #DIV/0! #DIV/0!
Geometric Concepts 0.19 0.06 0.31 0.77
Advanced Geometry #DIV/0! 0.01 #DIV/0! #DIV/0!
Data Displays 0.27 -0.08 0.38 0.67
Statistics 0.35 0.01 0.61 0.46
Probability 0.35 0.01 0.68 0.37
Analysis #DIV/0! 0.01 #DIV/0! #DIV/0!
Trigonometry #DIV/0! 0.01 #DIV/0! #DIV/0!
Special Topics 0.00 0.01 #DIV/0! #DIV/0!
Functions #DIV/0! 0.01 #DIV/0! #DIV/0!
Instructional Tech. #DIV/0! 0.02 #DIV/0! #DIV/0!
Overall 0.28 0.79 0.42 0.62
Multi-state Average*:
Alignment Analysis Summary Table
Balance of Representation
Categorical Concurrence
Cognitive Complexity

(Topics) (Cog. Dmnd.)
District Grade 3 [14]TO: OH Indctrs Gr. 3 Alignment
Number Sense 0.28 0.09 0.48 0.46
Operations 0.30 -0.04 0.49 0.76
Measurement 0.30 -0.05 0.62 0.52
Consumer Applications #DIV/0! 0.00 #DIV/0! #DIV/0!
Basic Algebra 0.39 -0.03 0.58 0.68
Advanced Algebra #DIV/0! 0.01 #DIV/0! #DIV/0!
Geometric Concepts 0.17 0.09 0.36 0.64
Advanced Geometry #DIV/0! 0.01 #DIV/0! #DIV/0!
Data Displays 0.32 -0.07 0.45 0.59
Statistics 0.35 0.01 0.63 0.52
Probability 0.45 0.00 0.68 0.46
Analysis #DIV/0! 0.00 #DIV/0! #DIV/0!
Trigonometry #DIV/0! 0.00 #DIV/0! #DIV/0!
Special Topics 0.00 0.00 #DIV/0! #DIV/0!
Functions #DIV/0! 0.00 #DIV/0! #DIV/0!
Instructional Tech. #DIV/0! 0.02 #DIV/0! #DIV/0!
Overall 0.27 0.80 0.47 0.56
Multi-state Average*:
Alignment Analysis Summary Table
Balance of Representation
Categorical Concurrence
Cognitive Complexity

Questions
• Is alignment of instruction to state standards improving under standards-based reform?
• If so, does this represent individual teacher change, or a change in the teacher population taking the survey?