Embed Size (px)
Citation preview

arX
iv:a
stro
-ph/
0412
096
v1
3 D
ec 2
004
How Do Uncertainties in the Surface Chemical Composition of
the Sun Affect the Predicted Solar Neutrino Fluxes?
John N. Bahcall and Aldo M. Serenelli
Institute for Advanced Study, Einstein Drive, Princeton, NJ 08540
Received ; accepted

– 2 –
ABSTRACT
We show that uncertainties in the values of the surface heavy element abun-
dances of the Sun are the largest source of the theoretical uncertainty in calcu-
lating the p-p, pep, 8B, 13N, 15O, and 17F solar neutrino fluxes. We evaluate for
the first time the sensitivity (partial derivative) of each solar neutrino flux with
respect to the surface abundance of each element. We then calculate the un-
certainties in each neutrino flux using ‘conservative (preferred)’ and ‘optimistic’
estimates for the uncertainties in the element abundances. The total conservative
(optimistic) composition uncertainty in the predicted 8B neutrino flux is 11.6%
(5.0%) when sensitivities to individual element abundances are used. The tra-
ditional method that lumps all abundances into a single quantity (total heavy
element to hydrogen ratio, Z/X) yields a larger uncertainty, 20%. The uncer-
tainties in the carbon, oxygen, neon, silicon, sulphur, and iron abundances all
make significant contributions to the uncertainties in calculating solar neutrino
fluxes; the uncertainties of different elements are most important for different
neutrino fluxes. The uncertainty in the iron abundance is the largest source of
the estimated composition uncertainties of the important 7Be and 8B solar neu-
trinos. Carbon is the largest contributor to the uncertainty in the calculation of
the p-p, 13N, and 15O neutrino fluxes. However, for all neutrino fluxes, several
elements contribute comparable amounts to the total composition uncertainty.
Subject headings:

– 3 –
1. INTRODUCTION
What is the role of the chemical composition of the surface of the Sun in the calculation
of the solar neutrino fluxes?
In 1966, almost four decades ago, the role of the chemical composition was described as
follows: “The primordial (or surface) composition assumed in computing the solar models
represents the largest recognized uncertainty in the predicted capture rate;...” (Bahcall
1966). Recently, in 2004, the role of the chemical composition was summarized as follows:
“The surface chemical composition of the Sun is the most problematic and important source
of uncertainties.” (Bahcall & Pinsonneault 2004).
Some things change very slowly.
1.1. Previous calculations using total heavy element abundance Z
From the very beginning of solar neutrino calculations, the chemical composition of
the Sun has been a principal source of uncertainty (see Sears 1964). The first systematic
investigations of the effect of composition uncertainties on the important 8B solar neutrino
flux concluded that the calculated neutrino flux was uncertain by a factor of two due to
uncertainties in the chemical composition (Bahcall et al. 1967; Bahcall et al. 1968).
In the early days of solar neutrino calculations, the uncertainty in the neutrino fluxes
due to the chemical composition was evaluated by calculating the sensitivity of the different
fluxes to different choices of the total heavy element abundance (Sears 1964; Bahcall 1964;
Bahcall et al. 1967; Bahcall et al. 1968; Abraham & Iben 1971). More refined calculations
were eventually carried out using the logarithmic partial derivatives of the neutrino fluxes,
φi, with respect to the total heavy element abundance by mass, Z, i.e., ∂ lnφi/∂ ln Z
(Bahcall & Ulrich 1971).

– 4 –
The abundances of heavy elements in the solar photosphere are determined as ratios,
the ratio of an individual heavy element abundance to the abundance of hydrogen, X. The
abundances are linked by the relation X + Y + Z = 1, where Y is the surface abundance of
helium. The fact that the abundances are measured as ratios was first taken into account
in the paper by Bahcall et al. (1982), who calculated partial derivatives ∂ ln φi/∂ ln(Z/X).
In the intervening two decades, there have been many evaluations of the uncertainty of the
solar neutrino fluxes caused by the solar composition. However, these evaluations all used
variations with respect to the total heavy element abundance, Z, or with respect to Z/X,
the total heavy element abundance divided by the hydrogen abundance.
There has not been a previous systematic investigation of the uncertainty of solar
neutrino fluxes due to individual heavy element abundances. All of the recent papers with
which we are familiar estimate the uncertainty due to the solar composition by considering
variations in the total heavy element abundance, Z, or in Z/X (see, e.g., Schlattl & Weiss
1999; Bahcall et al. 2001; Watanabe & Shibahashi 2001; Fiorentini & Ricci 2002; Couvidat
et al. 2003; Boothroyd & Sackmann 2003; Bahcall & Pinsonneault 2004; Young & Arnett
2005).
Some things change very slowly.
1.2. Necessity of evaluating uncertainties due to individual elements
It has long been recognized that changes in the abundances of some heavy elements,
e.g., iron or silicon, affect the calculated solar neutrino fluxes more than do the abundances
of other elements (see discussion in § IV.D of Bahcall et al. 1982). This is largely because
the heavier elements are highly ionized only in the solar core, where they affect directly the
calculated radiative opacity and indirectly the solar neutrino fluxes. The lighter, volatile
– 5 –
elements affect the radiative opacity most dramatically in the region somewhat below the
convective zone (temperatures somewhat above 2×10⁶ K). Oxygen is a principal contributor
to the radiative opacity just below the convective zone (Turcotte & Christensen-Dalsgaard
1998).
In recent years, determinations of the solar abundances of heavy elements have become
more refined and detailed (Grevesse & Sauval 1998, 2000; Lodders 2003) and especially
(Asplund et al. 2000; Asplund 2000; Allende Prieto et al. 2001, 2002; Asplund et al. 2004;
Asplund et al. 2005). These recent determinations yield significantly lower values than were
previously adopted (e.g., by Grevesse & Sauval 1998) for the abundances of the volatile
heavy elements: C, N, O, Ne, and Ar. However, these recent abundance determinations lead
to solar models that disagree with helioseismological measurements (Bahcall & Pinsonneault
2004; Basu & Antia 2004). Detailed and refined recalculations of the radiative opacity by
the Opacity Project collaboration disfavor (Seaton & Badnell 2004; Badnell et al. 2004) the
suggestion (Basu & Antia 2004; Bahcall et al. 2004b; Bahcall et al. 2005) that the origin
of the discrepancy might be the adopted opacities rather than the adopted heavy element
abundances.
The discrepancies between helioseismological measurements and the predictions made
using recent determinations of heavy elements make it especially important that the
effect of individual element uncertainties be evaluated. The discrepancies occur in the
temperature region below the solar convective zone, 2 × 10⁶ K to 4.5 × 10⁶ K (Bahcall et
al. 2005). In this temperature domain, the volatile heavy elements, C, N, O, Ne, and Ar,
are partially ionized and their abundances significantly affect the radiative opacities. We
need to separate out the effects of the volatile element abundances that contribute to the
helioseismological discrepancies from the effects of abundances, e.g., Si and Fe, that are
most important in the solar core.

– 6 –
1.3. What do we do in this paper?
We derive for the first time in this paper individual uncertainties in each neutrino flux
due to each of the important heavy elements in the solar composition. We then combine
the effects of all composition uncertainties to determine the net effect of composition
uncertainties on each solar neutrino flux and on the rate of each radiochemical solar neutrino
experiment. Finally, we combine the effects of all known sources of uncertainties, including
composition uncertainties, on each neutrino flux and experimental radiochemical rate. We
identify the heavy elements that most strongly affect the predicted neutrino fluxes and we
identify for which solar neutrino fluxes composition uncertainties are most important.
Abundance determinations for the Sun change frequently as improved techniques,
new atomic data, and more observations become available. Therefore, we describe in this
paper the steps necessary to make detailed and reliable estimates of the uncertainties in
the solar neutrino fluxes for a given set of abundances and their uncertainties. We also
make available at http://www.sns.ias.edu/∼jnb computer code and numerical data that
can facilitate future investigations when new abundance determinations are published.
We discuss the role of correlations between the uncertainties of different elements. This
is an aspect of abundance discussions that is not treated explicitly in any of the papers
with which we are familiar. However, we will show that for future precision evaluations of
the effects of abundance determinations on neutrino fluxes we must know the correlations,
if any, between the quoted abundance determinations and their uncertainties.
We use for the calculations in this paper the recently computed standard solar models
BP04 and BP04+ (Bahcall & Pinsonneault 2004), which are described below. However,
we also verify that small changes such as occur between different recent redeterminations
of the solar abundances cause only negligible changes (typically 0.1%) in the estimated
uncertainties of the solar neutrino fluxes. Table 1 of Bahcall et al. (2004b) lists the specific

– 7 –
element abundances adopted in computing each of the solar models BP04 and BP04+.
The plan of the paper is as follows. In § 2, we present and discuss the logarithmic
partial derivatives of each solar neutrino flux with respect to each of the ratios (major
heavy element abundance)/(hydrogen abundance). The results are given for two separate
solar models, BP04 (which uses the Grevesse & Sauval 1988 composition) and BP04+
(which uses more recent determinations of the abundances of the volatile elements). We
also present the partial derivatives with respect to the heavy element to hydrogen ratio,
Z/X. The robustness of the partial derivatives with respect to Z/X is made evident from
the very small change in their numerical values over more than two decades, although the
solar models have been greatly refined.
We present in § 3 ‘conservative’ and ‘optimistic’ estimates for the current uncertainties
in the heavy element abundances. We adopt as our preferred choice the conservative
uncertainty estimates. We compute in § 4 the uncertainties in individual neutrino fluxes due
to the uncertainties in each heavy element abundance. We combine for each neutrino flux
in § 5 the uncertainties from all abundance uncertainties; these results are summarized in
Table 7. Our bottom line is given in Table 8 of § 6, where we present the total uncertainties
in the neutrino fluxes for different methods of calculation.
We summarize and discuss our main results in § 7.
We recommend that all readers start by perusing § 7, our summary and discussion
section. For many readers, § 7 contains all they need to know about the subject.
2. LOGARITHMIC DERIVATIVES
We define in § 2.1 the logarithmic partial derivatives of each of the neutrino fluxes with
respect to each of the element abundances. We present in § 2.2 newly calculated partial

– 8 –
derivatives that were obtained using the recently-derived BP04 and BP04+ solar models
(Bahcall & Pinsonneault 2004). We also calculate in § 2.3 new values for the logarithmic
partial derivatives with respect to the total heavy element to hydrogen ratio, Z/X. We
compare these newly-calculated values with partial derivatives that were obtained using
1982 and 1988 solar models. Finally, we use the results of the previous subsection to
explain, in § 2.4, the reason why estimates of the composition uncertainties based upon
historical changes in Z/X have led to overestimates of the composition uncertainties in the
calculated solar neutrino fluxes.
2.1. Definition of partial derivatives
The sensitivity of the neutrino fluxes, φi, to the input parameters, βj , can be expressed
to high accuracy in terms of the logarithmic partial derivatives, αij (see Bahcall & Ulrich
1988; Bahcall 1989). The logarithmic derivatives are defined by the equation
αij =∂ ln φi
∂ lnβj
. (1)
In this paper, we are primarily concerned with the uncertainties in the calculated solar
neutrino fluxes that result from uncertainties in the solar heavy element abundances. Thus
we concentrate on partial derivatives in which the βj are the mass fractions of different
heavy elements relative to the hydrogen mass fraction. Thus,
βj =(mass fraction of element j)
(mass fraction of hydrogen). (2)
It is conventional to denote the mass fraction of hydrogen by X.
We note that the partial derivatives give rise to the power law dependences of neutrino
fluxes upon model parameters that are widely used in the literature. We have
φi = φi(0)
[
βj
βj(0)
]αij
. (3)

– 9 –
Table 1: Partial derivatives of neutrino fluxes with respect to composition fractions. The en-
tries in the table are the logarithmic partial derivatives, αij of the solar neutrino fluxes,
φi, with respect to the fractional abundances of the heavy elements, βj (see eq. [1]
and eq. [2]). The partial derivatives were computed using the solar model BP04 (Bah-
call & Pinsonneault 2004). The derivatives given here are available in digital form at
http://www.sns.ias.edu/∼jnb under the menu items Solar Neutrinos/software and data.
Source C N O Ne Mg Si S Ar Fe
pp −0.014 −0.003 −0.006 −0.005 −0.005 −0.011 −0.008 −0.002 −0.023
pep −0.025 −0.006 −0.011 −0.005 −0.005 −0.014 −0.017 −0.006 −0.065
hep −0.015 −0.004 −0.023 −0.017 −0.018 −0.037 −0.028 −0.007 −0.069
7Be −0.002 0.002 0.052 0.049 0.051 0.104 0.074 0.018 0.209
8B 0.030 0.011 0.121 0.096 0.096 0.194 0.137 0.034 0.515
13N 0.845 0.181 0.079 0.057 0.060 0.128 0.094 0.024 0.342
15O 0.826 0.209 0.093 0.068 0.070 0.150 0.109 0.028 0.401
17F 0.033 0.010 1.102 0.076 0.078 0.164 0.120 0.031 0.444
In practice, the partial derivatives are computed by first evolving a standard solar
model with a specific set of input data. The standard solar model is used to predict the
best-estimate set of neutrino fluxes, φi(0). Then at least one additional solar model is
evolved in which one parameter, βi, is changed from its standard value. If only these two
solar models are available, then the logarithmic partial derivative αij can be estimated from
the following equation:
αij ≃ln [φi/φi(0)]
ln [βj/βj(0)]. (4)
For this paper, we have used five solar models, including the standard model, in
evaluating each of the derivatives αij . Except for the case of argon, we have compared solar
models in which the abundance fractions differed from the standard abundance fractions by
-0.10 dex, -0.05 dex, 0.0 dex, +0.05 dex, and +0.10 dex. Argon is much less abundant than
– 10 –
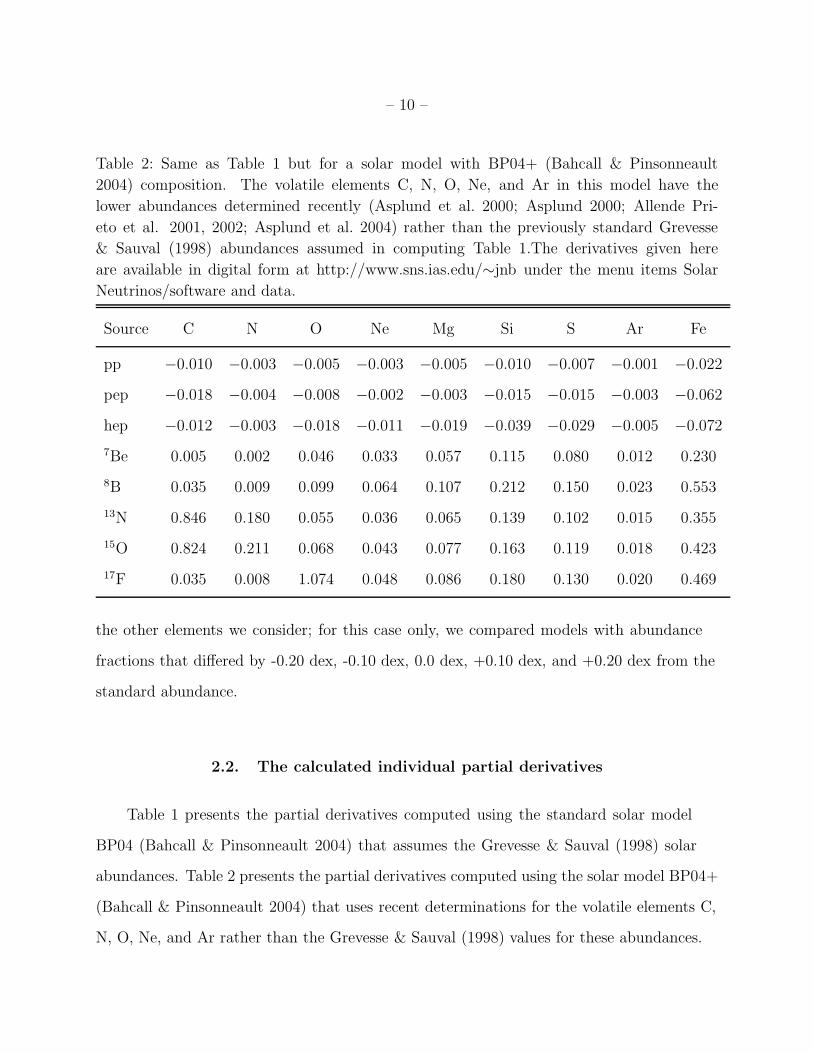
Table 2: Same as Table 1 but for a solar model with BP04+ (Bahcall & Pinsonneault
2004) composition. The volatile elements C, N, O, Ne, and Ar in this model have the
lower abundances determined recently (Asplund et al. 2000; Asplund 2000; Allende Pri-
eto et al. 2001, 2002; Asplund et al. 2004) rather than the previously standard Grevesse
& Sauval (1998) abundances assumed in computing Table 1.The derivatives given here
are available in digital form at http://www.sns.ias.edu/∼jnb under the menu items Solar
Neutrinos/software and data.
Source C N O Ne Mg Si S Ar Fe
pp −0.010 −0.003 −0.005 −0.003 −0.005 −0.010 −0.007 −0.001 −0.022
pep −0.018 −0.004 −0.008 −0.002 −0.003 −0.015 −0.015 −0.003 −0.062
hep −0.012 −0.003 −0.018 −0.011 −0.019 −0.039 −0.029 −0.005 −0.072
7Be 0.005 0.002 0.046 0.033 0.057 0.115 0.080 0.012 0.230
8B 0.035 0.009 0.099 0.064 0.107 0.212 0.150 0.023 0.553
13N 0.846 0.180 0.055 0.036 0.065 0.139 0.102 0.015 0.355
15O 0.824 0.211 0.068 0.043 0.077 0.163 0.119 0.018 0.423
17F 0.035 0.008 1.074 0.048 0.086 0.180 0.130 0.020 0.469
the other elements we consider; for this case only, we compared models with abundance
fractions that differed by -0.20 dex, -0.10 dex, 0.0 dex, +0.10 dex, and +0.20 dex from the
standard abundance.
2.2. The calculated individual partial derivatives
Table 1 presents the partial derivatives computed using the standard solar model
BP04 (Bahcall & Pinsonneault 2004) that assumes the Grevesse & Sauval (1998) solar
abundances. Table 2 presents the partial derivatives computed using the solar model BP04+
(Bahcall & Pinsonneault 2004) that uses recent determinations for the volatile elements C,
N, O, Ne, and Ar rather than the Grevesse & Sauval (1998) values for these abundances.
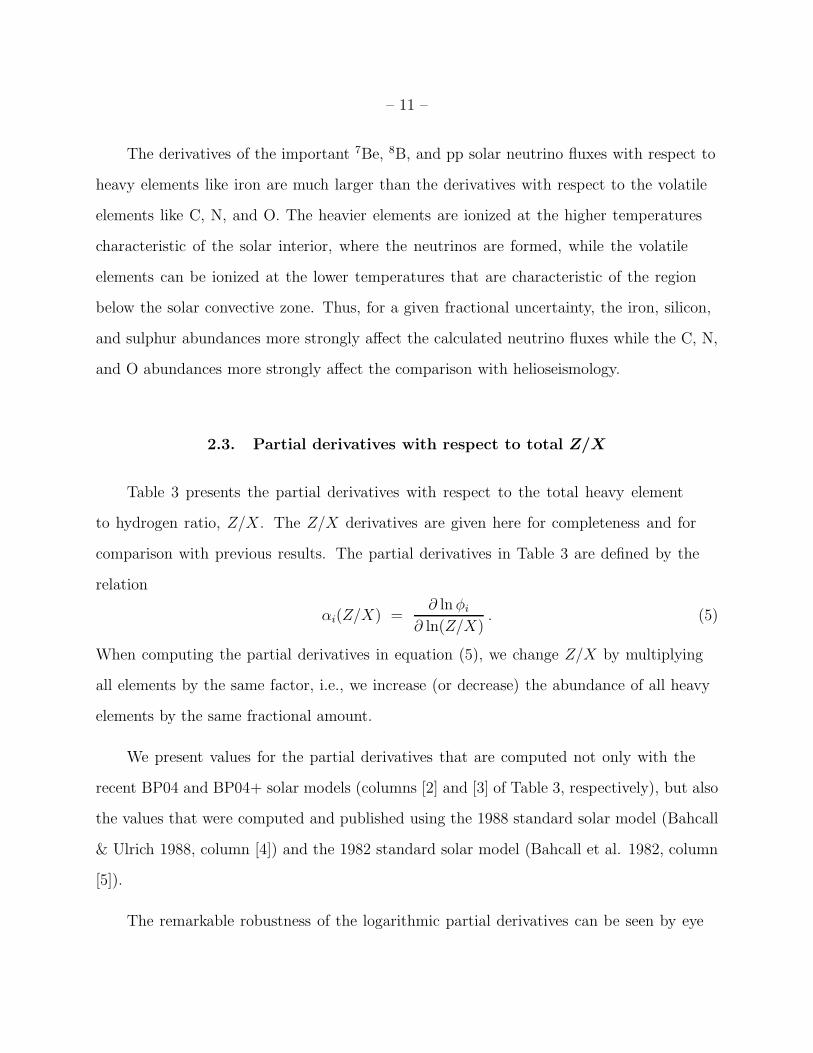
– 11 –
The derivatives of the important 7Be, 8B, and pp solar neutrino fluxes with respect to
heavy elements like iron are much larger than the derivatives with respect to the volatile
elements like C, N, and O. The heavier elements are ionized at the higher temperatures
characteristic of the solar interior, where the neutrinos are formed, while the volatile
elements can be ionized at the lower temperatures that are characteristic of the region
below the solar convective zone. Thus, for a given fractional uncertainty, the iron, silicon,
and sulphur abundances more strongly affect the calculated neutrino fluxes while the C, N,
and O abundances more strongly affect the comparison with helioseismology.
2.3. Partial derivatives with respect to total Z/X
Table 3 presents the partial derivatives with respect to the total heavy element
to hydrogen ratio, Z/X. The Z/X derivatives are given here for completeness and for
comparison with previous results. The partial derivatives in Table 3 are defined by the
relation
αi(Z/X) =∂ ln φi
∂ ln(Z/X). (5)
When computing the partial derivatives in equation (5), we change Z/X by multiplying
all elements by the same factor, i.e., we increase (or decrease) the abundance of all heavy
elements by the same fractional amount.
We present values for the partial derivatives that are computed not only with the
recent BP04 and BP04+ solar models (columns [2] and [3] of Table 3, respectively), but also
the values that were computed and published using the 1988 standard solar model (Bahcall
& Ulrich 1988, column [4]) and the 1982 standard solar model (Bahcall et al. 1982, column
[5]).
The remarkable robustness of the logarithmic partial derivatives can be seen by eye

– 12 –
Table 3: Z/X: Partial derivatives of neutrino fluxes with respect to the total heavy element
to hydrogen ratio. The entries in the table are the logarithmic partial derivatives, αi(Z/X)
of the solar neutrino fluxes, φi, with respect to the the heavy element to hydrogen ratio Z/X
(see eq. [5]). The partial derivatives were computed using the BP04 solar model (column [2]),
the BP04+ solar model (column [3]), the Bahcall & Ulrich (1988) standard model (Table XV
of BU88, column [4]), and the Bahcall et al. (1982) standard model (Table XI of Bahcall et
al. 1982, column [5]).
Source BP04 BP04+ BU88 Bahcall et al. 82
pp −0.084 −0.071 −0.08 −0.05
pep −0.171 −0.147 −0.17
hep −0.242 −0.229 −0.22
7Be 0.619 0.637 0.58 0.60
8B 1.364 1.369 1.27 1.26
13N 1.897 1.870 1.86 1.67
15O 2.056 2.038 2.03 2.00
17F 2.169 2.151 2.09
by comparing the different columns of Table 3. The rms fractional difference between the
partial derivatives ∂ ln φi/∂ ln(Z/X) computed by Bahcall & Ulrich (1988) and the values
computed using the BP04 solar model is 1.9%. Even if we go all the way back to the first
computation, by Bahcall et al. (1982), the rms fractional difference between the 1982 and
the 2004 values (columns [4] and [2], respectively) is only 10.6%.
Table 3 implies that we would have made only of order a 10% error in the estimated
total flux uncertainties due to composition uncertainties had we used the 1982 partial
derivatives instead of their 2004 values. In all cases, using the original 1982 partial
derivatives would have changed by less than 1% the total flux uncertainties we estimate due

– 13 –
to composition uncertainties.
We conclude that the major revisions and refinements that have been implemented in
standard solar models over the past two and a half decades have not significantly affected
∂ lnφi/∂ ln(Z/X).
2.4. Why Z/X changes give an overestimate of composition changes
The abundances of the heavier elements like Si, S, and Fe are relatively well known
and therefore these elements do not affect greatly ∆(Z/X)/(Z/X), although they do affect
strongly the calculated neutrino fluxes. The influence of the heavy elements like silicon,
sulphur, magnesium, and iron on the calculated neutrino fluxes is primarily through their
affect on the radiative opacity in the core of the solar model. As we shall see in the following
section (see especially Table 4), the abundances of the light elements like C, N, O, and Ne
are relatively poorly known and therefore they contribute a large amount to the fractional
uncertainty, ∆(Z/X)/(Z/X). However, these light elements do not affect the solar neutrino
fluxes very much (Bahcall & Pinsonneault 2004); they are ionized near the base of the
convective zone, outside the region where the neutrinos are formed.
Thus some elements, like C and O, affect strongly ∆(Z/X)/(Z/X) without affecting
very much the calculated neutrino fluxes. Conversely, heavier elements like Fe, affect the
neutrino fluxes very significantly but, because their abundances are relatively well known,
not ∆(Z/X)/(Z/X).
The imperfect correlation between changes in ∆(Z/X)/(Z/X) and changes in
calculated neutrino fluxes is the basic reason that it is necessary to evaluate individually
the effects of individual abundance uncertainties on the flux estimates.
We shall compute and present in what follows the flux uncertainties calculated using

– 14 –
the partial derivatives from Table 1, Table 2, and Table 3. We will adopt the results
obtained with Table 1 for our preferred estimates of uncertainties since the BP04 solar
model is in good agreement with helioseismology while the BP04+ solar model is in poor
agreement with helioseismological measurements in the region between a solar radius of
R = 0.7R⊙ and R = 0.4R⊙ (Bahcal et al. 2005). We also prefer the estimated uncertainties
obtained with the derivatives of Table 1 because these uncertainties are more conservative
(larger) than the estimates obtained with Table 2.
3. ABUNDANCE UNCERTAINTIES
In this section, we discuss and present two different estimates for the uncertainties in
the heavy element abundances on the surface of the Sun. Our ‘conservative’ uncertainty
estimates are obtained by comparing recent abundance analyses with previously standard
analyses. Our more ‘optimistic’ uncertainty estimates are obtained by adopting the
uncertainty estimates in the most recent review (Asplund et al. 2005).
3.1. Element abundances
Recent analyses of the surface chemical composition of the Sun use three-dimensional
atmospheric models, take account of hydrodynamic effects, and pay special attention to
uncertainties in the atomic data and the observed spectra. Mass fractions that are lower
than the previous standard values (Grevesse & Sauval 1998) have been obtained in this
way for C, N, O, Ne, and Ar (Asplund et al. 2000; Asplund 2000; Allende Prieto et al.
2001, 2002; Asplund et al. 2004 ). These abundance determinations have typical quoted
uncertainties of order 0.05 dex (12%).
However, as noted earlier the recent lower abundances of these volatile heavy elements,

– 15 –
when incorporated into solar models, lead to serious discrepancies with helioseismology.
And, to make the situation even more puzzling, the solar models computed with the
previously standard heavy element abundances (Grevesse & Sauval 1998) yield results in
good agreement with helioseismology.
Estimating the uncertainty in an abundance determination is even more difficult
than arriving at a best-estimate abundance. The important uncertainties are most often
systematic and range all the way from line blending in the observed spectra to mathematical
and physical approximations made in modeling the solar atmosphere (see Lodders 2003 and
Asplund et al. 2005).
We have calculated the neutrino flux dependences on the individual abundances of
C, N, O, Ne, Mg, Si, S, Ar and Fe. These are the elements that contribute most to the
uncertainty in the calculated fluxes.
With the exception of argon, these are the most abundant metals in the Sun. The
elements not included are at least a factor seven less abundant and their uncertainties are
small (comparable to the most precise determination of the listed elements). Ar is a special
case; its abundance is comparable to that of other elements not listed (for example Na, Al,
Ca and Ni) but the uncertainty in its abundance is much larger (more than four times) and
gives a non-negligible contribution to the neutrino fluxes uncertainties despite its low solar
abundance.
The neutrino fluxes depend on the individual metal abundances mainly through their
effect in the radiative opacities, for which metals are major contributors in the solar interior.
In this regard, it is worth mentioning that for each solar model we have produced the set of
OPAL radiative opacities (using the tool available at the OPAL Web site1 corresponding to
1http://www-phys.llnl.gov/Research/OPAL/new.html
– 16 –
each of the specific compositions used.
3.2. Conservative and optimistic abundance uncertainties
We take as one measure of the fractional uncertainty in the heavy element abundance
βi, the difference between the previous standard abundance minus the recently determined
abundance divided by the average of the previous abundance and the recently determined
abundance. Thus
∆βi
βi
=[2 (Abundanceold, i − Abundancenew, i)]
[(Abundanceold, i + Abundancenew, i)](1σ). (6)
Equation (6) represents our ‘conservative’ estimate of abundance uncertainties and is
intended to help take account of systematic uncertainties in an empirical way.
We use in equation (6) meteoritic abundances where available, i.e., for Mg, Si, S, and
Fe. Over the several decades in which photospheric and meteoritic abundances have been
compared, the agreement between the photospheric and meteoritic abundances has steadily
improved. However, when there was a conflict in the best-estimates from the two methods,
it has often turned out that the meteoritic estimate was more accurate. We use solar
abundance determinations for C, N, O, Ne, and Ar. The measurements for Ne and Ar are
particularly problematic and subject to systematic uncertainties (see Asplund et al. 2005).
Table 4 gives, in the second column, our preferred (conservative) estimate for the
fractional uncertainties of the most important heavy elements. The uncertainties in this
column were computed using equation (6) in comparing the Grevesse & Sauval (1998)
abundances with the Asplund et al. (2005) abundances.
The third column of Table 4 gives more optimistic estimates of the composition
uncertainties, namely, the uncertainties published in the recent review by Asplund et al.

– 17 –
Table 4: Adopted 1σ uncertainties for individual heavy elements. We adopt meteoritic mea-
surements where available, i.e., for Mg, Si, S, and Fe (Lodders 2003). For the volatile elements
C, N, O, Ne, and Ar we use solar atmospheric abundances. column (2), under the heading
‘Historical,’ gives as our preferred (conservative) estimated error the fractional differences
between the recent abundance determinations (Asplund et al. 2005) and the previously
standard values (Grevesse & Sauval 1998). Column (3), ’Recent Analyses’ (optimistic), lists
the uncertainties quoted in the recent paper by Asplun et al. (2005); the uncertainties for
meteoritic abundances in the Asplund et al. paper are based upon Lodders (2003).
Heavy Historical Recent Analyses
Element [Conservative] (%) [Optimistic] (%)
C 29.7 12.2
N 32.0 14.8
O 38.7 12.2
Ne 53.9 14.8
Mg 11.5 7.2
Si 11.5 4.7
S 9.2 9.6
Ar 49.6 20.2
Fe 11.5 7.2
(2005). We list the published uncertainties without taking into account the conflict that
the new abundances cause with helioseismology and without taking account of the previous
history of the abundance determinations. We interpret conservatively the recently published
uncertainties as 1σ, although the statistical significance of the Asplund et al. (2005)
error estimates is not stated explicitly in their paper. We use the meteoritic abundance
uncertainties whenever a meteoritic abundance is available; interpreting the meteoritic
uncertainties as 1σ is especially conservative (Lodders 2003).

– 18 –
Comparing the uncertainties given in the second and third columns of Table 4, we see
that the recent abundance determinations for the volatile elements have published error
estimates (Asplund et al. 2005) that are typical one-third of the uncertainties computed
by the historical comparison expressed by equation (6). The uncertainties estimated by
Asplund et al. (2005) for the meteoritic determinations are typically a factor of one-half the
uncertainties computed with equation (6).
4. UNCERTAINTIES IN INDIVIDUAL NEUTRINO FLUXES FROM
INDIVIDUAL ELEMENT ABUNDANCES
We define and present in this section the uncertainties in individual neutrino fluxes
that result from the uncertainties in each of the important element abundances. Our results
are summarized in Table 5 and Table 6. In the discussion, we point out which elements
cause the largest uncertainties in the different calculated neutrino fluxes.
The fractional uncertainty in each neutrino flux φi due to the uncertainty in each
element abundance can be computed to high accuracy (Bahcall & Ulrich 1988, Bahcall
1989) using equation (1)–equation (3). Combining these equations, we can write
∆φi,j
φi
=
[
1 +∆βj
βj
]αij
− 1 . (7)
The adopted fractional uncertainties ∆βj/βj are given in Table 4 and the partial derivatives
αij are given in Table 1 and Table 2.
Table 5 presents our best estimates of the uncertainties in each solar neutrino flux due
to the uncertainty in each element abundance. The results given in Table 5 were evaluated
using the partial derivatives computed for the BP04 solar model and given in Table 1; the
conservative composition uncertainties are given in the second column of Table 4.
The abundance of iron contributes the largest uncertainty from element abundances for

– 19 –
Table 5: Uncertainties of individual neutrino fluxes from individual heavy element abun-
dances. The entries in the table are the fractional uncertainties, ∆φi,j/φi, of each of the
principal solar neutrino fluxes, due to each of the heavy element abundances, βj, defined
by equation (2). The partial derivatives that were used were computed with the aid of the
BP04 solar model with the standard composition from Grevesse & Sauval (1998) and are
listed in Table 1. The adopted uncertainties for each heavy element are given in column (2)
of Table 4 under the label ‘Historical [Conservative].’
Source C N O Ne Mg Si S Ar Fe
pp −3.63E-3 −8.33E-4 −1.96E-3 −2.15E-3 −5.44E-4 −1.20E-3 −7.04E-4 −8.05E-4 −2.50E-3
pep −6.48E-3 −1.66E-3 −3.59E-3 −2.15E-3 −5.44E-4 −1.52E-3 −1.50E-3 −2.41E-3 −7.05E-3
hep −3.89E-3 −1.11E-3 −7.50E-3 −7.30E-3 −1.96E-3 −4.02E-3 −2.46E-3 −2.82E-3 −7.48E-3
7Be −5.20E-4 5.55E-4 1.72E-2 2.14E-2 5.57E-3 1.14E-2 6.53E-3 7.28E-3 2.30E-2
8B 7.83E-3 3.06E-3 4.04E-2 4.23E-2 1.05E-2 2.13E-2 1.21E-2 1.38E-2 5.77E-2
13N 2.46E-1 5.15E-2 2.62E-2 2.49E-2 6.55E-3 1.40E-2 8.31E-3 9.71E-3 3.79E-2
15O 2.40E-1 5.97E-2 3.09E-2 2.98E-2 7.65E-3 1.65E-2 9.64E-3 1.13E-2 4.46E-2
17F 8.62E-3 2.78E-3 4.34E-1 3.33E-2 8.53E-3 1.80E-2 1.06E-2 1.26E-02 4.95E-2
both the 7Be and the 8B solar neutrino fluxes. Neon is a close second, with oxygen making
the third largest contribution.
The iron abundance is relatively well determined (see Table 4) from both photospheric
and meteoritic measurements (see Asplund et al. 2005 and Lodders 2003). Nevertheless,
the uncertainty from iron is large because of the relatively large partial derivatives of the
fluxes with respect to the iron over hydrogen abundance ratio (see Table 1). The oxygen
abundance has recently been the subject of very comprehensive studies using the solar
atmospheric spectrum. However, it is notoriously difficult to measure the abundance of
the noble gases neon and argon, since they are absent in the Fraunhofer absorption line
spectrum of the solar photosphere and are mostly lost from meteorites. Measurements of
the neon and argon abundance must be made indirectly using coronal data, the solar wind,

– 20 –
Table 6: Optimistic uncertainties of individual neutrino fluxes from individual heavy element
abundances, φi,j/φi. The present table is similar to Table 5. However, for the present
table we used the more optimistic uncertainties estimated by Asplund et al. (2005); these
optimistic uncertainties are listed in column (3) of Table 4 under the label ‘Recent Analyses
[Optimistic].’ Also, we have used here the partial derivatives computed for the solar model
BP04+.
Source C N O Ne Mg Si S Ar Fe
pp −1.15E-3 −4.14E-4 −5.75E-4 −4.14E-4 −3.48E-4 −4.59E-4 −6.41E-4 −1.84E-4 −1.53E-3
pep −2.07E-3 −5.52E-4 −9.20E-4 −2.76E-4 −2.09E-4 −6.89E-4 −1.37E-3 −5.52E-4 −4.30E-3
hep −1.38E-3 −4.14E-4 −2.07E-3 −1.52E-3 −1.32E-3 −1.79E-3 −2.65E-3 −9.20E-4 −4.99E-3
7Be 5.76E-4 2.76E-4 5.31E-3 4.57E-3 3.97E-3 5.30E-3 7.36E-3 2.21E-3 1.61E-2
8B 4.04E-3 1.24E-3 1.15E-2 8.87E-3 7.47E-3 9.78E-3 1.38E-2 4.24E-3 3.92E-2
13N 1.02E-1 2.52E-2 6.35E-3 4.98E-3 4.53E-3 6.40E-3 9.39E-3 2.76E-3 2.50E-2
15O 9.95E-2 2.96E-2 7.86E-3 5.95E-3 5.37E-3 7.51E-3 1.10E-2 3.32E-3 2.98E-2
17F 4.04E-3 1.10E-3 1.32E-1 6.65E-3 6.00E-3 8.30E-3 1.20E-2 3.69E-3 3.31E-2
and energetic solar particles. Since we have limited knowledge of the details of the physics
within the regions where neon lines are formed, these indirect measurements are subject to
unknown systematic errors.
The abundance of carbon contributes the largest composition uncertainty for the
p-p, 13N, and 15O solar neutrino fluxes. In fact, the uncertainty in the carbon abundance
dominates the composition uncertainty for the 13N and 15O neutrino fluxes.
Table 6 presents more optimistic estimates for the uncertainties in the individual
neutrino fluxes from individual heavy elements. These smaller uncertainties are calculated
using the abundance uncertainties given by Asplund et al. (2005) (column [3] of Table 4)
and the partial derivatives computed using the BP04+ solar model (Table 2).
The largest composition uncertainty in the calculation of the 7Be and 8B neutrino

– 21 –
fluxes is again the iron abundance given the assumptions used in calculating Table 6, just
as it was for the more conservative uncertainty estimates used in constructing Table 5.
However, for the assumptions used in calculating Table 6, sulphur contributes the second
largest uncertainty and oxygen, neon, and silicon all contribute significantly.
For the p-p neutrino flux, the largest uncertainty due to composition is from the iron
abundance (for the conditions of Table 6). But, for the 13N and 15O neutrino fluxes, the
carbon abundance dominates the uncertainty due to composition.
Why do we use for Table 6 the partial derivatives computed with the BP04+ model?
Since we use in Table 6 the uncertainties determined by recent measurements, it is more
appropriate to use the partial derivatives that are obtained with a model, BP04+, that
adopts the recent abundance determinations. The precise composition used in constructing
BP04+ is given in Table 1 of Bahcall et al. (2004b). There are slight differences between the
composition used in constructing BP04+ and the very latest estimated abundances given
by Asplund et al. (2005). To make sure that these small differences were unimportant, we
evolved a solar model that was identical to BP04 and BP04+ except that the new model,
BP04AGS, uses the Asplund et al. (2005) abundances. The average difference between the
total neutrino flux uncertainties due to composition uncertainties that was obtained using
models BP04+ and BP04AGS, was 0.09% and, in all cases, less than 0.2%.
5. NEUTRINO FLUX AND EXPERIMENTAL RATE UNCERTAINTIES
FROM ALL ABUNDANCE UNCERTAINTIES
We begin this section by describing in § 5.1 how we combine all of the abundance
uncertainties to compute the total uncertainty in the calculated neutrino fluxes that arise
from all composition determinations, assuming that the abundance determinations of

– 22 –
different elements are statistically independent. We discuss in § 5.2 the special case of the
neon and argon abundances, which are determined relative to a reference element that can
be measured in the solar photosphere. We discuss in §5.3 the correlated uncertainty in
the meteoritic abundances that results from adjusting the meteoritic abundance scale to
agree with the solar atmospheric abundance scale. We compare in § 5.4 the conservative
uncertainty estimates (our preferred estimates) with the more optimistic uncertainty
estimates that are based upon the published error estimates of abundance uncertainties by
Asplund et al. (2005). In § 5.5, we compare the uncertainties that have been traditionally
estimated using the total Z/X with the uncertainties that are estimated using individual
abundance uncertainties.
Table 7 summarizes the principal results of this section.
The software used to combine the abundance uncertainties is available at
http://www.sns.ias.edu/∼jnb under the menu items Solar Neutrinos/software and data.
The code, exportrates.f, provides options for calculating the uncertainties using individual
abundance uncertainties and also using the uncertainty in the total Z/X.
5.1. Computation of flux uncertainties from all abundance uncertainties
The uncertainty due to abundance determinations for a given calculated neutrino
flux can be obtained by combining the effects of all the element uncertainties on the flux
of interest. If all of the abundance determinations are independent of each other, the
uncertainties can be combined quadratically. However, if there are correlations in the
uncertainties in the abundance determinations, these must be taken into account. Usually,
observers do not specify the correlations among the quoted uncertainties. However, as we
discuss in § 5.2, there is a strong correlation between the uncertainties in the neon and

– 23 –
argon abundances and in the oxygen abundance and we take this into account.
The general formula for the uncertainty in the neutrino flux φi can be written
∆φi
φi
=
√
√
√
√
∑
j
(
∆φi,j
φi
)2
+∑
k 6=l
(
∆φi,k
φi
) (
∆φi,l
φi
)
ρ(k, l) , (8)
where the indices j, k, and l denote different elements and ρ(k, l) is the correlation coefficient
between the abundance uncertainties of the k and l elements. If the uncertainties of two
elements, k and l, are uncorrelated then ρ(k, l) = 0.0. If the uncertainties are fully
correlated, ρ(k, l) = 1.0.
For radiochemical experiments, chlorine, gallium, and lithium experiments, the
procedure for calculating the uncertainty, ∆R, in predicted event rates, R, is somewhat
more complicated. The measured rates for radiochemical experiments are sensitive to
contributions from different neutrino branches, with each neutrino flux contributing an
amount φiσi (where σi is the neutrino absorption cross section). The uncertainty from a
given element abundance, βj , affects in a coherent way to all of the partial contributions
φiσi. The contribution to the uncertainty in the rate from a fixed composition j, ∆r(j), is
∆r(j) =∑
i
φ(i)σ(i)
(
∆φi,j
φi
)
. (9)
To calculate the uncertainty for a radiochemical rate with only incoherent contributions, we
first sum over all partial rate contributions i for a fixed composition uncertainty j, before
quadratically combining the uncertainties from each different composition j.
If the uncertainties from some elements are correlated, then we must include the effects
of the correlations as an additional term. Including the possibility of correlations, the
general expression for the uncertainty in a radiochemical experiment is
∆Rate =
√
∑
j
(∆r(j))2 +∑
k 6=l
∆r(k)∆r(l)ρ(k, l) . (10)

– 24 –
5.2. Correlation of neon, argon, and oxygen abundance uncertainties
The noble gases neon and argon do not appear in the solar photospheric spectrum and
are largely lost by meteorites. Therefore, the abundances of neon and argon abundances
must be determined in environments that are less well understood than the photospheric
spectrum, in particular, in the coronal spectrum, in the solar wind, in solar energetic
particles, and by gamma ray spectroscopy. The measurements of the neon and argon
abundances must be made with respect to some reference element that does appear in
the solar photosphere. The reference element of choice is usually oxygen or magnesium.
There are, of course, potentially very large systematic uncertainties in these indirect
determinations of the neon and argon abundances.
Asplund et al. (2005) give neon and argon abundances that are determined relative
to the oxygen abundance. Thus the uncertainties in the neon and argon abundances are
correlated with the uncertainty in the oxygen abundance. From the uncertainties given in
Table 1 of Asplund et al. (2005), we infer that Asplund et al. believe that the uncertainty
in the neon abundance is dominated by the uncertainty in the oxygen abundance and
that the uncertainty in the argon abundance is due to comparable contributions from the
measurement of the oxygen abundance and from the Ar/O ratio.
We have made calculations based upon two extreme assumptions. First, we assume
that all the abundance determinations, including those of oxygen, neon, and argon, are
independent. Second, we assume that the uncertainties in the oxygen, neon, and argon
abundances are completely correlated. Given this second assumption, we set ρ(k, l) = 1.0 in
equation (8) and equation (10) when both k and l represent either O, Ne, or Ar (otherwise,
we take ρ(k, l) = 0.0).
Fortunately, the differences in the flux uncertainties are relatively small when the
uncertainties are calculated in these two extreme ways. The average fractional difference

– 25 –
in a neutrino flux uncertainty due to assuming complete correlation (of the O, Ne, and Ar
uncertainties) or no correlation varies between 6% and 17% of the composition uncertainty
itself, depending upon which partial derivatives (BP04 or BP04+) are used and depending
upon whether we adopt conservative or optimistic uncertainties for the element abundances.
Since the composition uncertainty is only one of a number of different sources of flux
uncertainty (see discussion in § 6), a 17% uncertainty in the composition uncertainty is
acceptable. We certainly do not believe the composition uncertainties discussed in § 3 and
Table 4 are reliable to 17% of the quoted uncertainty. After all, the observers do not as
a rule specify the confidence level which their uncertainties represent (see, however, the
Lodders 2003 analysis of meteoritic abundances).
In compiling Table 7, we again made a conservative assumption, namely, that the
oxygen, neon, and argon uncertainties are completely correlated. Since all three elements
have, for a given neutrino flux, the same sign for their partial derivatives (see Table 1
and Table 2), this procedure results in a larger uncertainty than if we had combined
incoherently the oxygen, neon, and argon uncertainties. The assumption we make here
slightly overestimates the total composition uncertainty assuming the correctness of all the
other numbers that go into the analysis.
In future compilations of solar abundances and their uncertainties, it will be very useful
if the compilers specify the correlation between the difference abundance uncertainties.
5.3. Correlations of meteoritic abundances via a scale factor
Traditionally, the solar abundances of the elements that can be measured in the solar
photosphere or elsewhere in the solar atmosphere are determined relative to the abundance
of hydrogen. However, hydrogen is lost from meteorites. Therefore, the abundances that

– 26 –
Table 7: Neutrino Flux and Rate Uncertainties from All Solar Composition Uncertainties.The abundance uncertainties used in calculating the entries in the second column of thepresent table were obtained using the historical (conservative) composition uncertaintiesthat are listed in the second column of Table 4; the uncertainties from recent analyses (our‘optimistic’ uncertainties) are given in the third column of Table 4 and were used to obtain theentries in the third column of the present table. The uncertainties without parentheses thatare listed in columns (2) and (3) of the table were calculated using partial derivatives fromTable 1 that were obtained with solar models that had the BP04, i.e., the 1998 Grevesse& Sauval solar composition of heavy elements. The uncertainties in parentheses that arelisted in columns (2) and (3) were calculated with partial derivatives from Table 2 that wereobtained with solar models that had the BP04+ recently-determined solar composition (seeTable 1 of Bahcall, Serenelli, & Pinsonneault 2004). The uncertainties in column (4) werecalculated assuming that (see Bahcall & Pinsonneault 2004) the total spread in all modernmeasurements of the heavy element abundance by mass divided by the hydrogen abundanceby mass, Z/X, is equal to the 3σ uncertainty in Z/X, i.e., ∆(Z/X)/(Z/X) = 0.15(1σ).For column (4), the values without parentheses were calculated by Bahcall & Pinsonneault(2004) with the Bahcall & Ulrich (1988) partial derivatives and the values with parentheseswere calculated with the BP04 partial derivatives (see Table 3).
Neutrino Historical Recent Analyses Z/X:
Flux (Conservative) (%) (Optimistic)(%) Historical (%)
pp 0.7 (0.5) 0.3(0.2) 1.0 (1.0)
pep 1.3 (1.0) 0.6(0.5) 2.0 (2.1)
hep 2.0(1.6) 0.9(0.8) 2.6 (2.9)7Be 5.3 (4.6) 2.4(2.2) 8.0 (8.6)8B 11.6 (9.9) 5.3(5.0) 20.0 (22.0)13N 26.2 (25.8) 11.1(11.0) 33.2 (34.1)15O 26.2 (25.7) 11.2(11.0) 37.5 (38.2)17F 48.3 (45.4) 15.6(14.7) 39.1 (41.3)
Experiment SNU SNU SNU
37Cl 0.9(0.8) 0.4(0.4) 1.6 (1.7)71Ga 4.4(4.0) 1.9(1.9) 8.2 (8.7)7Li 5.7(5.3) 2.5(2.5) 10.6 (11.2)
are measured in meteorites are determined relative to some other element, which is usually
taken as Si. The two scales, the atmospheric and the meteoritic, are adjusted to give a

– 27 –
consistent set of values by sliding one of the scales up or down with respect to the other
scale. For specificity, we can think of this procedure as adjusting the meteoritic scale with
respect to the atmospheric scale.
The uniform adjustment of the meteoritic scale implies that there is a correlation of
all of the meteoritic abundances among themselves. The amount of this correlation can be
estimated by calculating how much we have to change the meteoritic scale with respect to
the atmospheric scale in order to significantly affect the goodness of the agreement between
the two scales, which is generally excellent (see Grevesse & Sauval 1998, Lodders 2003,
Asplund et al. 2005). We therefore need to evaluate
σmeteorite, atmosphere =
√
1
N
∑
i
(βmeteorite,i − βatmosphere,i)2 , (11)
where βmeteorite,i and βatmosphere,i are, respectively, the meteoritic and atmospheric
abundances of the element i.
We are interested in the accuracy with which the meteoritic and atmospheric scales can
be brought into agreement for the abundant heavy elements, since it is only the abundant
heavy elements that affect the neutrino fluxes significantly through their contributions to
the radiative opacity. Moreover, it is plausible that the relative abundances are more robust
for elements that are more abundant.
We have evaluated the correlation that is expressed in equation (11) for a number
of different cases. We find that the correlation is small and the general size of the
correlation is robust. For example, we have computed the correlation σmeteorite, atmosphere
for the seven elements with logarithmic abundances relative to hydrogen that are greater
than 6.0 on the usual scale in which the hydrogen abundance is set equal to 12.0 . For
the Lodders (2003) abundances, the unweighted average is σmeteorite, atmosphere = 0.7%
and the weighted average (quadratically combined atmospheric and meteoritic errors) is
σmeteorite, atmosphere = 0.9%. These results are essentially unchanged if we throw out, e.g., the

– 28 –
Ni abundance, which is the least well determined of the sample we are considering. Similar
results are obtained for the Asplund et al. (2005) abundances. We find an unweighted
average of σmeteorite, atmosphere = 1.8% and a weighted average of 2.1%.
The correlated contribution of the uncertainty due to the relative adjustment of the
meteoritic and atmospheric scales depends quadratically upon σmeteorite, atmosphere. It follows
from the definition of the correlation coefficient ρ(k, l) between the uncertainties of the
meteoritic abundances of two elements k 6= l that
ρ(k, l) =σk,l
σkσl
(12)
where σk,l is the covariance between the uncertainties for the two elements and σk and σl
are the uncertainties of each element abundance. The individual uncertainties, σk and σl,
include the quadratically-combined meteoritic measurement uncertainty plus the covariance
from the scale adjustment.
We do not have a good way of calculating the covariance, but we hope that the
covariance will be evaluated in the future by the authors of papers presenting critical
summaries of solar element abundances. We can obtain a reasonable upper limit to the
covariance by assuming that it is, in order of magnitude, the square of σmeteorite, atmosphere
(see eq. [11]).
The precise values of ρ(k, l) depend upon whose compilation of solar abundances one
uses and upon how one defines the sample of abundant heavy elements within the published
list of abundances. However, in order of magnitude, σatmospheric, ∼ σmeteoritic ∼ 0.1 and the
characteristic value of σk,l ∼ 0.01. Hence, ρ(k, l) ∼ 0.01.
Since ρ is small, we can neglect, without making a significant numerical error, the
effects of the relative adjustment of the meteoritic and atmospheric abundance scales in
equation (8) and equation (10). This approximation is satisfactory even though there are

– 29 –
seven times as many off-diagonal terms as diagonal terms, .
In the future, when there is general agreement on the correct solar abundances and
their uncertainties, the effect of the relative adjustment of the meteoritic and atmospheric
scales can be taken into account using equations (8), (10), and (11).
5.4. Comparison of conservative and optimistic uncertainty estimates
Table 7 presents our estimates for the total uncertainty in each calculated neutrino
flux and in each radiochemical rate due to all composition sources. We present in the
table the results from a conservative estimate (column [2]), an optimistic estimate (column
[3]), and the traditional method that uses the total Z/X. The entries in the table were
computed using equation (8) and equation (10), except that we have combined coherently
the uncertainties in the oxygen, neon, and argon abundances as described in § 5.2.
The second column of Table 7 presents our best estimate for the total uncertainty from
all composition uncertainties for each neutrino flux and for the rate of each radiochemical
experiment. The partial derivatives used in these calculations were taken from Table 1
(solar model BP04) and, for the entries enclosed in parentheses, Table 2 (solar model
BP04+). We also used for the second column of Table 7 the conservative individual
abundance uncertainties listed in the second column of Table 4.
We present the much more optimistic estimates of the total composition uncertainties
in the third column of Table 7. The entries in the third column were calculated using
the abundance uncertainties (Asplund et al. 2005) that are listed in the third column of
Table 4. We also used the BP04+ partial derivatives from Table 2.
The conservative composition uncertainties listed in the second column of Table 7 are
typically a factor of two or more larger than the more optimistic composition uncertainties

– 30 –
listed in the third column of the table.
5.5. Uncertainties calculated using total Z/X
The last (fourth) column of Table 7 lists the composition uncertainties that are
computed by using the traditional method of lumping together all heavy elements, i.e.,
using the partial derivatives ∂ ln φi/∂ ln(Z/X) (see eq. [5]). In this calculation, we assumed
that ∆(Z/X)/(Z/X) = 0.15(1σ), based upon the historical time dependence of the
published values of Z/X (Bahcall & Pinsonneault 2004).
The traditional total Z/X, or historical, method (last column of Table 7) yields
(except for the C, N, O neutrino fluxes) composition uncertainties that vary from about
50% larger to a factor of two larger than the conservative uncertainties (column (2) of
Table 7) estimated by our preferred method that is based upon individual abundances
(second column of Table 7 ). The two most important special cases are the 7Be and the
8B neutrino fluxes for which the traditional Z/X method gave uncertainties of 8.0% and
20.0%, respectively. Our best estimates (conservative)using errors on individual abundance
determination are 5.3% and 11.6% for these same two neutrino fluxes. For the CNO
neutrino fluxes, 13N, 15O, and 17F, the estimated total uncertainties are comparable for
both ways of computing the total uncertainties (individual abundances and a single Z/X).
The total composition uncertainties for the 37Cl, 71Ga, and 7Li radiochemical solar
neutrino experiments are reduced by about a factor of two by taking account of the
sensitivities to individual compositions.

– 31 –
6. UNCERTAINTIES FROM ALL KNOWN SOURCES
We present in § 6.1 our estimates for the total uncertainties in the solar neutrino fluxes
calculated with standard solar models. We present uncertainties obtained with our preferred
conservative approach, with a more optimistic approach, and with the traditional Z/X
approach. We compare and discuss in § 6.2 the total uncertainties obtained by different
methods.
6.1. Total uncertainties in neutrino fluxes from all sources
The uncertainties in neutrino fluxes and rates due to all the known sources of
uncertainties, including nuclear reaction rates, radiative opacity, element diffusion, the
solar luminosity as well as element abundances, can be computed using equation (8) and
equation (10). Each separate source of uncertainty is represented by an index j in these
equations. We adopt the uncertainties for all of the sources except element abundances as
presented in the recent discussion by Bahcall & Pinsonneault (2004).
Table 8 presents the total uncertainties from all sources. The structure of Table 8
is similar to Table 7. For both tables, the column labeled ‘Historical’ was calculated
by interpreting as 1σ uncertainties the difference between the best-estimates for element
abundances given by Grevesse & Sauval (1998) and by Asplund et al. (2005). For the third
column, labeled ‘Recent Analyses,’ we adopted the abundance uncertainties given in the
recent review by Asplund et al. (2005). The last column, labeled ‘Z/X: Historical’ assumes
that ∆(Z/X)/(Z/X) = 0.15(1σ). The entries in columns (2) and (3) without parentheses
(in parentheses) were calculated using logarithmic partial derivatives with respect to the
BP04 (BP04+) solar models. The entries without parentheses in the last column, ‘Z/X:
Historical,’ were calculated by Bahcall & Pinsonneault (2004) using the logarithmic partial
– 32 –
Table 8: Neutrino Flux Uncertainties from all known sources. The uncertainties listed in
the table include all known sources of uncertainties (see Bahcall & Pinsonneault 2004). The
labels of the columns have the same meaning as in Table 7. Columns (2)–(4) differ only in the
way the uncertainties due to the solar heavy element abundances were calculated. However,
each entry in the present table includes the quadratically combined total uncertainties from
all sources rather than just the uncertainties from the composition as given in Table 7.
Neutrino Historical Recent Analyses Z/X:
Flux (conservative) (%) (optimistic) (%) Historical (%)
pp 1.0 (0.9) 0.8(0.8) 1.2 (1.3)
pep 1.7 (1.5) 1.3 (1.2) 2.3(2.3)
hep 15.5 (15.5) 15.4 (15.4) 15.6 (15.6)
7Be 10.5 (10.1) 9.3 (9.3) 12.1 (12.5)
8B 16.3 (15.1) 12.6 (12.5) 23.0 (24.8)
13N +31.2−28.1(
+30.9−27.8)
+20.2−15.1(
+20.2−15.1)
+37.3−34.8 (+38.1
−35.6)
15O +33.2−28.8 (+32.8
−28.4)+23.3−16.4(
+23.2−16.4)
+42.7−39.4(
+43.3−40.1)
17F 52.2 (49.5) 25.1 (24.5) 43.8 (45.7)
Experiment SNU SNU SNU
37Cl 1.3( 1.2) 1.0 ( 1.0) 1.8 (1.9)
71Ga +9.5−9.5(
+9.4−9.3)
+8.7−8.6(
+8.7−8.6)
+11.8−11.7 (+12.2
−12.1)
7Li +7.6−7.2(
+7.3−7.0)
+5.6−5.1(
+5.6−5.1)
+11.7−11.5(
+12.3−12.1)
derivatives of Bahcall & Ulrich (1988); the entries in parentheses in column (4) were
calculated with partial derivatives obtained using the BP04 solar model.

– 33 –
6.2. Comparison of total uncertainties obtained with different assumptions
Our preferred, most conservative estimates are given in column (2) of Table 8 and
should be compared with the more optimistic estimates of uncertainties given in column
(3). The total uncertainty in the 8B neutrino flux is most affected by the difference between
the two methods of calculating the composition uncertainties. The conservative approach
yields a 16.3% uncertainty for the calculated 8B solar neutrino flux, while the optimistic
approach yields a 12.5% uncertainty, which is 30% smaller.
The traditional (total Z/X) method of estimating the uncertainty from the solar
composition yields a much larger value for the total uncertainty, 23.0% (24.8% with BP04
partial derivatives used for both cases). The Z/X method therefore overestimates the total
uncertainty from all sources by 41% (51% using BP04 partial derivatives for both cases)
and by a factor of two relative to the optimistic individual composition uncertainties.
The 8B neutrino flux is extremely rare but also extremely important. The SNO (Ahmed
et al. 2004) and Super-Kamiokande (Fukuda et al. 2001) solar neutrino experiments
measure only 8B neutrinos and the chlorine radiochemical experiment (Cleveland et al.
1998) is primarily sensitive to 8B neutrinos. The current accuracy of the experimental
measurement of the 8B solar neutrino flux is about 9% (Ahmed et al. 2004), which is much
less than the theoretical uncertainty. Moreover, the uncertainty in the predicted 8B neutrino
flux is an important parameter in many analyses of neutrino oscillation characteristics that
make use of solar neutrino measurements.
For the p-p, pep, hep, and 7Be solar neutrino fluxes, the difference in the total
neutrino uncertainties between the conservative error estimates (column [2] of Table 4)
and the more optimistic error estimates (column [3] of Table 4) are not large enough
to affect the interpretation of planned or ongoing solar neutrino experiments. Even the
total Z/X method gives estimates for the total flux uncertainties that are similar to the

– 34 –
results obtained by conservative or optimistic assumptions about the individual abundance
uncertainties.
The most abundant neutrino fluxes from the CNO reactions, the 13N and 15O neutrino
fluxes, are very roughly proportional to the assumed CNO abundances. Since the recently
published abundance analyses of the volatile elements (including C, N, and O) are much
lower than previously believed, but with a current quoted error that is relatively small,
the total uncertainties for the CNO neutrino fluxes are about a factor of two larger when
computed using the total Z/X method than the uncertainties that are obtained using the
recent analysis of abundance uncertainties by Asplund et al. (2005). Unfortunately, no
precision experiments to measure the CNO solar neutrinos are currently planned.
If we had combined the O, Ne, and Ar abundance uncertainties incoherently rather
than coherently as was done in constructing Table 8 (see discussion in § 5.2), the total
conservative uncertainty in the 8B neutrino flux would have been 14.4% instead of our
preferred value of 16.3%. The differences between the coherent and incoherent combination
of the O, Ne, and Ar abundance uncertainties are much less important for all the other
solar neutrino fluxes (less than 10% of the total estimated uncertainty, a change which is
beyond the anticipated experimental precision).
7. SUMMARY AND DISCUSSION
In this paper, we have computed for the first time the sensitivity of each solar neutrino
flux to the abundance of each chemical element on the surface of the Sun. With these
computations, we are able to identify which element abundances most strongly affect the
solar neutrino fluxes. Moreover, we are able to calculate a better-founded estimate of
the total uncertainty in each neutrino flux due to composition uncertainties. In previous

– 35 –
treatments, all the uncertainties in the solar chemical composition have been lumped into a
single parameter, the heavy element to hydrogen ratio, Z/X.
The results presented here are important for solar neutrino research since the flux that
is most affected by our more detailed error treatment, the 8B solar neutrino flux, is also
the flux that is measured directly by the SNO and the Super-Kamiokande solar neutrino
experiments.
We summarize in § 7.1 our results for the partial derivatives of each neutrino flux
with respect to each element abundance. We also remark in this subsection on the
historical robustness of the partial derivatives ∂ ln φ/∂ ln(Z/X). We then describe in
§ 7.2 our conservative and optimistic estimates for uncertainties in the individual element
abundances. We summarize our principal results in § 7.3. We first discuss which individual
element abundances contribute most to the neutrino flux uncertainties (§ 7.3.1) and then
we describe the results when the uncertainties from all elements are combined (§ 7.3.2).
Finally, we summarize the uncertainties from all known sources of error (§ 7.3.4). We
present in § 7.4 our final word on the subject of solar abundances and neutrino fluxes.
7.1. Partial derivatives
The principal calculational tool in our analysis is the set of partial derivatives, αij , of
each solar neutrino flux with respect to each element abundance. These partial derivatives
are defined in equation (1) and equation (2) and are presented in Table 1 and Table 2.
Throughout this paper, we present estimates for neutrino flux uncertainties that use
the partial derivatives obtained with the aid of two different solar models, BP04 (which
incorporates the older Grevesse & Sauval 1998 solar abundances) and BP04+ (which
incorporates recent abundance determinations for the volatile elements, see Table 1 of

– 36 –
Bahcall et al. 2004b). The tabulated results in this paper show that the estimated
uncertainties in the neutrino fluxes are essentially the same whether the partial derivatives
αij are calculated using the solar model BP04 or the solar model BP04+. In the tables in
the main text, we present without parentheses (with parentheses) the results obtained using
the BP04 solar model (the BP04+) solar model.
For comparison with earlier results and for testing the robustness of partial derivative
calculations over more than two decades, we present in Table 3 published values from
1982, 1988, and 2004 for the partial derivatives with respect to Z/X. The rms fractional
change in the partial derivatives ∂ ln φ/∂ ln(Z/X) is only 2% when the partial derivatives
of Bahcall & Ulrich (1988) are compared with those obtained using the recent solar model
BP04. Despite all the improvements of the solar model since 1988, the partial derivatives
are practically unchanged.
Table 7 and Table 8 compare in their last columns the uncertainties computed with
the 1988 partial derivatives ∂ ln φ/∂ ln(Z/X) and with the 2004 partial derivatives. The
total uncertainties due to abundances and the total uncertainties due to all sources are
practically the same when computed with the old and new derivatives.
7.2. Abundance uncertainties: conservative and optimistic
We estimate conservatively the uncertainty in the element abundances by comparing
the previously standard (Grevesse & Sauval 1998) and the most recent abundance
determinations (Asplund et al. 2005). We adopt as 1σ the differences between the previous
and the recent abundance determinations; this conservative estimate is our preferred
assessment of the abundance uncertainties. Asplund et al. (2005) give, based upon recent
analyses, abundance uncertainties that are smaller than our conservative estimates. We

– 37 –
adopt as our optimistic estimate of the abundance uncertainties the results given by
Asplund et al. (2005).
Table 4 summarizes the adopted conservative and optimistic uncertainties for the
individual element abundances.
We perform all of our calculations with both the conservative and with the optimistic
estimates for the abundance uncertainties and compare the results obtained with both sets
of abundance uncertainties.
7.3. Results
7.3.1. Flux uncertainties due to individual element abundances
We present in Table 5 and Table 6 the uncertainty in each neutrino flux due to
uncertainties in the determination of each of the most important chemical elements. The
largest uncertainty for both the important 7Be and 8B neutrino fluxes is due to the iron
abundance, which is strongly ionized in the solar interior where the neutrinos are produced.
Oxygen, neon, silicon, and sulphur all contribute significantly to the 7Be and 8B neutrino
flux uncertainties.
The neon abundance is particularly problematic since it cannot be measured directly in
the solar photosphere and escapes from meteorites. The abundance uncertainties estimated
for neon may be regarded as best-guesses based upon our limited understanding of the
environments in which neon is detectable in the Sun.
For the 13N and 15O solar neutrino fluxes, the carbon abundance dominates the
composition uncertainty. Carbon is also the largest contributor to the calculated
composition uncertainty of the basic p-p solar neutrino flux if we adopt the conservative

– 38 –
abundance uncertainties. For the more optimistic abundance uncertainties of Asplund et al.
(2005), iron contributes somewhat more than carbon to the estimated uncertainty in the
p-p neutrino flux.
7.3.2. Combined flux uncertainties from all elements
Table 7 gives for each solar neutrino flux the total uncertainty from all the abundance
determinations. We have used equation (8) to combine the uncertainties from different
chemical elements except for oxygen, neon, and argon. We combine coherently the
abundance uncertainties from oxygen, neon, and argon (see discussion in § 5.2), since
the abundances of neon and argon are measured with respect to oxygen. Our preferred
(conservative) estimated uncertainties are given in the second column of Table 7, whereas the
more optimistic uncertainties are presented in column (3). The conservative uncertainties
are, in all cases, more than a factor of two larger than the optimistic uncertainties.
We present in the fourth column of Table 7 the larger uncertainties estimated using the
traditional lumping-together of all abundance uncertainties into a single ∆(Z/X)/(Z/X).
The Z/X uncertainties are typically somewhat more than a factor of three larger than the
optimistic uncertainties.
The uncertainty for the 8B neutrino flux provides the most dramatic and also the
most important example of the differences between the various ways of calculating the
flux uncertainties. The traditional Z/X method gives a 20% flux uncertainty for 8B
neutrinos. Our conservative estimate using individual element abundances is 11.6%. The
optimistic estimate for the 8B composition uncertainty is only 5% using Asplund et al.
(2005) abundance uncertainties. Thus there is a factor of four difference in the size of
the estimated flux uncertainty depending upon which method is used to estimate the

– 39 –
composition uncertainty.
The uncertainty for the important 7Be neutrino flux also varies by a factor of four
depending upon the method of calculation: 8% (Z/X estimate), 5.3% (conservative
individual abundance uncertainties), and 2.2% (optimistic individual abundance
uncertainties).
7.3.3. The role of correlations
Correlations among the uncertainties of the different element abundances can affect
the calculated uncertainties in the solar neutrino fluxes. The correlations can be taken into
account using equation (8), equation (10), and equation (11). We have made crude estimates
of the correlations in the present paper. We have used ρ(k, l) = 1, when k and l are two
different elements from among O, Ne, and Ar. We have neglected all other correlations.
With these estimates, correlations are not numerically important in determining the final
uncertainties in the solar neutrino fluxes, especially since we advocate using the large,
conservative abundance uncertainties given in the second column of Table 4. In the future,
when the present conflict between recent abundance determinations and helioseismology
measurements is resolved and we can adopt more optimistic estimates for the abundance
uncertainties, it will be desirable to evaluate accurately, using new data, the effects of
correlations on the calculated neutrino fluxes.
7.3.4. Total neutrino flux uncertainties from all known sources
Table 8 gives the total uncertainties from all known sources for each solar neutrino
flux and for the predicted rate of each radiochemical experiment. The uncertainties for
everything except the surface chemical composition of the Sun are taken from Bahcall &
– 40 –
Pinsonneault (2004).
8B neutrino flux uncertainty
The uncertainty for the crucial 8B neutrino flux is most affected by the detailed estimate
using individual abundances. In the traditional Z/X method, the total uncertainty in the
calculated 8B neutrino flux is a whopping 23.0% (actually 24.8% if we use BP04 partial
derivatives rather than the Bahcall & Ulrich 1988 partial derivatives). Our preferred
conservative uncertainty estimate is 16.3%; our optimistic error estimate is only 12.5%.
With our preferred conservative estimate, the composition uncertainty still remains
the largest contributor to the uncertainties in the calculation of the 8B neutrino flux (see
Table 2 of Bahcall & Pinsonneault 2004 for estimates of neutrino flux uncertainties due
to all sources). The conservative composition error for the 8B neutrino flux is 11.6% (see
Table 7 of this paper), which is much larger than the next largest contribution to the
uncertainty, 7.5%, from the low energy cross section factor for the 3He(α, γ)7Be nuclear
fusion reaction (see Table 2 of Bahcall & Pinsonneault 2004).
In order to reduce the composition uncertainty to a level where it is no longer the
largest contributor to the 8B neutrino flux uncertainty, we would need to have confidence in
the optimistic abundance uncertainties. For the optimistic uncertainties, the composition
error for the 8B neutrino flux is only 5% (Table 7). But, it is difficult to be confident
in the optimistic abundance uncertainties since, as described in the introduction of this
paper, the new abundance analyses lead to solar models in conflict with helioseismological
measurements.
The reduced estimated uncertainty for the 8B solar neutrino flux has implications
for solar neutrino research since the 8B neutrino flux is measured by the SNO and
Super-Kamiokande solar neutrino experiments.

– 41 –
The total 8B neutrino flux measured by the neutral current mode of the SNO
experiment (Ahmed et al. 2004) is
φ(8B, SNO) = 0.90φ(8B, BP04 solar model) [1.0 ± 0.09 ± 0.16] , (13)
where the first uncertainty listed in equation (13) is the 1σ measurement error and the
second (larger) uncertainty is the estimated 1σ uncertainty in the solar model calculation
(taken from Table 8). If all the data from solar neutrino and reactor experiments are
combined together, the above relation becomes (Bahcall et al. 2004a):
φ(8B, SNO) = 0.87φ(8B, BP04 solar model) [1.0 ± 0.05 ± 0.16] . (14)
The calculated 8B neutrino flux (Bahcall & Pinsonneault 2004) agrees with the
measured flux to better than 1σ. The theoretical uncertainty is much larger than the
uncertainty in the measurements.
7Be neutrino flux uncertainty
For the 7Be solar neutrinos, which will be measured by the BOREXINO solar neutrino
experiment (see Alimonti et al. 2002), the situation is somewhat different. The largest
contribution to the presently estimated uncertainty in the predicted flux is 8.0% from
the laboratory measurement of the rate of the 3He(α, γ)7Be nuclear fusion reaction (see
Adelberger, et al. 1998). Even our conservative composition uncertainty is only 5.3% for the
7Be neutrino flux (Table 7). However, the situation may change in the near future. A recent
measurement of the 3He(α, γ)7Be reaction by Singh et al. (2005) reports a precision for this
reaction rate which is much better than 5%. If the Singh et al. (2005) result is confirmed
by future measurements, then even for the 7Be solar neutrinos the solar composition will be
the largest contributor to the calculational uncertainty.
– 42 –
p-p, pep, 13N, and 15O neutrino flux uncertainties
The conservative composition uncertainty is the largest contributor to the estimated
uncertainty in the calculation of the p-p, pep, 13N, and 15O solar neutrino fluxes (compare
Table 7 of this paper with Table 2 of Bahcall & Pinsonneault 2004). However, the optimistic
composition uncertainties are less than other uncertainties in calculating these neutrino
fluxes.
The p-p solar neutrino flux has been measured by combining the results from all
the relevant solar neutrino and reactor experiments, together with the imposition of the
luminosity constraint (Bahcall 2002). The result is (Bahcall et al. 2004a)
φ(p-p, all neutrino experiments) = 1.01φ(p-p, BP04 solar model) [1.0 ± 0.02 ± 0.01] , (15)
where the first uncertainty listed in equation (15) is the 1σ measurement error and the
second (smaller) uncertainty is the estimated 1σ uncertainty in the solar model calculation
(taken from Table 8).
Comparisons of Total Uncertainties from Different Methods
Table 8 shows that for all the solar neutrino fluxes produced in the p-p chain except the
8B neutrino flux (i.e., the p-p, pep, hep, and 7Be neutrino fluxes), the total uncertainties
from all sources are similar for the conservative and the Z/X estimates for the composition
uncertainties. Of course, this must be the case if the composition uncertainties are only
a small contribution to the total uncertainties. Indeed for hep neutrinos, the calculated
rate of the fusion reaction is the dominant recognized uncertainty, 15.1% (see Bahcall
and Pinsonneault 2004; Park et al. 2003). But, as we have seen above, the composition
uncertainties are at present the largest contributor to the total uncertainties for all neutrino
fluxes except the hep and the 7Be neutrinos.

– 43 –
The reason that the conservative and the Z/X methods give such similar results is
that the recent change in the abundances of the volatile elements affects in a similar way
the historical average of Z/X and the difference between previous standard and current
element abundances. The recently inferred changes in the volatile element abundances
represent the largest modern revision in the solar element abundances from one epoch of
abundance determinations to its successor.
7.4. Final word
We conclude, as we began, by emphasizing that composition uncertainties are the
most important uncertainties for determining the accuracy of solar neutrino calculations. It
would be desirable if multiple groups would undertake determinations of solar abundances
in order that systematic uncertainties can be more readily assessed. The possibility of
obtaining improved solar spectroscopic data should also be considered. In the future, the
correlations between the uncertainties in different element abundances should be specified
explicitly by researchers determining the abundances. The correlations, which hopefully
will become relevant for precise evaluations of reduced neutrino flux uncertainties, can be
taken into account using the formulae given in this paper.
J. N. B. and A. M. S. are supported in part by NSF grant PHY-0070928. We are
grateful to B. Draine, N. Grevesse, K. Lodders, C. Pena-Garay, M. Pinsonneault, and
D. Sasselov for valuable discussions. We are grateful to E. Lisi and M. Pinsonneault for
insightful comments on a draft of the manuscript.

– 44 –
REFERENCES
Abraham, Z., & Iben, I., Jr. 1971, ApJ, 170, 157
Adelberger, E. G., et al. 1998, Rev. Mod. Phys., 70, 1265
Ahmed, S. N., et al. (SNO Collaboration) 2004, Phys. Rev. Lett., 92, 181301
Alimonti, G., et al. 2002, Astropart. Phys., 16, 205
Allende Prieto, C., Lambert, D. L., & Asplund, M. 2001, ApJ, 556, L63
Allende Prieto, C., Lambert, D. L., & Asplund, M. 2002, ApJ, 573, L137
Asplund, M. 2000, A&A, 359, 755
Asplund, M., Grevesse, N., & Sauval, A. J. 2005, in Cosmic Abundances as Records of
Stellar Evolution and Nucleosynthesis, ASP Conference Series, eds. F. N. Bash, & T.
G. Barnes, astro-ph/0410214
Asplund, M., Grevesse, N., Sauval, A. J., Allende Prieto, C., & Kiselman, D. 2004, A&A,
417, 751
Asplund, M., Nordlund, A., Trampedach, R., & Stein, R. F. 2000, A&A, 359, 743
Badnell, N. R. 2004, astro-ph/0410744
Bahcall, J. N. 1964, Phys. Rev. Lett., 12, 300
Bahcall, J. N. 1966, Phys. Rev. Lett., 17, 398
Bahcall, J. N. 1989, Neutrino Astrophysics (Cambridge, UK: Cambridge University Press)
Bahcall, J. N. 2002, Phys. Rev. C., 65, 025801

– 45 –
Bahcall, J. N., Bahcall, N. A., & Shaviv, G. 1968, Phys. Rev. Lett., 20, 1209
Bahcall, J. N., Basu, S., Pinsonneault, M. H., & Serenelli 2005, ApJ, in press,
astro-ph/0407060
Bahcall, J. N., Cooper, M., & Demarque, P. 1967, ApJ, 150, 723
Bahcall, J. N., Gonzalez-Garcia, M. D., & Pena-Garay, C. 2004a, J. High Energy Phys., 08,
016
Bahcall, J. N., Huebner, W. F., Lubow, S. H., Parker, P. D., & Ulrich, R. K. 1982, Rev.
Mod. Phys., 54, 767
Bahcall, J. N., & Pinsonneault, M. H. 2004, Phys. Rev. Lett., 92, 121301
Bahcall, J. N., Pinsonneault, M. H., & Basu, S. 2001, ApJ, 555, 990
Bahcall, J. N., Serenelli A. M., & Pinsonneault, M. H. 2004b, ApJ, 614, 464
Bahcall, J. N., & Ulrich, R. K. 1971, ApJ, 170, 593
Bahcall, J. N., & Ulrich, R. K. 1988, Rev. Mod. Phys., 60, 297
Basu, S., & Antia, H. M. 2004, ApJ, 606, L85
Boothroyd, A. I., & Sackmann, I. J. 2003, ApJ, 583, 1004.
Couvidat, S., Turck-Chieze, S., & Kosovichev, A. G. 2003, ApJ, 599, 1434
Fiorentini, G., & Ricci, B. 2002, Phys. Lett. B, 526, 186
Fukuda, S., et al. 2001, Phys. Rev. Lett., 86, 5651
Grevesse, N., & Sauval, A. J. 1998, Space Sci. Rev., 85, 161
Lodders, K. 2003, ApJ, 591, 1220
– 46 –
Park, T. S., et al. 2003, Phys. Rev. C, 67, 055206
Schlattl, H., & Weiss, A. 1999, A&A, 341, 272
Sears, R. L. 1964, ApJ, 140, 477
Seaton, M. J., & Badnell, N. R. 2004, MNRAS, 354, 457, astro-ph/0404437
Singh, B. S. N., Hass, M., Nir-El, Y., & Haquin, G. 2005, nucl-ex/0407017
Turcotte, S., & Christensen-Dalsgaard, J. 1998, in Structure and Dynamics of the Interior
of the Sun and Sun-like Stars, Proc. SOHO&GONG Workshop, ed. S. Korzennik, &
A. Wilson [ESA SP-418, Noordwijk: ESA] 561
Watanabe, S., & Shibahashi, H. 2001, Publ. Astron. Soc. Japan, 53, 565
Young, P. A., & Arnett, D. 2005, ApJ (in press), astro-ph/0409658
This manuscript was prepared with the AAS LATEX macros v5.2.


![Homepage [] · 2016-12-11 · Compo on Compos i ± ion Composition Compo si tion Composition Composition Composition Composition ... Cylinder TRIM Steatite TRIM REC TUNING VFO TUNING](https://img.dokumen.tips/doc/110x75/5f99801b70d8f630802d58e4/homepage-2016-12-11-compo-on-compos-i-ion-composition-compo-si-tion-composition.jpg)
![Intelligent Portrait Composition Assistancefuf111/publications/intelligent... · 2017-07-02 · Image Re-Composition: Auto-composition or re-composition systems [3, 4] can passively](https://img.dokumen.tips/doc/110x75/5f6f6a9878decf302e3a6429/intelligent-portrait-composition-fuf111publicationsintelligent-2017-07-02.jpg)