Embed Size (px)
Citation preview

John BlodgettOSEDA, U. of Missouri Columbia
MoGIS, Feb. 2015

//mcdc.missouri.edu/websas/geocorr12.html
Geographic correspondence engine - web application. “12” indicates 2012 geography.
MABLE: Master Area Block Level Equivalency (database used by the application).

The state of Iowa distributes gas tax revenue to counties and cities using a population-based formula.
The state legislature wanted to know what these distributions were for the state house and senate districts.
John Parker with the state’s Legislative Services Agency was assigned the task of getting these numbers.
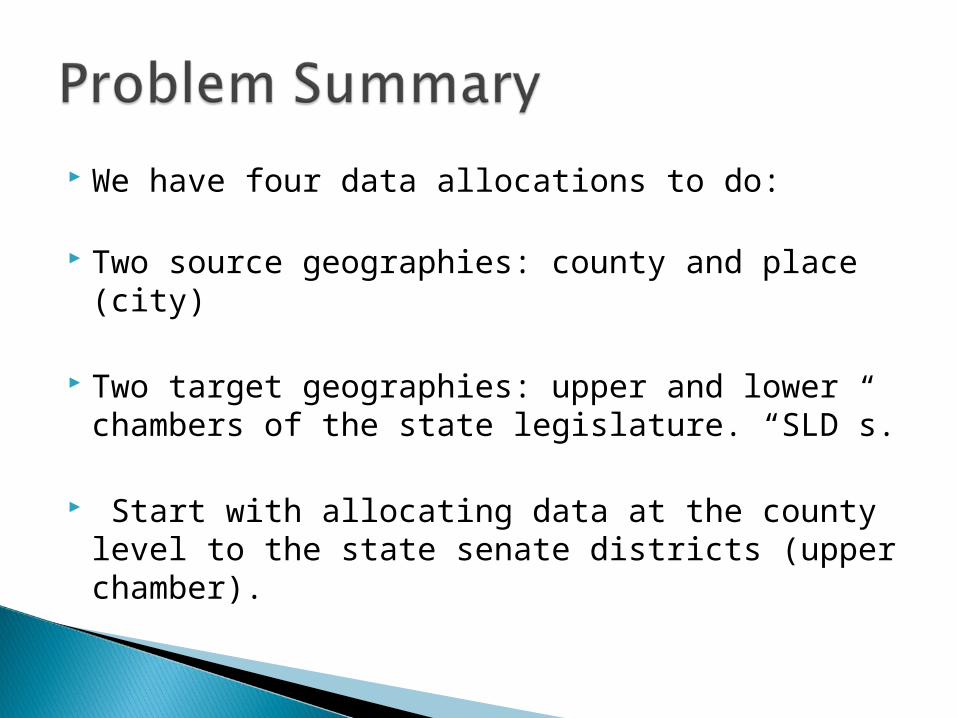
We have four data allocations to do:
Two source geographies: county and place (city)
Two target geographies: upper and lower chambers of the state legislature. “SLD”s.
Start with allocating data at the county level to the state senate districts (upper chamber).

Iowa has 99 counties and 50 state Senate districts.
Many smaller rural counties are entirely within a Senate district which makes it easy to “allocate” their revenue to a district.
Most urban counties encompass multiple districts, requiring that their revenue be allocated to these districts based on the degree of intersection.

We need a “crosswalk file” or “correlation list” that tells us how counties relate to state Senate districts.
When a county intersects more than one district we need some measure of the degree of intersection. We use this to allocate (or disaggregate) the tax revenue figures.
The degree of intersection should be population-based.

We are actually going to need 4 of these correlation lists:
1.County to Senate2.County to House (lower chamber)3.Place (city) to Senate 4.Place (city) to House

Analyze registered voters file containing city, county and SLD codes and write programs to create registered-voter based allocations.
Assuming access to a statewide GIS system with each of the 4 relevant layers accessible, you could generate the 4 crosswalks using polygon-overlay functions. These are usually space-based rather than population-based.
This GIS approach can also do the data allocation and aggregation for you.


Scroll down and select Iowa as the state.
Select County as the Source geocode.
Select State Legislative District – Upper Chamber 2012 as the Target geocode.
Go with default output choices: csv and html files generated, with “Codes and Names”.
Hit Run Request.


The application has generated output in 2 formats: html report and csv file. Links are provided here. Note processing took 1 second.
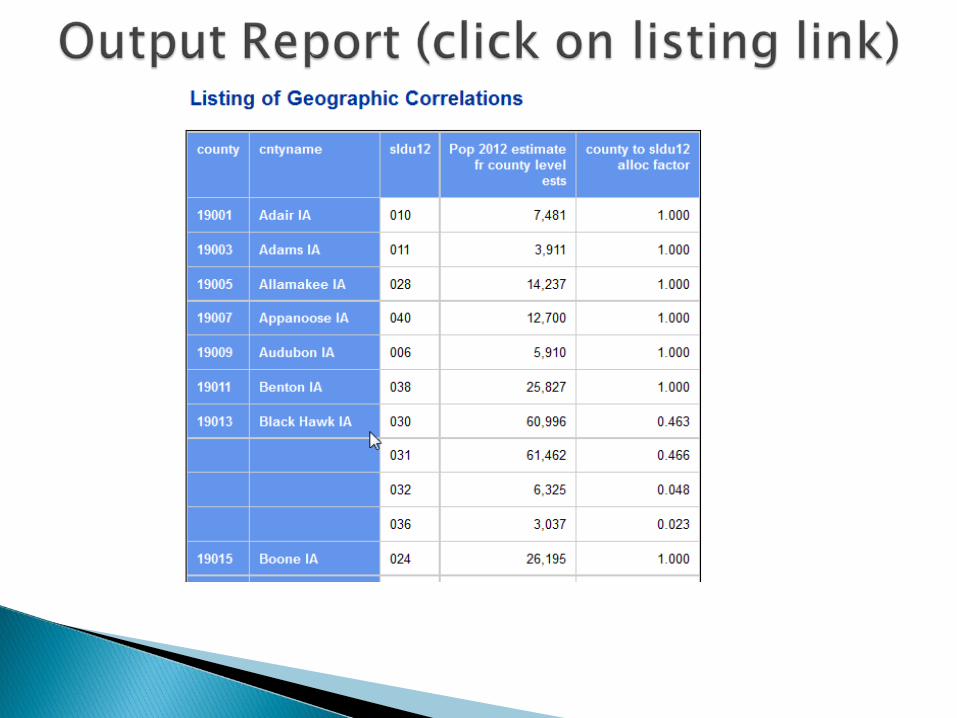

geocorr12geocorr12 extracted the MABLE12 block-level data (Source geos, Target geos, weight var.) for Iowa.
Extract was sorted by the Source geocodes (County) and then the Target codes (District).
Weight variable (2012 pop est) summed for each Source group, and then summed again for the target group within the source group.
The allocation factor was calculated as the ratio of
the target sub pop to the total source pop.

Right click on the csv file link on output page.
Save link as to your desktop (PC).
Open the file on your desktop.
Assuming you have Excel available on your PC and have associated files with .csv extensions to be opened by Excel you should get something like:


It literally takes only seconds to generate the equivalency files. (“crosswalks”)
If you run the first geographic combination & are satisfied you can simply use your browser’s Back button to return to the geocorr form and modify your Source/Target selections and run again.
Even if you have to do some post-processing to get output into Excel, the whole process of generating the 4 correlation files should take less than a few minutes.

You are on your own: the application does not do any post-processing to arrive at the final results.
In this example you would join/merge a file with tax revenue distributions by county with the county-Senate equivalency file.
Allocate/disaggregate the revenue amounts using the afactafact ratios and generate output records with the target geos and allocated tax revenue figures.
Sort by target geos & sum the allocated revenue values by the target SLDs.

Created originally in 1996 to work with 1990 Census geography.
CIESINCIESIN (Consortium for International Earth Sciences Information Network) funded the development.
Written in SAS® with a perl-based web interface written by Hendrik (Henk) Meij of CIESIN.
The application ran on 3 platforms (“mirror sites”) circa 1997: CIESIN, UMSL (U of Mo St. Louis) and (briefly) the Census Bureau (thanks to Chris Stuber).

The current version of the app (geocorr12geocorr12) has a link to the geocorr2kgeocorr2k version which works with 2000 vintage geography.
The geocorr2k version has a link back to the original geocorr90geocorr90 version.
The application has changed very little since 1996 except for the geography used. It runs a lot faster now & has more geocodes.
There was a geocorr10geocorr10 version written in Python that was super fast but had some bugs. It was replaced by geocorr12.

Each version of the application has a corresponding MAGGOTMAGGOT file (Master Area Geographic Glossary of Terms). Linked to just above the Source/Target select lists.
MAGGOT contains background information regarding the geographic units available in the Source/Target lists.
Has lots of links to both our resources and the Census Bureau’s.


MABLE covers the 50 states and D.C. You can do multi-state runs, including the entire
country. (Just do a shift-click on Wyoming on the State selection menu.)
We used to have a problem with timeouts when doing national runs but not much any more.
You can specify sub-state universes using the last
3 sections on the form. You can filter the universe using specific geographic areas or by specifying circular or rectangular subareas.

Geocorr can do circular area processing. You can use it to simply limit the processing to a
circle and sum the weight variable.
It can be used to find the population within n-mile radii of a specified point.
You can also create your own pseudo-geography using rings, e.g. a 3-mile circle and a 3-to-5 mile ring just outside that inner circle.
Since MABLE is a block level database the population figures are quite accurate (for 2010).

We recently ran an analysis of our interactive sas-based web apps covering an 18-month period ending in April, 2014.
The geocorr apps averaged over 100 hits per day (included weekends, holidays, etc.).
Surprisingly the figures for the 3 versions:◦ Geocorr12: 64 hits per day◦ Geocorr2k: 42 hits per day◦ Geocorr90: 5 hits per day.

Several links as shown from the geocorr12.html page. The video-based examples are the most recent and where I would send new users.

“This is one of the greatest things ever!! I did not know you had this web app. Absolutely fantastic!
Thank you very much, you have made my life much easier.” John Parker, Legislative Services Agency, State of Iowa
“I’ve been using your “MABLE/Geocorr12: Geographic Correspondence Engine” and just wanted you to know how useful it is.
In the past, I’ve had to fire up ArcGIS, overlay the shape files and all that, just to get the same information to build a crosswalk.
Your online tool generates this information (and probably more accurately) in just a few seconds. It’s fast, it’s flexible… it’s
awesome.” Bert Sperling, BestPlaces.net

“I just wanted to take some time to let you know how much I have appreciated Missouri’s geographic correspondence engine. Ever since I stumbled upon this as a resource in grad school (circa 2005?), I constantly have this in the back of my mind whenever I have any thoughts related to geography. It’s allowed me to implement a number of different research designs, I have suggested it to many other researchers, and I continue to draw upon this as a go-to resource when I’m thinking of new ideas.
In short, thank you and your team for maintaining this. It’s been a tremendous resource for me.”
Robert Santillano, Mathematica Policy Research. (now with Education Research Alliance, Tulane U.)


![Modelo de Plan de Tesis UPLA Dulio Oseda[1].doc](https://img.dokumen.tips/doc/110x75/5695d0531a28ab9b0292035e/modelo-de-plan-de-tesis-upla-dulio-oseda1doc.jpg)