Embed Size (px)
Citation preview
Johannes Meya; Panu Poutvaara und Robert Schwager:
Pocketbook Voting, Social Preferences, and ExpressiveMotives in Referenda
Munich Discussion Paper No. 2017-12
Department of EconomicsUniversity of Munich
Volkswirtschaftliche FakultätLudwig-Maximilians-Universität München
Online at http://epub.ub.uni-muenchen.de/38425/
Pocketbook Voting, Social Preferences, and
Expressive Motives in Referenda∗
Johannes Meya† Panu Poutvaara‡ Robert Schwager§
May 2017
Abstract
We develop and test a theory of voting and turnout decisions that integrates
self-interest, social preferences, and expressive motives. Our model implies
that if pocketbook bene�ts are relevant, voters either perceive their impact on
the outcome to be non-negligible, or expressive motivations do not play a role
in the decision on how to vote. Conversely, if own pocketbook bene�ts do not
explain voting, then voting is expressive. If the perceived probability of being
pivotal is non-negligible, social preferences and expressive concerns are obser-
vationally equivalent. Our empirical analysis studies collective choices which
are analogous to decisions on local public goods. We consider referenda among
university students on whether to collectively purchase deeply discounted �at
rate tickets for public transportation and cultural amenities. Individual us-
age data allow quantifying the monetary bene�ts associated with each ticket.
As voters had precise information on the individual costs and bene�ts, our
setting comprises a real-world laboratory of direct democracy. We �nd that
monetary bene�ts strongly in�uence participation and voting. However, so-
cial or expressive motives, such as stated altruism, environmental concerns,
and paternalism, are decisive for a signi�cant minority. Our results rule out
purely expressive voting and imply that a substantial share of the electorate
perceived their impact on the outcome to be non-negligible.
Keywords: pocketbook voting, social preferences, expressive voting, instru-
mental voting, public goods, altruism, referendum
JEL classi�cation: D72, H41, D64
∗This is a thoroughly revised and substantially extended version of CESifo Working Paper5267, entitled `Pocketbook voting and social preferences in referenda'. We thank ThushyanthanBaskaran, Mikael Elinder, Ingo Geishecker, Arye Hillman, Henrik Jordahl, Martin Kocher, NiklasPotrafke, Andrei Shleifer, and participants in several seminars and conferences for helpful com-ments, Felix Albrecht for research assistance, and everyone who helped with the data collection.Johannes Meya and Robert Schwager gratefully acknowledge �nancial support from the GermanFederal Ministry of Education and Research under grant number 01PW11004. Responsibility forthe content remains with the authors.†Bundesnetzagentur, Bonn, Germany, [email protected]. The author primarily wrote this paper
when he was doctoral student and postdoctoral researcher at University of Goettingen. The paperis written in the author's private capacity, is exclusively the author's responsibility, and does notin any way re�ect the position of Bundesnetzagentur.‡LMU Munich, Ifo Institute - Leibniz Institute for Economic Research at the University of
Munich, CESifo and IZA, Poschingerstrasse 5, Germany - 81679 Munich, [email protected]§University of Goettingen, Department of Economics, Platz der Goettinger Sieben 3, Germany
- 37073 Goettingen, [email protected]
1
1 Introduction
Referenda are an integral part of democracy in several jurisdictions, such as Cali-fornia and Switzerland. Prominent examples include Proposition 13 in 1978 whichdecisively shaped local public �nances in California by bounding the property taxrate (see California State Board of Equalization, 2012, p. 1) and the referendumon the Gotthard train tunnel in Switzerland in 1992. In recent years, other coun-tries such as Germany, Italy, and the United Kingdom have also increasingly heldreferenda.
Despite their increasing popularity, referenda are controversial. Proponents wel-come the broad public debate and the democratic legitimacy of decisions ensuredby referenda. In this spirit, Rousseau (2012 [1762], p. 65) argued 250 years ago that�Every law the people has not rati�ed in person is null and void � is, in fact, not alaw.� Opponents fear that uninformed or ideologically biased citizens either do notbother to vote or make ine�cient or inequitable decisions. Schumpeter (1994 [1942],p. 261) was convinced that �[the private citizen] expends less disciplined e�ort onmastering a political problem than he expends on a game of bridge.�
We contribute to this debate by theoretically and empirically analyzing the mo-tives for participating in a referendum and for voting against or in favor of a proposal.Our set-up is particularly tailored to public policy decisions at the local level, wherereferenda are especially frequent. The importance of local direct democracy wasalready highlighted by De Tocqueville (1981 [1835], p. 124-127), who emphasizedthat citizens can and should be trusted to decide independently on their own a�airs.In the same spirit, Tiebout (1956) shows that independent local jurisdictions takee�cient decisions on local public goods as long as there are no external e�ects. Byanalyzing voters' motives in such decisions, we contribute to the understanding oflocal democracy.
We propose a simple theoretical model describing the decisions on whether andhow to vote on a tax-�nanced provision of a public good. The motives we considerare `pocketbook voting', social preferences, and expressive concerns. Pocketbookvoting refers to voting along own monetary interests. The latter two motives relateto how the issue on which the vote takes is seen related to others, but di�er inone crucial aspect. Agents with social preferences want to a�ect the outcome ofthe vote, for example because they have altruistic or paternalistic feelings towardsother members of society, or because they care for the common good. In this sense,social preferences, like pocketbook motives, are instrumental. In contrast, expressivevoters derive utility from the act of voting in a way which is in line with what theythink would be socially good or morally just, independently of whether their votea�ects the actual outcome.
2
Using this model, we characterize the individual voting decision as a function ofthe size of monetary gains or losses conferred by the public good, the strength ofsocial or expressive motives, and the perceived probability of changing the referen-dum outcome. When expressive motives are relevant, they will dominate the votingdecision as long as the voter considers the probability of being pivotal to be negli-gible. Conversely, in the presence of expressive concerns, pocketbook bene�ts a�ectthe voting decision only if voters put a su�ciently high estimate on this probability.If this is the case, however, voters also expect to a�ect the outcome for other mem-bers of society. Hence, when pocketbook voting is observed, an empirical �ndingthat voters care about common goods or bene�ts of others cannot unequivocally beattributed to expressive voting, but may as well re�ect social preferences, or bothmotives.
To sum up, our theoretical model implies that if voters consider the probabilityof being pivotal to be strictly positive, social preferences and expressive motivesare observationally equivalent. Therefore, expressive voting can be shown to existonly in the case where pocketbook voting is not observed: if voters do not react topocketbook bene�ts they must believe that their in�uence on the outcome of thevote is negligible, and any concern for common goods or bene�ts of others musttherefore be expressive.
When there are no expressive motives, we show that pocketbook voting a�ectsthe voting decision even when the probability of being pivotal is arbitrarily small.This is because in the absence of expressive voting, all remaining bene�ts of vot-ing are instrumental, and hence weighted down with the same probability. As aconsequence, a theory without expressive motives is consistent with empirically ob-serving pocketbook voting without placing restrictions on the subjective probabilityof a�ecting the outcome.
The decision to participate in the referendum is driven by the same variables asthe voting decision together with bene�ts and costs which are unrelated to how onevotes, such as a civic duty motive for voting and time cost to cast one's ballot. Weshow that when expressive motives are relevant, abstention can be a rational choiceeven when voting is costless. This arises when monetary bene�ts and expressiveconcerns suggest di�erent voting decisions, for example when the individual gainsin monetary terms from the public good but thinks that others lose from it. Then,abstaining is a cheaper way of satisfying expressive motives than voting against one'sown pocketbook interest.
We test our theory with the help of referenda on �at rate tickets for studentsat University of Goettingen in Germany. If passed, these tickets give all studentsthe right to unlimited use of a facility, such as public transportation or culturalamenities. The price of each ticket is very attractive compared with that for indi-
3
vidual purchases; however, buying a ticket becomes compulsory for every studentif the majority vote in favor. These tickets therefore share essential features withtax-�nanced public projects or local public goods. Collectively procuring a ticketreduces the per capita cost of the respective facility so that frequent users stand togain substantially from approval by the majority. At the same time, some votersuse the facility in question very little or not at all but are still forced to pay as muchfor it as anyone else.
Investigating these referenda is particularly promising because they involve easy-to-understand public policy decisions. In particular, in our setting, the voters knewexactly what a ticket would cost, and the bene�ts were clearly de�ned. This setting�ts particularly well to local democracy in an independent, self-�nanced jurisdictionin the sense of Tiebout (1956). In fact, the student body is quite similar to thecitizens of a small jurisdiction, who decide democratically on a public good whichis used and �nanced exclusively by them. In contrast, if the vote had involved,for example, a large infrastructure project, then the costs and bene�ts would havebeen more widespread and uncertain. Di�erent voting decisions could also then re-�ect di�erent subjective expectations for possible deviations from projections anddi�erences in risk attitudes. In this sense, the referenda that we study are like a `lab-oratory' for direct democratic decisions, where confounding in�uences are reducedto a minimum.
Our �rst dataset is on a referendum regarding a ticket for regional trains heldin 2010. This dataset was collected online. It also encompasses students who didnot participate in the referendum, allowing for an analysis of the decision whetherto vote. The second dataset covers votes on tickets for regional trains, culturalfacilities, and local buses held in 2013. It was collected with a paper-based exit poll,therefore being restricted to voters.
Each dataset contains detailed information on usage behavior, votes, politicalpreferences and other characteristics of over a thousand respondents. In the �rstdataset, we construct a monetary measure of the individual bene�ts conferred bythe ticket. To do so, we combine information on the number of trips to visit parentswith regular ticket prices that we derive from parental address data. Subtractingthe price of the �at rate ticket yields a measure of the net monetary savings anindividual student obtains from the ticket. An attractive feature of this measurearises from the fact that the ticket in question covered only rail tracks served byone company, while tracks served by other operators were not included. Hence,residence of parents on either subset of tracks induces a quasi-random variationwhich is unrelated to the variation created by distance to the university. In thesecond dataset, usage is reported in categorical variables.
Additionally, students were asked the extent to which the interests of others
4
shaped their voting decisions. Other motives included social goals, such as pro-moting local cultural life, and expressing protest against the pricing policy of therailway company. These variables capture social preferences and expressive motivesof students.
Our primary focus is on the probability of voting in favor of these tickets. We�nd strong evidence for pocketbook voting. Most students vote in line with theirmonetary interests. In the �rst dataset, among those who gain from the train ticket,a 10 percent increase in net savings raises the probability of voting in favor by 0.6to 0.7 percentage points. This �nding translates into widely di�ering predictions,given that positive net savings vary between zero and more than three thousandeuros per year. Also among those who bene�t less from the ticket than it costs, alower net loss tends to increase the probability to support the ticket, even thoughthe results are mostly not statistically signi�cant. In the second dataset, a studentwho uses a facility very often is between 52 and 77 percentage points more likely tovote in favor of the corresponding ticket than a student who never uses it.
However, our results show that monetary self-interest is not the entire story.Variables capturing social preferences or expressive motives, such as stated altruismand merit good considerations, show highly signi�cant and economically relevante�ects. A sizable share of students who do not stand to gain from a ticket inmonetary terms vote in favor because of such motives. The analysis suggests thatthese motives were likely pivotal in one of the four referenda and close to beingpivotal in another. Together with pocketbook voting, they can rationalize almostall votes cast. In contrast, party preferences are mostly not relevant to the votingdecision.
Based on our theory, the presence of pocketbook voting means that we cannotdistinguish whether the signi�cance of the variables related to other students orpublic good considerations stems from social preferences, expressive motives, orboth. However, our theory also implies that if monetary bene�ts a�ect the votingdecision then voters either perceive the probability to change the outcome to be non-negligible, or expressive motives are absent. From this we conclude that observedbehavior is inconsistent with a theory of purely expressive voting.
In the last part of the paper, the dependent variable is participation in thereferendum. We �nd that among those who gain from the ticket, the probabilityof taking part increases with net savings. This result suggests that a substantialshare of the electorate perceived their impact on the outcome to be non-negligible.Stated altruism is also found to a�ect the participation decision, albeit in a speci�cway. Students who expect that their preferred outcome would cause losses to othersand, at the same time, mention concern for others are less likely to participate. Apossible explanation for this �nding is that abstaining is an attractive compromise
5

when own monetary gains and expressive concerns for others call for di�erent votingdecisions.
The remainder of the paper is structured as follows. In Section 2, we relate ourwork to the literature on voting motives. Section 3 contains the theoretical model onwhich we base our empirical work. Section 4 presents the data and some backgroundinformation. In Section 5, we give a descriptive overview of voting and participationmotives. Econometric results on voting and participation decisions are presented inSections 6 and 7, respectively. Section 8 concludes the paper.
2 Related literature
Our paper contributes to the literature on the motives of voters. A central questionin this literature is the extent to which citizens vote according to their narrowlyde�ned self-interest and to which voting decisions are driven by social considerationsor expressive motives. In addition, research has investigated whether such motivesdetermine the participation decision. Ours is the �rst paper that analyzes both thedecisions whether to vote and how to vote in the presence of self-interest and socialconsiderations.
Pocketbook voting is the starting point in models of income redistribution thatbuild on Meltzer and Richard (1981), in the theory of probabilistic voting (Lindbeckand Weibull, 1993; Dixit and Londregan, 1996) and in the median voter models oflocal public �nance (Romer et al., 1992; Epple and Romano, 1996; Epple et al., 2001).The empirical literature on economic voting has mostly focused on representativedemocracy. Lewis-Beck and Stegmaier (2007) survey more than 400 studies without�nding much evidence for pocketbook voting. Most of these studies su�er fromsevere identi�cation problems: they assume that voters attribute all changes in their�nancial situation to the policies of the incumbent government. When analyzing wellde�ned past policies, Levitt and Snyder (1997) and Manacorda et al. (2011) �ndthat voters increase their support for the government if they have bene�ted fromits transfers in the past. Elinder et al. (2015) �nd strong evidence for prospectivepocketbook voting: voters already react when reforms appear as electoral promises.
Several authors speci�cally seek to empirically detect pocketbook motives in ref-erenda. In an early contribution, Deacon and Shapiro (1975) �nd that voters incities connected to the Bay Area Rapid Transit (BART) system were more likely tofavor a proposition that would shift gas tax revenues to public transportation. Sim-ilarly, voters in precincts that are located near sports stadiums feel more positivelytoward subsidizing them (Coates and Humphreys, 2006). Intriguingly, according toPotrafke (2013), this �nding does not hold for concert halls. Vlachos (2004) con-cludes that voting patterns in the Swedish referendum on EU membership are in
6
line with con�icting regional interests. These studies are based on voting results atregional or local level, while we analyze voting at individual level.
Pocketbook voting has been challenged by the theory of expressive voting, pro-posed by Tullock (1971) and Brennan and Buchanan (1984) and further developedby Brennan and Hamlin (1998), Hillman (2010), and Hamlin and Jennings (2011).This theory maintains that voters perceive their probability of being pivotal to benegligible, and that they derive utility from voting in a particular way irrespectiveof the outcome. In this view, a voter who supports a proposal which bene�ts othermembers of society does not aim at actually raising others' utility, as social pref-erences would imply, but wants to sustain an image as a socially-minded person atlow cost.
Social preferences and expressive motives have to date been neglected in theempirical analysis of real world referenda. This neglect contrasts with experimentalstudies on voting behavior that typically �nd that in addition to monetary self-interest, voting re�ects various types of social preferences. In particular, Tyranand Sausgruber (2006) show that inequity aversion in the sense of Fehr and Schmidt(1999) is important in laboratory elections. Introducing a novel random price votingmechanism, Messer et al. (2010) conclude that subjects' behavior is better explainedby pure altruism than by inequity aversion. Balafoutas et al. (2013) �nd that whilevoting on redistribution is mostly predicted by self-interest, there is greater supportfor redistribution when inequalities are arbitrary than when they re�ect performancein an experimental task. This �nding is in line with the theoretical insights in Piketty(1995) as well as in Bénabou and Tirole (2006) and the conclusions derived by Fong(2001) and Alesina and Angeletos (2005) from survey evidence.
Experimental evidence on expressive voting is mixed. Several studies confrontsubjects with a vote between an own monetary payout and a gift to charity. Insuch a setting, Carter and Guerette (1992) and Fischer (1996) exogenously varythe probability that the individual's choice is decisive. While this has very limitedimpact on support of the charitable option in the experiment conducted by Carterand Guerette (1992), Fischer (1996) �nds that subjects are more likely to supportcharity if they anticipate not to a�ect the outcome. Tyran (2004) allows subjectswho voted against the proposal to withhold their contribution to charity when theproposal passes. He does not �nd any di�erence in behavior between this treatmentand the low-cost situation where the contribution is almost surely independent ofthe individual vote, contradicting expressive voting.
In general, it should be noted that pocketbook voting does not exclude takinginto account what is good for others, or expressing a concern for others. Fiorina(1978) and Markus (1988) conclude that both self-interest and convictions on whatbene�ts society matter to American voters. In Sweden, most survey respondents
7

admitted that their own interest mattered either as much as or more than theirconvictions regarding what bene�ts society when they chose which party to vote for(Carlsson and Johansson-Stenman, 2010).
We also contribute to the literature on voter turnout. Downs (1957) as wellas Riker and Ordeshook (1968) already presented the idea that the more that isat stake, the more likely an individual is to vote. Indeed, Andersen et al. (2014)observe that turnout in Norwegian local elections is higher in jurisdictions withhigh hydropower income. Alternative explanations suggest that voting is driven byethical concerns (Harsanyi, 1980; Coate and Conlin, 2004), social pressure (Gerberet al., 2008; Funk, 2010), expressive motivations (Brennan and Buchanan, 1984;Brennan and Hamlin, 1998; Coate et al., 2008; Hillman, 2010), or social identity(Akerlof and Kranton, 2000; Ben-Bassat and Dahan, 2012; Hillman et al., 2015).
Finally, our paper is also broadly related to the literature that investigates theimpact of direct democracy on the public budget. Referenda are associated withlower public spending in both the US (Matsusaka, 1995) and Switzerland (Feldand Kirchgässner, 2001; Feld and Matsusaka, 2003; Funk and Gathmann, 2011).The focus of our paper di�ers from these contributions in that we do not aim tocompare direct and representative democracy. Nevertheless, our �nding that thosewho bene�t most are most likely to vote suggests that direct democracy does notnecessarily result in underspending.
Extending previous literature, our paper enhances both the theoretical and theempirical understanding of the motives for voting. We propose a theoretical modelof the decisions whether and how to vote which integrates pocketbook motives, in-strumental social preferences and expressive concerns. Empirically, we �nd evidencefor pocketbook voting and show that the likelihood of participating increases withthe personal stake. These results are broadly in line with the contributions men-tioned above. However, we go further by analyzing individual voting decisions inreferenda rather than relying on regional vote shares. Moreover, we study the roleof social preferences and expressive concerns in real world referenda. This comple-ments existing literature on such motives which to date has mostly been con�nedto laboratory experiments.
3 Theoretical framework
We present a simple theoretical framework on how voters decide whether to vote ina referendum, and then how to vote, provided that they decide to vote. We solvethe model backwards, analyzing �rst the decision on how to vote, conditional onvoting. Voting takes place on whether to collectively purchase a public good. If theproposal is passed, all members of society get access to the public good and have to
8
pay for it. We denote the case in which the public good is passed by superscript 1,and the case in which the public good is not passed by superscript 0.
3.1 How to vote if voting
The utility of voters is driven by pocketbook bene�ts, social preferences, and expres-sive motivations. Pocketbook bene�ts arise from the individual's use of the publicgood and the monetary cost he or she has to pay for it, and relate to the outcomeof the vote. Social preferences relate to how the voter values the e�ects of thevoting outcome on other people. They include the valuation of the bene�ts whichother members of the polity enjoy when the public good is provided, the quality oflocal culture, the public transportation system, and the environment. Expressivemotivations are based on personal utility from the act of voting in a certain way,independently on whether this a�ects the outcome of the vote. We describe thesecomponents of utility one after the other, starting with pocketbook bene�ts.
In the context of the collectively purchased tickets we analyze, providing thepublic good amounts to granting free and unlimited use of some facility, �nanced bya compulsory fee t collected from every member of society. In contrast, if the publicgood is not provided, individuals have to pay a price τ > 0 per use of the facility.1
Once the decision on the public good is taken, voter i will choose the intensity ofuse hi, which is non-negative and varies continuously. He or she maximizes a quasi-linear bene�t bi = wi(hi) +mi−Ti. In this expression, mi is voter i's income and Tiis voter i's payment for the use of the facility. The function wi is strictly increasingand strictly concave up to some satiation point, where the marginal bene�t w′i iszero, and stays zero for higher intensities of use. Since some agents may have nopreference at all for the public good, we allow the satiation point to be hi = 0.
If the public good is (is not) provided, we have Ti = t (Ti = τhi), and theresulting optimal use is denoted by h1i (h
0i ). Since any additional use is costless once
the public good is provided, h1i is the satiation point, i.e., w′i(h1i ) = 0. The optimal
value h0i is given by the solution to the �rst order condition w′i(h0i ) = τ if w′i(0) > τ ,
and is h0i = 0 if w′i(0) ≤ τ . Using these values in the bene�t bi, we �nd the indirectutility of individual i in case the public good is provided, b1i = wi(h
1i ) +mi − t, and
in case it is not provided, b0i = wi(h0i ) +mi − τh0i .
We capture the other characteristics of the vote by a vector ai for voter i. Thisvector has K components labelled k = 1, 2, ..., K. For any vector x, we de�nex(−k) as the vector x without the component k. The vector a1
i (a0i ) gives voter i's
estimate of the situation with (without) the public good. Components a1ki (a0ki),
1The price τ is to be interpreted as a payment for a normalized unit of use, say one visit to alocal theater, one bus ride, or traveling a certain distance on local trains.
9
public goodis passed is not passed
in favor λib1i + (ζi +ψi) · a1
i λib0i + ζi · a0
i +ψi · a1ii votes
against λib1i + ζi · a1
i +ψi · a0i λib
0i + (ζi +ψi) · a0
i
Table 1: Utility of voter i resulting from his or her vote and the outcome.
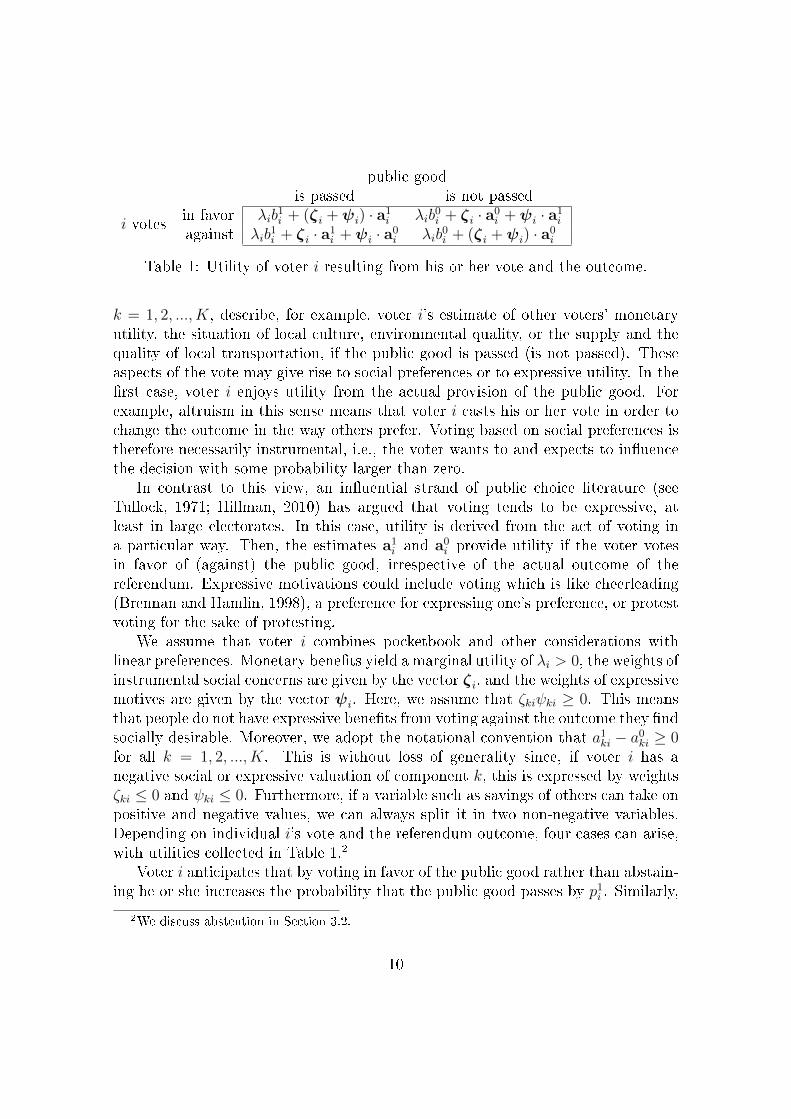
k = 1, 2, ..., K, describe, for example, voter i's estimate of other voters' monetaryutility, the situation of local culture, environmental quality, or the supply and thequality of local transportation, if the public good is passed (is not passed). Theseaspects of the vote may give rise to social preferences or to expressive utility. In the�rst case, voter i enjoys utility from the actual provision of the public good. Forexample, altruism in this sense means that voter i casts his or her vote in order tochange the outcome in the way others prefer. Voting based on social preferences istherefore necessarily instrumental, i.e., the voter wants to and expects to in�uencethe decision with some probability larger than zero.
In contrast to this view, an in�uential strand of public choice literature (seeTullock, 1971; Hillman, 2010) has argued that voting tends to be expressive, atleast in large electorates. In this case, utility is derived from the act of voting ina particular way. Then, the estimates a1
i and a0i provide utility if the voter votes
in favor of (against) the public good, irrespective of the actual outcome of thereferendum. Expressive motivations could include voting which is like cheerleading(Brennan and Hamlin, 1998), a preference for expressing one's preference, or protestvoting for the sake of protesting.
We assume that voter i combines pocketbook and other considerations withlinear preferences. Monetary bene�ts yield a marginal utility of λi > 0, the weights ofinstrumental social concerns are given by the vector ζi, and the weights of expressivemotives are given by the vector ψi. Here, we assume that ζkiψki ≥ 0. This meansthat people do not have expressive bene�ts from voting against the outcome they �ndsocially desirable. Moreover, we adopt the notational convention that a1ki − a0ki ≥ 0for all k = 1, 2, ..., K. This is without loss of generality since, if voter i has anegative social or expressive valuation of component k, this is expressed by weightsζki ≤ 0 and ψki ≤ 0. Furthermore, if a variable such as savings of others can take onpositive and negative values, we can always split it in two non-negative variables.Depending on individual i's vote and the referendum outcome, four cases can arise,with utilities collected in Table 1.2
Voter i anticipates that by voting in favor of the public good rather than abstain-ing he or she increases the probability that the public good passes by p1i . Similarly,
2We discuss abstention in Section 3.2.
10
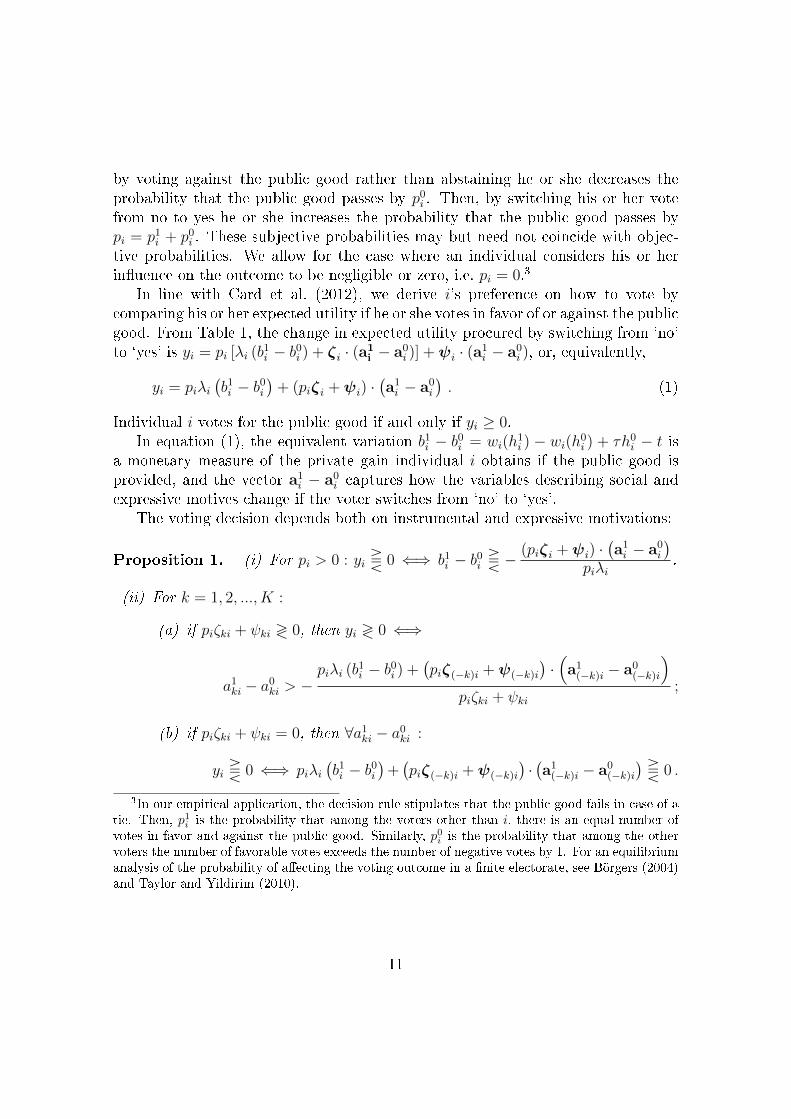
by voting against the public good rather than abstaining he or she decreases theprobability that the public good passes by p0i . Then, by switching his or her votefrom no to yes he or she increases the probability that the public good passes bypi = p1i + p0i . These subjective probabilities may but need not coincide with objec-tive probabilities. We allow for the case where an individual considers his or herin�uence on the outcome to be negligible or zero, i.e. pi = 0.3
In line with Card et al. (2012), we derive i's preference on how to vote bycomparing his or her expected utility if he or she votes in favor of or against the publicgood. From Table 1, the change in expected utility procured by switching from `no'to `yes' is yi = pi [λi (b1i − b0i ) + ζi · (a1
i − a0i )] +ψi · (a1
i − a0i ), or, equivalently,
yi = piλi(b1i − b0i
)+ (piζi +ψi) ·
(a1i − a0
i
). (1)
Individual i votes for the public good if and only if yi ≥ 0.In equation (1), the equivalent variation b1i − b0i = wi(h
1i ) − wi(h
0i ) + τh0i − t is
a monetary measure of the private gain individual i obtains if the public good isprovided, and the vector a1
i − a0i captures how the variables describing social and
expressive motives change if the voter switches from `no' to `yes'.The voting decision depends both on instrumental and expressive motivations:
Proposition 1. (i) For pi > 0 : yi T 0 ⇐⇒ b1i − b0i T −(piζi +ψi) ·
(a1i − a0
i
)piλi
.
(ii) For k = 1, 2, ..., K :
(a) if piζki + ψki ≷ 0, then yi ≷ 0 ⇐⇒
a1ki − a0ki > −piλi (b1i − b0i ) +
(piζ(−k)i +ψ(−k)i
)·(a1(−k)i − a0
(−k)i
)piζki + ψki
;
(b) if piζki + ψki = 0, then ∀a1ki − a0ki :
yi T 0 ⇐⇒ piλi(b1i − b0i
)+(piζ(−k)i +ψ(−k)i
)·(a1(−k)i − a0
(−k)i)T 0 .
3In our empirical application, the decision rule stipulates that the public good fails in case of atie. Then, p1i is the probability that among the voters other than i, there is an equal number ofvotes in favor and against the public good. Similarly, p0i is the probability that among the othervoters the number of favorable votes exceeds the number of negative votes by 1. For an equilibriumanalysis of the probability of a�ecting the voting outcome in a �nite electorate, see Börgers (2004)and Taylor and Yildirim (2010).
11

(iii) (a) If ψi · (a1i − a0
i ) ≷ 0, then yi ≷ 0 ⇐⇒ λi (b1i − b0i ) + ζi · (a1i − a0
i )≥≤ 0 or
(λi(b1i − b0i
)+ ζi · (a1
i − a0i ) ≶ 0 and pi < −
ψi · (a1i − a0
i )
λi (b1i − b0i ) + ζi · (a1i − a0
i )
);
(b) if pi = 0, then yi T 0 ⇐⇒ ψi · (a1i − a0
i ) T 0.
Proof. Each of the three claims follows from solving the relevant cases of yi T 0,
using (1). �The �rst item in this proposition states that if the probability of being pivotal is
strictly larger than zero, the individual will vote in line with own monetary interestprovided this is su�ciently large. Point (a) in the second item states that if socialor expressive preferences are present, their joint e�ect will determine the votingdecision provided they are strong enough. For completeness, point (b) says that ifsocial and expressive weights attached to some aspect are zero, the voting decisionis independent of this aspect. The third item addresses the relative importance ofexpressive and instrumental motives. A voter who has expressive concerns whichare strictly di�erent from zero will always vote in line with these concerns whenthe probability of changing the outcome is su�ciently small. Then pocketbookbene�ts and instrumental social concerns should have no impact on the decision inan estimation based on equation (1).
The following corollary shows that for a voter without expressive concerns, thetrade-o� between pocketbook considerations and social preferences does not dependon the probability of changing the outcome:
Corollary 1. If ψi · (a1i − a0
i ) = 0 and pi > 0, then
yi T 0 ⇐⇒ b1i − b0i T −ζi ·(a1i − a0
i
)λi
.
Proof. The corollary follows directly from Proposition 1(i). �The corollary arises since all bene�ts from changing the outcome are weighted
down equally. Notice that, while this argument does not literally hold if pi is exactlyzero, by a trembling hand argument, a rational voter should still vote as if thisprobability were positive.
An econometric investigation of equation (1) will deliver estimates for the co-e�cient βi := piλi, which measures the impact of pocketbook motives, and thecoe�cients αi := piζi +ψi, which measure the joint impact of social and expressiveconcerns. It is worth noting that these coe�cients are determined only up to acommon scaling factor, as the sign of equation (1) is not a�ected if coe�cients are
12
(a) ψi = 0.
ζi = 0 ζi 6= 0
pi → 0αi = 0 αi 6= 0βi > 0 βi > 0
pi > 0αi = 0 αi 6= 0βi > 0 βi > 0
(b) ψi 6= 0.
ζi = 0 ζi 6= 0
pi → 0αi 6= 0 αi 6= 0βi = 0 βi = 0
pi > 0αi 6= 0 αi 6= 0βi > 0 βi > 0
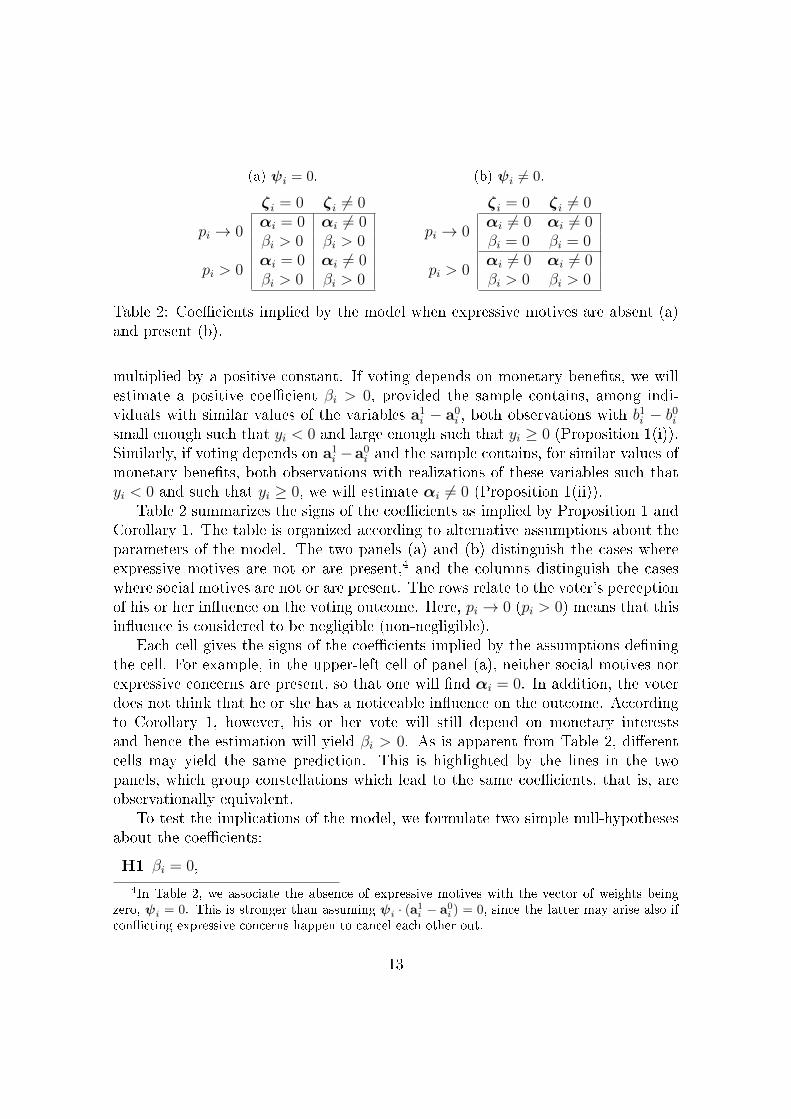
Table 2: Coe�cients implied by the model when expressive motives are absent (a)and present (b).
multiplied by a positive constant. If voting depends on monetary bene�ts, we willestimate a positive coe�cient βi > 0, provided the sample contains, among indi-viduals with similar values of the variables a1
i − a0i , both observations with b1i − b0i
small enough such that yi < 0 and large enough such that yi ≥ 0 (Proposition 1(i)).Similarly, if voting depends on a1
i −a0i and the sample contains, for similar values of
monetary bene�ts, both observations with realizations of these variables such thatyi < 0 and such that yi ≥ 0, we will estimate αi 6= 0 (Proposition 1(ii)).
Table 2 summarizes the signs of the coe�cients as implied by Proposition 1 andCorollary 1. The table is organized according to alternative assumptions about theparameters of the model. The two panels (a) and (b) distinguish the cases whereexpressive motives are not or are present,4 and the columns distinguish the caseswhere social motives are not or are present. The rows relate to the voter's perceptionof his or her in�uence on the voting outcome. Here, pi → 0 (pi > 0) means that thisin�uence is considered to be negligible (non-negligible).
Each cell gives the signs of the coe�cients implied by the assumptions de�ningthe cell. For example, in the upper-left cell of panel (a), neither social motives norexpressive concerns are present, so that one will �nd αi = 0. In addition, the voterdoes not think that he or she has a noticeable in�uence on the outcome. Accordingto Corollary 1, however, his or her vote will still depend on monetary interestsand hence the estimation will yield βi > 0. As is apparent from Table 2, di�erentcells may yield the same prediction. This is highlighted by the lines in the twopanels, which group constellations which lead to the same coe�cients, that is, areobservationally equivalent.
To test the implications of the model, we formulate two simple null-hypothesesabout the coe�cients:
H1 βi = 0,
4In Table 2, we associate the absence of expressive motives with the vector of weights beingzero, ψi = 0. This is stronger than assuming ψi · (a1i − a0i ) = 0, since the latter may arise also ifcon�icting expressive concerns happen to cancel each other out.
13
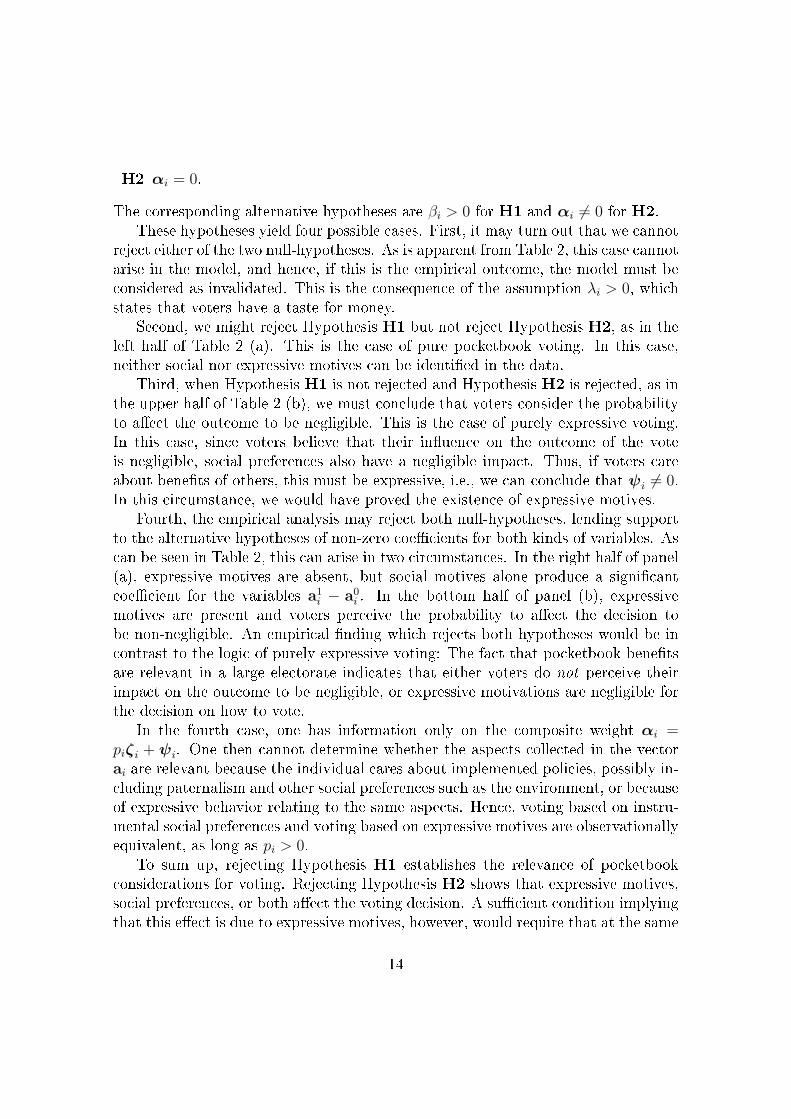
H2 αi = 0.
The corresponding alternative hypotheses are βi > 0 for H1 and αi 6= 0 for H2.These hypotheses yield four possible cases. First, it may turn out that we cannot
reject either of the two null-hypotheses. As is apparent from Table 2, this case cannotarise in the model, and hence, if this is the empirical outcome, the model must beconsidered as invalidated. This is the consequence of the assumption λi > 0, whichstates that voters have a taste for money.
Second, we might reject Hypothesis H1 but not reject Hypothesis H2, as in theleft half of Table 2 (a). This is the case of pure pocketbook voting. In this case,neither social nor expressive motives can be identi�ed in the data.
Third, when Hypothesis H1 is not rejected and Hypothesis H2 is rejected, as inthe upper half of Table 2 (b), we must conclude that voters consider the probabilityto a�ect the outcome to be negligible. This is the case of purely expressive voting.In this case, since voters believe that their in�uence on the outcome of the voteis negligible, social preferences also have a negligible impact. Thus, if voters careabout bene�ts of others, this must be expressive, i.e., we can conclude that ψi 6= 0.In this circumstance, we would have proved the existence of expressive motives.
Fourth, the empirical analysis may reject both null-hypotheses, lending supportto the alternative hypotheses of non-zero coe�cients for both kinds of variables. Ascan be seen in Table 2, this can arise in two circumstances. In the right half of panel(a), expressive motives are absent, but social motives alone produce a signi�cantcoe�cient for the variables a1
i − a0i . In the bottom half of panel (b), expressive
motives are present and voters perceive the probability to a�ect the decision tobe non-negligible. An empirical �nding which rejects both hypotheses would be incontrast to the logic of purely expressive voting: The fact that pocketbook bene�tsare relevant in a large electorate indicates that either voters do not perceive theirimpact on the outcome to be negligible, or expressive motivations are negligible forthe decision on how to vote.
In the fourth case, one has information only on the composite weight αi =piζi + ψi. One then cannot determine whether the aspects collected in the vectorai are relevant because the individual cares about implemented policies, possibly in-cluding paternalism and other social preferences such as the environment, or becauseof expressive behavior relating to the same aspects. Hence, voting based on instru-mental social preferences and voting based on expressive motives are observationallyequivalent, as long as pi > 0.
To sum up, rejecting Hypothesis H1 establishes the relevance of pocketbookconsiderations for voting. Rejecting Hypothesis H2 shows that expressive motives,social preferences, or both a�ect the voting decision. A su�cient condition implyingthat this e�ect is due to expressive motives, however, would require that at the same
14
public goodis passed is not passed
participates λib1i + (ζi +ψi) · a1
i + di − ci λib0i + ζi · a0
i +ψi · a1i + di − civoter i
abstains λib1i + ζi · a1
i +ψi · a−i λib0i + ζi · a0
i +ψi · a−i(a) yi ≥ 0.
public goodis passed is not passed
participates λib1i + ζi · a1
i +ψi · a0i + di − ci λib
0i + (ζi +ψi) · a0
i + di − civoter iabstains λib
1i + ζi · a1
i +ψi · a−i λib0i + ζi · a0
i +ψi · a−i(b) yi < 0.
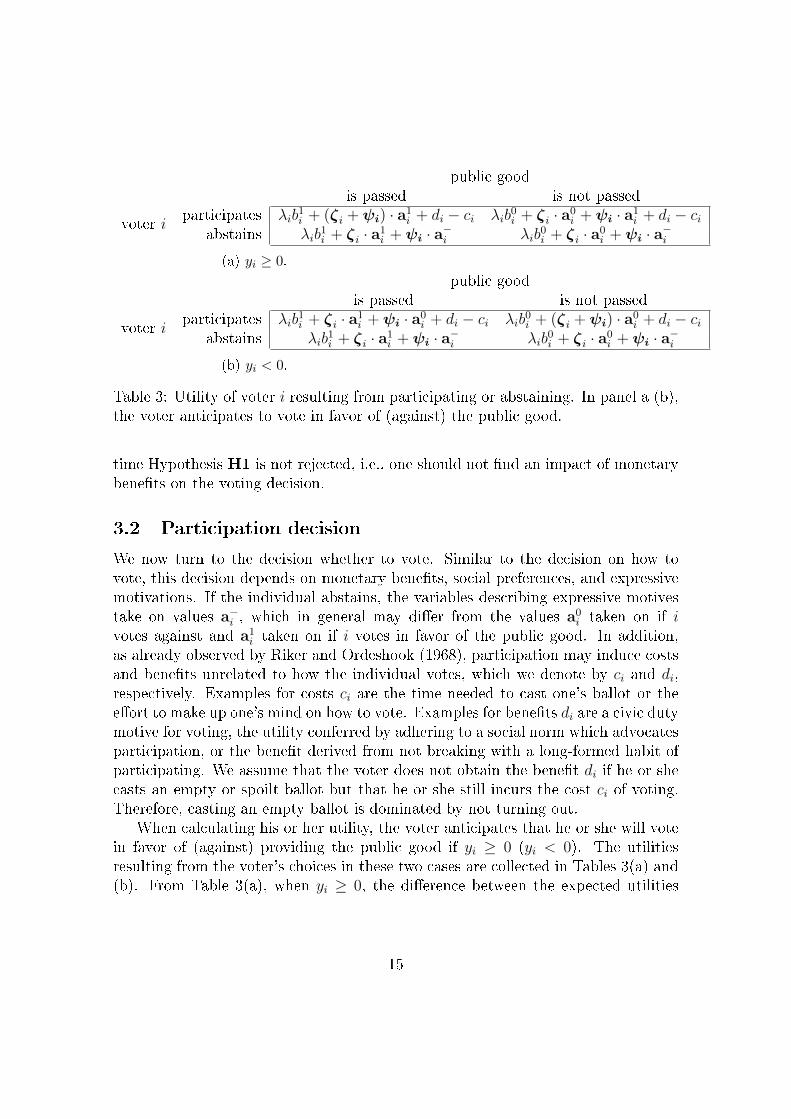
Table 3: Utility of voter i resulting from participating or abstaining. In panel a (b),the voter anticipates to vote in favor of (against) the public good.
time Hypothesis H1 is not rejected, i.e., one should not �nd an impact of monetarybene�ts on the voting decision.
3.2 Participation decision
We now turn to the decision whether to vote. Similar to the decision on how tovote, this decision depends on monetary bene�ts, social preferences, and expressivemotivations. If the individual abstains, the variables describing expressive motivestake on values a−i , which in general may di�er from the values a0
i taken on if ivotes against and a1
i taken on if i votes in favor of the public good. In addition,as already observed by Riker and Ordeshook (1968), participation may induce costsand bene�ts unrelated to how the individual votes, which we denote by ci and di,respectively. Examples for costs ci are the time needed to cast one's ballot or thee�ort to make up one's mind on how to vote. Examples for bene�ts di are a civic dutymotive for voting, the utility conferred by adhering to a social norm which advocatesparticipation, or the bene�t derived from not breaking with a long-formed habit ofparticipating. We assume that the voter does not obtain the bene�t di if he or shecasts an empty or spoilt ballot but that he or she still incurs the cost ci of voting.Therefore, casting an empty ballot is dominated by not turning out.
When calculating his or her utility, the voter anticipates that he or she will votein favor of (against) providing the public good if yi ≥ 0 (yi < 0). The utilitiesresulting from the voter's choices in these two cases are collected in Tables 3(a) and(b). From Table 3(a), when yi ≥ 0, the di�erence between the expected utilities
15
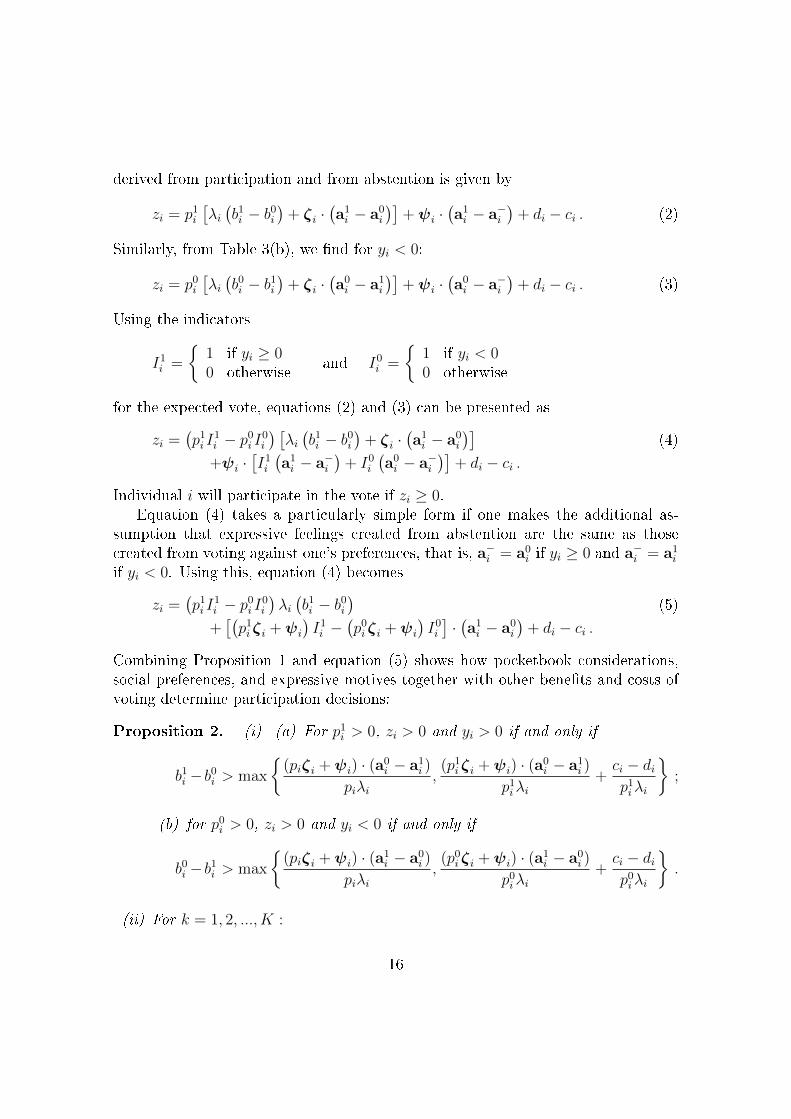
derived from participation and from abstention is given by
zi = p1i[λi(b1i − b0i
)+ ζi ·
(a1i − a0
i
)]+ψi ·
(a1i − a−i
)+ di − ci . (2)
Similarly, from Table 3(b), we �nd for yi < 0:
zi = p0i[λi(b0i − b1i
)+ ζi ·
(a0i − a1
i
)]+ψi ·
(a0i − a−i
)+ di − ci . (3)
Using the indicators
I1i =
{1 if yi ≥ 00 otherwise
and I0i =
{1 if yi < 00 otherwise
for the expected vote, equations (2) and (3) can be presented as
zi =(p1i I
1i − p0i I0i
) [λi(b1i − b0i
)+ ζi ·
(a1i − a0
i
)](4)
+ψi ·[I1i(a1i − a−i
)+ I0i
(a0i − a−i
)]+ di − ci .
Individual i will participate in the vote if zi ≥ 0.Equation (4) takes a particularly simple form if one makes the additional as-
sumption that expressive feelings created from abstention are the same as thosecreated from voting against one's preferences, that is, a−i = a0
i if yi ≥ 0 and a−i = a1i
if yi < 0. Using this, equation (4) becomes
zi =(p1i I
1i − p0i I0i
)λi(b1i − b0i
)(5)
+[(p1i ζi +ψi
)I1i −
(p0i ζi +ψi
)I0i]·(a1i − a0
i
)+ di − ci .
Combining Proposition 1 and equation (5) shows how pocketbook considerations,social preferences, and expressive motives together with other bene�ts and costs ofvoting determine participation decisions:
Proposition 2. (i) (a) For p1i > 0, zi > 0 and yi > 0 if and only if
b1i −b0i > max
{(piζi +ψi) · (a0
i − a1i )
piλi,(p1i ζi +ψi) · (a0
i − a1i )
p1iλi+ci − dip1iλi
};
(b) for p0i > 0, zi > 0 and yi < 0 if and only if
b0i −b1i > max
{(piζi +ψi) · (a1
i − a0i )
piλi,(p0i ζi +ψi) · (a1
i − a0i )
p0iλi+ci − dip0iλi
}.
(ii) For k = 1, 2, ..., K :
16
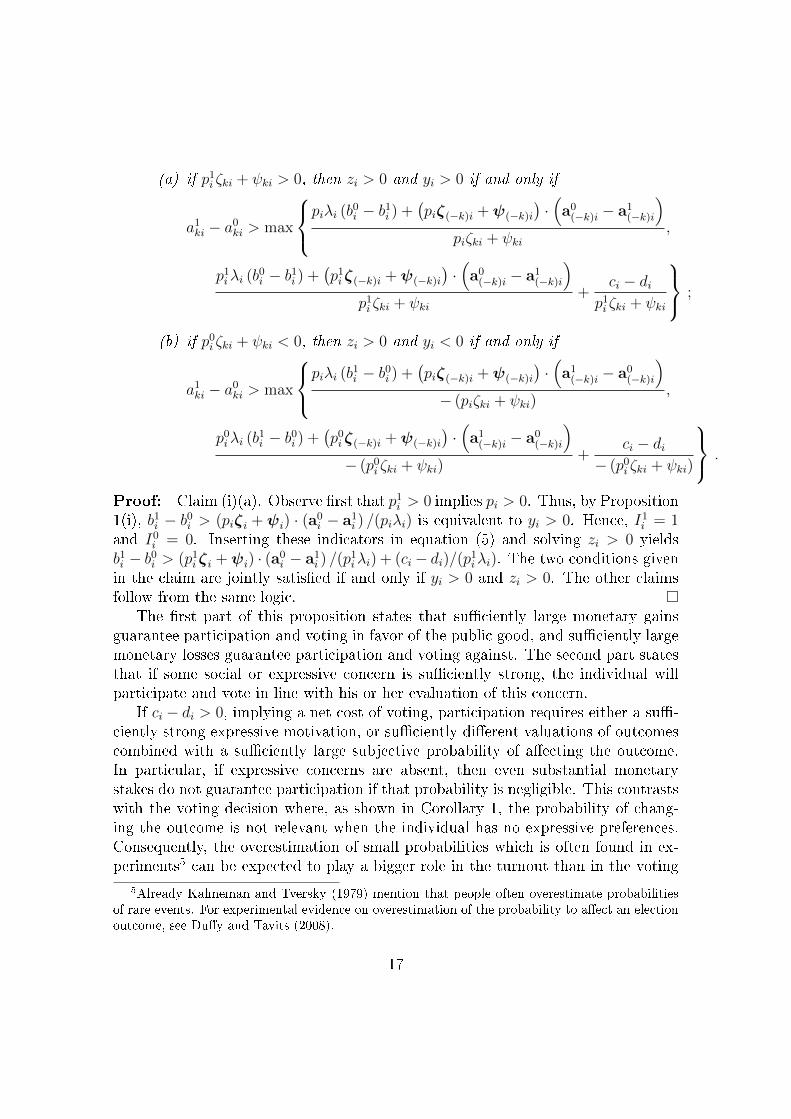
(a) if p1i ζki + ψki > 0, then zi > 0 and yi > 0 if and only if
a1ki − a0ki > max
piλi (b0i − b1i ) +(piζ(−k)i +ψ(−k)i
)·(a0(−k)i − a1
(−k)i
)piζki + ψki
,
p1iλi (b0i − b1i ) +(p1i ζ(−k)i +ψ(−k)i
)·(a0(−k)i − a1
(−k)i
)p1i ζki + ψki
+ci − di
p1i ζki + ψki
;
(b) if p0i ζki + ψki < 0, then zi > 0 and yi < 0 if and only if
a1ki − a0ki > max
piλi (b1i − b0i ) +(piζ(−k)i +ψ(−k)i
)·(a1(−k)i − a0
(−k)i
)− (piζki + ψki)
,
p0iλi (b1i − b0i ) +(p0i ζ(−k)i +ψ(−k)i
)·(a1(−k)i − a0
(−k)i
)− (p0i ζki + ψki)
+ci − di
− (p0i ζki + ψki)
.
Proof: Claim (i)(a). Observe �rst that p1i > 0 implies pi > 0. Thus, by Proposition1(i), b1i − b0i > (piζi +ψi) · (a0
i − a1i ) /(piλi) is equivalent to yi > 0. Hence, I1i = 1
and I0i = 0. Inserting these indicators in equation (5) and solving zi > 0 yieldsb1i − b0i > (p1i ζi +ψi) · (a0
i − a1i ) /(p
1iλi) + (ci − di)/(p1iλi). The two conditions given
in the claim are jointly satis�ed if and only if yi > 0 and zi > 0. The other claimsfollow from the same logic. �
The �rst part of this proposition states that su�ciently large monetary gainsguarantee participation and voting in favor of the public good, and su�ciently largemonetary losses guarantee participation and voting against. The second part statesthat if some social or expressive concern is su�ciently strong, the individual willparticipate and vote in line with his or her evaluation of this concern.
If ci − di > 0, implying a net cost of voting, participation requires either a su�-ciently strong expressive motivation, or su�ciently di�erent valuations of outcomescombined with a su�ciently large subjective probability of a�ecting the outcome.In particular, if expressive concerns are absent, then even substantial monetarystakes do not guarantee participation if that probability is negligible. This contrastswith the voting decision where, as shown in Corollary 1, the probability of chang-ing the outcome is not relevant when the individual has no expressive preferences.Consequently, the overestimation of small probabilities which is often found in ex-periments5 can be expected to play a bigger role in the turnout than in the voting
5Already Kahneman and Tversky (1979) mention that people often overestimate probabilitiesof rare events. For experimental evidence on overestimation of the probability to a�ect an electionoutcome, see Du�y and Tavits (2008).
17
decision.If one �nds that pocketbook motives play a role in determining participation,
then this suggests that the subjective probability of changing the outcome is notnegligible. Consequently, in this case, it is not possible to disentangle instrumentalsocial preferences and expressive motives. Similar to the voting decision, these twomotivations are observationally equivalent if pocketbook considerations contributeto explaining participation. If, instead, pocketbook considerations are not found toa�ect the participation decision, then it is plausible that the joint e�ect of instru-mental social concerns and expressive motives is driven by the latter.
Even for ci − di = 0, the individual may abstain. Proposition 2(i) implies:
Corollary 2. If ci − di = 0, then zi < 0 if
(a) ψi · (a0i − a1
i ) > 0 and(ζiλi
+ψi
piλi
)·(a0i − a1
i
)< b1i − b0i <
(ζiλi
+ψi
p1iλi
)·(a0i − a1
i
); or
(b) ψi · (a1i − a0
i ) > 0 and(ζiλi
+ψi
piλi
)·(a1i − a0
i
)< b0i − b1i <
(ζiλi
+ψi
p0iλi
)·(a1i − a0
i
).
If pocketbook and expressive motivations go in opposite directions the individualwill vote in line with expressive concerns if potential private gains or losses are small,and in line with pocketbook concerns if private gains or losses are large. However,there is an intermediate range, as given in the corollary, where rational abstentionmay occur. This is because casting a di�erent vote a�ects the probability of theoutcome which is better from a pocketbook perspective by more than abstaining,i.e. pi > p0i , p
1i . Moreover, we assume that expressive feelings from abstention are
the same as expressive feelings from voting di�erently than one would have actuallydone. Therefore, in a situation where there is a con�ict between pocketbook andexpressive concerns, abstaining is a cheaper way of obtaining the expressive bene�tthan voting against one's pocketbook interest.
4 Data
4.1 Institutional background
University of Goettingen holds referenda among students on whether they shouldcollectively purchase �at rate tickets, called `Semestertickets '. These tickets give
18
all students at the university the right to use a speci�c service as often as theywish. The price of a ticket is very attractive compared with prices for individualuse; however, once a ticket is accepted in the referendum, its price is collected aspart of the registration fee from all students with very few exemptions.
Referenda are usually held yearly over at least three consecutive days in Januaryat several locations on campus, and voting by mail is possible. For a ticket to beaccepted, a double threshold must be passed: more than 50% of the votes must bein favor of the ticket, and, at the same time, at least 15% of the total number ofstudents must vote in favor.
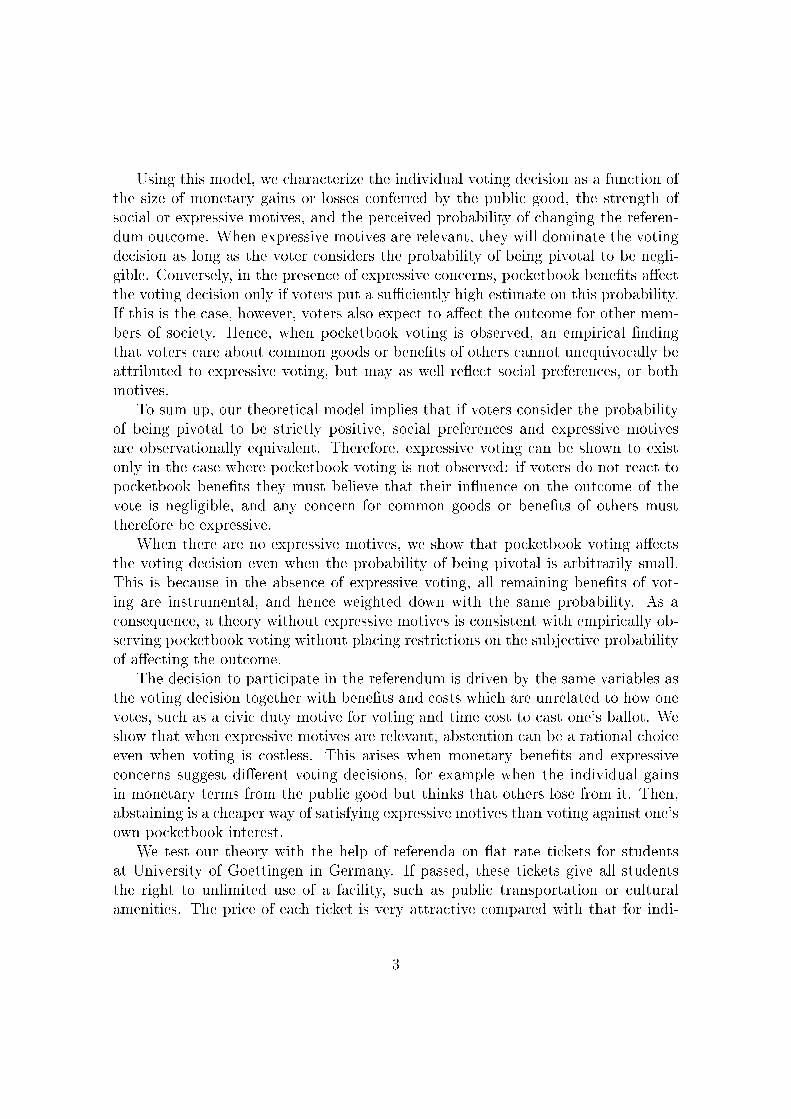
We analyze votes on tickets for regional trains, local buses, and cultural ameni-ties. The most important ticket is the train ticket which grants free travel on localtrains. It was introduced in 2004. Until 2010, it covered, with only minor changes,all of the tracks depicted in Figure 1, served by several operators. The vote in 2010,however, was preceded by complaints from student representatives about the pricecharged by Deutsche Bahn for its section of the tracks. As a result, the ticket wassplit in two. The �rst ticket covered the o�er by the two companies Metronom andCantus, henceforth called the MetroCan ticket (the tracks are depicted as solid redlines in Figure 1), and was approved in January 2010. The second ticket covered thetracks served by Deutsche Bahn and two smaller companies (depicted as blue dashedlines in Figure 1). The latter companies are jointly referred to as Bahn throughoutthis paper. After some negotiations with Bahn, a referendum on the Bahn ticket washeld in May 2010. The ticket cost 42.24 euros per semester. Of approximately 22,800students registered at that time, 25% participated in the referendum, of whom 77%voted yes.
In subsequent years the train ticket proposal again covered all tracks. The cultureticket was introduced in October 2012. It o�ers free or highly discounted entranceto a number of cultural institutions and events, such as theaters, museums, andconcerts. The bus ticket, which covers all buses within Goettingen and two nearbyvillages, would have been a novelty in 2013. In the 2013 referenda, the prices persemester amounted to 8.55 euros for the culture ticket, 25.80 euros for the busticket and 95.04 euros for the train ticket, and approximately 36% of almost 25,600students took part in each referendum. Two of the three referenda were close.While the culture ticket just passed with 53% approval, the bus ticket failed with46% support. An overwhelming majority of 82% voted in favor of the train ticket.
4.2 Dataset I
Information in Dataset I refers to the referendum on the train ticket covering theBahn tracks in May 2010. To obtain data on the voting and traveling behavior
19

Figure 1: Map
The tracks covered by the Bahn (dashed blue lines) and MetroCan (solid red lines) tickets. Thegray lines are state boundaries.
20
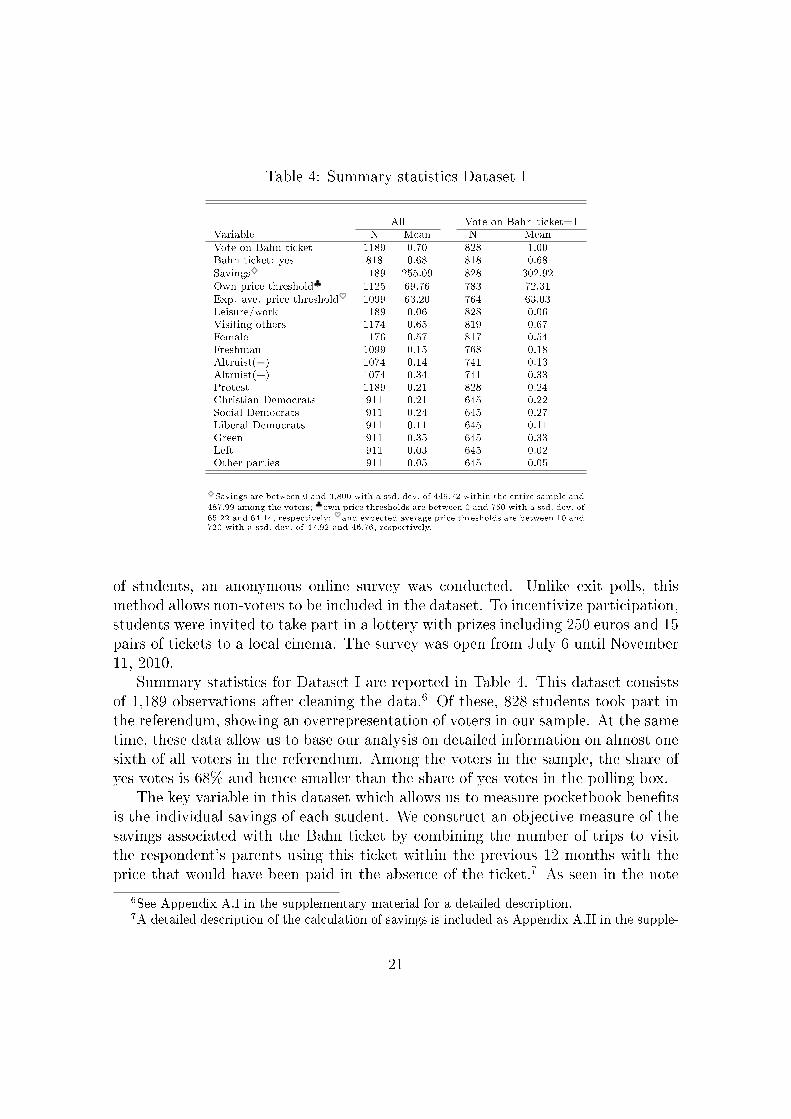
Table 4: Summary statistics Dataset I
All Vote on Bahn ticket=1Variable N Mean N MeanVote on Bahn ticket 1189 0.70 828 1.00Bahn ticket: yes 818 0.68 818 0.68Savings♦ 1189 255.09 828 302.92Own price threshold♣ 1125 69.76 783 72.31Exp. ave. price threshold♥ 1099 63.20 764 63.03Leisure/work 1189 0.06 828 0.06Visiting others 1174 0.65 819 0.67Female 1176 0.57 817 0.54Freshman 1099 0.15 768 0.18Altruist(−) 1074 0.14 741 0.13Altruist(+) 1074 0.34 741 0.33Protest 1189 0.21 828 0.24Christian Democrats 911 0.21 645 0.22Social Democrats 911 0.24 645 0.27Liberal Democrats 911 0.11 645 0.11Green 911 0.35 645 0.33Left 911 0.03 645 0.02Other parties 911 0.05 645 0.05
♦Savings are between 0 and 3,800 with a std. dev. of 449.72 within the entire sample and
487.99 among the voters; ♣own price thresholds are between 0 and 750 with a std. dev. of
65.22 and 64.14, respectively; ♥and expected average price thresholds are between 10 and720 with a std. dev. of 47.92 and 46.76, respectively.
of students, an anonymous online survey was conducted. Unlike exit polls, thismethod allows non-voters to be included in the dataset. To incentivize participation,students were invited to take part in a lottery with prizes including 250 euros and 15pairs of tickets to a local cinema. The survey was open from July 6 until November11, 2010.
Summary statistics for Dataset I are reported in Table 4. This dataset consistsof 1,189 observations after cleaning the data.6 Of these, 828 students took part inthe referendum, showing an overrepresentation of voters in our sample. At the sametime, these data allow us to base our analysis on detailed information on almost onesixth of all voters in the referendum. Among the voters in the sample, the share ofyes votes is 68% and hence smaller than the share of yes votes in the polling box.
The key variable in this dataset which allows us to measure pocketbook bene�tsis the individual savings of each student. We construct an objective measure of thesavings associated with the Bahn ticket by combining the number of trips to visitthe respondent's parents using this ticket within the previous 12 months with theprice that would have been paid in the absence of the ticket.7 As seen in the note
6See Appendix A.I in the supplementary material for a detailed description.7A detailed description of the calculation of savings is included as Appendix A.II in the supple-
21
below Table 4, the savings variable exhibits a large variation. We focus on trips tovisit parents because this is the most common trip students make. Moreover, thetwo larger cities close to Goettingen, namely Hannover and Kassel, which might beattractive leisure destinations, can be reached using the MetroCan ticket (Figure 1).We de�ne the di�erence between savings and the ticket price as net savings. In theeconometric analysis, we use a transformation of net savings to measure pocketbookbene�ts b1i − b0i , as explained in Section 6.1.
A limitation of the savings variable is that students can also use the ticket forother trips than visiting their parents. To complement the savings measure, weasked whether the respondent visited people other than his or her parents using theticket. We coded this information as a binary variable since quantifying monetarysavings from these trips would have required the zip codes of other people visitedand the number of times each of them was visited.
The key variables measuring social preferences or expressive concerns describewhether a student considered bene�ts of others in his or her voting decision and hisor her evaluation of these bene�ts. These variables are based upon the answers tothree questions. The �rst asks what is the highest price at which the respondentwould vote in favor of the Bahn ticket. The second asks about the respondent's beliefabout the corresponding average of fellow students. The third question asks howthe respondent weighted these two considerations in his or her vote. If the votingdecision is in�uenced by the belief about the average preferences of other students,then the respondent is classi�ed as an altruist. The resulting group of altruists isthen split into those who think that students on average will gain from this ticketand those who think that students on average will lose. Accordingly, altruist(+) isequal to one if the student is an altruist and believes that the price threshold of fellowstudents is on average at least as large as the price, and zero otherwise. We de�nealtruist(−) analogously. If the student did not vote, then the third question on theactual voting decision is replaced by a corresponding question about a hypotheticalvoting decision. In the econometric analysis, the binary variables altruist(+) andaltruist(-) are components of the vector (a1
i − a0i ) representing social preferences or
expressive concerns.The questionnaire also allowed students to enter free text regarding the primary
reasons to vote for or against the Bahn ticket. To use this qualitative information,a content analysis was performed to identify the relevant topics. Afterward, threeraters independently coded all of the answers with respect to whether a topic didappear. Finally, an indicator variable was de�ned that is equal to one if at least twoof the three raters independently identi�ed the topic in the statement given and zerootherwise. We use two variables resulting from this qualitative analysis. The �rst
mentary material.
22

item, leisure/work, complements our measures of pocketbook bene�ts. It captureswhether the student mentioned leisure activities other than visiting people, suchas exploring the region, or work-related usage. The second item emerging from thecontent analysis is protest : some students expressed their unwillingness to accept theprice of the ticket or feared that accepting the conditions would foster future priceincreases. It is plausible that this variable represents primarily expressive concerns,but it can also be viewed as a social consideration if students strategically cast aprotest vote. Among the voters, the shares of students referring to leisure/work andprotest are approximately 6% and 24%, respectively.
The control variables in this dataset include gender, the party for which thestudent voted in the federal election in 2009 and whether the student is a freshman.Being a freshman is relevant because the �rst-year students in the dataset only beganuniversity in October 2009. Thus, they could not use the ticket for a full year whichbiases the savings variable downwards.
4.3 Dataset II
Dataset II covers the referenda on all three tickets that took place in January 2013and was collected using exit polls. After leaving the polling place, students wereapproached by members of the survey team and asked to take part in a paper-basedsurvey. To preserve anonymity, cubicles similar to polling booths were installed.Participation was incentivized by a lottery with prizes of 200, 100 and 50 euros.
After excluding those students who did not provide any voting decision, DatasetII contains 1,334 observations. Summary statistics are shown in Table 5. Withinour sample, the shares of yes votes for all three tickets are slightly higher than therespective overall shares. The students in the dataset would have just passed thebus ticket, which narrowly missed the 50% approval threshold in the referendum.However, because our sample contains detailed information on one seventh of allthe votes cast, we are con�dent that these deviations are of minor importance whenanalyzing individual voting decisions.
Pocketbook bene�ts b1i−b0i are measured by categorical variables on the intensityof use, de�ned di�erently for the tickets (Table 5). For the train and culture tickets,students were asked about their use of these amenities within the last 12 monthsand the year before the ticket had been introduced, respectively. For the bus ticket,the intensity of use refers to teaching periods during term. In addition, studentswere asked if they would buy the ticket for themselves if the ticket were rejected inthe referendum but were available for purchase at the same price on an individualbasis. This provides a revealed preference measure of to what extent pocketbookbene�ts alone rationalize voting decisions on each ticket.
23

Table 5: Summary statistics Dataset II
Variable N MeanTrain ticket
Train ticket: yes 1252 0.86Would buy it 1248 0.64Never 1321 0.07Rarely (≤ 5/year) 1321 0.17Sometimes (monthly) 1321 0.32Often (weekly) 1321 0.21Very often (≥ 2/week) 1321 0.24Savings to others important 1292 0.47Environment important 1284 0.38Bus ticket♦
Bus ticket: yes 1246 0.51Would buy it 1276 0.37Never 1329 0.40Rarely (1 or 2/semester) 1329 0.24Sometimes (monthly) 1329 0.13Often (weekly) 1329 0.09Very often (≥ 2/week) 1329 0.14Savings to others important 1280 0.23Strengthening bus important 1245 0.12Culture ticket
Culture ticket: yes 1283 0.54Would buy it 1233 0.44Never 1234 0.56Rarely (1 or 2/year) 1234 0.25Sometimes (3 to 5/year) 1234 0.12Often (6 to 10/year) 1234 0.04Very often (> 10/year) 1234 0.03Savings to others important 1235 0.24Others should go important 1201 0.29Strengthening local culture important 1229 0.39Control variables
Female 1276 0.50Freshman 1318 0.30Christian Democrats 1140 0.26Social Democrats 1140 0.29Liberal Democrats 1140 0.04Green 1140 0.31Left 1140 0.05Other parties 1140 0.05Economic sciences 1322 0.30Social sciences 1322 0.24Forestry/Agriculture 1322 0.06Humanities 1322 0.27Geology/Geography 1322 0.03Law 1322 0.11Natural sciences 1322 0.08Other �elds 1322 0.03
♦ Intensity of the use of the bus ticket refers to thelecture period.
24
For each of the three tickets, the vector (a1i − a0
i ) representing social preferencesor expressive concerns contains as a common component information on whetherthe respondent considered savings to other students to be important in his or hervote. The answers to these questions were given on a four-point Likert scale rangingfrom `not important' to `important'. Furthermore, we asked about other motives,such as environmental aspects in the case of the train ticket or strengthening localtransportation or local cultural life in the case of the bus or culture tickets, respec-tively, using the same Likert scale. In Table 5, we give the shares of students whoreplied that these other considerations were important. This binary coding is alsoused in the regression analysis presented in Section 6.
Additional control variables include gender, �elds of study,8 and being a fresh-man. Moreover, political preferences were captured by a question on how the re-spondent would vote in a federal election if this election were to take place thefollowing Sunday.
5 The big picture
In this section, we take a closer look at the data in a descriptive analysis.
5.1 The voting decision
The big picture that emerges is that there is strong evidence for pocketbook votingbut that social preferences or expressive motivations also play an important role.In terms of the theory, this means that both null-hypotheses H1 and H2 are re-futed. As discussed in Section 3.1, this suggests that either voters expect to have anon-negligible impact on the outcome, or that expressive voting is weak for a vastmajority of voters. Hence, our �ndings rule out the case of purely expressive voting.
We �rst give the evidence for pocketbook voting in the 2010 vote on the Bahnticket. For this purpose, we combine the savings variable with the information onwhether students used the ticket for visits other than those to their parents. Thisallows us to de�ne those for whom savings from visiting parents were less than theprice of the ticket and who neither visit other people using the ticket nor mentionleisure or work-related trips as losers in terms of private bene�ts. Similarly, we canclassify those for whom the savings from visiting parents exceeded the price of theticket as winners. Those for whom savings from visiting parents fell short of theprice of the ticket but who also mentioned other trips are a middle category, in
8Due to the high number of polling stations, the survey team could not cover all of the stationsduring open hours on all three days. Therefore, the faculties of Law, Humanities, EconomicSciences and Social Sciences are overrepresented in the dataset.
25

which we cannot say for sure whether the student in question privately gained orlost from the ticket. Of the 815 voters in Dataset I, 24% are classi�ed as losers and49% as winners.
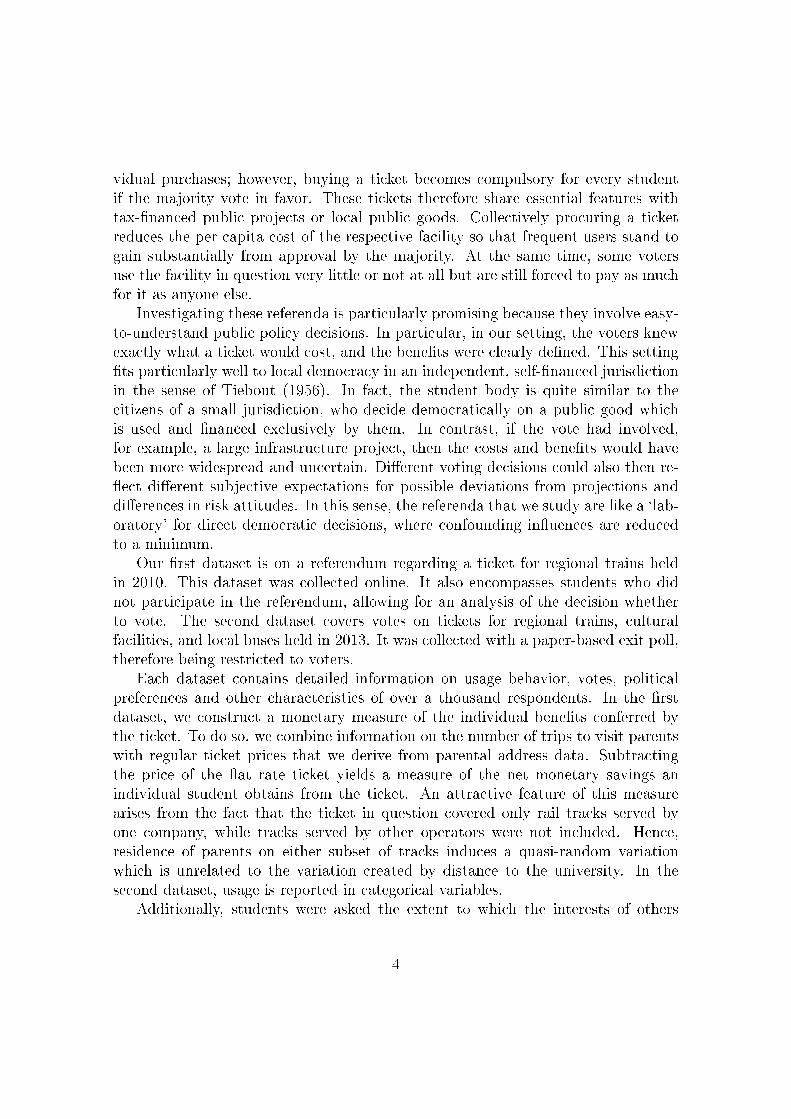
Figure 2 depicts the share of yes votes for losers, the middle category, and win-ners. To illustrate how voting depends on the magnitude of pocketbook gains, theshare of yes votes is calculated separately for each quartile of savings among the win-ners. The picture that we �nd is very much in line with pocketbook voting. Overall,92% of the winners voted in favor of the ticket and 75% of the losers against. Amongthe winners, we see that the share of yes votes increases from 80% in the �rst quartileto 98% in the last.
Figure 2: Savings and share of yes votes � Dataset I
0.2
.4.6
.81
Sha
re o
f yes
vot
es
Quartile of savings greater than price
Loser Moderate sav.& add. gains 1st 2nd 3rd 4th
Losers' savings do not cover the ticket price, and they neither visit other people using the ticket nor mentionleisure/work usage. The savings of the second group alone do not cover the ticket price; however, they mentionother trips. The last four bars refer to respondents whose savings exceed the ticket price.
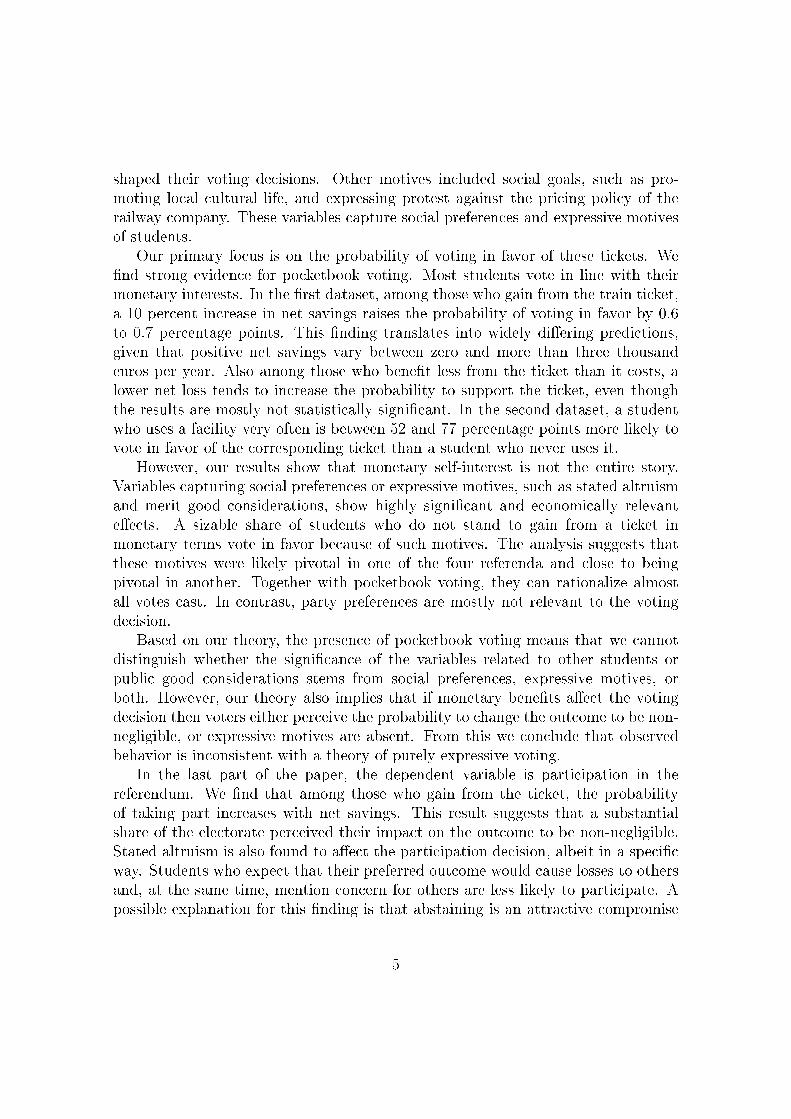
A corresponding picture of strong pocketbook voting also arises from DatasetII. Figure 3 depicts the share of yes votes depending on how intensively the voter
26
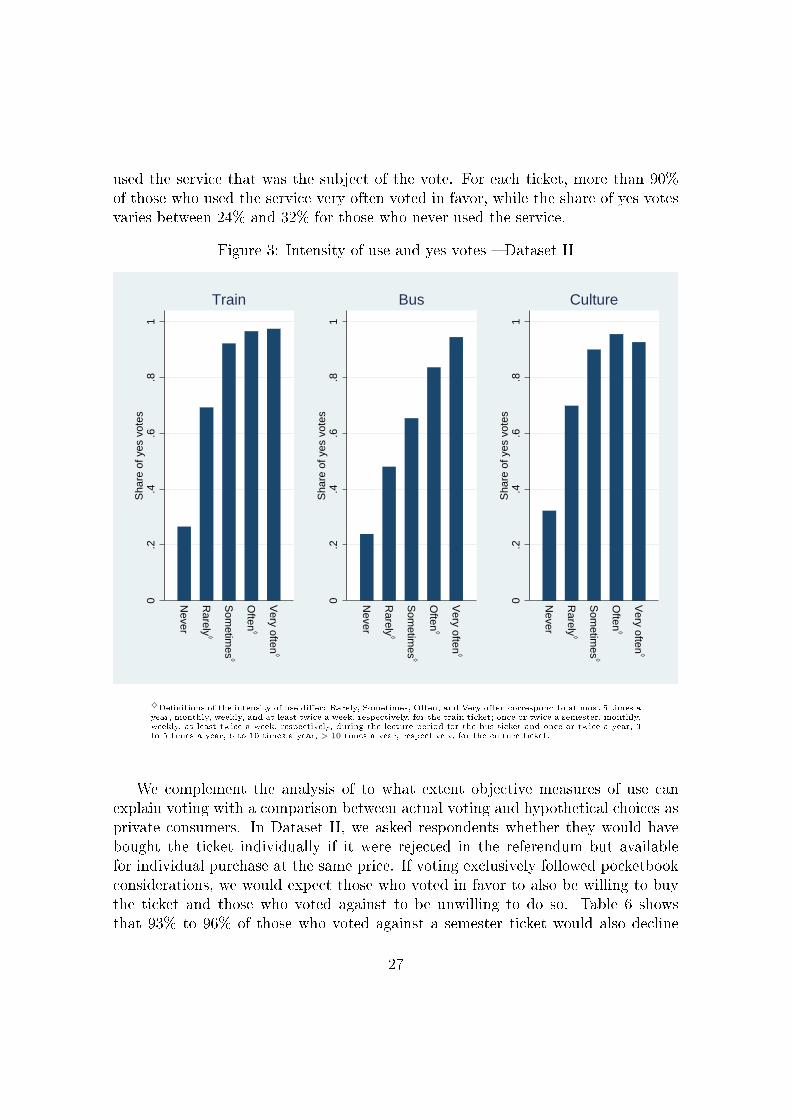
used the service that was the subject of the vote. For each ticket, more than 90%of those who used the service very often voted in favor, while the share of yes votesvaries between 24% and 32% for those who never used the service.
Figure 3: Intensity of use and yes votes � Dataset II
0.2
.4.6
.81
Sha
re o
f yes
vot
es
Never
Rarely
à
Som
etimes
à
Often
à
Very often
à
Train
0.2
.4.6
.81
Sha
re o
f yes
vot
es
Never
Rarely
à
Som
etimes
à
Often
à
Very often
à
Bus
0.2
.4.6
.81
Sha
re o
f yes
vot
es
Never
Rarely
à
Som
etimes
à
Often
à
Very often
à
Culture
♦De�nitions of the intensity of use di�er: Rarely, Sometimes, Often, and Very often correspond to at most 5 times ayear, monthly, weekly, and at least twice a week, respectively, for the train ticket; once or twice a semester, monthly,weekly, at least twice a week, respectively, during the lecture period for the bus ticket and once or twice a year, 3to 5 times a year, 6 to 10 times a year, > 10 times a year, respectively, for the culture ticket.
We complement the analysis of to what extent objective measures of use canexplain voting with a comparison between actual voting and hypothetical choices asprivate consumers. In Dataset II, we asked respondents whether they would havebought the ticket individually if it were rejected in the referendum but availablefor individual purchase at the same price. If voting exclusively followed pocketbookconsiderations, we would expect those who voted in favor to also be willing to buythe ticket and those who voted against to be unwilling to do so. Table 6 showsthat 93% to 96% of those who voted against a semester ticket would also decline
27
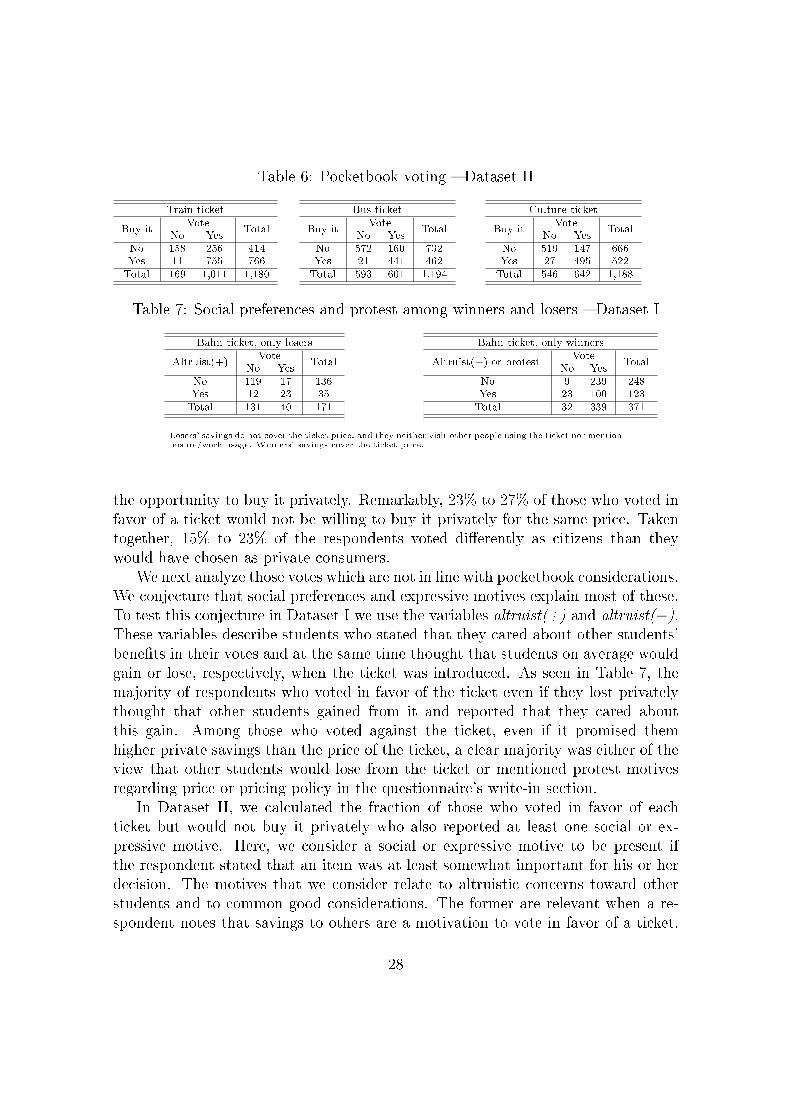
Table 6: Pocketbook voting � Dataset II
Train ticket
Buy itVote
TotalNo Yes
No 158 256 414Yes 11 755 766Total 169 1,011 1,180
Bus ticket
Buy itVote
TotalNo Yes
No 572 160 732Yes 21 441 462Total 593 601 1,194
Culture ticket
Buy itVote
TotalNo Yes
No 519 147 666Yes 27 495 522Total 546 642 1,188
Table 7: Social preferences and protest among winners and losers � Dataset I
Bahn ticket, only losers
Altruist(+)Vote
TotalNo Yes
No 119 17 136Yes 12 23 35Total 131 40 171
Bahn ticket, only winners
Altruist(−) or protest VoteTotal
No YesNo 9 239 248Yes 23 100 123Total 32 339 371
Losers' savings do not cover the ticket price, and they neither visit other people using the ticket nor mentionleisure/work usage. Winners' savings cover the ticket price.
the opportunity to buy it privately. Remarkably, 23% to 27% of those who voted infavor of a ticket would not be willing to buy it privately for the same price. Takentogether, 15% to 23% of the respondents voted di�erently as citizens than theywould have chosen as private consumers.
We next analyze those votes which are not in line with pocketbook considerations.We conjecture that social preferences and expressive motives explain most of these.To test this conjecture in Dataset I we use the variables altruist(+) and altruist(−).These variables describe students who stated that they cared about other students'bene�ts in their votes and at the same time thought that students on average wouldgain or lose, respectively, when the ticket was introduced. As seen in Table 7, themajority of respondents who voted in favor of the ticket even if they lost privatelythought that other students gained from it and reported that they cared aboutthis gain. Among those who voted against the ticket, even if it promised themhigher private savings than the price of the ticket, a clear majority was either of theview that other students would lose from the ticket or mentioned protest motivesregarding price or pricing policy in the questionnaire's write-in section.
In Dataset II, we calculated the fraction of those who voted in favor of eachticket but would not buy it privately who also reported at least one social or ex-pressive motive. Here, we consider a social or expressive motive to be present ifthe respondent stated that an item was at least somewhat important for his or herdecision. The motives that we consider relate to altruistic concerns toward otherstudents and to common good considerations. The former are relevant when a re-spondent notes that savings to others are a motivation to vote in favor of a ticket.
28
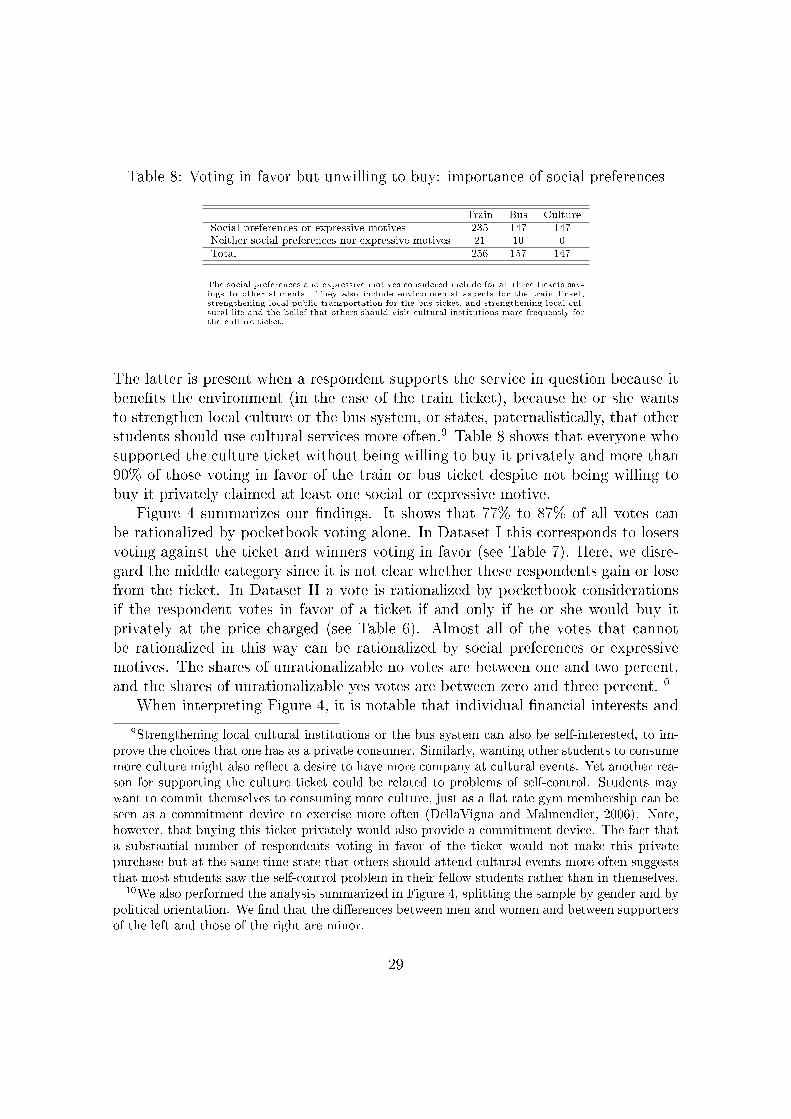
Table 8: Voting in favor but unwilling to buy: importance of social preferences
Train Bus CultureSocial preferences or expressive motives 235 147 147Neither social preferences nor expressive motives 21 10 0Total 256 157 147
The social preferences and expressive motives considered include for all three tickets sav-ings to other students. They also include environmental aspects for the train ticket,strengthening local public transportation for the bus ticket, and strengthening local cul-tural life and the belief that others should visit cultural institutions more frequently forthe culture ticket.
The latter is present when a respondent supports the service in question because itbene�ts the environment (in the case of the train ticket), because he or she wantsto strengthen local culture or the bus system, or states, paternalistically, that otherstudents should use cultural services more often.9 Table 8 shows that everyone whosupported the culture ticket without being willing to buy it privately and more than90% of those voting in favor of the train or bus ticket despite not being willing tobuy it privately claimed at least one social or expressive motive.
Figure 4 summarizes our �ndings. It shows that 77% to 87% of all votes canbe rationalized by pocketbook voting alone. In Dataset I this corresponds to losersvoting against the ticket and winners voting in favor (see Table 7). Here, we disre-gard the middle category since it is not clear whether these respondents gain or losefrom the ticket. In Dataset II a vote is rationalized by pocketbook considerationsif the respondent votes in favor of a ticket if and only if he or she would buy itprivately at the price charged (see Table 6). Almost all of the votes that cannotbe rationalized in this way can be rationalized by social preferences or expressivemotives. The shares of unrationalizable no votes are between one and two percent,and the shares of unrationalizable yes votes are between zero and three percent.10
When interpreting Figure 4, it is notable that individual �nancial interests and
9Strengthening local cultural institutions or the bus system can also be self-interested, to im-prove the choices that one has as a private consumer. Similarly, wanting other students to consumemore culture might also re�ect a desire to have more company at cultural events. Yet another rea-son for supporting the culture ticket could be related to problems of self-control. Students maywant to commit themselves to consuming more culture, just as a �at rate gym membership can beseen as a commitment device to exercise more often (DellaVigna and Malmendier, 2006). Note,however, that buying this ticket privately would also provide a commitment device. The fact thata substantial number of respondents voting in favor of the ticket would not make this privatepurchase but at the same time state that others should attend cultural events more often suggeststhat most students saw the self-control problem in their fellow students rather than in themselves.
10We also performed the analysis summarized in Figure 4, splitting the sample by gender and bypolitical orientation. We �nd that the di�erences between men and women and between supportersof the left and those of the right are minor.
29
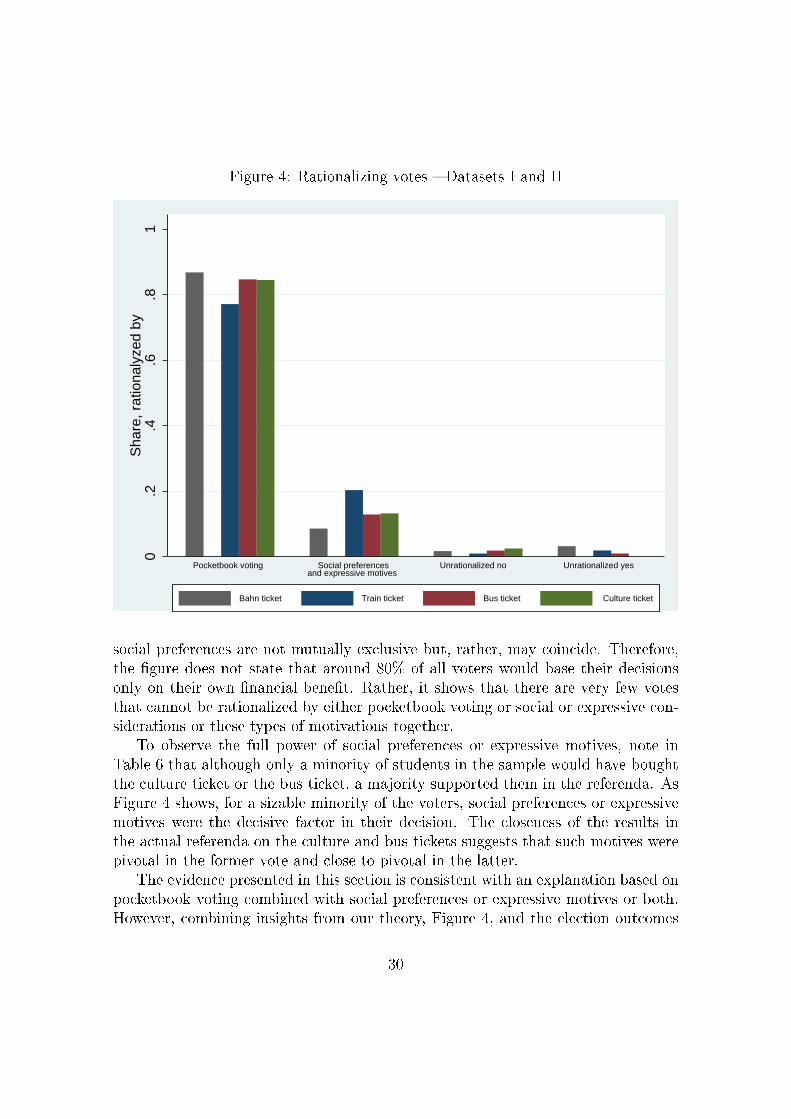
Figure 4: Rationalizing votes � Datasets I and II
0.2
.4.6
.81
Sha
re, r
atio
naly
zed
by
Bahn ticket Train ticket Bus ticket Culture ticket
Pocketbook voting Social preferences and expressive motives
Unrationalized yesUnrationalized no
social preferences are not mutually exclusive but, rather, may coincide. Therefore,the �gure does not state that around 80% of all voters would base their decisionsonly on their own �nancial bene�t. Rather, it shows that there are very few votesthat cannot be rationalized by either pocketbook voting or social or expressive con-siderations or these types of motivations together.
To observe the full power of social preferences or expressive motives, note inTable 6 that although only a minority of students in the sample would have boughtthe culture ticket or the bus ticket, a majority supported them in the referenda. AsFigure 4 shows, for a sizable minority of the voters, social preferences or expressivemotives were the decisive factor in their decision. The closeness of the results inthe actual referenda on the culture and bus tickets suggests that such motives werepivotal in the former vote and close to pivotal in the latter.
The evidence presented in this section is consistent with an explanation based onpocketbook voting combined with social preferences or expressive motives or both.However, combining insights from our theory, Figure 4, and the election outcomes
30

sheds light on the relative plausibility of social preferences and expressive motives asexplanations. We �rst note that two referenda (bus and culture) were close and tworeferenda (both train tickets) were decided by a large margin. Voters with rationalexpectations should therefore have considered their likelihood of being pivotal tobe much larger in the former votes than in the latter. This conclusion arises alsoif students form their expectations retrospectively, as approval rates are remark-ably stable over time.11 In a trade-o� between pocketbook bene�ts and expressivemotives, pocketbook considerations are weighted by the probability to change theoutcome, and should therefore become less important if this probability is low (seeProposition 1(iii)). In contrast, in a trade-o� between pocketbook bene�ts and so-cial preferences, this probability cancels out, and hence should not a�ect the relativeimportance of these motives (see Corollary 1). The �nding that pocketbook votingexplains around 80% of votes in each election, irrespective of whether it was closeor not, suggests that social preferences play a bigger role than expressive concerns.
5.2 The turnout decision
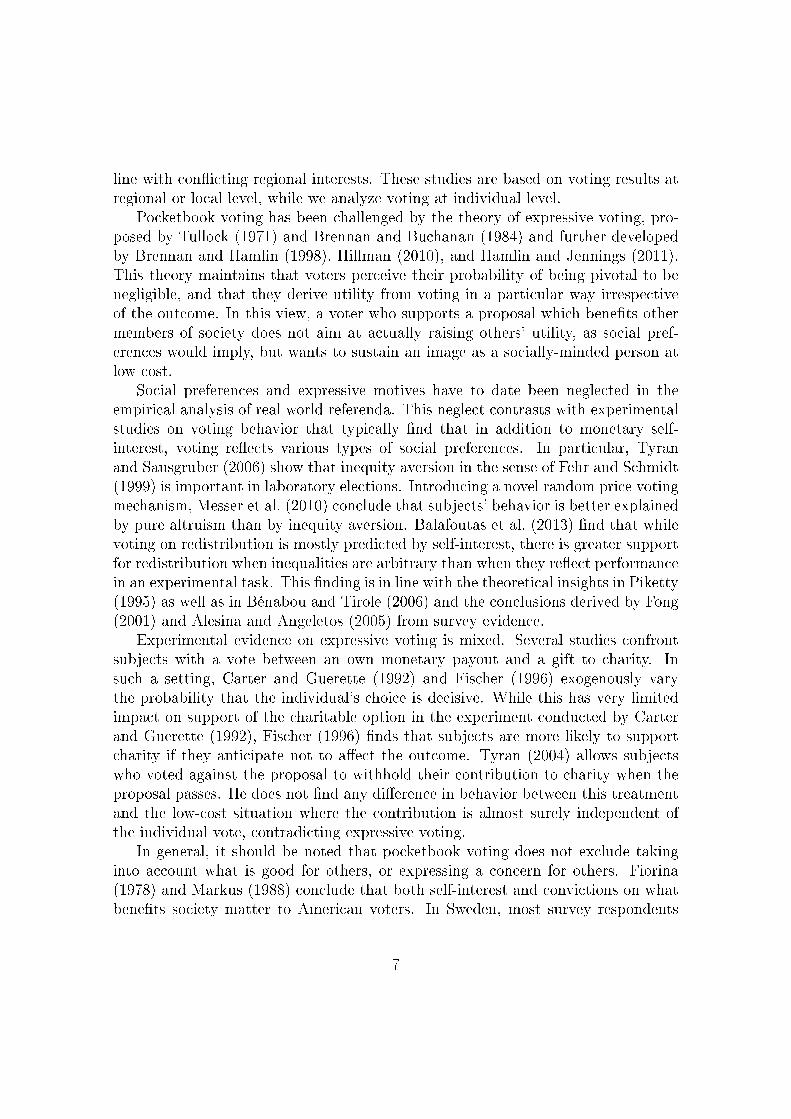
We next analyze how the decision to participate in the vote is related to savings whenvisiting parents. Figure 5 presents turnout separately for three groups, de�ned abovein Figure 2, according to the monetary gains conferred by the ticket: those who lostfrom the ticket; those with moderate savings who may also have netted personal gainfrom trips other than those to visit parents; and those whose savings from visitingparents exceeded the price. Those with zero and moderate savings are least likelyto vote; after that, turnout increases monotonically. As predicted by Proposition2(i), this �nding suggests that those with higher stakes are more likely to vote, inline with the rational calculus of voting. It is noteworthy that gains and losses areasymmetrically distributed: the maximum loss is the price of a ticket (84.48 euros),while among the winners, the average savings just from visiting parents is 586 euros.This asymmetry explains why turnout is substantially higher among winners.
6 The vote
6.1 Estimating the voting decision
We now describe how we arrive from equation (1) at an equation which can beestimated. For the empirical analysis, we assume that the weights in the utility
11Before the ticket was split in two in 2010, the train ticket had been approved by 80% in 2008and 84% in 2009. In the referenda in 2011 and 2012, the approval rates were 80% and 82%. Theculture ticket passed only narrowly in 2012 with a 51% share of yes votes.
31
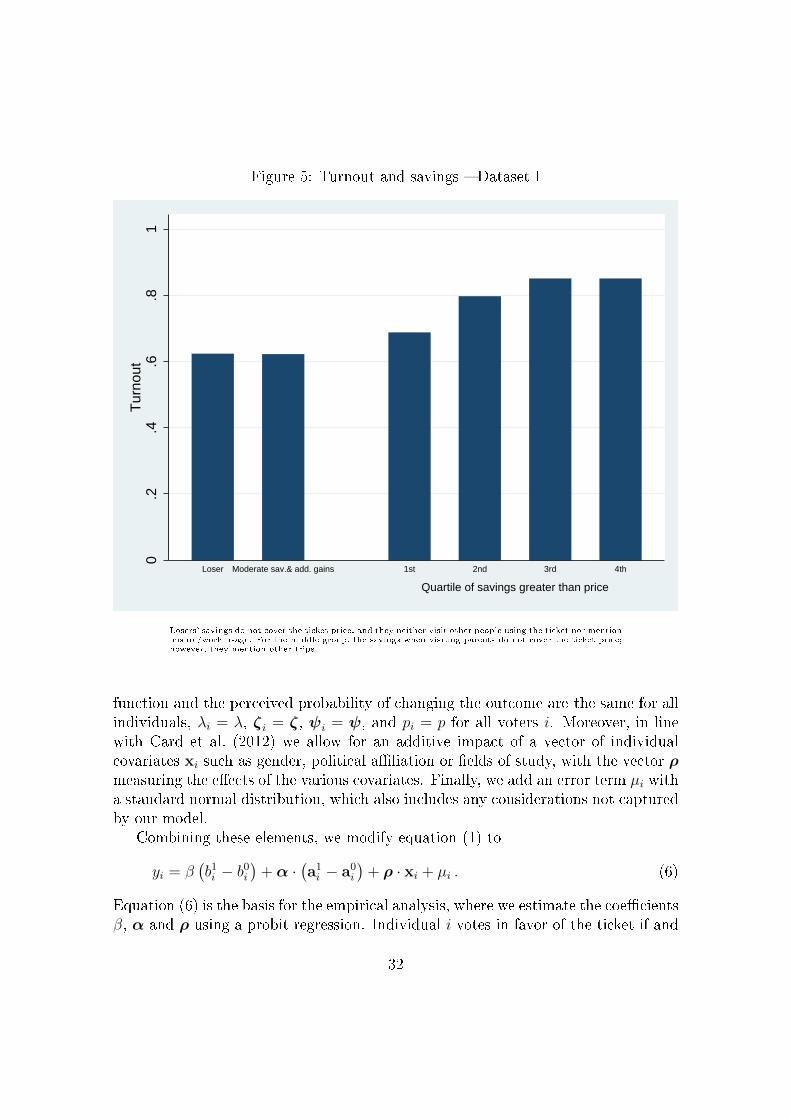
Figure 5: Turnout and savings � Dataset I
0.2
.4.6
.81
Tur
nout
Quartile of savings greater than price
Loser Moderate sav.& add. gains 1st 2nd 3rd 4th
Losers' savings do not cover the ticket price, and they neither visit other people using the ticket nor mentionleisure/work usage. For the middle group, the savings when visiting parents do not cover the ticket price;however, they mention other trips.
function and the perceived probability of changing the outcome are the same for allindividuals, λi = λ, ζi = ζ, ψi = ψ, and pi = p for all voters i. Moreover, in linewith Card et al. (2012) we allow for an additive impact of a vector of individualcovariates xi such as gender, political a�liation or �elds of study, with the vector ρmeasuring the e�ects of the various covariates. Finally, we add an error term µi witha standard normal distribution, which also includes any considerations not capturedby our model.
Combining these elements, we modify equation (1) to
yi = β(b1i − b0i
)+α ·
(a1i − a0
i
)+ ρ · xi + µi . (6)
Equation (6) is the basis for the empirical analysis, where we estimate the coe�cientsβ, α and ρ using a probit regression. Individual i votes in favor of the ticket if and
32
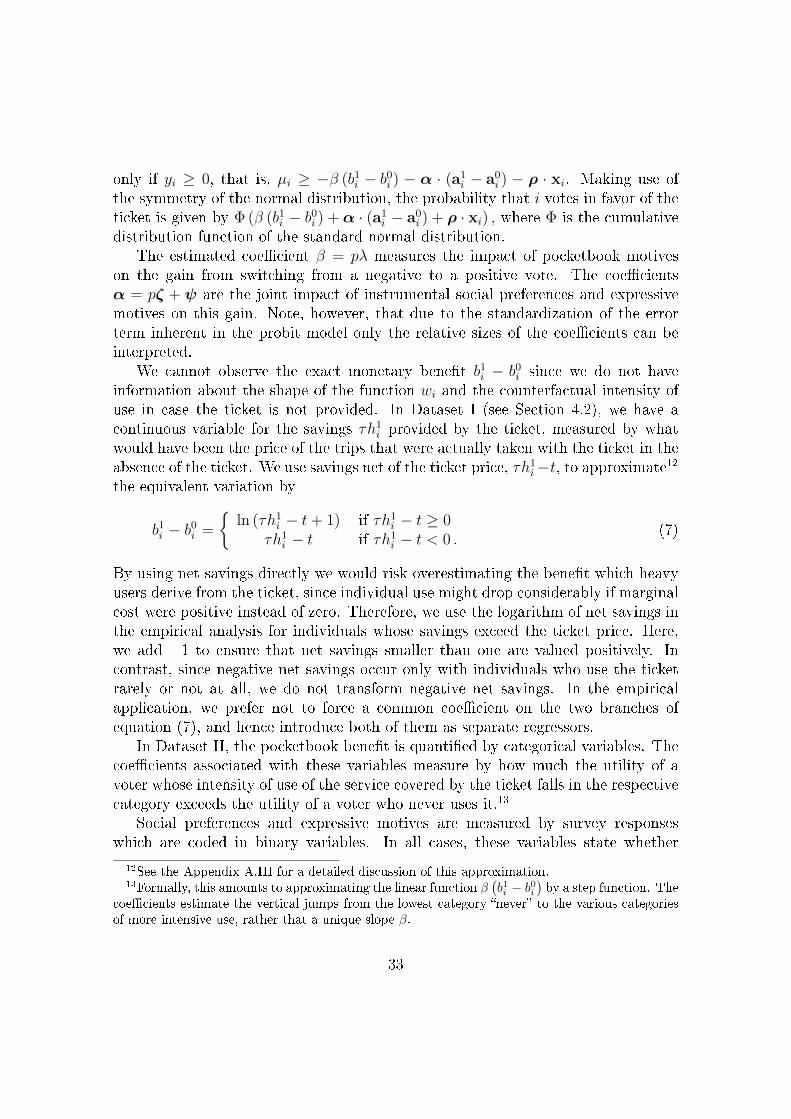
only if yi ≥ 0, that is, µi ≥ −β (b1i − b0i ) − α · (a1i − a0
i ) − ρ · xi. Making use ofthe symmetry of the normal distribution, the probability that i votes in favor of theticket is given by Φ (β (b1i − b0i ) +α · (a1
i − a0i ) + ρ · xi) , where Φ is the cumulative
distribution function of the standard normal distribution.The estimated coe�cient β = pλ measures the impact of pocketbook motives
on the gain from switching from a negative to a positive vote. The coe�cientsα = pζ + ψ are the joint impact of instrumental social preferences and expressivemotives on this gain. Note, however, that due to the standardization of the errorterm inherent in the probit model only the relative sizes of the coe�cients can beinterpreted.
We cannot observe the exact monetary bene�t b1i − b0i since we do not haveinformation about the shape of the function wi and the counterfactual intensity ofuse in case the ticket is not provided. In Dataset I (see Section 4.2), we have acontinuous variable for the savings τh1i provided by the ticket, measured by whatwould have been the price of the trips that were actually taken with the ticket in theabsence of the ticket. We use savings net of the ticket price, τh1i−t, to approximate12
the equivalent variation by
b1i − b0i =
{ln (τh1i − t+ 1) if τh1i − t ≥ 0
τh1i − t if τh1i − t < 0 .(7)
By using net savings directly we would risk overestimating the bene�t which heavyusers derive from the ticket, since individual use might drop considerably if marginalcost were positive instead of zero. Therefore, we use the logarithm of net savings inthe empirical analysis for individuals whose savings exceed the ticket price. Here,we add +1 to ensure that net savings smaller than one are valued positively. Incontrast, since negative net savings occur only with individuals who use the ticketrarely or not at all, we do not transform negative net savings. In the empiricalapplication, we prefer not to force a common coe�cient on the two branches ofequation (7), and hence introduce both of them as separate regressors.
In Dataset II, the pocketbook bene�t is quanti�ed by categorical variables. Thecoe�cients associated with these variables measure by how much the utility of avoter whose intensity of use of the service covered by the ticket falls in the respectivecategory exceeds the utility of a voter who never uses it.13
Social preferences and expressive motives are measured by survey responseswhich are coded in binary variables. In all cases, these variables state whether
12See the Appendix A.III for a detailed discussion of this approximation.13Formally, this amounts to approximating the linear function β
(b1i − b0i
)by a step function. The
coe�cients estimate the vertical jumps from the lowest category �never� to the various categoriesof more intensive use, rather that a unique slope β.
33
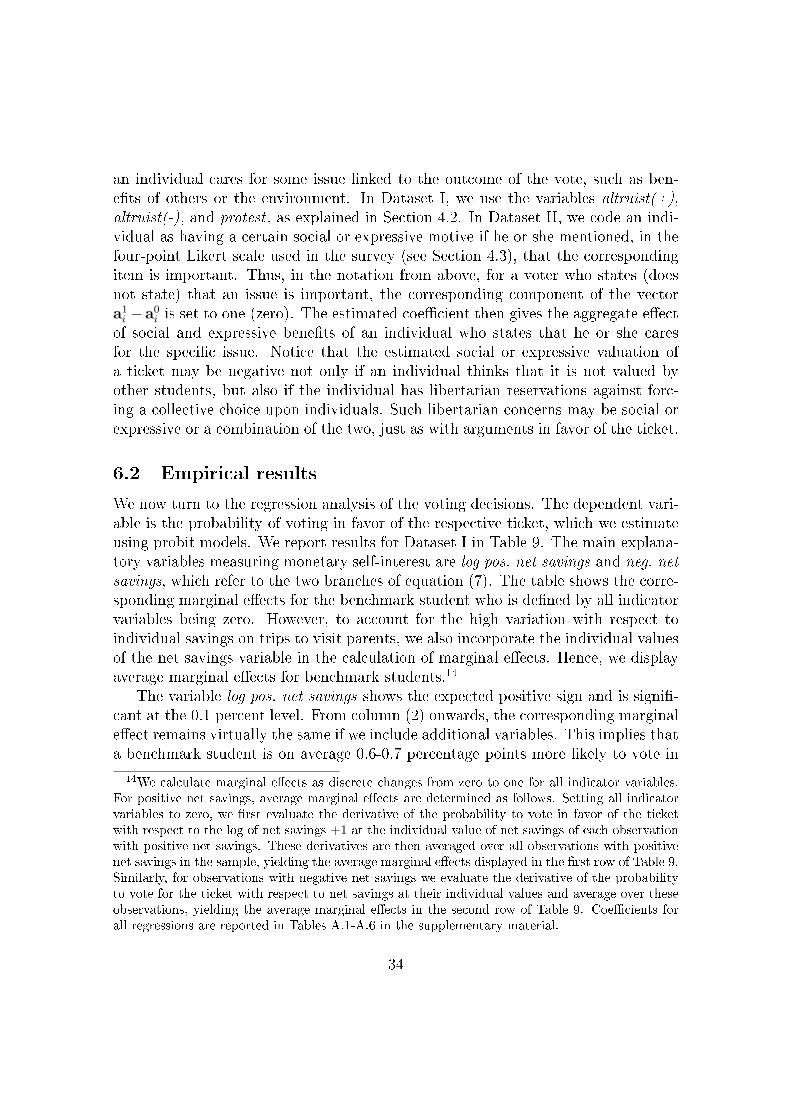
an individual cares for some issue linked to the outcome of the vote, such as ben-e�ts of others or the environment. In Dataset I, we use the variables altruist(+),altruist(-), and protest , as explained in Section 4.2. In Dataset II, we code an indi-vidual as having a certain social or expressive motive if he or she mentioned, in thefour-point Likert scale used in the survey (see Section 4.3), that the correspondingitem is important. Thus, in the notation from above, for a voter who states (doesnot state) that an issue is important, the corresponding component of the vectora1i −a0
i is set to one (zero). The estimated coe�cient then gives the aggregate e�ectof social and expressive bene�ts of an individual who states that he or she caresfor the speci�c issue. Notice that the estimated social or expressive valuation ofa ticket may be negative not only if an individual thinks that it is not valued byother students, but also if the individual has libertarian reservations against forc-ing a collective choice upon individuals. Such libertarian concerns may be social orexpressive or a combination of the two, just as with arguments in favor of the ticket.
6.2 Empirical results
We now turn to the regression analysis of the voting decisions. The dependent vari-able is the probability of voting in favor of the respective ticket, which we estimateusing probit models. We report results for Dataset I in Table 9. The main explana-tory variables measuring monetary self-interest are log pos. net savings and neg. netsavings, which refer to the two branches of equation (7). The table shows the corre-sponding marginal e�ects for the benchmark student who is de�ned by all indicatorvariables being zero. However, to account for the high variation with respect toindividual savings on trips to visit parents, we also incorporate the individual valuesof the net savings variable in the calculation of marginal e�ects. Hence, we displayaverage marginal e�ects for benchmark students.14
The variable log pos. net savings shows the expected positive sign and is signi�-cant at the 0.1 percent level. From column (2) onwards, the corresponding marginale�ect remains virtually the same if we include additional variables. This implies thata benchmark student is on average 0.6-0.7 percentage points more likely to vote in
14We calculate marginal e�ects as discrete changes from zero to one for all indicator variables.For positive net savings, average marginal e�ects are determined as follows. Setting all indicatorvariables to zero, we �rst evaluate the derivative of the probability to vote in favor of the ticketwith respect to the log of net savings +1 at the individual value of net savings of each observationwith positive net savings. These derivatives are then averaged over all observations with positivenet savings in the sample, yielding the average marginal e�ects displayed in the �rst row of Table 9.Similarly, for observations with negative net savings we evaluate the derivative of the probabilityto vote for the ticket with respect to net savings at their individual values and average over theseobservations, yielding the average marginal e�ects in the second row of Table 9. Coe�cients forall regressions are reported in Tables A.1-A.6 in the supplementary material.
34
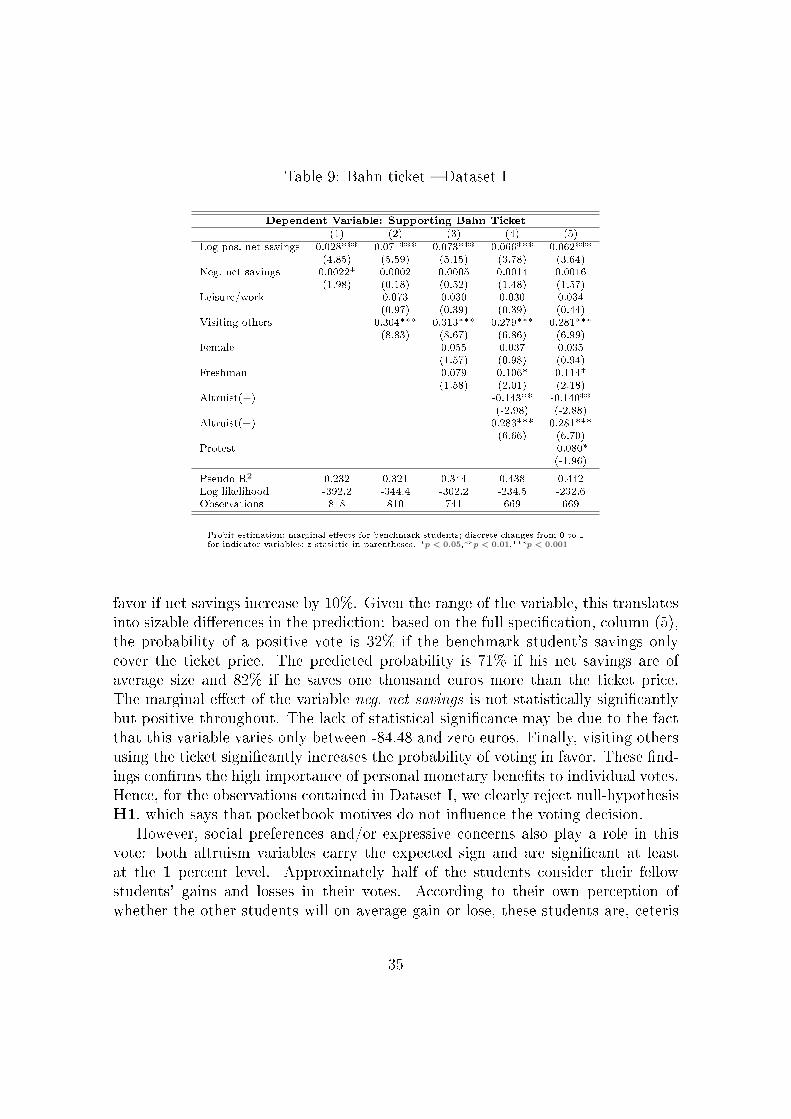
Table 9: Bahn ticket � Dataset I
Dependent Variable: Supporting Bahn Ticket
(1) (2) (3) (4) (5)Log pos. net savings 0.028*** 0.071*** 0.073*** 0.066*** 0.062***
(4.85) (5.59) (5.15) (3.78) (3.64)Neg. net savings 0.0022* 0.0002 0.0005 0.0014 0.0016
(1.98) (0.18) (0.52) (1.48) (1.57)Leisure/work 0.073 0.030 0.030 0.034
(0.97) (0.39) (0.39) (0.44)Visiting others 0.304*** 0.313*** 0.279*** 0.281***
(8.83) (8.67) (6.86) (6.99)Female 0.055 0.037 0.035
(1.57) (0.98) (0.94)Freshman 0.079 0.106* 0.114*
(1.58) (2.01) (2.18)Altruist(−) -0.143** -0.140**
(-2.98) (-2.88)Altruist(+) 0.283*** 0.281***
(6.66) (6.70)Protest -0.080*
(-1.96)
Pseudo R2 0.232 0.321 0.344 0.438 0.442Log likelihood -392.2 -344.4 -302.2 -234.5 -232.6Observations 818 810 741 669 669
Probit estimation; marginal e�ects for benchmark students; discrete changes from 0 to 1for indicator variables; z-statistic in parentheses. *p < 0.05,**p < 0.01,***p < 0.001.
favor if net savings increase by 10%. Given the range of the variable, this translatesinto sizable di�erences in the prediction: based on the full speci�cation, column (5),the probability of a positive vote is 32% if the benchmark student's savings onlycover the ticket price. The predicted probability is 71% if his net savings are ofaverage size and 82% if he saves one thousand euros more than the ticket price.The marginal e�ect of the variable neg. net savings is not statistically signi�cantlybut positive throughout. The lack of statistical signi�cance may be due to the factthat this variable varies only between -84.48 and zero euros. Finally, visiting othersusing the ticket signi�cantly increases the probability of voting in favor. These �nd-ings con�rms the high importance of personal monetary bene�ts to individual votes.Hence, for the observations contained in Dataset I, we clearly reject null-hypothesisH1, which says that pocketbook motives do not in�uence the voting decision.
However, social preferences and/or expressive concerns also play a role in thisvote: both altruism variables carry the expected sign and are signi�cant at leastat the 1 percent level. Approximately half of the students consider their fellowstudents' gains and losses in their votes. According to their own perception ofwhether the other students will on average gain or lose, these students are, ceteris
35
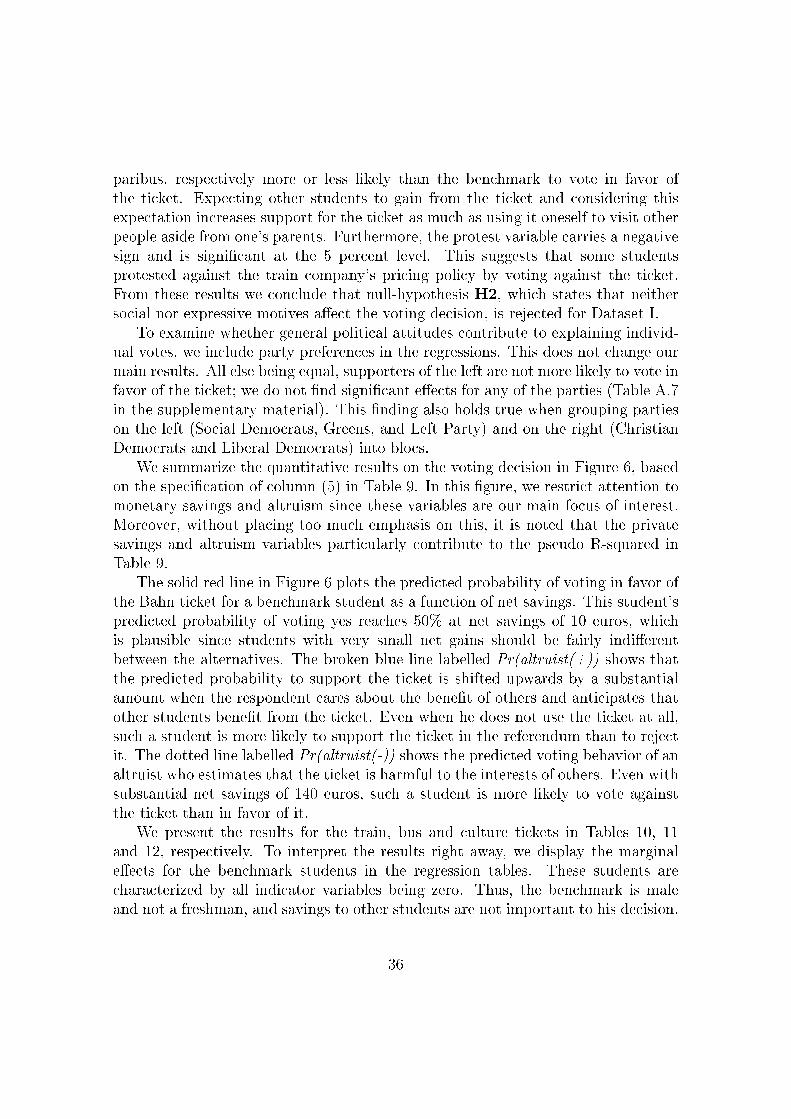
paribus, respectively more or less likely than the benchmark to vote in favor ofthe ticket. Expecting other students to gain from the ticket and considering thisexpectation increases support for the ticket as much as using it oneself to visit otherpeople aside from one's parents. Furthermore, the protest variable carries a negativesign and is signi�cant at the 5 percent level. This suggests that some studentsprotested against the train company's pricing policy by voting against the ticket.From these results we conclude that null-hypothesis H2, which states that neithersocial nor expressive motives a�ect the voting decision, is rejected for Dataset I.
To examine whether general political attitudes contribute to explaining individ-ual votes, we include party preferences in the regressions. This does not change ourmain results. All else being equal, supporters of the left are not more likely to vote infavor of the ticket; we do not �nd signi�cant e�ects for any of the parties (Table A.7in the supplementary material). This �nding also holds true when grouping partieson the left (Social Democrats, Greens, and Left Party) and on the right (ChristianDemocrats and Liberal Democrats) into blocs.
We summarize the quantitative results on the voting decision in Figure 6, basedon the speci�cation of column (5) in Table 9. In this �gure, we restrict attention tomonetary savings and altruism since these variables are our main focus of interest.Moreover, without placing too much emphasis on this, it is noted that the privatesavings and altruism variables particularly contribute to the pseudo R-squared inTable 9.
The solid red line in Figure 6 plots the predicted probability of voting in favor ofthe Bahn ticket for a benchmark student as a function of net savings. This student'spredicted probability of voting yes reaches 50% at net savings of 10 euros, whichis plausible since students with very small net gains should be fairly indi�erentbetween the alternatives. The broken blue line labelled Pr(altruist(+)) shows thatthe predicted probability to support the ticket is shifted upwards by a substantialamount when the respondent cares about the bene�t of others and anticipates thatother students bene�t from the ticket. Even when he does not use the ticket at all,such a student is more likely to support the ticket in the referendum than to rejectit. The dotted line labelled Pr(altruist(-)) shows the predicted voting behavior of analtruist who estimates that the ticket is harmful to the interests of others. Even withsubstantial net savings of 140 euros, such a student is more likely to vote againstthe ticket than in favor of it.
We present the results for the train, bus and culture tickets in Tables 10, 11and 12, respectively. To interpret the results right away, we display the marginale�ects for the benchmark students in the regression tables. These students arecharacterized by all indicator variables being zero. Thus, the benchmark is maleand not a freshman, and savings to other students are not important to his decision.
36

Figure 6: Predicted probability to vote in favor of Bahn ticket � Dataset I
0.2
.4.6
.81
Pre
dict
ed p
roba
bilit
y of
vot
ing
yes
-84.48 0 200Net savings
Pr(altruist(+)) Pr(non altruist) Pr(altruist(-))
♦Prediction based on Table 9, column (5), as function of net savings in euros. All binary variables except altruist(+)and altruist(-) are set to zero. The line labelled Pr(non altruist) refers to an individual who states that he didnot consider the bene�ts of others in his vote. The line Pr(altruist(+)) (Pr(altruist(-))) refers to an individualwho considered bene�ts of others in his vote and estimates that others on average gain (lose) from the Bahn ticket.
The base category for the intensity of use is �never�.Our econometric results con�rm the impressions gathered in Section 5: the prob-
ability of voting in favor of a ticket strongly increases with the intensity of personaluse, suggesting a high degree of pocketbook voting. The e�ects are signi�cant atthe 0.1 percent level and of an economically relevant size. For example, concerningthe bus ticket, estimations imply that an otherwise identical student who uses thebus several times per week is more than 70 percentage points more likely to vote infavor of this ticket than the benchmark student who does not use the bus. Thus,also for Dataset II, null-hypothesis H1 is rejected.
However, variables capturing social preferences and/or expressive concerns alsoshow highly signi�cant and positive e�ects. Those who consider savings to other
37
Table 10: Train ticket � Dataset II
Dependent Variable: Supporting Train Ticket
(1) (2) (3) (4)Rarely (≤ 5/year) 0.428*** 0.389*** 0.393*** 0.373***
(7.35) (6.36) (6.73) (6.21)Sometimes (monthly) 0.657*** 0.648*** 0.680*** 0.676***
(13.05) (11.72) (13.56) (13.14)Often (weekly) 0.701*** 0.698*** 0.749*** 0.745***
(14.10) (12.45) (14.61) (14.19)Very often (≥ 2/week) 0.709*** 0.709*** 0.766*** 0.760***
(14.39) (12.70) (15.19) (14.69)Female 0.119** 0.090* 0.074*
(3.01) (2.44) (2.04)Freshman -0.075* -0.043 -0.029
(-2.10) (-1.39) (-0.92)Savings to others 0.285*** 0.198***
(5.48) (3.65)Environment 0.242**
(3.25)
Pseudo R2 0.285 0.297 0.342 0.364Log likelihood -356.2 -334.4 -298.1 -277.9Observations 1247 1191 1163 1145
Probit estimation; discrete e�ects for benchmark students due tochanges from 0 to 1 for all variables; z-statistic in parentheses.*p < 0.05,**p < 0.01,***p < 0.001.
students important to their decisions vote in favor of the respective ticket with ahigher probability. Additionally, students who consider environmental aspects orstrengthening local public transportation to be important are more likely to votein favor of the train ticket or the bus ticket, respectively. The same holds trueregarding the culture ticket for those who indicate that strengthening local culturallife or encouraging others to visit these institutions more frequently is importantto them in their voting decisions.15 From these results, null-hypothesis H2 is alsorejected in Dataset II.
Freshmen are, ceteris paribus, more likely to vote in favor of the bus and culturetickets. However, because for freshmen, the questions on the intensity of use refer toa shorter time period or might cover some time when they were not yet in Goettingen,we refrain from emphasizing this �nding.
As a robustness check, we also control for the �eld of study (Table A.8 in the
15A similar picture emerges from the regression analysis if we use indicator variables encom-passing motives that were at least somewhat important rather than focusing on motives that wereimportant. In line with expectations, these variables capturing less pronounced social preferencesor expressive concerns in general display smaller marginal e�ects than those shown in Tables 10-12. We have also included complete sets of indicator variables containing information on whethersomeone considered a motive unimportant, somewhat important, or important, and the conclusionsremained the same.
38

Table 11: Bus ticket � Dataset II
Dependent Variable: Supporting Bus Ticket
(1) (2) (3) (4)Rarely (1 or 2/semester) 0.241*** 0.237*** 0.217*** 0.203***
(6.94) (6.67) (6.15) (5.64)Sometimes (monthly) 0.415*** 0.439*** 0.416*** 0.411***
(9.81) (9.84) (8.79) (8.19)Often (weekly) 0.597*** 0.613*** 0.617*** 0.587***
(14.88) (14.45) (13.58) (11.38)Very often (≥ 2/week) 0.706*** 0.726*** 0.744*** 0.728***
(27.55) (26.15) (24.39) (20.17)Female -0.001 -0.006 0.007
(-0.04) (-0.27) (0.29)Freshman 0.079** 0.081** 0.067*
(2.75) (2.92) (2.44)Savings to others 0.204*** 0.158***
(5.36) (4.07)Strengthening bus system 0.418***
(5.87)
Pseudo R2 0.224 0.232 0.252 0.285Log likelihood -668.1 -629.3 -589.1 -539.1Observations 1242 1183 1137 1090
Probit estimation; discrete e�ects for benchmark students due to changes from 0 to1 for all variables; z-statistic in parentheses. *p < 0.05,**p < 0.01,***p < 0.001.
Table 12: Culture ticket � Dataset II
Dependent Variable: Supporting Culture Ticket
(1) (2) (3) (4)Rarely (1 or 2/year) 0.376*** 0.389*** 0.355*** 0.290***
(11.67) (11.18) (9.60) (6.83)Sometimes (3 to 5/year) 0.578*** 0.611*** 0.597*** 0.572***
(18.57) (15.83) (13.28) (7.80)Often (6 to 10/year) 0.634*** 0.687*** 0.693*** 0.649***
(17.78) (14.68) (12.09) (4.94)Very often (> 10/year) 0.605*** 0.675*** 0.640*** 0.522**
(13.59) (12.42) (7.96) (2.95)Female 0.073** 0.071* 0.019
(2.65) (2.53) (0.80)Freshman 0.101** 0.109** 0.084*
(3.01) (3.17) (2.58)Savings to others 0.262*** 0.104*
(6.21) (2.40)Others should go 0.433***
(5.83)Strengthening local culture 0.453***
(8.74)
Pseudo R2 0.192 0.191 0.215 0.440Log likelihood -664.7 -633.7 -571.1 -378.7Observations 1189 1131 1055 988
Probit estimation; discrete e�ects for benchmark students due to changes from 0 to1 for all variables; z-statistic in parentheses. *p < 0.05,**p < 0.01,***p < 0.001.
39
supplementary material). The overall picture is that it does not appear to mattermuch for individual votes. Only a small number of �elds show signi�cant e�ectson the voting decisions, and our main results remain robust. All else being equal,students of the humanities and social sciences are more likely to vote in favor of theculture ticket. One explanation for this �nding may be the large share of studentsin these �elds who study culture-related subjects.
The strong empirical support for both pocketbook voting and social or expressiveconsiderations is robust to the inclusion of party preferences and to the inclusionof both �elds and party preferences in the regressions (Tables A.9 and A.10 inthe supplementary material). Furthermore, support for the train and bus ticketsappears quite unrelated to party preferences.16 However, we �nd that support forthe culture ticket, ceteris paribus, is larger among supporters of parties on the left.The qualitative results with respect to pocketbook voting and social or expressiveconsiderations remain unchanged also if we group parties into a left bloc and a rightbloc. The only statistically signi�cant e�ect of party blocs is that supporters of theleft are more likely to vote in favor of the culture ticket.
A general concern with survey data is the reliability of answers. In our setting,this problem may arise particularly with regard to social preferences because of socialdesirability. For example, one might wonder whether the respondents genuinely carefor others or if they just feel social pressure to state this concern. However, both thedescriptive and econometric analyses show that stated social preferences, altruism inparticular, or expressive concerns have a substantial impact on the voting decision,explaining most votes that cannot be rationalized by monetary bene�ts.
From an econometric perspective, one might be concerned with reverse causality,omitted variables, or sample selection. A reverse causality problem would arise ifthose respondents who voted in favor of a ticket against their monetary interest expost rationalized their decision by mentioning social preferences or expressive con-cerns. However, this argumentation leaves open the question of why they voted infavor of the ticket in the �rst place. Given the extensive set of controls that we use,there is no obvious candidate for an omitted variable that a�ects the voting deci-sion and is correlated with the explanatory variables. An issue of sample selectioncould arise if the respondents in the surveys systematically di�er from the studentpopulation. As shown in Section 4, voters are somewhat overrepresented in DatasetI. This is not, however, a problem because we exclude nonvoters from the analysisof voting decisions. Finally, semester tickets should only play a minor role in thedecision whether to enroll at University of Goettingen. Taken together, we do notthink that any of these issues is likely to seriously bias our results.
16The only statistically signi�cant e�ect we �nd is that Liberal Democrats are less likely tosupport the train ticket (see Table A.10).
40
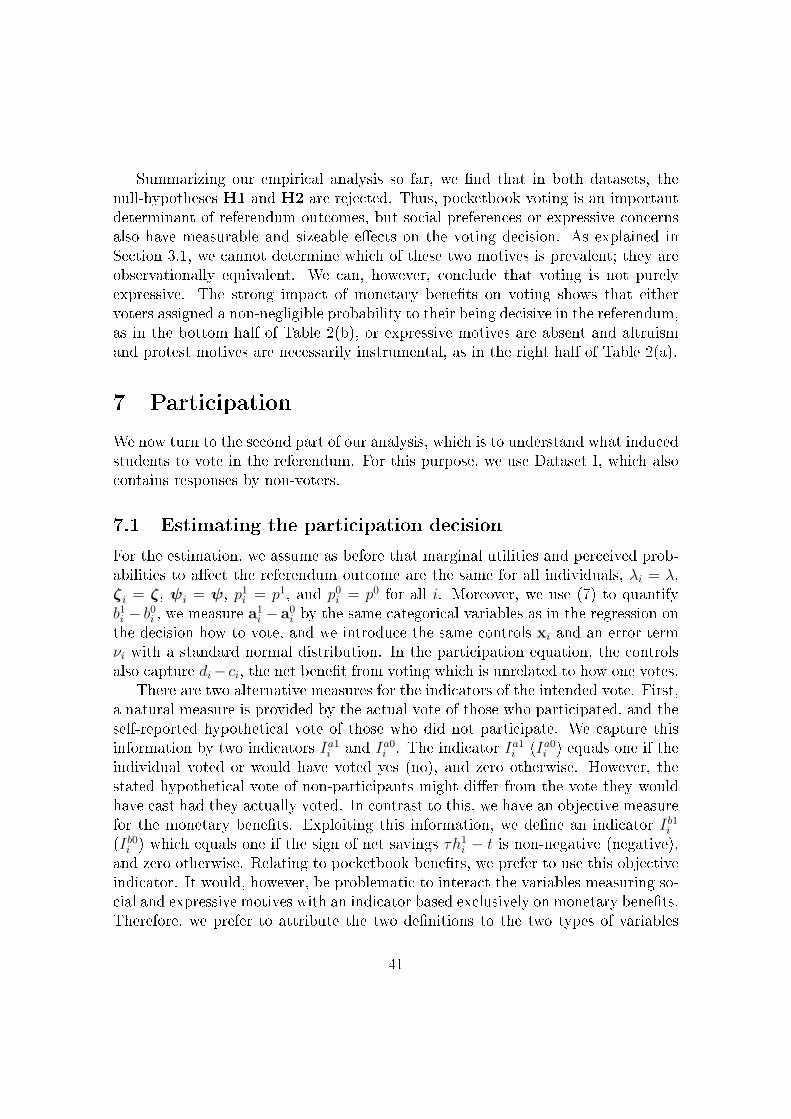
Summarizing our empirical analysis so far, we �nd that in both datasets, thenull-hypotheses H1 and H2 are rejected. Thus, pocketbook voting is an importantdeterminant of referendum outcomes, but social preferences or expressive concernsalso have measurable and sizeable e�ects on the voting decision. As explained inSection 3.1, we cannot determine which of these two motives is prevalent; they areobservationally equivalent. We can, however, conclude that voting is not purelyexpressive. The strong impact of monetary bene�ts on voting shows that eithervoters assigned a non-negligible probability to their being decisive in the referendum,as in the bottom half of Table 2(b), or expressive motives are absent and altruismand protest motives are necessarily instrumental, as in the right half of Table 2(a).
7 Participation
We now turn to the second part of our analysis, which is to understand what inducedstudents to vote in the referendum. For this purpose, we use Dataset I, which alsocontains responses by non-voters.
7.1 Estimating the participation decision
For the estimation, we assume as before that marginal utilities and perceived prob-abilities to a�ect the referendum outcome are the same for all individuals, λi = λ,ζi = ζ, ψi = ψ, p1i = p1, and p0i = p0 for all i. Moreover, we use (7) to quantifyb1i − b0i , we measure a1
i −a0i by the same categorical variables as in the regression on
the decision how to vote, and we introduce the same controls xi and an error termνi with a standard normal distribution. In the participation equation, the controlsalso capture di− ci, the net bene�t from voting which is unrelated to how one votes.
There are two alternative measures for the indicators of the intended vote. First,a natural measure is provided by the actual vote of those who participated, and theself-reported hypothetical vote of those who did not participate. We capture thisinformation by two indicators Ia1i and Ia0i . The indicator Ia1i (Ia0i ) equals one if theindividual voted or would have voted yes (no), and zero otherwise. However, thestated hypothetical vote of non-participants might di�er from the vote they wouldhave cast had they actually voted. In contrast to this, we have an objective measurefor the monetary bene�ts. Exploiting this information, we de�ne an indicator Ib1i(Ib0i ) which equals one if the sign of net savings τh1i − t is non-negative (negative),and zero otherwise. Relating to pocketbook bene�ts, we prefer to use this objectiveindicator. It would, however, be problematic to interact the variables measuring so-cial and expressive motives with an indicator based exclusively on monetary bene�ts.Therefore, we prefer to attribute the two de�nitions to the two types of variables
41
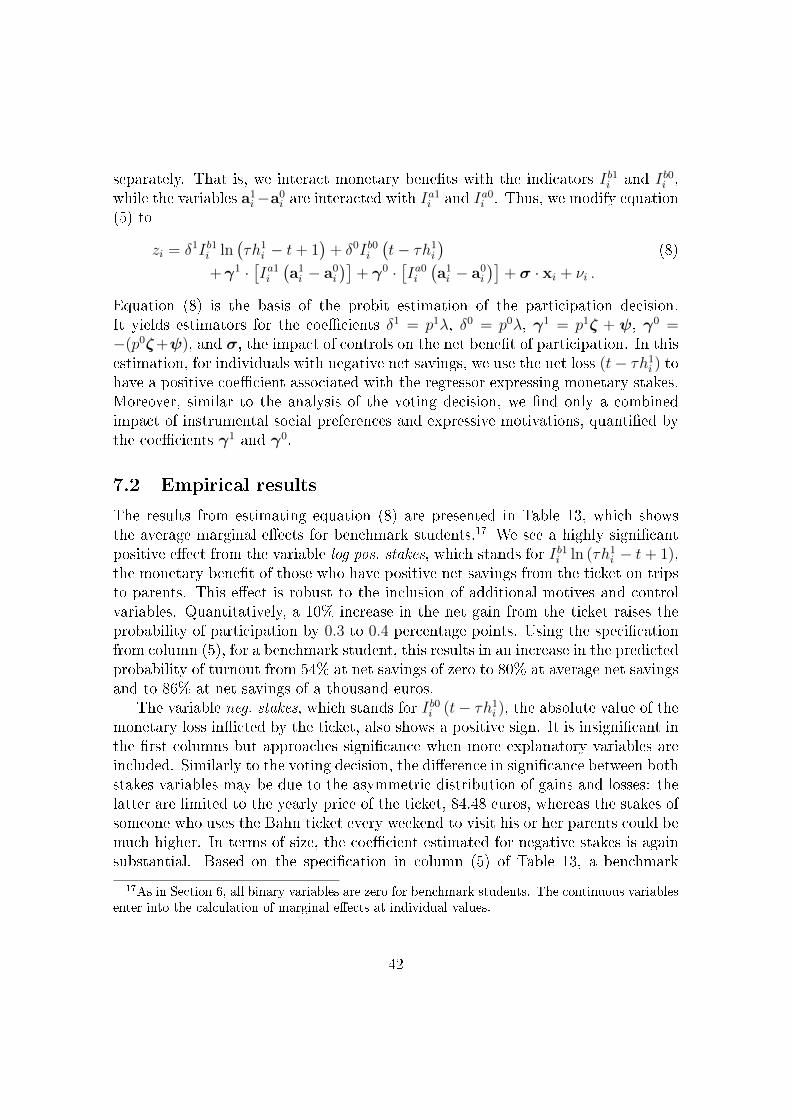
separately. That is, we interact monetary bene�ts with the indicators Ib1i and Ib0i ,while the variables a1
i−a0i are interacted with I
a1i and Ia0i . Thus, we modify equation
(5) to
zi = δ1Ib1i ln(τh1i − t+ 1
)+ δ0Ib0i
(t− τh1i
)(8)
+γ1 ·[Ia1i(a1i − a0
i
)]+ γ0 ·
[Ia0i(a1i − a0
i
)]+ σ · xi + νi .
Equation (8) is the basis of the probit estimation of the participation decision.It yields estimators for the coe�cients δ1 = p1λ, δ0 = p0λ, γ1 = p1ζ + ψ, γ0 =−(p0ζ+ψ), and σ, the impact of controls on the net bene�t of participation. In thisestimation, for individuals with negative net savings, we use the net loss (t− τh1i ) tohave a positive coe�cient associated with the regressor expressing monetary stakes.Moreover, similar to the analysis of the voting decision, we �nd only a combinedimpact of instrumental social preferences and expressive motivations, quanti�ed bythe coe�cients γ1 and γ0.
7.2 Empirical results
The results from estimating equation (8) are presented in Table 13, which showsthe average marginal e�ects for benchmark students.17 We see a highly signi�cantpositive e�ect from the variable log pos. stakes, which stands for Ib1i ln (τh1i − t+ 1),the monetary bene�t of those who have positive net savings from the ticket on tripsto parents. This e�ect is robust to the inclusion of additional motives and controlvariables. Quantitatively, a 10% increase in the net gain from the ticket raises theprobability of participation by 0.3 to 0.4 percentage points. Using the speci�cationfrom column (5), for a benchmark student, this results in an increase in the predictedprobability of turnout from 54% at net savings of zero to 80% at average net savingsand to 86% at net savings of a thousand euros.
The variable neg. stakes, which stands for Ib0i (t− τh1i ), the absolute value of themonetary loss in�icted by the ticket, also shows a positive sign. It is insigni�cant inthe �rst columns but approaches signi�cance when more explanatory variables areincluded. Similarly to the voting decision, the di�erence in signi�cance between bothstakes variables may be due to the asymmetric distribution of gains and losses: thelatter are limited to the yearly price of the ticket, 84.48 euros, whereas the stakes ofsomeone who uses the Bahn ticket every weekend to visit his or her parents could bemuch higher. In terms of size, the coe�cient estimated for negative stakes is againsubstantial. Based on the speci�cation in column (5) of Table 13, a benchmark
17As in Section 6, all binary variables are zero for benchmark students. The continuous variablesenter into the calculation of marginal e�ects at individual values.
42
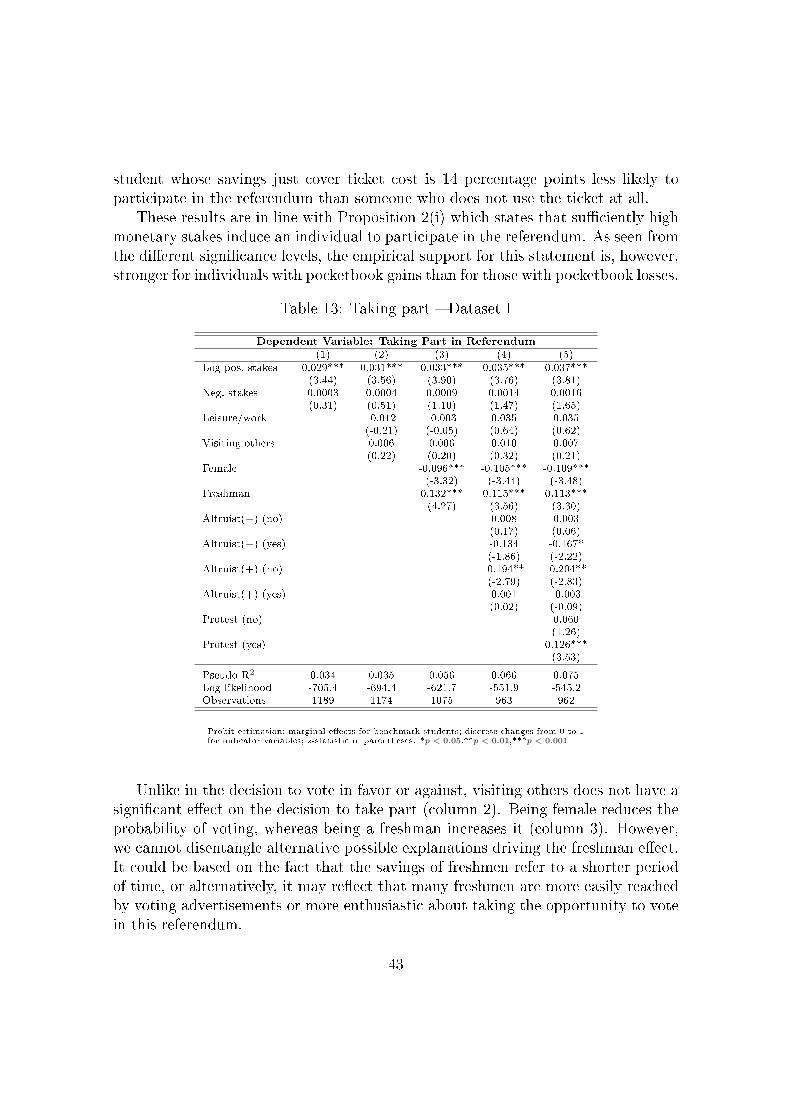
student whose savings just cover ticket cost is 14 percentage points less likely toparticipate in the referendum than someone who does not use the ticket at all.
These results are in line with Proposition 2(i) which states that su�ciently highmonetary stakes induce an individual to participate in the referendum. As seen fromthe di�erent signi�cance levels, the empirical support for this statement is, however,stronger for individuals with pocketbook gains than for those with pocketbook losses.
Table 13: Taking part � Dataset I
Dependent Variable: Taking Part in Referendum
(1) (2) (3) (4) (5)Log pos. stakes 0.029*** 0.031*** 0.033*** 0.035*** 0.037***
(3.44) (3.56) (3.90) (3.76) (3.81)Neg. stakes 0.0003 0.0004 0.0009 0.0014 0.0016
(0.31) (0.51) (1.10) (1.47) (1.65)Leisure/work -0.012 -0.003 0.035 0.035
(-0.21) (-0.05) (0.64) (0.62)Visiting others 0.006 0.006 0.010 0.007
(0.22) (0.20) (0.32) (0.21)Female -0.096*** -0.105*** -0.109***
(-3.32) (-3.44) (-3.48)Freshman 0.132*** 0.115*** 0.113***
(4.27) (3.56) (3.30)Altruist(−) (no) 0.008 0.003
(0.17) (0.06)Altruist(−) (yes) -0.134 -0.167*
(-1.86) (-2.22)Altruist(+) (no) -0.194** -0.204**
(-2.79) (-2.83)Altruist(+) (yes) 0.001 -0.003
(0.02) (-0.09)Protest (no) 0.060
(1.26)Protest (yes) 0.126***
(3.53)
Pseudo R2 0.034 0.035 0.056 0.066 0.075Log likelihood -705.4 -694.4 -621.7 -551.9 -545.2Observations 1189 1174 1075 963 962
Probit estimation; marginal e�ects for benchmark students; discrete changes from 0 to 1for indicator variables; z-statistic in parentheses. *p < 0.05,**p < 0.01,***p < 0.001.
Unlike in the decision to vote in favor or against, visiting others does not have asigni�cant e�ect on the decision to take part (column 2). Being female reduces theprobability of voting, whereas being a freshman increases it (column 3). However,we cannot disentangle alternative possible explanations driving the freshman e�ect.It could be based on the fact that the savings of freshmen refer to a shorter periodof time, or alternatively, it may re�ect that many freshmen are more easily reachedby voting advertisements or more enthusiastic about taking the opportunity to votein this referendum.
43

Columns (4) and (5) introduce variables measuring the joint e�ect of social pref-erences and expressive concerns. We �nd large negative e�ects for altruist(−) (yes)and altruist(+) (no), the �rst e�ect being statistically signi�cant in column (5) andthe second one in both columns. The �rst of these variables equals one for an indi-vidual who states that he or she cares for the bene�t of others, thinks that otherson average lose out by the ticket, and voted or would have voted in favor of theticket. According to column (5), such an individual is 17% less likely to participatethan someone who does not mention that he or she cares for others. Similarly, analtruist(+) (no), i.e. someone who mentions to care for others, thinks that otherstudents gain from the ticket, and voted or would have voted against, is 20% lesslikely to take part. These two e�ects show that students who consider the bene�tsof others but whose intended vote goes against the perceived interests of others aresubstantially less likely to participate. In contrast, the variables altruist(−) (no)and altruist(+) (yes) are not signi�cantly di�erent from zero.
This result can be explained by Corollary 2. To see this, consider a group of voterswho have zero or very small net cost of participation ci − di. Among these voters,everyone who has no social or expressive concern for others will participate and votein line with his or her monetary interests. Those whose social or expressive concernsfor others go in the same direction as their pocketbook motive will also participate.Thus, adding an altruistic motive which is in line with monetary interests does notchange the participation decision if net costs of participation are very small. Thisexplains why the variables altruist(−) (no) and altruist(+) (yes) have no impact.In contrast, voters whose expressive concern for others suggests voting against theirmonetary interests face a trade-o�. As Corollary 2 shows, they may solve thiscon�ict by abstaining. This explains the negative impacts of altruist(−) (yes) andaltruist(+) (no).
Those who mention protest motives took part in the referendum with higherprobability (column 5), even if the corresponding variable is signi�cant only forthose whose actual or intended vote is yes. Possibly, students who mention protestmotives are generally more engaged in the debate about the ticket, and thereforemore likely to turn out. They may also want to support student representatives, whocampaigned for accepting the ticket, and therefore felt compelled to vote in favor,even if they still considered the price too high. Altogether, we see this result in linewith Proposition 2(ii), which states that stronger expressive or social concerns makeparticipation more attractive.
Our results on the participation decision imply that a substantial share of theelectorate considered their probability of being pivotal to be non-negligible. To seethis, note �rst that if the net cost of participation ci − di were non-positive, thenevery individual whose monetary and social or expressive bene�ts both are in favor
44

of a yes vote would participate by Equation (2). In our data, however, among thosewho at the same time have positive stakes and are altruist(+)(yes), 24% did notvote. Hence, for a substantial share of voters the net cost of voting is positive.The fact that we �nd a positive and statistically signi�cant coe�cient on positivemonetary stakes therefore implies that the perceived probability p1i is non-negligiblefor a substantial share of the electorate.
We next examine whether students with high gains from the ticket drive the�nding that pocketbook bene�ts are relevant for participation. For this purpose,we gradually remove observations with the highest net savings from the dataset.Table 14 contains corresponding average marginal e�ects for benchmark students.In regression (1), we omit the top 5% in terms of net savings, whereas in regression(6), we omit the top 30%. Positive stakes have a positive and highly signi�cante�ect if we use almost all of the observations. The more observations with high netsavings we remove, the smaller the size and z-statistic of the marginal e�ects become.Looking at the bottom 75% only, the e�ect is no longer signi�cantly di�erent fromzero. In contrast, the signi�cance of most other variables su�ers much less fromthis reduction of the sample, and the marginal e�ects are much more stable. Thissuggests that the loss of signi�cance for the stakes variable should not be attributedto the smaller sample size alone. Instead, it appears that in particular studentswith very high gains from the ticket are responsible for the e�ect found for the fullsample in Table 13, as they made sure to take part in the referendum. This is againin line with Proposition 2(i), which requires that, to induce participation, monetarystakes must exceed a certain threshold determined by social and expressive concernsas well as the net cost of participation.
Some econometric issues may arise related to the estimation of the participationequation. The indicator for the actual or intended vote might not be exogenous. Thiswould be the case if the error terms in the voting and the participation equations(6) and (8) were correlated, for example if there is an omitted variable which a�ectsboth decisions. However, it is not clear what such an omitted variable could be andin which direction it would bias our results.
Reverse causality should not be a problem here. The variables capturing travelpatterns and demographics are clearly not a�ected by the decision to vote. Theprotest variable is derived from the write-in section; consequently, it appears unlikelythat it captures ex-post rationalization of the participation decision. In contrast,stated altruism could be a�ected by the participation decision. One could arguethat it is easy to claim noble motivations if one does not make an actual decision.In this case, we would expect the share of those who state that they care for othersand would have voted in line with the perceived interest of others to be higheramong non-voters than among voters. This would imply negative coe�cients of the
45

Table 14: Taking part, reduced sample � Dataset I
Dependent Variable: Taking Part in Referendum
(1) (2) (3) (4) (5) (6)Bottom 95% 90% 85% 80% 75% 70%Log pos. stakes 0.038*** 0.035** 0.036** 0.030* 0.019 0.007
(3.48) (2.86) (2.79) (2.01) (1.04) (0.34)Neg. stakes 0.0015 0.0012 0.0013 0.0010 0.0006 0.0003
(1.54) (1.24) (1.29) (0.95) (0.57) (0.27)Leisure/work 0.040 0.037 0.032 0.040 0.027 -0.001
(0.66) (0.58) (0.48) (0.57) (0.37) (-0.02)Visiting others 0.009 0.010 0.016 0.018 0.002 -0.013
(0.28) (0.30) (0.45) (0.47) (0.04) (-0.33)Female -0.109*** -0.112*** -0.111** -0.104** -0.110** -0.099*
(-3.34) (-3.29) (-3.18) (-2.87) (-2.91) (-2.53)Freshman 0.119** 0.122** 0.117** 0.126** 0.127** 0.130**
(3.22) (3.14) (2.89) (2.91) (2.72) (2.63)Altruist(−) (no) 0.006 0.007 0.006 0.000 0.001 0.005
(0.11) (0.13) (0.10) (0.01) (0.02) (0.08)Altruist(−) (yes) -0.111 -0.107 -0.148 -0.144 -0.151 -0.123
(-1.38) (-1.30) (-1.70) (-1.56) (-1.54) (-1.16)Altruist(+) (no) -0.206** -0.208** -0.212** -0.216** -0.220** -0.215**
(-2.83) (-2.83) (-2.88) (-2.92) (-2.92) (-2.84)Altruist(+) (yes) -0.010 -0.008 -0.015 -0.022 0.000 0.030
(-0.26) (-0.21) (-0.36) (-0.50) (0.00) (0.64)Protest (no) 0.063 0.066 0.061 0.066 0.080 0.096
(1.28) (1.31) (1.18) (1.23) (1.47) (1.74)Protest (yes) 0.140*** 0.145*** 0.146*** 0.150*** 0.190*** 0.183***
(3.70) (3.69) (3.51) (3.37) (4.30) (3.72)
Pseudo R2 0.071 0.062 0.059 0.050 0.050 0.042Log likelihood -520.0 -508.2 -487.1 -469.2 -444.3 -422.8Observations 902 862 817 769 719 673
Probit estimation; marginal e�ects for benchmark students; discrete changes from 0 to 1 for indi-cator variables; z-statistic in parentheses. Columns show percentiles with respect to net savings,e.g., column (1) contains those observations that belong to the bottom 95% with respect to netsavings. *p < 0.05,**p < 0.01,***p < 0.001.
variables altruist(−) (no) and altruist(+) (yes). Similarly, we would expect thatamong those who did not vote a lower share would admit that they would havevoted against the interest of others than among those that actually voted. Thiswould lead to positive coe�cients of the variables altruist(−) (yes) and altruist(+)(no). These predictions are opposite to the observed patterns in Table 13, whichspeaks against this kind of reverse causality.
In summary, the results from this section shed some light on the motives forvoting in referenda. First, our results are in line with the theory of instrumentalvoting, which predicts that for a given probability of being pivotal and a given costof voting, participation should increase with stakes. More speci�cally, we concludethat those who gain substantially, and hence lose substantially if the ticket fails,particularly drive this result. Thus, in a referendum, one may expect disproportion-
46

ately higher turnout by voters who stand to bene�t or lose substantially when theproposal passes, whereas voters who are a�ected only moderately are more likelyto abstain. Second, we also �nd evidence that social preferences or expressive con-siderations, for example protest motives or a concern for others, have an impact onparticipation.
8 Conclusion
We provide a theory of individual voting and turnout decisions which integratesmonetary bene�ts, social preferences, and expressive concerns. Social preferencesare instrumental in the sense that voters want to change the outcome in a way thatbene�ts others. The theory of expressive voting suggests that voters perceive theirprobability of being pivotal to be negligible, and that they derive utility from votingin a particular way irrespective of the outcome. A major challenge in previousliterature on voting has been how to distinguish social preferences from expressivemotivations, as both could be driven by what appears good for others. Our modelallows to identify conditions under which each of these motives can be shown to berelevant.
We show that pocketbook bene�ts being relevant indicates that either voters donot perceive their impact on the outcome to be negligible, or expressive motivationsdo not play a role in the decision on how to vote. Conversely, if own pocketbookbene�ts do not explain voting, then voting is expressive. If the perceived probabilityof being pivotal is non-negligible, social preferences and expressive concerns areobservationally equivalent. In terms of whether to vote, we show that if pocketbookmotives and expressive concerns would require voting di�erently, abstention can berational even if voting is costless. This would be the case if expressive feelings fromabstention are the same as expressive feelings from voting di�erently than one wouldhave actually done. Abstaining is then a cheaper way of obtaining the expressivebene�t than voting against one's pocketbook.
We test our theory using individual data on referenda on deeply discounted �atrate tickets for train, bus, and cultural services held among university students. Theservice becomes much cheaper by being bought collectively; however, all membersof society, including those who do not use the service, must pay to �nance it. Thesame logic applies to any collective provision of a public good.
Our results show that monetary interests are a major driver of both turnoutand voting decisions. However, we also �nd that in addition to this `pocketbookvoting', social or expressive motives such as the costs and bene�ts to other stu-dents or the desire to support local public transportation or cultural life are alsoimportant and occasionally even decisive for the referendum outcome. Based on our
47

theory, the strong empirical support of pocketbook voting rules out a purely expres-sive explanation of observed voting behavior. The fact that also the probability ofparticipation increases in monetary stakes implies that a substantial share of theelectorate considered their probability of a�ecting the outcome to be non-negligible.
Our setting can be described as a real-world laboratory of direct democracy.Like in a laboratory, voters faced a clearly de�ned decision and had very goodinformation on the individual costs and bene�ts associated with both outcomes.Thus, confounding in�uences such as asymmetric information should be minimized.At the same time, the polity to which the respondents belong is real and the socialties between the participants are independent of researchers. Since the decisionswe study have strong parallels with decisions on local public goods, our results areparticularly informative for direct democracy at the local level. We invite otherresearchers to test the predictions of our theory in other settings. It would beespecially interesting to compare the relative importance of pocketbook bene�ts,social preferences, and expressive motives across referenda taking place at di�erentlevels of government. Jurisdictions like California and Switzerland would be fertiletesting grounds for such analyses.
Appendix
A.I Data handling
The survey for Dataset I was conducted online between July and November 2010.It was advertised in lectures, on posters on campus, and in two e-mails that weresent to all students of University of Goettingen from the o�ce of student a�airs.On the survey webpage students were informed that the survey was conducted forresearch purposes and about a possibility to participate in a lottery. At the end ofthe questionnaire, students were provided with a link to another webpage, wherethey could register for the lottery. In order to identify winners without ambiguity,we required the (unique) student ID number for a registration for the lottery aswell as an e-mail address. For the sake of data protection, questionnaire data andlottery data were collected in separate databases. As the savings variable plays akey role in explaining the decision on whether to vote and if voting, on how to vote,we excluded observations without information on voting behavior or for which wecannot assess savings, because, for instance, we lack data on traveling behavior orthe corresponding student started studying only one month before the referendumtook place. Besides, we removed less than �fteen observations from the datasetdue to clear data errors or where answers given seemed highly implausible, such asvisiting parents 20,000 times in one year.
48

A challenge in the data management is that 75 ID numbers show up twice andon di�erent days, suggesting that 75 students also show up twice in the dataset.Using the time stamps of the lottery data showed that in most cases, the responseswere entered shortly after receiving an e-mail from the o�ce of student a�airs thatwas advertising the survey. Therefore, it is likely that these students had forgot thatthey had already answered a survey or thought that they should answer for a secondtime. After we explored this issue, we realized that we also have time stamps forsurvey responses, although in a separate data base. To guarantee the anonymity ofrespondents, we recruited a research assistant who was not otherwise connected tothe project to select those entries from the lottery data that belong to duplicates inthe lottery data base and to provide the two time stamps for each of the 75 pairs. Asonly time stamps were extracted pairwisely from the lottery database, anonymitywas guaranteed at all times. Speci�cally, no individual information that could beused to identify the person behind a time stamp, such as a student ID number, wasextracted from the lottery data.
Time stamps from the lottery were then assigned to the time stamps in theresponse dataset. For all pairs of time stamps, we examined responses that weresubmitted close to the time stamp in the lottery. For all pairs of these subsamples,we identi�ed potential pairs of observations present in both subsamples, based onthe data provided. Initial selection was made using gender, year of birth and the zipcode of their parents. If students indicated that their parents do not live together,then the maternal, or if missing the paternal, zip code was used. If these threevariables, year of birth, gender and parental zip code, were the same for observationsin both subsamples, they were considered potential duplicates based on the dataprovided. Potential duplicates were then compared based on additional variables,such as subjects studied, travel frequencies, general attitudes and voting decisions,party preferences and reasons to be in favor and against the ticket. This procedureallowed us to identify 46 pairs of assigned duplicates. Consequently, we dropped thelater entry of every pair of duplicates from the dataset. This left us with 29 pairsof duplicates which we could not identify. This corresponds to about two percent ofthe dataset and should, therefore, have only a tiny e�ect on the results. To be onthe safe side, we also replicated the analysis of the second dataset without excludingobservations based on this assignment. The results remain virtually unchanged.
A.II Construction of the savings variable
In the survey, students were asked about their parents' address (zip code) and howmany times they visited their parents' residence within the last 12 months (July 1,2009 - June 30, 2010) using the Bahn ticket. If students indicated that their parents
49
did not live in the same city, questions were asked for both parents separately.To translate trips to parents into monetary savings, the nearest train station
covered by the Bahn ticket was identi�ed for every parental address (zip code) usinga standard route planner.18 Afterwards, for each station, the relevant price wasderived. Therefore, we identi�ed the suggested route to Goettingen using localtrains for all stations on the Bahn tracks (dashed blue lines on the map, Figure 1)using software provided by Deutsche Bahn. At the time of the referendum, it wasalready known that students could use the MetroCan tracks (solid red lines) withoutadditional costs. Consequently, savings per trip from the Bahn ticket are the pricethat would have to be paid to the station on this route where the �free� train (red)is entered.19
If the determined price was greater than 21 euros it was capped to this amountto re�ect the possibility to buy the so called Lower-Saxony-ticket that is valid on alllocal trains in the state on the day of validation at this price. As furthermore everyvisit consists of the way back and forth, �nal savings are calculated as the productof the relevant price and twice the number of visits using the Bahn ticket. To alsore�ect the opportunity to buy a train ticket for all trains in Germany including highspeed trains (BahnCard100) at a price of 3800 euros per year at the time of thesurvey, the savings variable is capped at 3800 euros.
For some students in Dataset I, Goettingen is not the nearest train station.Most of these students live in the same town as their parents, presumably withtheir parents. For these students, the savings variable captures direct monetarysavings when they come to campus. If they live apart from their parents we calculatesavings correspondingly, starting from their respective nearest station. Ten students,however, live outside Goettingen apart from their parents and save little on trips tothem, but could primarily use this ticket for commuting. We refrain from calculatingsavings in these cases as they might severely misrepresent the bene�t from the ticket.Consequently, these observations are dropped.
A.III Approximation of b1i − b0iIn this Appendix, we show how our measure of the monetary gains given in (7)relates to the equivalent variation b1i − b0i . Consider �rst voters with h1i = 0, whodo not care for the public good. These voters will also choose h0i = 0, so that oneimmediately has b1i − b0i = −t = τh1i − t. Thus, for voters with a corner solution forthe use of the public good, our measure is exact.
18Google maps, standard proposal for cars.19Due to the non-linear pricing in the German railway market, this price is in most cases not
equal to the price from a station to Goettingen less the price from the station where the free trainis entered to Goettingen.
50
Consider then voters with h1i > 0. From the strict concavity of wi and theoptimality conditions, for these individuals it follows τ ≥ w′i(h
0i ) > 0 = w′i(h
1i ) and
0 ≤ h0i < h1i . Hence
wi
(h0i)
+ τ(h1i − h0i
)≥ wi
(h0i)
+ w′i(h0i )(h1i − h0i
)> wi
(h1i)
=⇒ τh1i − t > wi
(h1i)− t−
[wi
(h0i)− τh0i
]= b1i − b0i . (A.9)
There are three cases.(a) b1i − b0i > 0. Then with (A.9) also τh1i − t > 0, and hence (A.9) shows that
observed net savings τh1i − t overestimate the true net monetary gain b1i − b0i .(b) τh1i−t < 0. Then with (A.9) also b1i−b0i < 0, and hence, (A.9) is equivalent to
|τh1i − t| < |b1i − b0i | . Hence, in this case the absolute value of observed net savings,or `stakes', underestimates the absolute value of the true monetary loss.
(c) b1i − b0i < 0 < τh1i − t. Here, the approximation of the equivalent variationby net savings goes in the wrong direction. We expect, however, that the errorintroduced by this approximation is moderate given that this case occurs when netsavings are rather close to zero.
To correct for the overestimation in case (a), positive net savings should bereduced. This is particularly important for observations with very high values ofh1i , of which our dataset contains several. We choose to take the log to achieve this,after augmenting net savings by one to make sure the measure is positive also forobservations with net savings between 0 and 1.
To correct for the underestimation in case (b), we could in the same way enhancethe loss |τh1i − t| conferred by the public good. However, the di�erence between h1iand h0i , and hence the di�erence between |b1i − b0i | and |τh1i − t| is rather small whennet savings are negative. As mentioned above, the underestimation even vanishescompletely for individuals who do not use the public good at all. Given that inour dataset a large share of the voters with negative net savings display such acorner solution, we consider it the best choice to approximate, for individuals withnegative net savings, the loss conferred by the public good by the absolute value ofnet savings without any correction.
Altogether, we approximate
b1i − b0i =
{ln (τh1i − t+ 1) if τh1i − t ≥ 0
τh1i − t if τh1i − t < 0 .
Notice that this function is di�erentiable at τh1i − t = 0. At this point, on bothbranches, it takes on the value 0 and the �rst derivative is 1.
51

A.IV Coe�cients
Table A.1: Bahn ticket � Dataset I, coe�cients for Table 9
Dependent Variable: Supporting Bahn Ticket
(1) (2) (3) (4) (5)Log pos. net savings 0.200*** 0.231*** 0.232*** 0.203*** 0.200***
(0.04) (0.05) (0.05) (0.06) (0.06)Neg. net savings 0.006 0.001 0.002 0.006 0.006
(0.00) (0.00) (0.00) (0.00) (0.00)Leisure/work 0.235 0.101 0.108 0.123
(0.24) (0.26) (0.28) (0.28)Visiting others 1.053*** 1.095*** 1.001*** 1.023***
(0.11) (0.12) (0.14) (0.14)Female 0.183 0.131 0.126
(0.12) (0.13) (0.13)Freshman 0.260 0.373* 0.405*
(0.16) (0.19) (0.19)Altruist(−) -0.534** -0.521**
(0.18) (0.18)Altruist(+) 1.016*** 1.022***
(0.16) (0.17)Protest -0.290
(0.15)Constant 0.312 -0.640* -0.681* -0.564 -0.474
(0.22) (0.25) (0.28) (0.33) (0.34)
Pseudo R2 0.232 0.321 0.344 0.438 0.442Log likelihood -392.2 -344.4 -302.2 -234.5 -232.6Observations 818 810 741 669 669
Probit estimation; coe�cients; standard errors in parentheses.*p < 0.05,**p < 0.01,***p < 0.001.
52
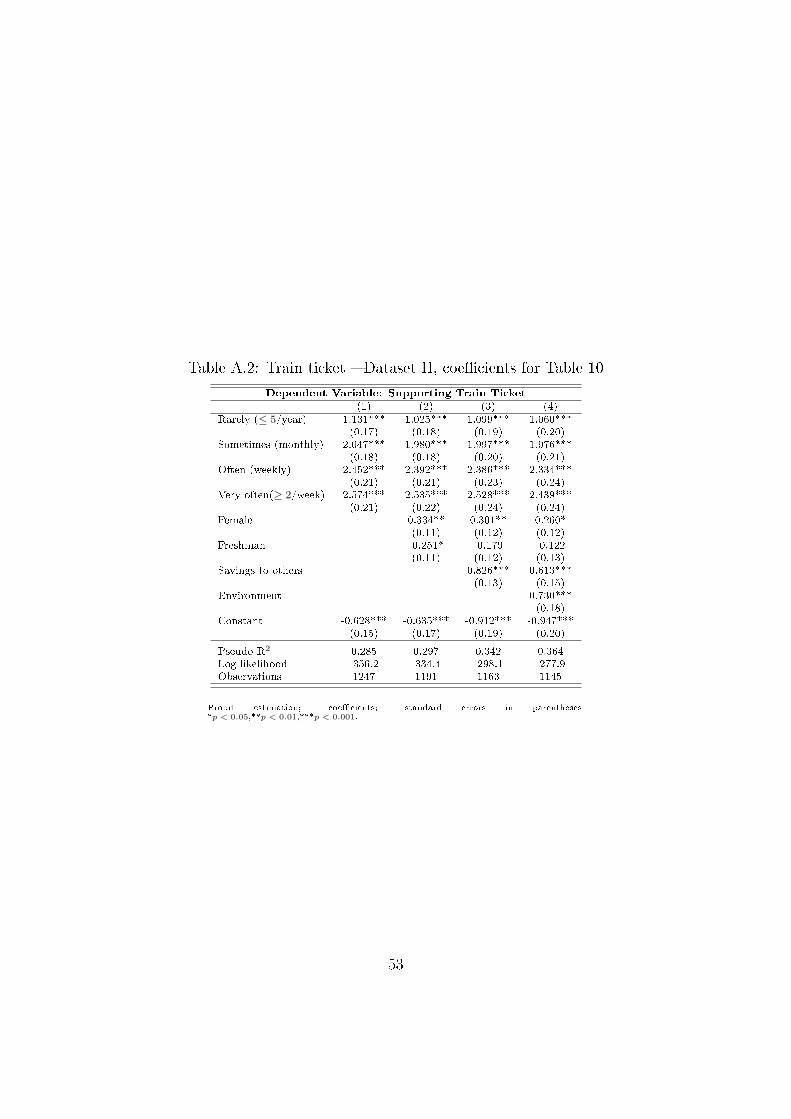
Table A.2: Train ticket � Dataset II, coe�cients for Table 10
Dependent Variable: Supporting Train Ticket
(1) (2) (3) (4)Rarely (≤ 5/year) 1.131*** 1.025*** 1.099*** 1.060***
(0.17) (0.18) (0.19) (0.20)Sometimes (monthly) 2.047*** 1.980*** 1.997*** 1.976***
(0.18) (0.18) (0.20) (0.21)Often (weekly) 2.452*** 2.392*** 2.386*** 2.334***
(0.21) (0.21) (0.23) (0.24)Very often(≥ 2/week) 2.574*** 2.535*** 2.528*** 2.439***
(0.21) (0.22) (0.24) (0.24)Female 0.334** 0.301** 0.260*
(0.11) (0.12) (0.12)Freshman -0.251* -0.179 -0.122
(0.11) (0.12) (0.13)Savings to others 0.826*** 0.613***
(0.13) (0.15)Environment 0.730***
(0.18)Constant -0.628*** -0.635*** -0.912*** -0.947***
(0.15) (0.17) (0.19) (0.20)
Pseudo R2 0.285 0.297 0.342 0.364Log likelihood -356.2 -334.4 -298.1 -277.9Observations 1247 1191 1163 1145
Probit estimation; coe�cients; standard errors in parentheses.*p < 0.05,**p < 0.01,***p < 0.001.
53

Table A.3: Bus ticket � Dataset II, coe�cients for Table 11
Dependent Variable: Supporting Bus Ticket
(1) (2) (3) (4)Rarely (1 or 2/semester) 0.659*** 0.672*** 0.654*** 0.631***
(0.10) (0.10) (0.10) (0.11)Sometimes (monthly) 1.106*** 1.188*** 1.159*** 1.160***
(0.12) (0.13) (0.13) (0.14)Often (weekly) 1.690*** 1.735*** 1.746*** 1.653***
(0.16) (0.16) (0.16) (0.17)Very often (≥ 2/week) 2.306*** 2.339*** 2.350*** 2.222***
(0.16) (0.17) (0.18) (0.19)Female -0.003 -0.023 0.026
(0.08) (0.09) (0.09)Freshman 0.249** 0.273** 0.238*
(0.09) (0.09) (0.09)Savings to others 0.621*** 0.509***
(0.10) (0.11)Strengthening bus system 1.179***
(0.18)Constant -0.710*** -0.799*** -0.915*** -0.959***
(0.06) (0.08) (0.09) (0.09)
Pseudo R2 0.224 0.232 0.252 0.285Log likelihood -668.1 -629.3 -589.1 -539.1Observations 1242 1183 1137 1090
Probit estimation; coe�cients; standard errors in parentheses.*p < 0.05,**p < 0.01,***p < 0.001.
54
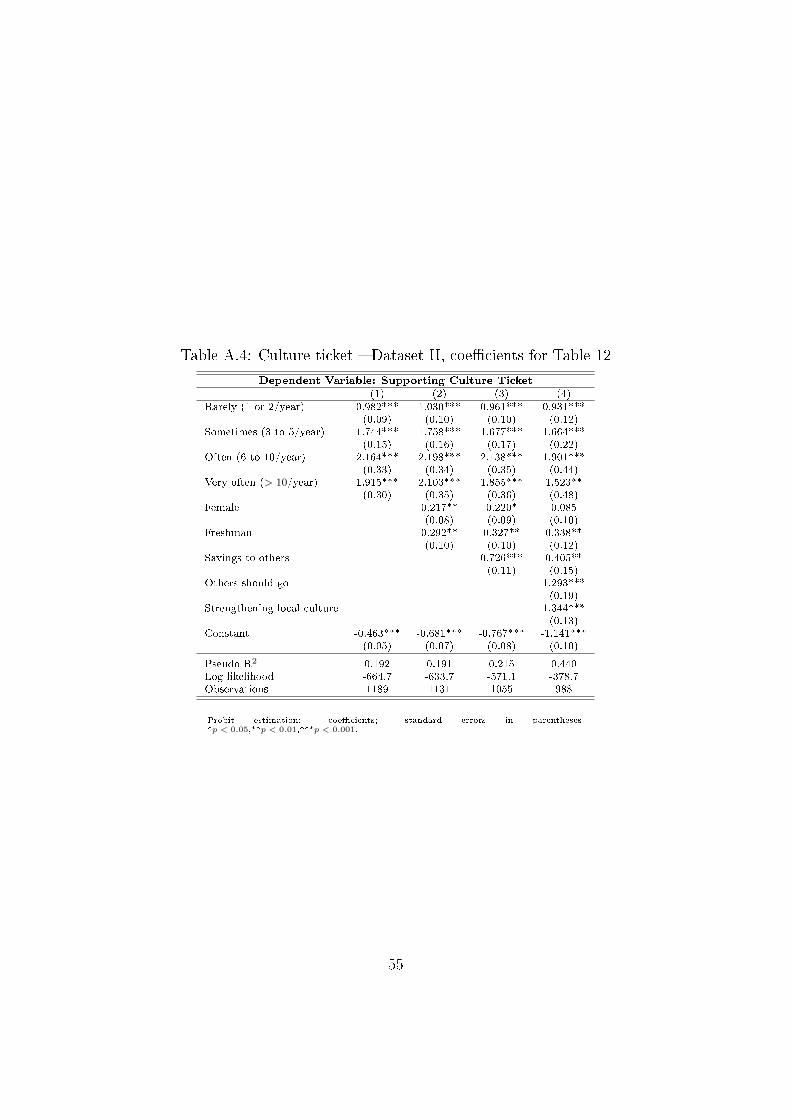
Table A.4: Culture ticket � Dataset II, coe�cients for Table 12
Dependent Variable: Supporting Culture Ticket
(1) (2) (3) (4)Rarely (1 or 2/year) 0.982*** 1.030*** 0.961*** 0.931***
(0.09) (0.10) (0.10) (0.12)Sometimes (3 to 5/year) 1.744*** 1.758*** 1.677*** 1.664***
(0.15) (0.16) (0.17) (0.22)Often (6 to 10/year) 2.164*** 2.198*** 2.138*** 1.901***
(0.33) (0.34) (0.35) (0.44)Very often (> 10/year) 1.915*** 2.103*** 1.855*** 1.523**
(0.30) (0.35) (0.36) (0.48)Female 0.217** 0.220* 0.085
(0.08) (0.09) (0.10)Freshman 0.292** 0.327** 0.338**
(0.10) (0.10) (0.12)Savings to others 0.726*** 0.405**
(0.11) (0.15)Others should go 1.293***
(0.19)Strengthening local culture 1.344***
(0.13)Constant -0.463*** -0.681*** -0.767*** -1.141***
(0.05) (0.07) (0.08) (0.10)
Pseudo R2 0.192 0.191 0.215 0.440Log likelihood -664.7 -633.7 -571.1 -378.7Observations 1189 1131 1055 988
Probit estimation; coe�cients; standard errors in parentheses.*p < 0.05,**p < 0.01,***p < 0.001.
55
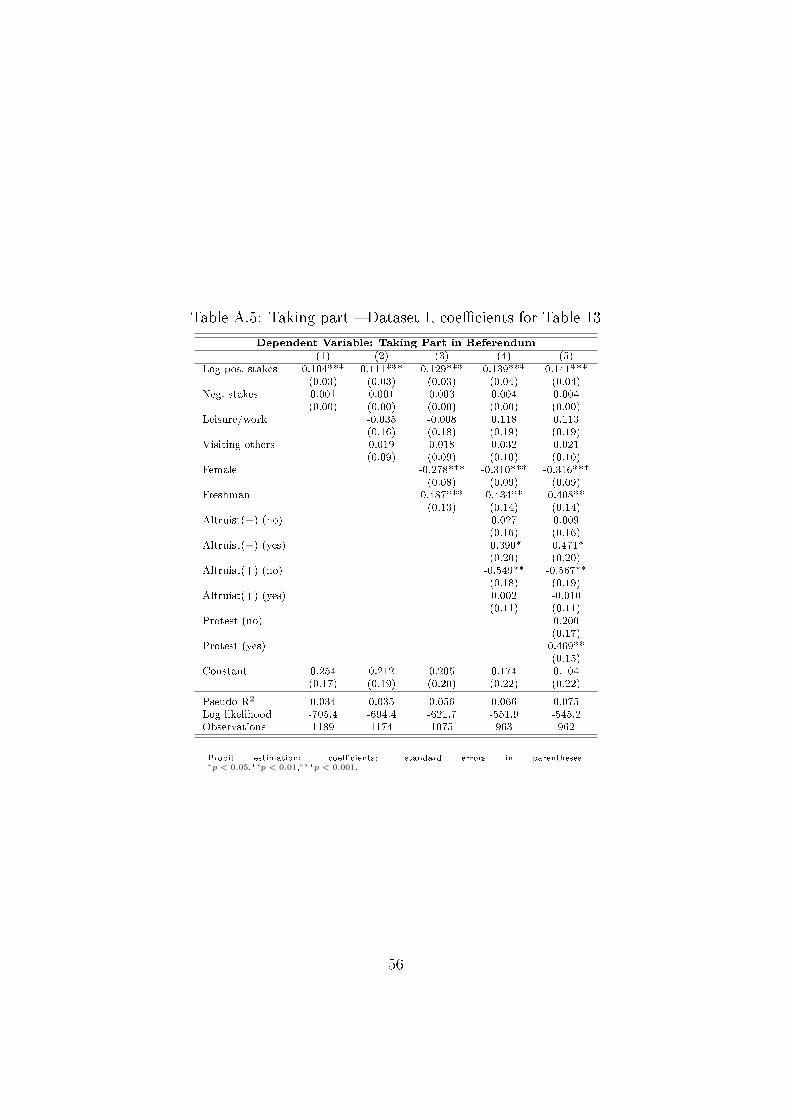
Table A.5: Taking part � Dataset I, coe�cients for Table 13
Dependent Variable: Taking Part in Referendum
(1) (2) (3) (4) (5)Log pos. stakes 0.104*** 0.111*** 0.129*** 0.139*** 0.141***
(0.03) (0.03) (0.03) (0.04) (0.04)Neg. stakes 0.001 0.001 0.003 0.004 0.004
(0.00) (0.00) (0.00) (0.00) (0.00)Leisure/work -0.035 -0.008 0.118 0.113
(0.16) (0.18) (0.19) (0.19)Visiting others 0.019 0.018 0.032 0.021
(0.09) (0.09) (0.10) (0.10)Female -0.278*** -0.310*** -0.316***
(0.08) (0.09) (0.09)Freshman 0.487*** 0.434** 0.408**
(0.13) (0.14) (0.14)Altruist(−) (no) 0.027 0.009
(0.16) (0.16)Altruist(−) (yes) -0.390* -0.471*
(0.20) (0.20)Altruist(+) (no) -0.549** -0.567**
(0.18) (0.19)Altruist(+) (yes) 0.002 -0.010
(0.11) (0.11)Protest (no) 0.200
(0.17)Protest (yes) 0.469**
(0.15)Constant 0.254 0.212 0.205 0.174 0.104
(0.17) (0.19) (0.20) (0.22) (0.22)
Pseudo R2 0.034 0.035 0.056 0.066 0.075Log likelihood -705.4 -694.4 -621.7 -551.9 -545.2Observations 1189 1174 1075 963 962
Probit estimation; coe�cients; standard errors in parentheses.*p < 0.05,**p < 0.01,***p < 0.001.
56

Table A.6: Taking part, reduced sample � Dataset I, coe�cients for Table 14
Dependent Variable: Taking Part in Referendum
(1) (2) (3) (4) (5) (6)Bottom 95% 90% 85% 80% 75% 70%Log pos. stakes 0.139*** 0.118** 0.122** 0.094 0.054 0.020
(0.04) (0.04) (0.04) (0.05) (0.05) (0.06)Neg. stakes 0.004 0.003 0.004 0.003 0.002 0.001
(0.00) (0.00) (0.00) (0.00) (0.00) (0.00)Leisure/work 0.126 0.113 0.095 0.115 0.077 -0.003
(0.20) (0.20) (0.20) (0.21) (0.21) (0.22)Visiting others 0.029 0.031 0.047 0.050 0.005 -0.036
(0.10) (0.10) (0.10) (0.11) (0.11) (0.11)Female -0.309*** -0.309** -0.304** -0.279** -0.290** -0.259*
(0.09) (0.09) (0.10) (0.10) (0.10) (0.10)Freshman 0.415** 0.410** 0.385** 0.405** 0.395* 0.396*
(0.14) (0.15) (0.15) (0.15) (0.16) (0.17)Altruist(−) (no) 0.017 0.021 0.016 0.001 0.004 0.013
(0.16) (0.16) (0.16) (0.17) (0.17) (0.17)Altruist(−) (yes) -0.314 -0.297 -0.402 -0.383 -0.394 -0.319
(0.22) (0.22) (0.23) (0.24) (0.25) (0.27)Altruist(+) (no) -0.561** -0.556** -0.563** -0.565** -0.567** -0.550**
(0.19) (0.19) (0.19) (0.19) (0.19) (0.19)Altruist(+) (yes) -0.029 -0.024 -0.043 -0.061 0.000 0.082
(0.11) (0.11) (0.12) (0.12) (0.13) (0.13)Protest (no) 0.203 0.208 0.190 0.198 0.236 0.281
(0.17) (0.17) (0.17) (0.17) (0.17) (0.17)Protest (yes) 0.505** 0.508** 0.505** 0.498** 0.649*** 0.598**
(0.16) (0.16) (0.17) (0.17) (0.19) (0.19)Constant 0.101 0.158 0.146 0.206 0.295 0.348
(0.23) (0.24) (0.24) (0.25) (0.25) (0.26)
Pseudo R2 0.071 0.062 0.059 0.050 0.050 0.042Log likelihood -520.0 -508.2 -487.1 -469.2 -444.3 -422.8Observations 902 862 817 769 719 673
Probit estimation; coe�cients; standard errors in parentheses. Columns show percentiles withrespect to net savings, e.g., column (1) contains those observations that belong to the bottom95% with respect to net savings. *p < 0.05,**p < 0.01,***p < 0.001.
57
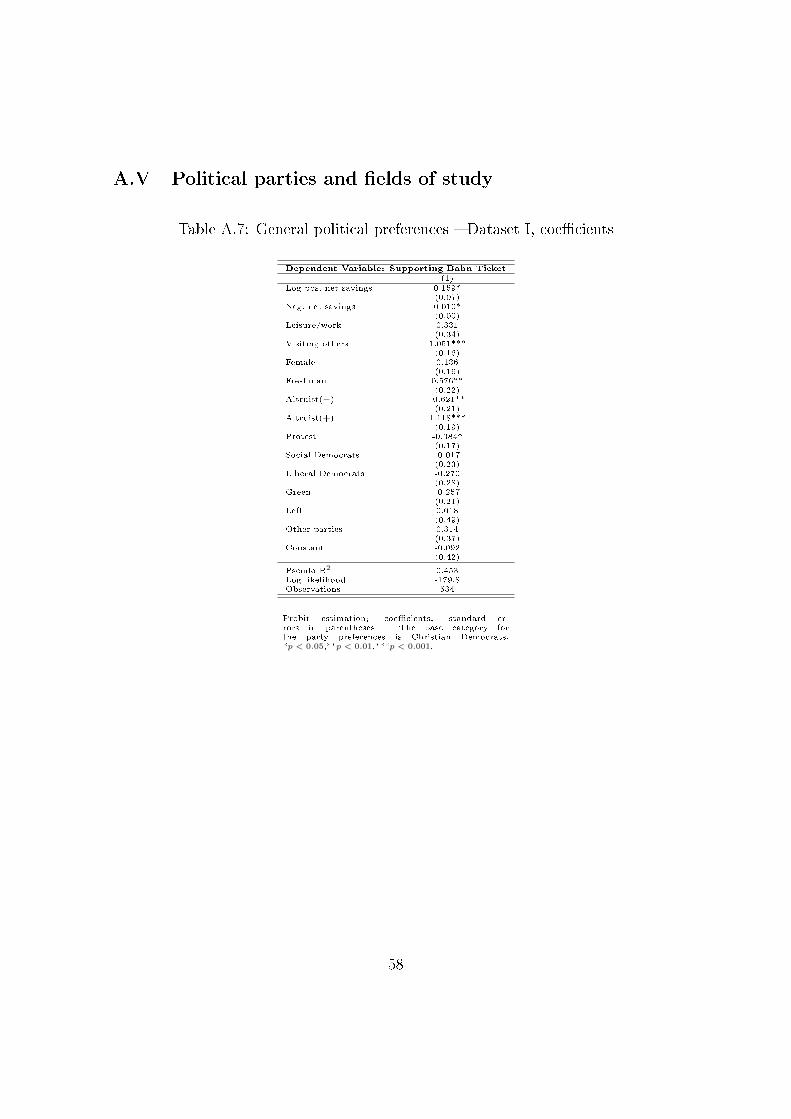
A.V Political parties and �elds of study
Table A.7: General political preferences � Dataset I, coe�cients
Dependent Variable: Supporting Bahn Ticket
(1)
Log pos. net savings 0.159*(0.07)
Neg. net savings 0.010*(0.00)
Leisure/work 0.331(0.34)
Visiting others 1.051***(0.16)
Female 0.136(0.16)
Freshman 0.576**(0.22)
Altruist(−) -0.621**(0.21)
Altruist(+) 1.118***(0.19)
Protest -0.384*(0.17)
Social Democrats -0.017(0.23)
Liberal Democrats -0.270(0.28)
Green -0.257(0.21)
Left 0.018(0.49)
Other parties 0.314(0.37)
Constant -0.092(0.42)
Pseudo R2 0.453Log likelihood -179.8Observations 534
Probit estimation; coe�cients; standard er-rors in parentheses. The base category forthe party preferences is Christian Democrats.*p < 0.05,**p < 0.01,***p < 0.001.
58
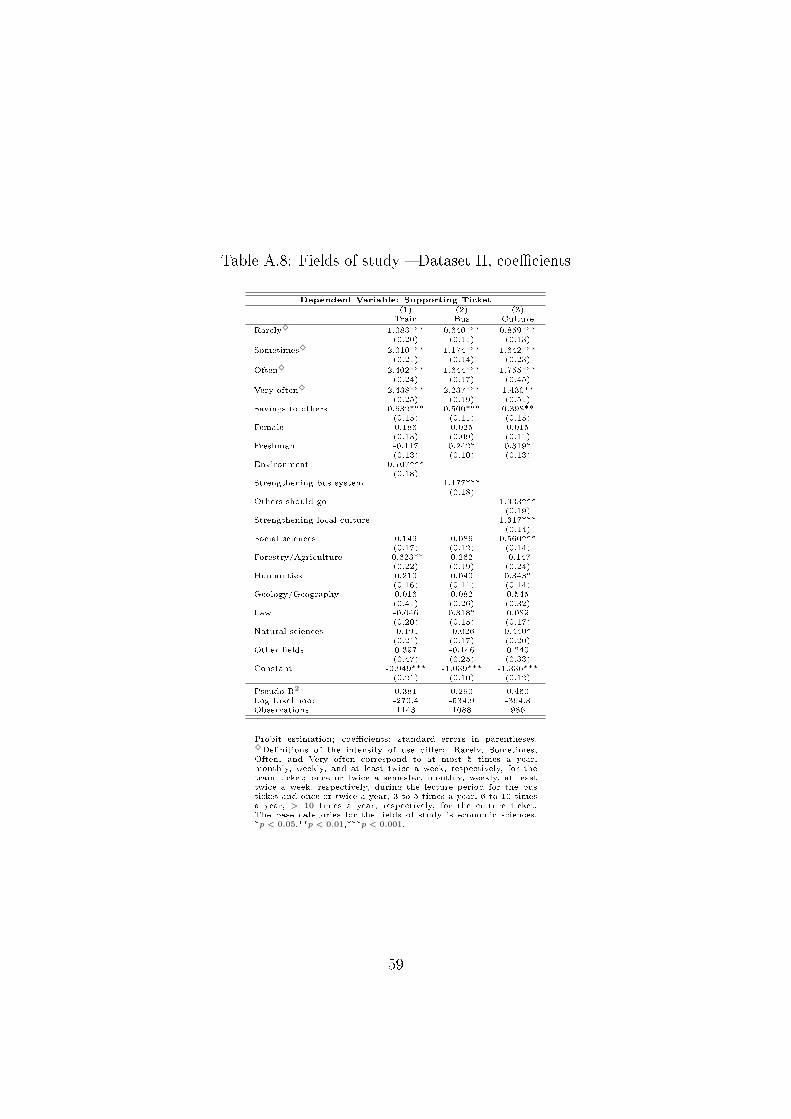
Table A.8: Fields of study � Dataset II, coe�cients
Dependent Variable: Supporting Ticket
(1) (2) (3)Train Bus Culture
Rarely♦ 1.083*** 0.640*** 0.859***(0.20) (0.11) (0.13)
Sometimes♦ 2.010*** 1.174*** 1.642***(0.21) (0.14) (0.23)
Often♦ 2.402*** 1.644*** 1.755***(0.24) (0.17) (0.45)
Very often♦ 2.438*** 2.237*** 1.430**(0.25) (0.19) (0.51)
Savings to others 0.632*** 0.500*** 0.398**(0.15) (0.11) (0.15)
Female 0.186 0.025 0.015(0.13) (0.09) (0.11)
Freshman -0.117 0.242* 0.319*(0.13) (0.10) (0.13)
Environment 0.707***(0.18)
Strengthening bus system 1.177***(0.18)
Others should go 1.333***(0.19)
Strengthening local culture 1.317***(0.14)
Social sciences 0.149 0.086 0.560***(0.17) (0.12) (0.14)
Forestry/Agriculture -0.623** 0.262 -0.147(0.22) (0.19) (0.24)
Humanities 0.210 0.040 0.343*(0.16) (0.11) (0.14)
Geology/Geography 0.016 0.082 0.545(0.41) (0.26) (0.32)
Law -0.046 0.318* 0.089(0.20) (0.15) (0.17)
Natural sciences -0.191 -0.026 0.440*(0.21) (0.17) (0.20)
Other �elds 0.397 -0.146 0.240(0.47) (0.25) (0.33)
Constant -0.949*** -1.039*** -1.336***(0.21) (0.10) (0.12)
Pseudo R2 0.381 0.290 0.460Log Likelihood -270.4 -534.9 -364.3Observations 1143 1088 986
Probit estimation; coe�cients; standard errors in parentheses.♦De�nitions of the intensity of use di�er: Rarely, Sometimes,Often, and Very often correspond to at most 5 times a year,monthly, weekly, and at least twice a week, respectively, for thetrain ticket; once or twice a semester, monthly, weekly, at leasttwice a week, respectively, during the lecture period for the busticket and once or twice a year, 3 to 5 times a year, 6 to 10 timesa year, > 10 times a year, respectively, for the culture ticket.The base categories for the �elds of study is economic sciences.*p < 0.05,**p < 0.01,***p < 0.001.
59

Table A.9: General political preferences � Dataset II, coe�cients
Dependent Variable: Supporting Ticket
(1) (2) (3)Train Bus Culture
Rarely♦ 1.034*** 0.585*** 0.893***(0.21) (0.11) (0.14)
Sometimes♦ 1.930*** 1.083*** 1.712***(0.22) (0.15) (0.25)
Often♦ 2.408*** 1.626*** 1.804***(0.26) (0.18) (0.44)
Very often♦ 2.344*** 2.104*** 1.981***(0.25) (0.20) (0.60)
Savings to others 0.690*** 0.538*** 0.366*(0.15) (0.12) (0.16)
Female 0.332* 0.040 -0.049(0.13) (0.10) (0.12)
Freshman -0.176 0.272** 0.346*(0.14) (0.10) (0.14)
Environment 0.663***(0.19)
Strengthening bus system 1.225***(0.20)
Others should go 1.267***(0.20)
Strengthening local culture 1.287***(0.15)
Social Democrats -0.104 0.017 0.628***(0.16) (0.12) (0.15)
Liberal Democrats -0.562 -0.232 0.171(0.29) (0.27) (0.27)
Green -0.104 -0.109 0.611***(0.17) (0.13) (0.16)
Left -0.065 0.037 0.970**(0.34) (0.25) (0.34)
Other parties 0.153 -0.076 0.260(0.31) (0.23) (0.28)
Constant -0.884*** -0.935*** -1.486***(0.23) (0.11) (0.14)
Pseudo R2 0.371 0.281 0.466Log Likelihood -246.5 -477.1 -312.7Observations 1000 958 858
Probit estimation; coe�cients; standard errors in parentheses.♦De�nitions of the intensity of use di�er: Rarely, Sometimes,Often, and Very often correspond to at most 5 times a year,monthly, weekly, and at least twice a week, respectively, for thetrain ticket; once or twice a semester, monthly, weekly, at leasttwice a week, respectively, during the lecture period for the busticket and once or twice a year, 3 to 5 times a year, 6 to 10 timesa year, > 10 times a year, respectively, for the culture ticket. Thebase category for the party preferences is Christian Democrats.*p < 0.05,**p < 0.01,***p < 0.001.
60
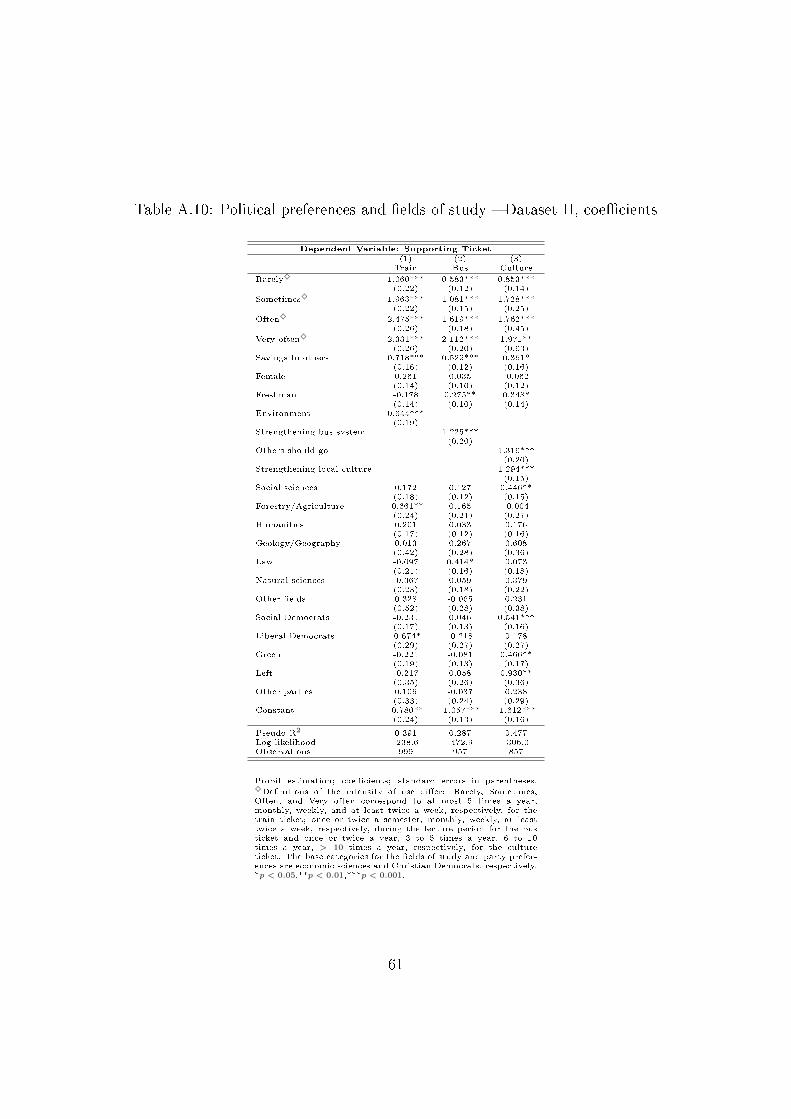
Table A.10: Political preferences and �elds of study � Dataset II, coe�cients
Dependent Variable: Supporting Ticket
(1) (2) (3)Train Bus Culture
Rarely♦ 1.060*** 0.583*** 0.853***(0.22) (0.12) (0.14)
Sometimes♦ 1.963*** 1.081*** 1.728***(0.22) (0.15) (0.25)
Often♦ 2.475*** 1.619*** 1.762***(0.26) (0.18) (0.45)
Very often♦ 2.331*** 2.112*** 1.971**(0.26) (0.20) (0.63)
Savings to others 0.718*** 0.529*** 0.361*(0.16) (0.12) (0.16)
Female 0.261 0.035 -0.062(0.14) (0.10) (0.12)
Freshman -0.178 0.275** 0.348*(0.14) (0.10) (0.14)
Environment 0.644***(0.19)
Strengthening bus system 1.225***(0.20)
Others should go 1.316***(0.20)
Strengthening local culture 1.294***(0.15)
Social sciences 0.172 0.127 0.446**(0.18) (0.12) (0.15)
Forestry/Agriculture -0.661** 0.165 -0.004(0.24) (0.21) (0.27)
Humanities 0.201 0.033 0.176(0.17) (0.12) (0.16)
Geology/Geography 0.013 0.267 0.608(0.42) (0.28) (0.36)
Law -0.097 0.414* 0.073(0.21) (0.16) (0.18)
Natural sciences -0.367 0.059 0.379(0.23) (0.18) (0.22)
Other �elds 0.328 -0.065 0.231(0.52) (0.28) (0.38)
Social Democrats -0.231 0.046 0.541***(0.17) (0.13) (0.16)
Liberal Democrats -0.674* -0.218 0.178(0.29) (0.27) (0.27)
Green -0.221 -0.081 0.466**(0.19) (0.13) (0.17)
Left -0.217 0.058 0.930**(0.35) (0.26) (0.36)
Other parties 0.106 -0.037 0.238(0.33) (0.24) (0.29)
Constant -0.780** -1.057*** -1.612***(0.24) (0.13) (0.16)
Pseudo R2 0.391 0.287 0.477Log likelihood -238.6 -472.9 -306.0Observations 999 957 857
Probit estimation; coe�cients; standard errors in parentheses.♦De�nitions of the intensity of use di�er: Rarely, Sometimes,Often, and Very often correspond to at most 5 times a year,monthly, weekly, and at least twice a week, respectively, for thetrain ticket; once or twice a semester, monthly, weekly, at leasttwice a week, respectively, during the lecture period for the busticket and once or twice a year, 3 to 5 times a year, 6 to 10times a year, > 10 times a year, respectively, for the cultureticket. The base categories for the �elds of study and party prefer-ences are economic sciences and Christian Democrats, respectively.*p < 0.05,**p < 0.01,***p < 0.001.
61

References
Akerlof, George A. and Rachel E. Kranton, �Economics and Identity,� Quar-terly Journal of Economics, 2000, 115 (3), 715�753.
Alesina, Alberto and George-Marios Angeletos, �Fairness and Redistribu-tion,� American Economic Review, 2005, 95 (4), 960�980.
Andersen, Jørgen J., Jon H. Fiva, and Gisle J. Natvik, �Voting when theStakes are High,� Journal of Public Economics, 2014, 110, 157�166.
Balafoutas, Loukas, Martin G. Kocher, Louis Putterman, and Matthias
Sutter, �Equality, Equity and Incentives: An Experiment,� European EconomicReview, 2013, 60, 32�51.
Ben-Bassat, Avi and Momi Dahan, �Social Identity and Voting Behavior,� Pub-lic Choice, 2012, 151 (1), 193�214.
Bénabou, Roland and Jean Tirole, �Belief in a Just World and RedistributivePolitics,� Quarterly Journal of Economics, 2006, 121 (2), 699�746.
Börgers, Tilman, �Costly Voting,� American Economic Review, 2004, 94 (1), 57�66.
Brennan, Geo�rey and James Buchanan, �Voter Choice: Evaluating PoliticalAlternatives,� American Behavioral Scientist, 1984, 28 (2), 185�201.
and Alan Hamlin, �Expressive Voting and Electoral Equilibrium,� PublicChoice, 1998, 95 (1-2), 149�175.
California State Board of Equalization, �California Property Tax: AnOverview,� Publication 29, November 2012, available at http://www.boe.ca.
gov/proptaxes/pdf/pub29.pdf (accessed September 28th, 2014) 2012.
Card, David, Christian Dustmann, and Ian Preston, �Immigration, Wages,and Compositional Amenities,� Journal of the European Economic Association,2012, 10 (1), 78�119.
Carlsson, Fredrik and Olof Johansson-Stenman, �Why Do You Vote and Voteas You Do?,� Kyklos, 2010, 63 (4), 495�516.
Carter, John and Stephen D. Guerette, �An Experimental Study of ExpressiveVoting,� Public Choice, 1992, 73, 251�260.
62

Coate, Stephen and Michael Conlin, �A Group Rule: Utilitarian Approach toVoter Turnout: Theory and Evidence,� American Economic Review, 2004, 94 (5),1476�1504.
, , and Andrea Moro, �The Performance of Pivotal-Voter Models in Small-Scale Elections: Evidence from Texas Liquor Referenda,� Journal of Public Eco-nomics, 2008, 92 (3-4), 582�596.
Coates, Dennis and Brad R. Humphreys, �Proximity Bene�ts and Voting onStadium and Arena Subsidies,� Journal of Urban Economics, 2006, 59 (2), 285�299.
De Tocqueville, Alexis, De la démocratie en Amérique, Vol. I, Paris: Garnier-Flammarion, 1981 [1835].
Deacon, Robert and Perry Shapiro, �Private Preference for Collective GoodsRevealed through Voting on Referenda,� American Economic Review, 1975, 65(5), 943�955.
DellaVigna, Stefano and Ulrike Malmendier, �Paying not to Go to the Gym,�American Economic Review, 2006, 96 (3), 694�719.
Dixit, Avinash and John Londregan, �The Determinants of Success of SpecialInterests in Redistributive Politics,� Journal of Politics, 1996, 58 (4), 1132�1155.
Downs, Anthony, An Economic Theory of Democracy, New York: Harper andRow Publishers, 1957.
Du�y, John and Margit Tavits, �Beliefs and Voting Decisions: A Test of thePivotal Voter Model,� American Journal of Political Science, 2008, 52 (3), 603�618.
Elinder, Mikael, Henrik Jordahl, and Panu Poutvaara, �Promises, Policiesand Pocketbook Voting,� European Economic Review, 2015, 75, 177�194.
Epple, Dennis N. and Richard E. Romano, �Public Provision of PrivateGoods,� Journal of Political Economy, 1996, 104 (1), 57�84.
, Thomas Romer, and Holger Sieg, �Interjurisdictional Sorting and MajorityRule: An Empirical Analysis,� Econometrica, 2001, 69 (6), 1437�1465.
Fehr, Ernst and Klaus M. Schmidt, �A Theory of Fairness, Competition, andCooperation,� Quarterly Journal of Economics, 1999, 114 (3), 817�868.
63

Feld, Lars P. and Gebhard Kirchgässner, �The Political Economy of DirectLegislation: Direct Democracy and Local Decision�Making,� Economic Policy,2001, 16 (33), 329�367.
and John G. Matsusaka, �Budget Referendums and Government Spending:Evidence from Swiss Cantons,� Journal of Public Economics, 2003, 87 (12), 2703�2724.
Fiorina, Morris P., �Economic Retrospective Voting in American National Elec-tions: A Micro-Analysis,� American Journal of Political Science, 1978, 22 (2),426�443.
Fischer, A. J., �A Further Experimental Study of Expressive Voting,� PublicChoice, 1996, 88, 171�184.
Fong, Christina, �Social Preferences, Self-Interest, and the Demand for Redistri-bution,� Journal of Public Economics, 2001, 82 (2), 225�246.
Funk, Patricia, �Social Incentives and Voter Turnout: Evidence from the SwissMail Ballot System,� Journal of the European Economic Association, 2010, 8 (5),1077�1103.
and Christina Gathmann, �Does Direct Democracy Reduce the Size of Gov-ernment? New Evidence from Historical Data, 1890�2000,� Economic Journal,2011, 121 (557), 1252�1280.
Gerber, Alan S., Donald P. Green, and Christopher W. Larimer, �SocialPressure and Voter Turnout: Evidence from a Large-Scale Field Experiment,�American Political Science Review, 2008, 102 (1), 33�48.
Hamlin, Alan and Colin Jennings, �Expressive Political Behaviour: Founda-tions, Scope and Implications,� British Journal of Political Science, 2011, 41 (3),645�670.
Harsanyi, John C., �Rule Utilitarianism, Rights, Obligations and the Theory ofRational Behavior,� Theory and Decision, 1980, 12 (2), 115�133.
Hillman, Arye L., �Expressive Behavior in Economics and Politics,� EuropeanJournal of Political Economy, 2010, 26 (4), 403�418.
, K�r Metsuyanim, and Niklas Potrafke, �Democracy with Group Identity,�European Journal of Political Economy, 2015, 40 (B), 274�287.
64
Kahneman, Daniel and Amos Tversky, �Prospect Theory: An Analysis ofDecision under Risk,� Econometrica, 1979, 47 (2), 263�292.
Levitt, Steven D. and James M. Snyder, �The Impact of Federal Spending onHouse Election Outcomes,� Journal of Political Economy, 1997, 105 (1), 30�53.
Lewis-Beck, Michael S. and Mary Stegmaier, �Economic Models of Voting,�in Russel J. Dalton and Hans-Dieter Klingemann, eds., The Oxford Handbook ofPolitical Behavior, 2007, pp. 518�537.
Lindbeck, Assar and Jörgen W. Weibull, �A Model of Political Equilibrium in aRepresentative Democracy,� Journal of Public Economics, 1993, 51 (2), 195�209.
Manacorda, Marco, Edward Miguel, and Andrea Vigorito, �GovernmentTransfers and Political Support,� American Economic Journal: Applied Eco-nomics, 2011, 3 (3), 1�28.
Markus, Gregory B., �The Impact of Personal and National Economic Conditionson the Presidential Vote: A Pooled Cross-Sectional Analysis,� American Journalof Political Science, 1988, 32 (1), 137�154.
Matsusaka, John G., �Fiscal E�ects of the Voter Initiative: Evidence from theLast 30 Years,� Journal of Political Economy, 1995, 103 (3), 587�623.
Meltzer, Allan H. and Scott F. Richard, �A Rational Theory of the Size ofGovernment,� Journal of Political Economy, 1981, 89 (5), 914�927.
Messer, Kent D., Gregory L. Poe, Daniel Rondeau, William D. Schulze,
and Christian A. Vossler, �Social Preferences and Voting: An ExplorationUsing a Novel Preference Revealing Mechanism,� Journal of Public Economics,2010, 94 (3-4), 308�317.
Piketty, Thomas, �Social Mobility and Redistributive Politics,� Quarterly Journalof Economics, 1995, 110 (3), 551�584.
Potrafke, Niklas, �Evidence on the Political Principal-Agent Problem from Votingon Public Finance for Concert Halls,� Constitutional Political Economy, 2013, 24(3), 215�238.
Riker, William H. and Peter C. Ordeshook, �A Theory of the Calculus ofVoting,� American Political Science Review, 1968, 62 (1), 25�42.
65
Romer, Thomas, Howard Rosenthal, and Vincent G. Munley, �EconomicIncentives and Political Institutions: Spending and Voting in School Budget Ref-erenda,� Journal of Public Economics, 1992, 49 (1), 1�33.
Rousseau, Jean-Jacques, On the Social Contract, Mineola, New York: DoverPublications, 2012 [1762].
Schumpeter, Joseph A., Capitalism, Socialism and Democracy, London, NewYork: Routledge, 1994 [1942].
Taylor, Curtis R. and Huseyin Yildirim, �A Uni�ed Analysis of Rational Votingwith Private Values and Group-speci�c Costs,� Games and Economics Behavior,2010, 70, 457�471.
Tiebout, Charles, �A Pure Theory of Local Expenditures,� Journal of PoliticalEconomy, 1956, 64 (5), 416�424.
Tullock, Gordon, �The Charity of the Uncharitable,� Western Economic Journal,1971, 9 (4), 379�392.
Tyran, Jean-Robert, �Voting when Money and Morals Con�ict: An ExperimentalTest of Expressive Voting,� Journal of Public Economics, 2004, 88, 1645�1664.
and Rupert Sausgruber, �A Little Fairness May Induce a lot of Redistributionin Democracy,� European Economic Review, 2006, 50 (2), 469�485.
Vlachos, Jonas, �Who Wants Political Integration? Evidence from the SwedishEU-Membership Referendum,� Journal of Public Economics, 2004, 88 (7-8), 1589�1604.
66