Embed Size (px)
Citation preview

A r t i c l e
The Rockefeller University Press $30.00J. Gen. Physiol. Vol. 136 No. 5 529–540www.jgp.org/cgi/doi/10.1085/jgp.201010528 529
I N T R O D U C T I O N
Mammalian odorant receptors (ORs) are a large group of G protein–coupled receptors (GPCRs) that comprise 1,000 functional receptors in rodents and 350 in humans (Mombaerts, 2004; Malnic, 2007; Spehr and Munger, 2009) and function in at least two roles. First, ORs located on the cilia of olfactory receptor neurons (ORNs) convey odorant specificity and sensitivity, with a given ORN thought to only express one OR type. Considerable progress has been made in de-orphaning odorant receptors since the first odorant–ligand pair, octanal and the I7 receptor, was identified (Zhao et al., 1998), and main aspects of olfactory transduction are relatively well understood. Activation of ORs increases, via the G protein Golf, adenylyl cyclase III (ACIII) activity and ciliary cAMP levels. Na+ and Ca2+ influx ensues through the olfactory CNG channel, and the elevated Ca2+ gates a second ion channel, the excitatory Ca2+- activated Cl channel Ano2 (Kleene, 1993; Stephan et al., 2009), which carries up to 80% of the overall transduc-tion current (Kurahashi and Yau, 1993; Lowe and Gold, 1993; Reisert et al., 2005). To terminate the response, cAMP is degraded to AMP by the phosphodiesterase PDE1C (Cygnar and Zhao, 2009) and Ca2+ is removed in mouse ORNs from the cilia by a Na+/Ca2+ exchanger (Reisert and Matthews, 2001a) to close the CNG chan-nel and Ca2+-activated Cl channel, respectively. (For a review of the cAMP pathway of olfactory transduction and other signal transduction pathways present in cells in the olfactory epithelium see Kleene, 2008; Fleischer et al., 2009; Kato and Touhara, 2009; Munger et al.,
Correspondence to Johannes Reisert: jreisert@monell.orgAbbreviations used in this paper: ACIII, adenylyl cyclase III; AP, action
potential; chca, cycloheptanecarbaldehyde; GPCR, G protein–coupled re-ceptor; IBMX, 3-isobutyl-1-methylxanthine; OR, odorant receptor; ORN, olfactory receptor neuron.
2009; Kaupp, 2010). In the absence of stimulation, indi-vidual ORNs typically show low spontaneous action potential (AP) firing rates ranging from 0 to 3 Hz (O’Connell and Mozell, 1969; Trotier and MacLeod, 1983; Frings et al., 1991; Reisert and Matthews, 2001b). The origin of this variation in basal activity is unknown but ORNs have been found to be intrinsically noisy, dis-playing variation in baseline current in the absence of odorants (Lowe and Gold, 1995).
Odorant receptors have a second important function in ORN axon targeting (Mombaerts, 2006; Imai and Sakano, 2008; Zou et al., 2009). Axons of ORNs express-ing a given OR coalesce and converge on typically two glomeruli per bulb, with ORs thought to play an instruc-tive role. Recently, ACIII and the G protein Gs, which is expressed in immature ORNs unlike Golf, have been im-plicated in contributing to glomerular map formation. Constitutively active forms of Gs can lead to the forma-tion of ectopic glomeruli and a posterior shift of glom-eruli in the bulb (Imai et al., 2006; Chesler et al., 2007).
Besides providing odorant specificity to ORNs and contributing to targeting ORN axons, mammalian OR contribution to olfactory response properties is not un-derstood. For example, do they determine response pattern and basal activity, as do Drosophila (ligand-gated) ORs (for review see Dahanukar et al., 2005; Su et al., 2009)? I investigated response characteristics of mouse ORNs expressing identified ORs with known ligands and demonstrate that different ORs display different con-stitutive activity. In the absence of odorant stimulation and depending on OR choice, ORNs display varying
Origin of basal activity in mammalian olfactory receptor neurons
Johannes Reisert
Monell Chemical Senses Center, Philadelphia, PA 19104
Mammalian odorant receptors form a large, diverse group of G protein–coupled receptors that determine the sen-sitivity and response profile of olfactory receptor neurons. But little is known if odorant receptors control basal and also stimulus-induced cellular properties of olfactory receptor neurons other than ligand specificity. This study demonstrates that different odorant receptors have varying degrees of basal activity, which drives concomitant re-ceptor current fluctuations and basal action potential firing. This basal activity can be suppressed by odorants functioning as inverse agonists. Furthermore, odorant-stimulated olfactory receptor neurons expressing different odorant receptors can have strikingly different response patterns in the later phases of prolonged stimulation. Thus, the influence of odorant receptor choice on response characteristics is much more complex than previously thought, which has important consequences on odor coding and odor information transfer to the brain.
© 2010 Reisert This article is distributed under the terms of an Attribution–Noncommer-cial–Share Alike–No Mirror Sites license for the first six months after the publication date (see http://www.rupress.org/terms). After six months it is available under a Creative Com-mons License (Attribution–Noncommercial–Share Alike 3.0 Unported license, as described at http://creativecommons.org/licenses/by-nc-sa/3.0/).
The
Jour
nal o
f G
ener
al P
hysi
olo
gy
Dow
nloaded from http://rupress.org/jgp/article-pdf/136/5/529/1227511/jgp_201010528.pdf by guest on 07 April 2022
530 Basal activity of odorant receptors
Mammalian Ringer’s solution contained (in mM) 140 NaCl, 5 KCl, 1 MgCl2, 2 CaCl2, 0.01 EDTA, 10 HEPES, and 10 glucose. The pH was adjusted to 7.5 with NaOH. Cineole solutions were made from a 1 mM stock. Heptanal, cycloheptanecarbaldehyde, acetophenone, and eugenol solutions were prepared daily from a 20 mM DMSO stock. Niflumic acid and 3-isobutyl-1-methylxanthine (IBMX) were used at concentrations of 300 µM and 1 mM, re-spectively, by dissolving them directly into Ringer’s without the use of DMSO. All chemicals were purchased from Sigma-Aldrich, with the exception of cycloheptanecarbaldehyde, which was ob-tained from ABCR.
Data analysisThe basal firing rate was determined from 30-s recordings taken in the beginning after establishing the recording configuration. Typically the ORN had only been exposed to a single, 1-s expo-sure of its respective ligand to avoid possible adaptation effects. All APs over the 30-s period were counted, and this number was divided by 30 s to obtain the mean basal spike frequency.
The frequency composition in the absence of stimulation and in the presence of niflumic acid was evaluated by performing power spectra analysis on single 30-s recordings (Fig. 1, trace 0–30 and 30–60 s, respectively, DC-5000 Hz) using Origin and Clampfit Software. Power spectra for impulse responses were performed on 10 sweeps of 1-s duration, and power spectra were subsequently averaged.
The variance of baseline recordings was determined as follows. The variance of the recording in the presence of niflumic acid (Fig. 1, trace 30–60 s) was subtracted from the variance in the ab-sence of niflumic acid (Fig. 1, trace 0–30 s), yielding the current variance carried by the Ca2+-activated Cl conductance (Figs. 2 and 4, Var). Before calculating the variance, current record-ings were high-pass filtered at 0.3 Hz to exclude slow baseline drifts in the variance. Baseline drifts are difficult to avoid because of the low resistance of the recording configuration and the slightly changing solution level in the recording chamber. Also, current recordings were low-pass Bessel filtered at 50 Hz to only include variance in the frequency band relevant for the transduc-tion current.
The response patterns during long (typically 8 s) odor stimula-tions were evaluated by autocorrelating the suction pipette cur-rent (bandwidth DC-50 Hz). The first second of the response was excluded from the autocorrelation to exclude the larger initial response at the onset of stimulation from the autocorrelation.
R E S U LT S
The odorant receptor, transduction noise, and basal action potential firingOdorant receptor–specific contributions to ORN prop-erties were investigated by recording from ORNs from three mouse lines that expressed GFP with the mOR-EG, the I7, or the M71 odorant receptor. The GFP- labeled I7 and M71 mouse lines were generated by inserting IRES-tauGFP after the mouse I7 and M71 coding sequences, respectively (Bozza et al., 2002). The mOR-EG-GFP line was made using a transgene consisting of 3.0 kb upstream of the mOR-EG tran-scription start site followed by mOR-EG-IRES-gapEGFP (Oka et al., 2006). To record from isolated ORNs, the suction pipette technique was used, which has two distinct advantages over the whole-cell or perforated patch recording configuration, considering the questions
levels of basal transduction activity and current fluctua-tions (noise) that drive concomitant AP firing. The latter can be suppressed by odorants that function as inverse agonists, suggesting a new mechanism to medi-ate inhibitory odorant responses. Additionally, ORs determine the response patterns of ORNs during pro-longed stimulation. These findings also suggest how ORs can contribute to the targeting of ORN axons to their glomeruli in the olfactory bulb, which is depen-dent on properties of the expressed OR.
M AT E R I A L S A N D M E T H O D S
Electrophysiological recordingsAdult mice were euthanized using CO2 followed by decapitation as approved by the Monell Chemical Senses Center Institutional Animal Care and Use Committee, conforming to National Insti-tutes of Health guidelines. Olfactory turbinates were removed from the nasal cavity and stored in oxygenated Ringer’s solution at 4°C until use. A small piece of olfactory epithelium was freed from the underlying cartilage, placed in an Eppendorf tube con-taining 200 µl Ringer’s solution and briefly vortexed (Reisert and Matthews, 2001a). The resulting cell suspension containing iso-lated ORNs was transferred to a recording chamber on an inverted microscope equipped with phase-contrast optics, and was allowed to settle for 20 min before bath perfusion began. GFP-positive ORNs were identified with fluorescent optics.
The suction pipette technique was used to record from ORNs (Lowe and Gold, 1991; Reisert and Matthews, 2001a). The cell body of an isolated mouse ORN was drawn into the tip of the re-cording pipette, leaving the cilia exposed to the bath solution and accessible to solution changes. In this recording configuration, the recorded current represents the transduction current that enters at the cilia and exits at the cell body. In addition, since the intracellular voltage is free to vary, ORNs can generate APs, which were also recorded as typically biphasic, fast current transients. The suction pipette current was filtered at DC-5000 Hz (3dB, 8-pole Bessel filter) to record the fast APs, and DC-50 Hz to only record the slower receptor current. The sampling rate was 10 kHz. Currents were recorded with a Warner PC-501A patch clamp amplifier, digitized using a Mikro1401 A/D converter and Signal acquisition software (Cambridge Electronic Design).
Not all GFP-positive ORNs obtained from the three mouse lines used responded to their respective ligands, and the percentage of responsive ORNs varied between 35% (M71-GFP and mOR-EG-GFP mouse lines) and 73% (I7-GFP line). This was probably not caused by spurious expression of GFP in cells other than ORNs expressing the tagged receptor, but rather was due to loss of cilia, caused by the isolation procedure. Grosmaitre et al. (2006) used a whole-epithelium approach to electrophysiologically study ORNs expressing the odorant receptor mOR23 (ligand lyral). They re-ported that 100% of mOR23-positive ORNs responded to lyral, indicating that in their whole-epithelium preparation, ORNs seemed to remain healthier.
Fast solution changes and odorant exposures were achieved by transferring the tip of the recording pipette containing the ORN across the interface of neighboring streams of solutions using the Perfusion Fast-Step solution changer (Warner Instrument Corpo-ration). Solution exchange was complete within 7 ms, as deter-mined from the 10–90% rise or fall time of a junction current, which was elicited by stepping between solutions of different ionic content. All experiments were performed at mammalian body tem-perature (37°C). Solutions were heated just before entering the solution changer by a solution heater based on Matthews (1999).
Dow
nloaded from http://rupress.org/jgp/article-pdf/136/5/529/1227511/jgp_201010528.pdf by guest on 07 April 2022

Reisert 531
lyzed and averaged data and numbers of cells recorded). The increased spike activity was accompanied by an in-crease in receptor current fluctuations (“noise”) in the M71 and I7-positive ORNs, which were absent in mOR-EG ORNs (Fig. 1, DF, red traces; and on an expanded scale, see Fig. 1, G–H, to visualize the receptor cur-rent fluctuations). To investigate the source of the noise we used niflumic acid (300 µM), a blocker of the Ca2+-activated Cl conductance (Kleene, 1993), which selectively reduces the Cl component of the odorant-induced receptor current by 80% but only weakly impacts the CNG channel current (Reisert et al., 2005). Basal AP activity and the current noise were abolished by blocking the Ca2+-activated Cl conductance with niflumic acid (Fig. 1, D–F). This demonstrates that basal AP firing is driven by ciliary transduction events, as this is the localization of the Cl channel that is only present on the cilia and not the dendritic knob or den-drite (Stephan et al., 2009; Hengl et al., 2010; Rasche et al., 2010). Basal noise is not driven by, for example, mechanisms originating in the cell body, because ni-flumic acid was only supplied to the cilia and not the cell body, which resided inside the suction pipette. In-terestingly this also indicates that the Cl conductance and its current are required to drive basal spike firing. CNG channel activity alone, which will trigger opening
addressed in this study. First, the suction pipette tech-nique is a loose-patch-on-cell recording configuration that does not perturb the intracellular milieu and also does not decrease the input resistance of ORNs. The whole-cell recording configuration can easily cause changes in basal firing in cells with such high input re-sistances as observed in ORNs. Second, spike firing of ORNs still located in the intact epithelium is modu-lated by neurotransmitters and hormones (Kawai et al., 1999; Savigner et al., 2009), thus making it difficult to unambiguously attribute changes in spike firing to OR-mediated events, which is not the case in isolated ORNs. I exposed mOR-EG, M71, or I7-expressing ORNs for 1 s to 100 µM eugenol, acetophenone, or heptanal (the mOR-EG, M71, and I7 ligands, respectively) (Krautwurst et al., 1998; Zhao et al., 1998; Kajiya et al., 2001; Bozza et al., 2002; Fig. 1, A–C). This elicited re-sponses that were all near the maximal, saturating current (unpublished data) and displayed APs only dur-ing the rising phase of the receptor current as expected from near-saturating current responses (Reisert and Matthews, 2001a). In the absence of stimulation, mOR-EG ORNs showed very little basal spike firing activity (0.06 ± 0.02 Hz) in contrast to M71 and I7-expressing ORNs, which fired APs at an average frequency of 1.2 ± 0.6 and 1.9 ± 0.8 Hz (see Fig. 1, D–F, and Fig. 2 D for ana-
Figure 1. Basal action poten-tial activity in olfactory receptor neurons. A–C show responses from isolated ORNs express-ing the identified odorant re-ceptors mOR-EG, M71, and I7 stimulated with their respective ligands eugenol, acetophenone, and heptanal. (D–F) Recordings in the absence of stimulation to monitor basal spike firing activ-ity, same three cells as above. Red, low-pass (50 Hz) filtered recordings to display the under-lying fluctuations of the receptor current. The Ca2+-activated Cl channel blocker niflumic acid (300 µM, applied from 30 to 60 s) entirely abolished basal activity. (G–I) Expanded view of the same traces as in D–E to show cur-rent fluctuations.
Dow
nloaded from http://rupress.org/jgp/article-pdf/136/5/529/1227511/jgp_201010528.pdf by guest on 07 April 2022

532 Basal activity of odorant receptors
noise levels and the basal firing rate. A concern is that the observed increase in noise and AP firing could potentially not originate from the I7 or M71 receptor, but from the coexpressed GFP. But because mOR-EG ORNs, which also express GFP, are not noisy, it seems unlikely that GFP is involved in noise generation either at the receptor level or other transduction components.
An explanation for the reduced level of noise in mOR-EG ORNs could be a reduced ability to generate current, for example, as a result of reduced transduction amplification or channel density. Determination of peak current responses elicited by 100 µM of the respec-tive ligand revealed that mOR-EG, M71, and I7 ORNs all had comparable maximal current levels (within a factor of approximately two, see Fig. 2 E). Only mOR-EG and M71 current levels were statistically different (t test, 0.05 level). Maximal currents of the quiet mOR-EG ORNs and the noisy I7 ORNs were very comparable, suggest-ing that transduction downstream of the OR func-tions at equally efficient levels. Also, mOR-EG ORNs and the noisier M71 ORNs have similar EC50 for euge-nol and acetophenone of 51 and 20 µM, respectively (Bozza et al., 2002; Oka et al., 2006), an indication that OR sensitivity and density might also not be grossly different.
As the three OR-GFP mice were of different genetic background, I investigated whether basal activity was determined by the mouse strain from which labeled ORNs were obtained. I repeated the above experiments using ORNs obtained from the I7-GFP mouse, which were randomly picked, not GFP positive, and responsive to the odorant cineole (100 µM, unpublished data). These cells showed a (statistically) significantly lower
of the Cl current but only carries a small current, is not sufficient.
To investigate the kinetics and frequency composi-tions of the current noise underlying the basal AP fir-ing, power spectrum analysis was performed on current recordings filtered at DC-5000 Hz recorded in the ab-sence of stimulation and in the presence of niflumic acid. The latter was done to obtain the baseline power spectrum, which depends on the seal resistance, instru-mentation noise, and membrane channel noise not as-sociated with the Cl channel. Little difference was observed in the basal and niflumic acid power spectra for mOR-EG recordings in agreement with the lack of noise and AP firing in the unstimulated recordings. In contrast, a large increase in power was observed in the 1–15-Hz frequency band derived from basal recordings above the niflumic acid power spectra in M71 and I7 ORNs (Fig. 2, AC, black and blue traces are power spectra in the absence and presence of niflumic acid, respectively, 1–15 Hz frequency band shaded in gray).
The data were quantified by plotting the basal spike rate of different odorant receptor–expressing ORNs against the baseline current variance (Fig. 2 D). The variance (Var) was calculated as the difference be-tween the current variance in the absence and presence of niflumic acid (see Materials and methods) and repre-sents a measure of the baseline noise. Basal spike rate was positively correlated with variance for the mOR-EG, M71, and I7 ORs. The mean spike rates are statistically different (one-way ANOVA, 0.05 level). A pairwise com-parison (t test, 0.05 level) showed that spike rates for mOR-EG and M71 or I7 are also different. This suggests that, indeed, the OR choice sets and controls basal
Figure 2. Kinetics of basal cur-rent fluctuations. (A–C) Power spectrum analysis of the black (filtered at DC-5000 Hz) traces in Fig. 1, D–F. Note the increase in noise in the 1–15-Hz band (shaded in gray) in the M71 and I7-positive ORNs, which is not observed in the mOR-EG–ex-pressing ORN. (D) Average ba-sal spike firing in the absence of stimulation as a function of basal variance (average of 9–12 ORNs). (E) Average maximal currents elicited by 100 µM of eugenol, acetophenone, and heptanal ORNs obtained from the mOR-EG, M71-GFP, and I7-GFP mouse lines, respectively. Numbers in the bars of the his-tograms are the numbers of cells recorded from. *, current levels that were statistically different (t test, 0.05 level). Data points are mean ± SEM.
Dow
nloaded from http://rupress.org/jgp/article-pdf/136/5/529/1227511/jgp_201010528.pdf by guest on 07 April 2022

Reisert 533
to the current carried by the Cl channel (Fig. 3 C), which was fitted with the function A2 + (A1 A2)/(1 + (f/f0)n), with A1 = 0.13 pA2Hz1, A2 = 0.001 pA2Hz1, f0 = 6.4 Hz, and n = 3.4.
A similar analysis was performed for the basal trans-duction noise for the I7-expressing ORN in Fig. 1. The difference of the basal noise spectrum and the spec-trum in the presence of niflumic acid was fitted with the above function to yield A1 = 0.04 pA2Hz1, A2 = 0.001 pA2Hz1, f0 = 5.6 Hz, and n = 3.7 (Fig. 3 D). The param-eter of most interest, f0, since it describes the roll-off point of the power spectra and thus the frequency de-pendence of odorant-induced responses or basal activ-ity, was 5.3 ± 0.5 Hz (n = 12) and 7.3 ± 1.1 Hz (n = 7), respectively (not statistically different, t test, 0.05 level). Four basal noise power spectra from I7 ORNs could not be fitted reliably due to a peak in the spectra around 6–7 Hz and were omitted from the analysis. Such peaks in the basal noise power spectra were never observed in the quieter mOR-EG or M71 ORNs and probably origi-nated in the very high noise levels these particular four I7 ORNs displayed. Such high noise levels can begin to generate an additional standing current (as supposed to only random occasional current fluctuations), which in turn will lead to adaptation of the transduction mech-anism and a change in response kinetics (Leinders- Zufall et al., 1999; Reisert and Matthews, 1999) and thus a change in power spectrum.
Fitting the basal noise power spectrum of M71 ORNs yielded f0 = 7.1 ± 1.1 Hz (not statistically different from the two I7 values, t test, six cells; three more cells dis-played noise levels too low to be fitted reliably), suggest-ing that the frequency composition of the basal noise is
basal AP firing activity (0.1 ± 0.03 Hz) and correspond-ingly low current noise levels (Var = 0.06 ± 0.02 pA2) compared with the noisy I7-GFP ORNs. Hence, noise levels and basal AP firing are not a property of a particu-lar mouse strain, but again of individual ORNs express-ing defined ORs.
As the level of noise seems to correlate with the spe-cific receptor expressed in a given ORN, this suggests that it might be the receptor itself that leads to the gen-eration of the increased noise. Basal, thermal activation of ORs will lead to activation of the transduction cascade and thus spontaneous small receptor currents, the level and frequency of which will depend on the individual receptors. If indeed the noise is generated by spontane-ously activated ORs, one should be able to generate (“mimic”) responses with similar time courses and fre-quency composition by exposing ORNs for short dura-tions to odorants to activate ORs concurrently in a short time window. Ideally, stimulation would terminate be-fore the odorant response begins such that all activated ORs contribute equally to the response (Bhandawat et al., 2005) before adaptational effects begin to contrib-ute to the response kinetics. This can be achieved using fast solution changes (see Materials and methods) and thus (idealized) all ORs are activated at the same time.
I exposed I7-GFP ORNs to 0.3 µM heptanal for 30 ms to elicit a small response of similar size compared with those observed in the absence of stimulation (typically a few pico-amps, Fig. 3 A). The power spectrum derived from this response is shown in Fig. 3 B as is the spec-trum obtained during application of niflumic acid (black and blue traces, respectively). The difference of those two spectra yields the power spectrum attributable
Figure 3. Kinetics of small odorant responses. (A) Suction pipette recordings from an I7-ex-pressing ORN. Black trace is the average of 10 responses to 30-ms stimulations at 0.3 µM hep-tanal. Blue traces are the average of 10 record-ings in the presence of 300 µM niflumic acid (no odorant) to suppress basal noise. The recording bandwidth of the displayed traces was 0–50 Hz. (B) Power spectrum analysis of corresponding traces (filtered at DC-5000 Hz) from A. Similar results in 12 ORNs. (C) Difference of the power spectra (odorant minus niflumic acid) in B fitted with A2 + (A1 A2)/(1 + (f/f0)n), with A1 = 0.13 pA2Hz1, A2 = 0.001 pA2Hz1, f0 = 6.4 Hz, and n = 3.4. (D) Difference of the power spectra (basal noise minus niflumic acid) in Fig. 2 C obtained from basal noise. Fitting parameters are A1 = 0.04 pA2Hz1, A2 = 0.001 pA2Hz1, f0 = 5.6 Hz, and n = 3.7.
Dow
nloaded from http://rupress.org/jgp/article-pdf/136/5/529/1227511/jgp_201010528.pdf by guest on 07 April 2022
534 Basal activity of odorant receptors
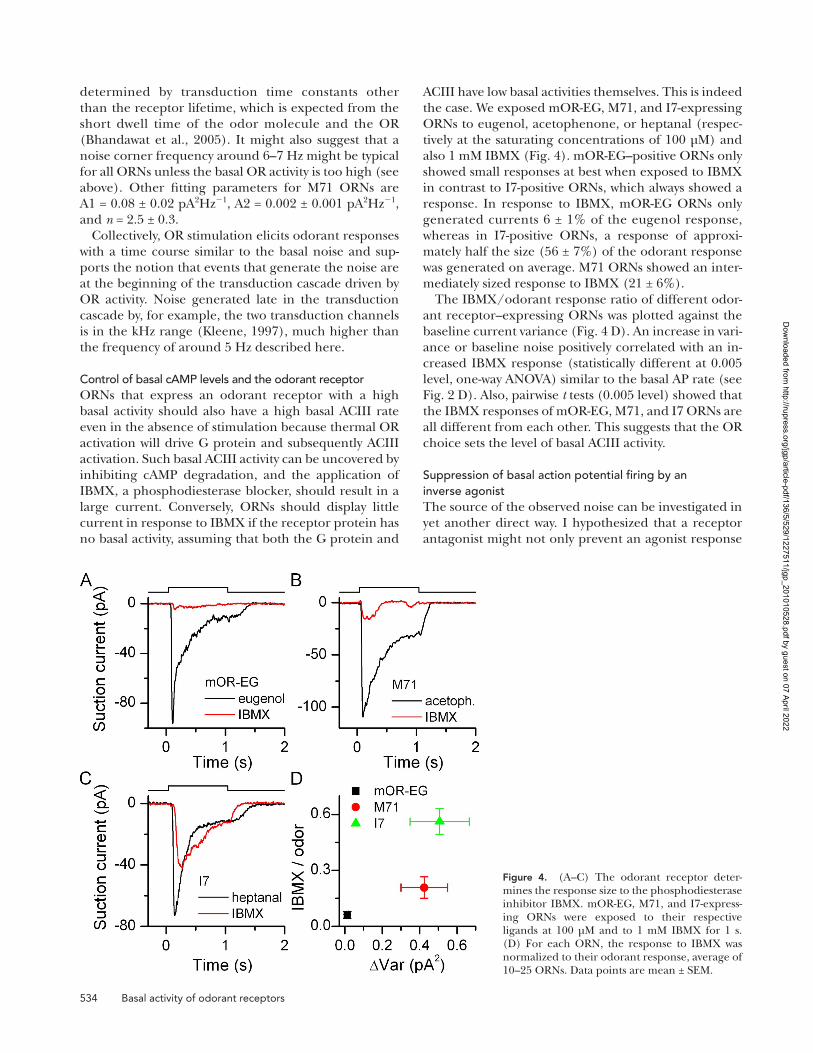
ACIII have low basal activities themselves. This is indeed the case. We exposed mOR-EG, M71, and I7-expressing ORNs to eugenol, acetophenone, or heptanal (respec-tively at the saturating concentrations of 100 µM) and also 1 mM IBMX (Fig. 4). mOR-EG–positive ORNs only showed small responses at best when exposed to IBMX in contrast to I7-positive ORNs, which always showed a response. In response to IBMX, mOR-EG ORNs only generated currents 6 ± 1% of the eugenol response, whereas in I7-positive ORNs, a response of approxi-mately half the size (56 ± 7%) of the odorant response was generated on average. M71 ORNs showed an inter-mediately sized response to IBMX (21 ± 6%).
The IBMX/odorant response ratio of different odor-ant receptor–expressing ORNs was plotted against the baseline current variance (Fig. 4 D). An increase in vari-ance or baseline noise positively correlated with an in-creased IBMX response (statistically different at 0.005 level, one-way ANOVA) similar to the basal AP rate (see Fig. 2 D). Also, pairwise t tests (0.005 level) showed that the IBMX responses of mOR-EG, M71, and I7 ORNs are all different from each other. This suggests that the OR choice sets the level of basal ACIII activity.
Suppression of basal action potential firing by an inverse agonistThe source of the observed noise can be investigated in yet another direct way. I hypothesized that a receptor antagonist might not only prevent an agonist response
determined by transduction time constants other than the receptor lifetime, which is expected from the short dwell time of the odor molecule and the OR (Bhandawat et al., 2005). It might also suggest that a noise corner frequency around 6–7 Hz might be typical for all ORNs unless the basal OR activity is too high (see above). Other fitting parameters for M71 ORNs are A1 = 0.08 ± 0.02 pA2Hz1, A2 = 0.002 ± 0.001 pA2Hz1, and n = 2.5 ± 0.3.
Collectively, OR stimulation elicits odorant responses with a time course similar to the basal noise and sup-ports the notion that events that generate the noise are at the beginning of the transduction cascade driven by OR activity. Noise generated late in the transduction cascade by, for example, the two transduction channels is in the kHz range (Kleene, 1997), much higher than the frequency of around 5 Hz described here.
Control of basal cAMP levels and the odorant receptorORNs that express an odorant receptor with a high basal activity should also have a high basal ACIII rate even in the absence of stimulation because thermal OR activation will drive G protein and subsequently ACIII activation. Such basal ACIII activity can be uncovered by inhibiting cAMP degradation, and the application of IBMX, a phosphodiesterase blocker, should result in a large current. Conversely, ORNs should display little current in response to IBMX if the receptor protein has no basal activity, assuming that both the G protein and
Figure 4. (A–C) The odorant receptor deter-mines the response size to the phosphodiesterase inhibitor IBMX. mOR-EG, M71, and I7-express-ing ORNs were exposed to their respective ligands at 100 µM and to 1 mM IBMX for 1 s. (D) For each ORN, the response to IBMX was normalized to their odorant response, average of 10–25 ORNs. Data points are mean ± SEM.
Dow
nloaded from http://rupress.org/jgp/article-pdf/136/5/529/1227511/jgp_201010528.pdf by guest on 07 April 2022

Reisert 535
frequency-dependent manner similar to niflumic acid (Fig. 5 B), again in the 1–15-Hz frequency band (shaded in gray). Similar results were found in 14 ORNs. The Var obtained from the chca application was not signifi-cantly different (t test) from the Var obtained when suppressing basal activity with niflumic acid (Fig. 5 C).
A potential caveat is that chca might not only block the I7 receptor but also one of the transduction chan-nels, as has been reported for other odorants (Takeuchi et al., 2009). This is not the case, because coapplication of heptanal and chca does not reduce the response to heptanal alone (Fig. 5 D). The average ratio of the heptanal + chca to the heptanal response was 1.004 ± 0.031 (not significantly different from 1, t test, n = 16), suggesting that chca has a lower affinity compared with heptanal. But chca can antagonize the heptanal- induced response, but only if the ORN is pre-exposed to chca (Fig. 5 E, average response ratio 0.48 ± 0.12, statis-tically different from 1 at 0.005 level, n = 9), potentially by being able to access the binding pocket before hep-tanal exposure. This heptanal response reduction after chca pre-exposure likely represents an underestimation because during the 5-s pre-exposure to chca, the ORN might recover from adaptation caused by the constant basal receptor activity and ensuing transduction noise. This can give rise to a potentially larger response when immediately stimulated after chca exposure. Together, these results suggest that indeed the observed noise is caused by basal odorant receptor activity and that chca is an inverse agonist for the I7 receptor.
The odorant receptor and the response pattern during prolonged stimulationORNs show quite distinct response patterns when stim-ulated for long durations. At intermediate odor concen-trations, most ORNs show an oscillatory response pattern, firing bursts of APs at regular intervals, whereas some fire APs continuously. At high odorant concentrations, all ORNs, regardless of response pattern, saturate into a continuous receptor current (Reisert and Matthews, 2001a,b). ORNs expressing the odorant receptors mOR-EG, M71, and I7 were stimulated for 8 s with their respective ligands (Fig. 6 A). Both mOR-EG and I7-positive ORNs showed continuous activity after the initial large response at the onset of stimulation, whereas M71 ORNs showed an oscillatory response pattern. OR-specific response patterns for a given ORN were main-tained over the intermediate concentration range (typically 3–10-fold) when ORNs were tested at more than one concentration. Similar results were obtained in 5–15 cells.
An autocorrelation analysis of the odorant-induced current was performed to find repeating and periodic patterns (Fig. 6 B). mOR-EG and I7 ORNs did not show clear peaks in their autocorrelogram, whereas M71 ORN did. All tested M71 ORNs showed clear oscillatory pat-tern, whereas this pattern was not observed in mOR-EG
but also inhibit basal activity of the receptor, thus acting as an inverse agonist. Several antagonists for the I7 re-ceptor have recently been published (Peterlin et al., 2008), and it was shown that increasing concentrations of the antagonists progressively reduced the Ca2+ signal obtained from an ORN that had been virally infected with the I7 OR and stimulated with 10 µM octanal. It has not been determined if the described antagonists can act as inverse agonists. Application of one of them, cycloheptanecarbaldehyde (chca), did indeed prevent basal spike firing (Fig. 5 A), making chca an inhibitory odorant. Chca also reduced the basal current noise in a
Figure 5. Suppression of basal firing by an inverse agonist. (A) Suction pipette recordings of an I7-expressing ORN. Applica-tion of cycloheptanecarbaldehyde (chca, 100 µM), previously described as an I7 receptor antagonist (Peterlin et al., 2008), sup-pressed all basal firing. (B) Power spectra analysis in the absence and presence of chca, 1–15 Hz frequency band shaded in gray. (C) Suppression of noise (Var) is similar with chca and niflumic acid (NA), mean ± SEM, n = 14 for chca and 11 for NA. (D) chca does not reduce the response when coapplied with heptanal (both odorants at 100 µM). Only preapplication (5 s) of the antago-nist leads to response reduction. (E) Black and green traces are recorded before and after chca application. All recordings are from the same ORN.
Dow
nloaded from http://rupress.org/jgp/article-pdf/136/5/529/1227511/jgp_201010528.pdf by guest on 07 April 2022

536 Basal activity of odorant receptors
is not a property of the odorant, but more probably of the stimulated ORN expressing a particular OR. The precise mechanism that determines response pat-terns remains to be elucidated, but it is interesting to note that the class of ORNs that showed an oscillatory response pattern (M71 ORNs) have larger, although not always statistically different, transduction currents (Fig. 2 E), which might be required to drive ORNs into oscillations.
In conclusion, the odorant receptor is likely to con-tribute to, and control the response pattern during, long stimulation periods, but the precise mechanism that sets response mode and oscillation period remains to be investigated.
D I S C U S S I O N
Response properties of mouse odorant receptor neurons with identified odorant receptorsUnderstanding the contribution of mammalian odor-ant receptors to the odorant-induced response has focused on elucidating the response profiles and ligand sensitivity of ORs. Deorphanization of ORs has seen substantial progress (for example see Saito et al., 2009), but OR properties, other than ligand specificity, that might contribute to the odorant-induced response, have not been addressed. This work investigated the source of basal action potential frequency and current noise in ORNs.
I characterized three mouse lines, which express GFP with the mOR-EG, M71 or I7 OR for identification, with respect to their ORNs’ basal AP rate, current noise lev-els, and response patterns. ORNs expressing a given, identified receptor had different basal noise levels that correlated positively with basal AP rates (Figs. 1 and 2). Both noise levels and basal AP rates depend on trans-duction activity and current carried by the olfactory Ca2+-activated Cl channel. CNG channel activity alone is not sufficient to drive basal AP activity. This demon-strates that in mammalian ORNs, even at low level of ac-tivity, the amplification of the CNG current by the Cl channel is required.
Basal noise could have its origin in a high basal G pro-tein or ACIII activity (without basal OR activity) or high spontaneous opening of the CNG and Cl channel. This seems unlikely since, first, the response to the phospho-diesterase inhibitor IBMX, which monitors basal ACIII activity, correlated with basal noise and OR (Fig. 4). This implicates the OR as the origin of the current noise. Ad-ditionally mOR-EG ORNs (and also randomly picked cineole-responsive ORNs, which probably will have ex-pressed several different ORs) show very low basal activ-ity, which demonstrates that both G protein and ACIII have a low constitutive activity, a prerequisite to prime ORNs to be sensitive to the level of basal OR activity.
or I7 ORNs (n = 11 and 14). The mean oscillation period (taken as the time of the first peak in the autocorelo-gram) for M71 ORNs was 0.57 ± 0.04 s (mean ± SEM, n = 5 ORNs, each tested at 1–3 acetophenone concen-trations). Interestingly, randomly picked ORNs, which responded to cineole with an oscillatory response pat-tern, had a longer oscillation period of 1.4 ± 0.2 s (Reisert and Matthews, 2001a), but it remains to be seen if ORNs expressing other identified ORs have oscillation periods different from the one reported here for M71-expressing ORNs. Additionally, we previously investigated response patterns during prolonged stimulation in great detail in frog ORNs (Reisert and Matthews, 2001b), and to a lesser extent in mouse ORNs (Reisert and Matthews, 2001a), and demonstrated that randomly picked ORNs expressing random ORs stimulated with the odorant cineole can display three distinctive response pat-terns: “silent” (no further response after a transient re-sponse at the onset of stimulation), “oscillatory” (as seen in M71 ORNs), and “continuous” (as seen in I7 and mOR-EG ORNs). This suggests that the response pattern
Figure 6. The odorant receptor determines response pat-terns during prolonged stimulation. (A) mOR-EG, M71, and I7-expressing ORNs were exposed to their respective ligands for 8 s at concentrations indicated next to each trace. Black and red recordings were filtered at DC-5000 Hz and DC-50 Hz, respec-tively. (B) The traces in A were auto-correlogrammed from 1–8 s to reveal underlying preferred response periodicities.
Dow
nloaded from http://rupress.org/jgp/article-pdf/136/5/529/1227511/jgp_201010528.pdf by guest on 07 April 2022

Reisert 537
1978; Kurahashi et al., 1994; Morales et al., 1994). Mech-anisms mediating inhibitory responses include blockage of the CNG channel by odorants or activation of Ca2+-activated K+ channels (Morales et al., 1994; Takeuchi et al., 2009). As I show here, the (I7) OR itself can medi-ate an inhibitory response by suppression of basal activ-ity by an inverse agonist. But as not all ORs display basal activity, only a defined subset of ORs will be susceptible to reducing basal activity via an inverse agonist. Such suppression might be significant at the level of the ol-factory bulb due to the high convergence of 1,000 ORNs onto a single glomerulus and the high “set point” of basal activity of second order neurons in the olfac-tory bulb in vivo in awake behaving mice (Rinberg et al., 2006). An interesting observation was that randomly cho-sen ORNs with different unknown ORs that responded to cineole showed little basal activity on average. This suggests that certain odorants may have an affinity for ORs with low basal activity.
In an interesting parallel, inverse agonism is exempli-fied in a closely related GPCR, the visual pigment rho-dopsin. 11-cis retinal binds covalently to rod opsin in its binding pocket to suppress nearly all basal activity of free opsin and subsequent activation of the phototrans-duction cascade. This suppression, combined with a low thermal activation rate, contributes to the high sensitiv-ity and amplification of rod photoreceptors (Fain et al., 2001; Lamb and Pugh, 2004). In contrast, cone pigment can have a much higher spontaneous isomerization rate in darkness and thus can display higher levels of basal activity and transduction current, rendering cones less light sensitive than rods (Rieke and Baylor, 2000; Kefalov et al., 2003).
The odorant receptor and targetingTargeting of axons along the bulbar anteroposterior axis is mediated by an unknown mechanism that de-pends on differential Gs and ACIII activity (Imai et al., 2006; Chesler et al., 2007). Could the observed varying basal, thermal activity of individual ORs play a role or even be a determinate in targeting ORN axons to glom-eruli in the bulb? In such a scenario, increased basal OR activity should lead to Gs and ACIII activity, and thus ORs with higher basal activity should target to glomeruli located progressively posteriorally. For the three ORs for which I determined the basal activity, the glomeruli of the most quiet OR (mOR-EG) are indeed located an-teriorally, and the M71 glomeruli (intermediate basal activity) are positioned at the posterior end of the bulb (Bozza et al., 2002; Oka et al., 2006). The rat I7 OR (which differs from the mouse OR in only 15 amino acids) when expressed in the M71 locus, targets inter-mediately along the anteroposterior axis, thus not as posteriorally as one would expect based on basal activity compared with M71. This assumes that the rat I7 OR has the same basal activity compared with its mouse
Second, the power spectrum of the basal noise (Fig. 1 and 2) of I7 and M71 ORNs displayed a cut-off at around 7 Hz, a frequency much lower than the noise generated by channel openings of the CNG and Cl channel, which is around 1000 Hz (Kleene, 1997). Fur-thermore, power spectra of small I7-expressing ORN responses evoked by short stimulations (Fig. 2) to mimic spontaneous activity showed a similar cut-off frequency, again implicating OR activity as the driving source of basal noise. Interestingly, the frequency band up to 7 Hz, which describes these responses, is similar to the breathing frequency of mice and rats (Youngentob et al., 1987; Tankersley et al., 1994; Kepecs et al., 2007; Wesson et al., 2008), suggesting that ORN signal trans-duction might be “tuned” to match the stimulation fre-quency imposed by rhythmic odorant delivery during breathing or sniffing.
The origin of transduction noise and the resulting re-ceptor current noise have been thoroughly investigated in another sensory, G protein–coupled system: vision. In rod photoreceptors, two main sources of noise have been identified: a discrete slow component with a time course of around 1 s (caused by spontaneous activation of a single rhodopsin and thus the entire transduction cascade) and a fast continuous noise (attributed to spontaneous downstream phosphodiesterase activity) (Baylor et al., 1980; Rieke and Baylor, 1996).
Does the current noise observed in ORNs represent the lifetime of a single activated OR as is the case with rhodopsin in photoreceptors? This is probably not the case because the lifetime of a ligand-activated OR is of the order of 1 ms, much faster than the responses ob-served (Bhandawat et al., 2005). These observations are consistent with the response kinetics being dominated by the lifetime of downstream components, e.g., the G protein–ACIII complex or PDE1C and Na+/Ca2+ ex-changer kinetics. Additionally, with the response of a single activated OR being very small (<0.02 pA in frog ORNs; Bhandawat et al., 2005), the observed noise fluc-tuations, which can reach a few pico-amps, will stem from many simultaneously activated ORs. Underlying assumptions here are that the lifetime of a ligand-bound OR is similar to a spontaneously activated OR, that OR–G protein coupling is similar in either case and that G protein coupling is similar across different ORs. Another open question is whether a spontaneously ac-tive OR can also lead to changes in the expression level of other signal transduction components, although such effects seem to be limited in magnitude (Fig. 2 E).
Basal activity, inhibitory responses, and inverse agonistsInhibitory responses to odorants have been reported in the form of a reduction in basal firing, the generation of a hyperpolarizing receptor current, or the suppres-sion of an excitatory odorant-induced inward current (O’Connell and Mozell, 1969; Getchell and Shepherd,
Dow
nloaded from http://rupress.org/jgp/article-pdf/136/5/529/1227511/jgp_201010528.pdf by guest on 07 April 2022

538 Basal activity of odorant receptors
This work was supported by the Monell Chemical Senses Center, a Morley Kare Fellowship, and a National Institutes of Health grant (DC009613).
Edward N. Pugh Jr. served as editor.
Submitted: 31 August 2010Accepted: 1 October 2010
R E F E R E N C E SBaylor, D.A., G. Matthews, and K.W. Yau. 1980. Two components of
electrical dark noise in toad retinal rod outer segments. J. Physiol. 309:591–621.
Bhandawat, V., J. Reisert, and K.W. Yau. 2005. Elementary response of olfactory receptor neurons to odorants. Science. 308:1931–1934. doi:10.1126/science.1109886
Bozza, T., P. Feinstein, C. Zheng, and P. Mombaerts. 2002. Odorant receptor expression defines functional units in the mouse olfac-tory system. J. Neurosci. 22:3033–3043.
Bozza, T., A. Vassalli, S. Fuss, J.J. Zhang, B. Weiland, R. Pacifico, P. Feinstein, and P. Mombaerts. 2009. Mapping of class I and class II odorant receptors to glomerular domains by two distinct types of olfactory sensory neurons in the mouse. Neuron. 61:220–233. doi:10.1016/j.neuron.2008.11.010
Chesler, A.T., D.J. Zou, C.E. Le Pichon, Z.A. Peterlin, G.A. Matthews, X. Pei, M.C. Miller, and S. Firestein. 2007. A G pro-tein/cAMP signal cascade is required for axonal convergence into olfactory glomeruli. Proc. Natl. Acad. Sci. USA. 104:1039–1044. doi:10.1073/pnas.0609215104
Cygnar, K.D., and H. Zhao. 2009. Phosphodiesterase 1C is dispens-able for rapid response termination of olfactory sensory neurons. Nat. Neurosci. 12:454–462. doi:10.1038/nn.2289
Dahanukar, A., E.A. Hallem, and J.R. Carlson. 2005. Insect chemo-reception. Curr. Opin. Neurobiol. 15:423–430. doi:10.1016/j.conb .2005.06.001
Fain, G.L., H.R. Matthews, M.C. Cornwall, and Y. Koutalos. 2001. Adaptation in vertebrate photoreceptors. Physiol. Rev. 81:117–151.
Feinstein, P., and P. Mombaerts. 2004. A contextual model for ax-onal sorting into glomeruli in the mouse olfactory system. Cell. 117:817–831. doi:10.1016/j.cell.2004.05.011
Feinstein, P., T. Bozza, I. Rodriguez, A. Vassalli, and P. Mombaerts. 2004. Axon guidance of mouse olfactory sensory neurons by odor-ant receptors and the beta2 adrenergic receptor. Cell. 117:833–846. doi:10.1016/j.cell.2004.05.013
Fleischer, J., H. Breer, and J. Strotmann. 2009. Mammalian olfactory receptors. Front. Cell. Neurosci. 3:9. doi:10.3389/neuro.03.009.2009
Frings, S., S. Benz, and B. Lindemann. 1991. Current record-ing from sensory cilia of olfactory receptor cells in situ. 2. Role of mucosal Na+, K+, and Ca2+ ions. J. Gen. Physiol. 97:725–747. doi:10.1085/jgp.97.4.725
Getchell, T.V., and G.M. Shepherd. 1978. Adaptive properties of olfactory receptors analysed with odour pulses of varying dura-tions. J. Physiol. 282:541–560.
Grosmaitre, X., A. Vassalli, P. Mombaerts, G.M. Shepherd, and M. Ma. 2006. Odorant responses of olfactory sensory neurons ex-pressing the odorant receptor MOR23: a patch clamp analysis in gene-targeted mice. Proc. Natl. Acad. Sci. USA. 103:1970–1975. doi:10.1073/pnas.0508491103
Hengl, T., H. Kaneko, K. Dauner, K. Vocke, S. Frings, and F. Möhrlen. 2010. Molecular components of signal amplification in olfactory sensory cilia. Proc. Natl. Acad. Sci. USA. 107:6052–6057. doi:10.1073/pnas.0909032107
Imai, T., and H. Sakano. 2008. Odorant receptor-mediated signaling in the mouse. Curr. Opin. Neurobiol. 18:251–260. doi:10.1016/j.conb .2008.07.009
counterpart. That rat I7 has at least some basal activity is supported by the observation that manipulations de-signed to decrease cAMP levels in ORNs expressing rat I7 cause an anterior shift of the I7 glomerulus (Imai et al., 2006). Similarly, a mouse that is hypomorphic for M71, and that might therefore have reduced levels of basal OR activity, has anteriorally shifted glomeruli (Feinstein et al., 2004). The 2 (but not the 1 adren-ergic) adrenergic receptor displays basal activity when expressed in cardiac myocytes (Zhou et al., 2000), and the glomerulus innervated by 2 adrenergic receptor–positive ORNs is located not anteriorly but midway along the anteroposterior axis (Feinstein et al., 2004).
Although the scenario of basal OR activity as a con-tributor to anteroposterior glomerular map formation might be simple and elegant, these results should be interpreted with some caution. I determined the basal activity of ORs located on the cilia of mature ORNs cou-pled to Golf, which might be quite different from the basal activity of the same receptors in the environment of an immature ORN coupled to Gs located in, for ex-ample, the growth cone expressed at a different density. Basal OR activity might also be different in a heterol-ogous system. Additionally, other mechanisms contribute to dorsal–ventral glomerular location, which roughly follows the zonal OR expression arrangement in the olfactory epithelium (Feinstein and Mombaerts, 2004; Miyamichi et al., 2005) or cellular identity (Bozza et al., 2009). Local sorting of axons once they reached their position along the anteroposterior axis has been pro-posed to be dependent on extrinsic (odor)-mediated activity (Serizawa et al., 2006). The contribution of basally active ORs and increased basal activity to this mechanism remains unclear.
The link between basal activation of GPCRs and crys-tal structure could be investigated in the adrenore-ceptors and rhodopsin. It is thought to arise partly from the polar interaction between a conserved DRY motif on TM3 and a glutamate residue on TM6, which is bro-ken in the ligand-activated GPCRs (Rosenbaum et al., 2009). Unfortunately, the crystal structure for even one OR is not available, limiting structural comparisons with other GPCRs. But the modeling and experimental vali-dation of odorant–OR interactions have made signifi-cant progress over the recent years (for review see Reisert and Restrepo, 2009). Incorporating basal ac-tivity of native and genetically modified ORs might become feasible. This should yield a more detailed understanding of ORs and their contribution to the re-sponse properties of ORNs and their axon targeting.
I would like to thank Drs. J. Bradley, G. Lowe, S. Hattar, K. Field, C.-Y. Su, and H. Zhao for discussions, support, and critical reading of earlier versions of the manuscript and Dr. D. Reed and F. Duke for help with mouse genotyping. Drs. T. Bozza and P. Mombaerts gen-erously made the I7-GFP mouse line available, as did Dr. K. Touhara for the mOR-EG-GFP mouse line, for which I am thankful.
Dow
nloaded from http://rupress.org/jgp/article-pdf/136/5/529/1227511/jgp_201010528.pdf by guest on 07 April 2022

Reisert 539
Mombaerts, P. 2006. Axonal wiring in the mouse olfactory sys-tem. Annu. Rev. Cell Dev. Biol. 22:713–737. doi:10.1146/annurev .cellbio.21.012804.093915
Morales, B., G. Ugarte, P. Labarca, and J. Bacigalupo. 1994. Inhibitory K+ current activated by odorants in toad olfactory neurons. Proc. Biol. Sci. 257:235–242. doi:10.1098/rspb.1994 .0120
Munger, S.D., T. Leinders-Zufall, and F. Zufall. 2009. Subsystem or-ganization of the mammalian sense of smell. Annu. Rev. Physiol. 71:115–140. doi:10.1146/annurev.physiol.70.113006.100608
O’Connell, R.J., and M.M. Mozell. 1969. Quantitative stimulation of frog olfactory receptors. J. Neurophysiol. 32:51–63.
Oka, Y., S. Katada, M. Omura, M. Suwa, Y. Yoshihara, and K. Touhara. 2006. Odorant receptor map in the mouse olfactory bulb: in vivo sensitivity and specificity of receptor-defined glomeruli. Neuron. 52:857–869. doi:10.1016/j.neuron.2006.10.019
Peterlin, Z., Y. Li, G. Sun, R. Shah, S. Firestein, and K. Ryan. 2008. The importance of odorant conformation to the binding and activation of a representative olfactory receptor. Chem. Biol. 15:1317–1327. doi:10.1016/j.chembiol.2008.10.014
Rasche, S., B. Toetter, J. Adler, A. Tschapek, J.F. Doerner, S. Kurtenbach, H. Hatt, H. Meyer, B. Warscheid, and E.M. Neuhaus. 2010. Tmem16b is specifically expressed in the cilia of olfac-tory sensory neurons. Chem. Senses. 35:239–245. doi:10.1093/ chemse/bjq007
Reisert, J., and H.R. Matthews. 1999. Adaptation of the odour- induced response in frog olfactory receptor cells. J. Physiol. 519:801–813. doi:10.1111/j.1469-7793.1999.0801n.x
Reisert, J., and H.R. Matthews. 2001a. Response properties of iso-lated mouse olfactory receptor cells. J. Physiol. 530:113–122. doi:10.1111/j.1469-7793.2001.0113m.x
Reisert, J., and H.R. Matthews. 2001b. Responses to prolonged odour stimulation in frog olfactory receptor cells. J. Physiol. 534:179–191. doi:10.1111/j.1469-7793.2001.t01-1-00179.x
Reisert, J., and D. Restrepo. 2009. Molecular tuning of odorant receptors and its implication for odor signal processing. Chem. Senses. 34:535–545. doi:10.1093/chemse/bjp028
Reisert, J., J. Lai, K.W. Yau, and J. Bradley. 2005. Mechanism of the excitatory Cl response in mouse olfactory receptor neurons. Neuron. 45:553–561. doi:10.1016/j.neuron.2005.01.012
Rieke, F., and D.A. Baylor. 1996. Molecular origin of continuous dark noise in rod photoreceptors. Biophys. J. 71:2553–2572. doi:10.1016/S0006-3495(96)79448-1
Rieke, F., and D.A. Baylor. 2000. Origin and functional impact of dark noise in retinal cones. Neuron. 26:181–186. doi:10 .1016/S0896-6273(00)81148-4
Rinberg, D., A. Koulakov, and A. Gelperin. 2006. Sparse odor coding in awake behaving mice. J. Neurosci. 26:8857–8865. doi: 10.1523/JNEUROSCI.0884-06.2006
Rosenbaum, D.M., S.G. Rasmussen, and B.K. Kobilka. 2009. The structure and function of G-protein-coupled receptors. Nature. 459:356–363. doi:10.1038/nature08144
Saito, H., Q. Chi, H. Zhuang, H. Matsunami, and J.D. Mainland. 2009. Odor coding by a Mammalian receptor repertoire. Sci. Signal. 2:ra9. doi:10.1126/scisignal.2000016
Savigner, A., P. Duchamp-Viret, X. Grosmaitre, M. Chaput, S. Garcia, M. Ma, and B. Palouzier-Paulignan. 2009. Modulation of sponta-neous and odorant-evoked activity of rat olfactory sensory neu-rons by two anorectic peptides, insulin and leptin. J. Neurophysiol. 101:2898–2906. doi:10.1152/jn.91169.2008
Serizawa, S., K. Miyamichi, H. Takeuchi, Y. Yamagishi, M. Suzuki, and H. Sakano. 2006. A neuronal identity code for the odor-ant receptor-specific and activity-dependent axon sorting. Cell. 127:1057–1069. doi:10.1016/j.cell.2006.10.031
Imai, T., M. Suzuki, and H. Sakano. 2006. Odorant receptor- derived cAMP signals direct axonal targeting. Science. 314:657–661. doi:10.1126/science.1131794
Kajiya, K., K. Inaki, M. Tanaka, T. Haga, H. Kataoka, and K. Touhara. 2001. Molecular bases of odor discrimination: reconstitution of olfactory receptors that recognize overlapping sets of odorants. J. Neurosci. 21:6018–6025.
Kato, A., and K. Touhara. 2009. Mammalian olfactory receptors: pharmacology, G protein coupling and desensitization. Cell. Mol. Life Sci. 66:3743–3753. doi:10.1007/s00018-009-0111-6
Kaupp, U.B. 2010. Olfactory signalling in vertebrates and insects: differences and commonalities. Nat. Rev. Neurosci. 11:188–200.
Kawai, F., T. Kurahashi, and A. Kaneko. 1999. Adrenaline enhances odorant contrast by modulating signal encoding in olfactory re-ceptor cells. Nat. Neurosci. 2:133–138. doi:10.1038/5686
Kefalov, V., Y. Fu, N. Marsh-Armstrong, and K.W. Yau. 2003. Role of visual pigment properties in rod and cone phototransduction. Nature. 425:526–531. doi:10.1038/nature01992
Kepecs, A., N. Uchida, and Z.F. Mainen. 2007. Rapid and pre-cise control of sniffing during olfactory discrimination in rats. J. Neurophysiol. 98:205–213. doi:10.1152/jn.00071.2007
Kleene, S.J. 1993. Origin of the chloride current in olfactory transduc-tion. Neuron. 11:123–132. doi:10.1016/0896-6273(93)90276-W
Kleene, S.J. 1997. High-gain, low-noise amplification in olfactory transduction. Biophys. J. 73:1110–1117. doi:10.1016/S0006-3495 (97)78143-8
Kleene, S.J. 2008. The electrochemical basis of odor transduction in vertebrate olfactory cilia. Chem. Senses. 33:839–859. doi:10.1093/ chemse/bjn048
Krautwurst, D., K.W. Yau, and R.R. Reed. 1998. Identification of li-gands for olfactory receptors by functional expression of a receptor library. Cell. 95:917–926. doi:10.1016/S0092-8674(00)81716-X
Kurahashi, T., and K.-W. Yau. 1993. Co-existence of cationic and chloride components in odorant-induced current of vertebrate ol-factory receptor cells. Nature. 363:71–74. doi:10.1038/363071a0
Kurahashi, T., G. Lowe, and G.H. Gold. 1994. Suppression of odor-ant responses by odorants in olfactory receptor cells. Science. 265:118–120. doi:10.1126/science.8016645
Lamb, T.D., and E.N. Pugh Jr. 2004. Dark adaptation and the ret-inoid cycle of vision. Prog. Retin. Eye Res. 23:307–380. doi:10 .1016/j.preteyeres.2004.03.001
Leinders-Zufall, T., M. Ma, and F. Zufall. 1999. Impaired odor adaptation in olfactory receptor neurons after inhibition of Ca2+/calmodulin kinase II. J. Neurosci. 19:RC19.
Lowe, G., and G.H. Gold. 1991. The spatial distributions of odorant sensitivity and odorant-induced currents in salamander olfactory receptor cells. J. Physiol. 442:147–168.
Lowe, G., and G.H. Gold. 1993. Nonlinear amplification by calcium-dependent chloride channels in olfactory receptor cells. Nature. 366:283–286. doi:10.1038/366283a0
Lowe, G., and G.H. Gold. 1995. Olfactory transduction is intrin-sically noisy. Proc. Natl. Acad. Sci. USA. 92:7864–7868. doi:10 .1073/pnas.92.17.7864
Malnic, B. 2007. Searching for the ligands of odorant receptors. Mol. Neurobiol. 35:175–181. doi:10.1007/s12035-007-0013-2
Matthews, H.R. 1999. A compact modular flow heater for the super-fusion of mammalian cells. J. Physiol. (Lond.) 518:13P. doi:10.1111/j.1469-7793.1999.0867p.x
Miyamichi, K., S. Serizawa, H.M. Kimura, and H. Sakano. 2005. Continuous and overlapping expression domains of odorant re-ceptor genes in the olfactory epithelium determine the dorsal/ventral positioning of glomeruli in the olfactory bulb. J. Neurosci. 25:3586–3592. doi:10.1523/JNEUROSCI.0324-05.2005
Mombaerts, P. 2004. Genes and ligands for odorant, vomeronasal and taste receptors. Nat. Rev. Neurosci. 5:263–278. doi:10.1038/nrn1365
Dow
nloaded from http://rupress.org/jgp/article-pdf/136/5/529/1227511/jgp_201010528.pdf by guest on 07 April 2022

540 Basal activity of odorant receptors
Wesson, D.W., T.N. Donahou, M.O. Johnson, and M. Wachowiak. 2008. Sniffing behavior of mice during performance in odor-guided tasks. Chem. Senses. 33:581–596. doi:10.1093/chemse/bjn029
Youngentob, S.L., M.M. Mozell, P.R. Sheehe, and D.E. Hornung. 1987. A quantitative analysis of sniffing strategies in rats perform-ing odor detection tasks. Physiol. Behav. 41:59–69. doi:10.1016/ 0031-9384(87)90131-4
Zhao, H., L. Ivic, J.M. Otaki, M. Hashimoto, K. Mikoshiba, and S. Firestein. 1998. Functional expression of a mammalian odorant receptor. Science. 279:237–242. doi:10.1126/science .279.5348.237
Zhou, Y.Y., D. Yang, W.Z. Zhu, S.J. Zhang, D.J. Wang, D.K. Rohrer, E. Devic, B.K. Kobilka, E.G. Lakatta, H. Cheng, and R.P. Xiao. 2000. Spontaneous activation of beta(2)- but not beta(1)-adrenoceptors expressed in cardiac myocytes from beta(1)beta(2) double knock-out mice. Mol. Pharmacol. 58:887–894.
Zou, D.J., A. Chesler, and S. Firestein. 2009. How the olfactory bulb got its glomeruli: a just so story? Nat. Rev. Neurosci. 10:611–618. doi:10.1038/nrn2666
Spehr, M., and S.D. Munger. 2009. Olfactory receptors: G protein-coupled receptors and beyond. J. Neurochem. 109:1570–1583. doi:10.1111/j.1471-4159.2009.06085.x
Stephan, A.B., E.Y. Shum, S. Hirsh, K.D. Cygnar, J. Reisert, and H. Zhao. 2009. ANO2 is the cilial calcium-activated chloride chan-nel that may mediate olfactory amplification. Proc. Natl. Acad. Sci. USA. 106:11776–11781. doi:10.1073/pnas.0903304106
Su, C.Y., K. Menuz, and J.R. Carlson. 2009. Olfactory perception: receptors, cells, and circuits. Cell. 139:45–59. doi:10.1016/j.cell .2009.09.015
Takeuchi, H., H. Ishida, S. Hikichi, and T. Kurahashi. 2009. Mechanism of olfactory masking in the sensory cilia. J. Gen. Physiol. 133:583–601. doi:10.1085/jgp.200810085
Tankersley, C.G., R.S. Fitzgerald, and S.R. Kleeberger. 1994. Differential control of ventilation among inbred strains of mice. Am. J. Physiol. 267:R1371–R1377.
Trotier, D., and P. MacLeod. 1983. Intracellular recordings from salamander olfactory receptor cells. Brain Res. 268:225–237. doi: 10.1016/0006-8993(83)90488-2
Dow
nloaded from http://rupress.org/jgp/article-pdf/136/5/529/1227511/jgp_201010528.pdf by guest on 07 April 2022