Embed Size (px)
Citation preview

1 | P a g e
Financial Evaluation of The Cheesecake Factory Inc.
Joey Farquhar [email protected]
Tim Hipsher [email protected]
Trevor Rathbun [email protected]
Benjamin Johnson [email protected]
Charlie Horan [email protected]

2 | P a g e
TABLE OF CONTENTS
EXECUTIVE SUMMARY 6
INDUSTRY ANALYSIS 7
ACCOUNTING ANALYSIS 9
FINANCIAL ANALYSIS 10
VALUATION ANALYSIS 14
COMPANY/INDUSTRY OVERVIEW 15
COMPANY OVERVIEW 15
INDUSTRY OVERVIEW 15
FIVE FORCES ANALYSIS 18
RIVALRY AMONG EXISTING FIRMS 19
THREAT OF NEW ENTRANTS 31
THREAT OF SUBSTITUTION 32
BARGAINING POWER OF SUPPLIERS 32
BARGAINING POWER OF CUSTOMERS 33
KEY SUCCESS FACTOR ANALYSIS 34
COST LEADERSHIP 35
ECONOMIES OF SCALE 35
COST CONTROL 36
DIFFERENTIATION 36
SUPERIOR PRODUCT QUALITY 37
SUPERIOR CUSTOMER SERVICE 37
BRAND IMAGE 38
FIRM COMPETITIVE ADVANTAGE ANALYSIS 39

3 | P a g e
ACCOUNTING ANALYSIS 42
KEY ACCOUNTING POLICIES 44
TYPE I ACCOUNTING POLICIES 44
ECONOMIES OF SCALE 44
CUSTOMER SERVICE 46
PRODUCT QUALITY 47
TYPE II ACCOUNTING POLICIES 48
OPERATING LEASES 48
CONCLUSION 49
DEGREE OF ACCOUNTING FLEXIBILITY 50
OPERATING LEASES 50
GOODWILL 51
CONCLUSION 52
EVALUATION OF ACCOUNTING STRATEGY 52
OPERATING LEASES 53
GOODWILL 55
RESEARCH AND DEVELOPMENT 55
CONCLUSION 55
QUALITATIVE ANALYSIS 56
PRODUCT AND SERVICE QUALITY 57
OPERATING LEASES 58
RED FLAGS 58
ACCOUNTING DISTORTIONS 60
RESTATEMENT TABLE 61
DEPRECIATION TABLE 68

4 | P a g e
FINANCIAL ANALYSIS 69
LIQUIDITY RATIOS 69
CURRENT RATIO 70
QUICK RATIO 71
INVENTORY TURNOVER 72
INVENTORY DAYS OUTSTANDING 74
ACCOUNTS RECEIVABLE TURNOVER 76
ACCOUNTS REEIVABLE DAYS OUTSTANDING 77
CASH TO CASH 78
WORKING CAPITAL TURNOVER 80
CONCLUSION 81
PROFITABILITY RATIOS 82
SALES GROWTH 82
GROSS PROFIT MARGIN 83
OPERATING PROFIT MARGIN 85
NET PROFIT MARGIN 86
ASSET TURNOVER 88
RETURN ON ASSETS 89
RETURN ON EQUITY 90
CONCLUSION 92
CAPITAL STRUCTURE RATIOS 92
DEBT TO EQUITY RATIO 93
TIMES INTEREST EARNED RATIO 94
ALTMAN’S Z-SCORE 96
FINANCIAL FORECASTING 98
INCOME STATEMENT 98
DIVIDENDS FORECASTED 103
BALANCE SHEET 105
STATEMENT OF CASH FLOWS 111

5 | P a g e
RESTATED FINANCIALS 114
COST OF CAPITAL ESTIMATION 114
COST OF DEBT 115
COST OF EQUITY 117
BACKDOOR COST OF EQUITY 120
WEIGHTED AVERAGE COST OF CAPITAL 122
COMPARATIVE EVALUATION 125
INTRINSIC VALUATION 129
APPENDIX 145

6 | P a g e
Executive Summary
Analyst Recommendation: Sell (Overvalued)
52 Week Range 39.86-49.74 2008 2009 2010 2011 2012 2013
Revenue 1.9 Billion As stated 2.53 3.21 4.87 4.74 4.93 5.43
Market Cap 2.25 Billion Restated 2.38 3.11 3.61 3.64 3.7 3.74
Shares Outstanding 48.3 Million
Price
As Stated Restated Trailing P/E 39.42
Return on Equity 21.24 21.24 Forward P/E 34.79
Return on Assets 10.91 8.56 P/B 39.94
PEG 38.87
P/EBITDA 49.12
Estimated adj. r^2 Beta size adj. Ke EV/EBITDA 57.89
3 month 0.3687 0.915 0.1186
1 year 0.3688 0.915 0.1168 Price
2 year 0.369 0.915 0.1168 As Stated Re Stated
7 year 0.37 0.917 0.117 12.467 16.488
10 year 0.3702 0.917 0.117 91.62 115.74
16.6 19.64
As stated Restated 12.84 13.34
Backdoor Ke 10.81% 9.01%
BT WACC 11.59% 11.00%
Beta 1.637
Intrinsic Valuations
Discounted Dividends
Discounted Cash Flows
Residual Income
Long Run ROE Risidual Income
CAKE 6/1/2014- $45.87 Altman Z-Score
Market Valuations
Cost of Capital

7 | P a g e
Industry Analysis
The Cheesecake Factory is in the full service upscale-casual restaurant
industry. The Cheesecake Factory focuses on satisfying customers by delivering
quality meals from an innovative menu, and providing superior customer service.
Firms in this industry must possess value added business strategies to obtain a
competitive advantage over their competitors.
When analyzing the industry for it’s value added business strategies, we
used the Porters Five Forces Model. This can break the competitive forces down
by stating the level of competition from the rivalry among existing firms, threat
of new entrants, threat of substitute products, bargaining power of customers,
and bargaining power of suppliers. This tells us specifics about each firm within
the industry as well as data on the overall industry. It’s also important because it
gives potential investors and current shareholders an idea on how firms are

8 | P a g e
increasing shareholder wealth. Below is the summary table of Porters Five Forces
model for the upscale-casual restaurant industry.
Based on the five forces summary, we observed that rivalry among
existing firms is high. This high competition is likely caused from low
concentration in the industry, economies of scale, and a tight cost control
system. The threat of new entrants is low that is mostly due to high switching
cost and the need for high levels of economies of scale. The threat of substitute
products is high. Customers in this industry have many substitutable products.
There is the option of quick service as well as other available restaurants within
the industry. Our borrowing power from customers is high and suppliers is
opposite. Customers have bargaining power over firms, again, because of the
high threat of substitute products. The power of suppliers is low primarily due to
the high volume of suppliers. This allows firms to hedge prices and maintain
bargaining power over the suppliers.
After performing the five forces analysis, we now have a better
understanding of the upscale-casual restaurant industry. We were shown how
firms gain competitive advantages from a combination of cost control and
product differentiation business activities. These activities add value to the firm
and ultimately increase shareholder’s wealth.
Cheesecake Factory's Competitive Forces Level of CompetitionRivalry Among Existing Firms: High
Threat of New Entrants: Low
Threat of Substitute Products: High
Bargaining Power of Customers: High
Bargaining Power of Suppliers Low

9 | P a g e
Accounting Analysis
During the valuation process of Cheesecake Factory, it is important for us
to analyze the accounting policies and procedures presented within the recent
10-K. Companies have the ability to provide or distort certain information within
their annual and quarterly reports. It is our responsibility to seek out these
distortions and evaluate the quality of information given to us. Often, firms with
low quality of disclosure provide minimal details relating to their revenues,
expenses, and liabilities and vice versa for firms with high quality disclosure.
GAAP does require certain information to be placed in a company’s annual
report, but it is up to the management’s discretion to go beyond the requirement
and inform the reader more about their company.
To begin the accounting analysis, we determine what Cheesecake
Factory’s Type 1 and Type 2 key accounting policies. Type 1 accounting policies
can be linked to key success factors identified for Cheesecake Factory. We have
identified Cheesecake Factory’s type 1 accounting policies to be economies of
scale, superior customer service, and superior product quality. In Cheesecake’s
10-K they go in great detail about their key accounting policies but the remainder
of the annual report fails to be at the same level of disclosure as the competition
in the industry.
Type 2 accounting policies have more potential to distort information
provided to readers. We found that Cheesecake Factory’s type 2 policies to be
capital vs. operating leases and disclosure. Information regarding type 2
accounting policies clearly distorts Cheesecake Factory’s financial statements. For
example, the firm chooses to use only operating leases allowing Cheesecake to
leave a large portion of liabilities placed off the books. By capitalizing the leases
we are able to depict a more accurate picture of Cheesecake Factory’s liabilities
and obligations.

10 | P a g e
The quality of disclosure in Cheese Factory’s 10-K is poor. We determined
this analysis based on the amount of information presented in the report. Unlike
the competitors in the industry, Cheesecake Factory’s is below the industry
standard providing hardly any information relating to revenues, expenses, and
liabilities. The quality of disclosure present raises concerns in our valuation of the
company. We will have to identify all the red flags within the 10-K and possibly
restate the financial information to give us a more accurate description on the
operations of Cheesecake Factory.
Financial Analysis
The next thing we needed to look at to value The Cheesecake Factory was
to analyze the company’s financials through ratio analysis, forecasting financials,
and performing a regression study to determine cost of equity and backdoor cost
of equity. The first thing we had to do was perform a ratio analysis of The
Cheesecake Factory. The initial set of ratios we analyzed were the liquidity ratios
which include, current ratio, quick ratio, inventory turnover and days
outstanding, accounts receivable turnover and days outstanding, cash to cash
ratio, and working capital turnover. We analyzed these ratios to determine
health of the company and then compared the ratios to the industry.
Operating Lease Capital Lease
The Cheesecake Factory 100.00% 0.00%
BJ's Restaurants Inc. 100.00% 0.00%
Brinker Intl. 87.01% 12.99%
Darden Inc. 92.86% 7.14%
Percentage of Leases by Type 2013

11 | P a g e
Ratio Performance Comparison to
industry
Trend
Current Ratio Underperforming Over performing Downward
Quick Ratio Underperforming Over performing Downward
Inventory
Turnover
Over performing Average Downward
Inventory
Days
Over performing Average Upward
Accounts
Receivable
Turnover
Over performing Over performing Upward
Accounts
Receivable
Days
Over performing Over performing Upward
Cash to Cash Average Average Stable
Working
Capital
Turnover
Underperforming Underperforming Upward
Overall Underperforming Over performing Upward
The liquidity ratios show how easily a company can pay off their debt with
short term assets. After analyzing the liquidity ratios we saw that The
Cheesecake Factory underperforms overall but compared to the industry The
Cheesecake Factory generally outperforms the industry.
We analyzed the profitability ratios next. The profitability ratios tell us
how well a company retains income from sales as expenses are being taken out.
These ratios include sales growth ratio, gross profit margin, operating margin,
net profit margin, asset turnover, ROA, and ROE. We analyzed these ratios to

12 | P a g e
determine the health of The Cheesecake Factory and then compared the
company to the industry.
Ratios Performance Compare to
Industry
Trend
Sales growth Average Average Stable
Gross profit
margin
Average Average Stable
Operating margin Underperforming Average Stable
Net profit margin Underperforming Average Stable
Asset turnover Over performing Over performing Upward
ROA Underperforming Average Upward
ROE Over performing Average Upward
Overall average Average stable
After analyzing the profitability ratios we determined that The Cheesecake
Factory has generally healthy ratios and stay on par with the industry.
The last set of ratios we analyzed is the Capital Structure Ratios. These
ratios show us how a company funds itself and if it is headed for bankruptcy or
not. The capital structure ratios are debt to equity, times interest earned, and
Altman’s Z score. Again, we looked at these ratios to determine the health of
The Cheesecake Factory and then we compared to the industry.
Ratio Performance Industry compare Trend
Debt to equity Underperforming Underperforming Downward
Times interest
earned
Underperforming Underperforming Downward
Z score Over performing Over Performing Upward
overall Underperforming Underperforming Downward

13 | P a g e
After analysis of the capital structure ratios we determined that The
Cheesecake Factory has generally unhealthy ratios and are underperforming in
the industry. However, the Altman’s Z-Score which determines whether or not a
company is headed for bankruptcy was very high for The Cheesecake Factory
and tells us that the company is in no danger of going bankrupt.
The next step we took was to forecast the financials for the company over
the next 10 years. Forecasts are very volatile and prone to error but we
completed the forecasts as accurately as possible. When forecasting, our main
priority is to get a proper equity forecast, therefore, we do not care about the
liability forecast. The statement of cash flows is more volatile than the rest of
the forecast and is much more prone to error. The main focus of forecasting the
statement of cash flows is to get an accurate measurement on dividends so we
can get an accurate retained earnings forecast, and to get an accurate CAPEX
forecast. The rest of the statement is too prone to error and as such we did not
focus on it.
The final step in analyzing the financials is to run a regression test to
determine cost of capital. After running regressions with a 95% confidence
interval we decided on using the beta obtained through the 7 year treasury with
a 72 month horizon and got an adjusted beta of 1.637%. With this beta we
obtained a cost of equity of 17.46% which includes a size premium of 1.8%.
From there we used obtained an as stated backdoor cost of equity of 10.81%
and a restated backdoor cost of equity of 9.01% since we had to capitalize the
operating leases. We used these backdoor cost of equity rates to obtain an as
stated before tax weighted average cost of capital of 17.31% and a restated
before tax weighted average cost of capital of 15.69%.
14 | P a g e
Valuation Analysis
After the three prior analyses, we can now value Cheesecake Factory as
overvalued, undervalued, or fair. To begin the valuation process, we have
established ourselves as 10% analysts. Our results will be based on the
benchmark of the current price of $45.87 as of June 1st, 2014. Through this
comparison, we will come with a decision on the value of the company.
There are two methods for valuation. The first is the method of
comparable which uses industry prices as compared the company we are
valuing. The second method for valuation is the intrinsic valuation method. The
method for the valuation analysis we chose is the intrinsic valuation method. The
data for this method is purely based off Cheesecake Factory’s values rather than
the industries. The intrinsic valuation method consists of four valuation models
based off forecasted data; discounted dividends model, free cash flow model,
residual income, and long run residual income model.
The intrinsic method provides a more accurate and descriptive
interpretation on the future of the firm compared to other methods. To find
results from these models we take the forecasted data and put them into a
series of sensitivity analyses. The results from each model consistently interprets
that Cheesecake Factory is overvalued both as a stated and restated basis. The
residual income model is our best indicator of our recommendation because of its
dependency on the current situation of Cheesecake Factory. Through these
series of sensitive analyses, Cheesecake Factory’s model values fail to fall within
the lower and upper bounds limits of our 10% analysis. We conclude that
through our intrinsic valuation that Cheesecake Factory is currently overvalued.

15 | P a g e
Company Overview
The Cheesecake Factory, Inc. is an upscale casual, full service dining
establishment that competes in the food service industry and was incorporated in
Delaware in 1992. The company owns and operates 169 Cheesecake Factory
restaurants, 11 Grand Lux Café restaurants, and 1 RockSugar Pan Asian Kitchen
restaurant (Cheesecake 10-K). The Cheesecake Factory, Inc. also fully owns and
operates 2 bakery production facilities that are utilized to provide the desserts
the company is famous for to the restaurants and sell any excess capacity to
outside customers (Cheesecake 10-K).
The company utilizes a diversified menu to attract guests and fill the
restaurant at all hours of operation so they can stay competitive with the rival
companies. The great majority of Cheesecake Factories and Grand Lux Cafés are
located in the metropolitan areas of large cities or along the edge of metropolitan
areas where there are extremely high volumes of traffic per day at all times of
day from morning to late evening. The strategic advantage being that the larger
the volume of people moving past the restaurant during the day the more
opportunity there is for someone to stop in for a meal so that they can maintain
a full restaurant at all times of day.
Industry Overview
The Cheesecake Factory Inc. is a competitor in the restaurant industry in
the domestic United States as well as a future competitor in international
economies due to current licensing agreements. According to the National
Restaurant Association, restaurant sales “constitute 4 percent of the U.S. GDP”
with economic impact of an estimated $1.8 trillion. In billions of current dollars
restaurant industry sales have increased from $42.8 billion in 1970 to a projected

16 | P a g e
$683.4 billion in 2014. In 2010, during the middle of the recent economic
recession in the United States, restaurant sales were $586.7 billion. The
projected sales for 2014, which are $96.7 billion more than 2010, show an
increase in sales despite economic distress within consumer households in the
United States during this period.
Within the restaurant industry there are two primary divisions to
categorize establishments: quick service and full service restaurants. Differences
between these two categories involve service, quality, and time. Quick service
establishments involve fast-food and casual dining restaurants with no tableside
service. As the name suggests, quick service involves less waiting time on meals

17 | P a g e
than full service. Although there is a convenience factor for quick service
establishments, they also require the customers to self-serve themselves drinks
and other sides they may want or need. In contrast, full service establishments
employ waitresses and waiters to serve the guests, require guests to sit down for
an extended period of time, and also offer high quality food such as a prime
steak or a fresh water salmon made after ordering.
Companies in the restaurant industry compete on different levels based on
the type of establishment the restaurant is. Full service restaurants rely on high-
margin items and effective marketing of brand image in order to drive profits. In
contrast, quick service restaurants rely on high efficiency and high sales volume
in order to drive profits.
The demand in the industry is driven by factors that include
demographics, consumer tastes, and consumer income. In terms of
demographics and consumer income affecting demand in the industry, the lower
the consumer income the less disposable income customers have to spend on
dining out. Full service restaurants with higher menu prices target consumers
with a higher disposable income. Changing consumer tastes are also a driver of
demand in the restaurant industry. New flavors and awareness of ingredients
affect what product a company produces in order to gain more market share.
For analysis purposes we are defining the industry as upscale casual
dining. Upscale casual dining refers to full service establishments that compete
with a highly diverse menu selection, high quality service, prices that attempt to
target all socioeconomic classes, as well as presenting a décor and an ambiance
representative of a high quality establishment. The industry includes the
following firms: The Cheesecake Factory Inc., Brinker Intl., Darden Inc., and BJ’s
Restaurants Inc.

18 | P a g e
Porter’s Five Forces Model
Porter’s Five-Forces model aids financial analysts in answering questions
regarding the business strategy development of the company as well as an
overall industry analysis. This model also helps prospective and current investors
develop a better understanding of the industry in which the company operates as
well as the business strategy that the company implements in order to increase
shareholder wealth. The model consists of two factors, actual and potential
competition to a firm and bargaining power of customers and suppliers. The
competition factor of the model has three sub categories which include rivalry
amongst existing firms, the threat of new entrants, and the threat of substitute
product. These three sub categories along with the bargaining power of
customers and suppliers factor lead to industry profitability and help companies
decide how to operate the business activities and price products in order to
increase profit margins.
There are three levels of competition in an industry that the Five-Forces
model shows us: high competition, mixed competition, which consists of high
and low form of competition components, and low competition. High competition
does not allow firms room for variances in standard prices of products in an
industry while low competition allows firms to be able to specialize in a few
products, allowing control of prices and markets. All of the five aspects of the
model work together to help analyze the prospective profitability of an industry
as well as the firm in the industry.

19 | P a g e
Cheesecake Factory's Competitve
Forces Level of competition
Rivalry Among Existing Firms: High
Threat of New Entrants: Low
Threat of Substitute Products: High
Bargaining Power of Customers: High
Bargaining Power of Suppliers: Low
Rivalry Among Existing Firms
Rivalry among existing firms is a sub category of competition in the Five-
Forces model we are using for analysis. This category measures the competition
that is present in the upscale casual dining industry. When measuring the level of
competition of rivalries among existing firms, key success factors include:
Concentration of the industry
Product differentiation
Growth rate of specific firms and the industry as a whole
Scale and learning economies
Switching costs
Excess capacity
Utilizing these factors in the Five-Forces model can help firms improve and
maintain an efficient current business strategy in the industry in order to grow
profit margins.

20 | P a g e
Industry Concentration
The amount and size of the firms in an industry define the industry’s
degree of concentration. The degree of concentration determines whether firms
in an industry can be a price-taker or a price-setter. If the industry is dominated
by one firm it is considered a monopoly and the dominant firm will be the price-
setter, with less dominant firms using the prices as a benchmark. Industries that
have three or four equally sized firms cooperate in order to avoid price
competition that can become destructive to the industry as a whole, resulting in
a mix between price-setting and price-taking. Industries with fragmentation face
steep price competition between the firms involved. The degree of concentration
in the upscale casual dining industry in the United States is low due to existing
firms expanding their brands year to year. Shown below is the industries
concentration based on sales.
2009 2010 2011 2012 2013
Cheesecake Factory Inc. 12.79 13.66 13.91 13.56 13.36
BJ's Restaurants, Inc. 3.41 4.23 4.91 5.31 5.52
Darden Inc. 57.64 58.57 59.34 59.97 60.86
Brinker Intl. 26.16 23.54 21.85 21.15 20.26
0.00
10.00
20.00
30.00
40.00
50.00
60.00
70.00
% o
f S
har
e
Years
Industry Market Share (Sales)

21 | P a g e
The industry market share based on sales indicate that Darden Inc., holds the
majority of market share in the industry with Cheesecake Factory, Brinker Intl.,
and BJ’s Restaurants rounding out the bottom 40% of market share. One factor
behind the large market share of Darden Inc. is the number of restaurants the
company currently has in operation. Darden currently “[operates] 2,138
restaurants” that include 8 different brands (Darden 10K). Brinker Intl. operates
“more than 1,600 restaurants” with the brands being Chili’s and Maggiano’s
(Brinker 10-K). The Cheesecake Factory Inc. and BJ’s Restaurants operate on a
smaller scale than both Brinker and Darden. The Cheesecake Factory owns and
operates 181 restaurants with “169 under the Cheesecake Factory mark, 11
under the Grand Lux Café, and 1 under the RockSugar Pan Asian Kitchen mark”
(Cheesecake 10-K). BJ’s currently “owns and operates 150 restaurants as of May
2014” (BJ’s 10-K).
Although the firms in the industry vary in size, the “average check per
person was in the range of $16.25 to $16.75” for Darden Inc. during 2013
(Cornell). The average check per person for The Cheesecake Factory Inc. during
fiscal 2013 “was approximately $19.70” (Darden 10-K). BJ’s Restaurant has an
“average customer check of $11.00 to $17.00” during 2013 (BJ’s 10-K). The
similarity in price range for check per person within this industry despite the
differences in market share based on sales indicates that competition rivalry
amongst firms in the industry is high, thus leading to a mixture of price-setting
and price-taking within the industry.
22 | P a g e
Differentiation
Product differentiation creates a competitive advantage in price
competition in the upscale casual dining industry. Competitors producing similar
products in the industry allow consumers to switch firms on pure-price basis.
This factor leads to companies in the industry being price-takers in terms of the
similar products due to the high price competition present in an industry. In
contrast, when companies offer differing products than competitors, the firm
competes less on price and more on quality and service. This allows the
company to be price-setters in terms of the differing products.
For example, The Cheesecake Factory Inc. has product differentiation in
dessert products. The menu offers “approximately 50 varieties of cheesecake
and other quality baked deserts”. This product differentiation is a value driver
and allows the company to be a price-setter for the product by “offering high
quality deserts, [which] results in significant level of dessert sales, approximately
15% of The Cheesecake Factory restaurant sales for fiscal 2013, 2012, and
2011” (Cheesecake 10-K). BJ’s Restaurant’s use product differentiation by
“offering as many as 30 guest domestic and imported craft beers” with the
“[intent] to enhance BJ’s competitive position as the leading retailer of craft beer
in the casual dining segment.” BJ’s alcohol sales are a value driver of the firm in
the upscale casual dining industry and represent “approximately 22% of total
restaurant sales in 2013” (BJ’s 10-K).
“One of our competitive strengths is our ability to anticipate consumer
dining and taste preferences and adapt our menu to the latest trends in food
consumption” (Cheesecake 10-K). As an example, consumers are now more
concerned about what ingredients are in their food along with how “healthy”
their food is. As a response to this recent demand of healthy living, the
Cheesecake Factory has developed the SkinnyLicious® menu, “which offers
approximately 50 innovative items at 590 calories or less” (Cheesecake 10-K).

23 | P a g e
Darden Inc. offers items at its Seasons 52 restaurant that are “[no] more than
475 calories” (Darden 10-K), BJ’s restaurants offer “a lower calorie menu
category called Enlightened Entrées®” (BJ’s 10-K), and Brinker Intl. offers a
“lighter choices” menu that has items with less than 650 calories. These are
examples of companies responding to consumer tastes and preferences using
research and development as a means to differentiate products to drive value in
the industry.
Differentiation is also present in the firm’s atmosphere and services
offered. Companies in the upscale casual dining industry differentiate the
atmospheres of restaurants by using décor and designs that are parallel to the
firm’s business strategy. The Cheesecake Factory places “significant emphasis on
the unique, contemporary interior design and décor of [their] restaurants” in
order to create a “high-energy ambiance in a casual setting.” (Cheesecake 10-K).
Brinker Inc. differentiates their atmospheres of their restaurants based on the
brand. For example, Brinker Intl.’s Maggiano’s Little Italy restaurant’s interior
design “of all locations transport[s] [the] guests back to a classic Italian-
American restaurant in the style of New York’s Little Italy in the 1940s” (Brinker
10-K). The differentiation strategy in atmospheres of upscale casual dining
establishments are used as value drivers within the industry.
Conclusion
In the upscale casual dining industry differentiation of services and
products offered drive value for the firms. The degree of differentiation is a
mixture of highly differentiated and similar products and services. Companies in
the industry offer many of the same menu items such as steaks, pastas, and
salads. However, differentiation in specialty products such as The Cheesecake
Factory’s desserts and BJ’s Restaurants wide variety of beer on tap are product
differentiations that drive value for the companies. The service that firms provide

24 | P a g e
to customers in the industry is similar, with all company’s missions toward
hospitality ensuring that guest satisfaction is of “highest priority”. The
differentiation of concepts and atmospheres between restaurants in the industry
allow customers to differentiate between the firms based on consumer tastes
and preferences. Overall, differentiation of products, services, and atmospheres
are value drivers within the upscale casual dining industry and cause a mix of
Industry Growth Rate
Industry growth rate aids business analysts in determining if an industry is
either growing, declining, or is stagnate. The growth rate also helps indicate how
firms should revise current business plans in order to compete for market share
in the industry. When an industry is experiencing high growth companies can
gain a competitive advantage by developing new products in accordance with
current consumer tastes as a means to attract new consumers in order to gain
share of the growing market. In a low growth industry firms compete on price in
order to take business from the industry’s competitors.
The food service industry as a whole currently employs 13.5 million people
in the United States which consists of “10% of the overall U.S. workforce.” As of
2014, restaurant industry sales are projected to reach $683.4 billion,
experiencing an increase of “3.6% in nominal terms” (National Restaurant
Association). Firms in the overall restaurant industry expand by franchising or
opening more company owned stores.
For the purpose of analysis the industry we are valuing is consistent of
higher quality products and services, called the upscale casual dining industry.

25 | P a g e
With respect to sales revenues in the upscale casual dining industry
Darden Inc. holds the overall market share in comparison to other firms. The
average trend in sales revenues of the industry from 2010 to 2013 is increasing
for all firms in the industry. Between 2009 and 2010 however the trend in sales
revenue was decreasing. The decrease in sales revenue during this time period
can be attributed to the economic recession experienced in the United States.
Less consumer income means less disposable income to spend on dining out,
therefore leading to decreased sales in the upscale casual dining industry.
Annual sales growth, pictured below, is used to analyze the percentage of
sales growth that each firm experienced in the industry between 2009 and 2013.
Overall industry sales did not grow and instead shrank in terms of annual sales
growth between 2009 and 2010. However, between 2011 and 2013 the firms
and industry as a whole experienced annual sales growth, with the total sales
growth of the industry equaling 4.08%, 5.51%, and 5.36% for years 2011, 2012,
and 2013 respectively. The growth, steady and not increasing exponentially, is a
Sales Revenues (in thousands)
2009 2010 2011 2012 2013
Cheesecake
Factory Inc. $1,602,020.00 $1,659,404.00 $1,757,624.00 $1,809,017.00 $1,877,910.00
BJ's
Restaurants,
Inc. 426,707.00 513,860.00 620,943.00 708,325.00 775,125.00
Darden Inc. 7,217,700.00 7,113,100.00 7,500,200.00 7,998,700.00 8,551,900.00
Brinker Intl. 3,276,362.00 2,858,498.00 2,761,386.00 2,820,722.00 2,846,098.00
Total Industry
Sales 12,522,789.00 12,144,862.00 12,640,153.00 13,336,764.00 14,051,033.00

26 | P a g e
sign that the upscale casual dining industry has recovered from the economic
recession during 2009 and 2010. The consistent average increase in sales growth
for the industry is indicative of a high competition market within the industry,
thus leading to a mixture of price-setting and price-taking tendencies by firms
within the industry.
Conclusion
The upscale casual dining industry, consisting of The Cheesecake Factory
Inc., Brinker Intl., Darden Inc., and BJ’s Restaurants, Inc., shows to have
recovered from the economic recession taking place during 2009 and 2010 with
a positive and consistent growth rate in years 2011, 2012, and 2013. The
consistent average increase in sales growth of the industry as a whole indicates a
highly competitive market that is currently expanding, resulting in a mix of price-
taking and price-setting between the firms of the industry in order to increase
profitability.

27 | P a g e
Economies of Scale
In the upscale casual dining industry learning curves of products are
pivotal to being able to gain share of the market and increase sales. Steep
learning curves and the presence of other scale economies in the industry
require having enough capital and resources as a firm to achieve a learning
economy. Learning economies will result in quicker development of products that
target ever changing consumer tastes in an effort to gain a greater share of the
market. Below is the total assets of each firm in the upscale casual dining
industry we are valuing.
2009 2010 2011 2012 2013
Cheesecake Factory Inc. -0.27 3.58 5.92 2.92 3.81
BJ's Restaurants, Inc. 12.33 16.96 17.25 12.34 8.62
Darden Inc. 8.92 -1.45 5.44 6.65 6.92
Brinker Intl. -22.64 -12.75 -3.40 2.15 0.90
Total sales growth of industry -2.49 -3.02 4.08 5.51 5.36
-25.00
-20.00
-15.00
-10.00
-5.00
0.00
5.00
10.00
15.00
20.00
% o
f S
ale
s G
row
th
Annual Sales Growth %

28 | P a g e
In the industry that we are valuing the overall size of the firm in terms of
assets allows opportunities for more research and development of new ideas and
products due to having more capital. Darden Inc. captures approximately 60% of
sales revenue in the market for the industry and in correlation has the highest
amount of assets of any firm in the industry. By having more available assets to
use for capital Darden creates learning economies through product development,
thus capturing a greater share of the market in the upscale casual dining
industry. Another example of using assets to develop learning economies of scale
is vertical integration of inputs and outputs of a firm. For example, The
Cheesecake Factory Inc. vertically integrated its bakery production, “Vertical
integration of this vital part of our brand gives us control over the creativity and
quality of our deserts and is also more profitable than buying from a third party”
(Cheesecake 10-K). Vertical integration of bakery production creates an economy
of scale for The Cheesecake Factory in the industry. Controlling inputs and
outputs of the production process allows the firm to control costs of products
and has led dessert sales to account for “15% of restaurant sales.”
$-
$1,000,000
$2,000,000
$3,000,000
$4,000,000
$5,000,000
$6,000,000
$7,000,000
$8,000,000
2009 2010 2011 2012 2013
Total Assets (Thousands)
Cheesecake Factory BJ's Restaurants Brinker Intl. Darden Inc.

29 | P a g e
Conclusion
Economies of scale allow firms in the industry to control inputs and
outputs of production process, possibly lowering costs related to specific
products of a firm. Economies of scale are achieved in industries with steep
product learning curves by using capital as a means to develop learning
economies. Overall size of the firm in an industry affects the development of
learning economies and economies of scale due to the amount of assets a firm
has to put forth to product development. Economies of scale allow firms to
compete on costs and results in price-setting within the industry.
Switching Costs
When a firm is contemplating discontinuing operations in its current
industry and plans to enter another industry the firm will incur switching costs.
Switching costs in the restaurant industry are high, with property and equipment
specifically designed and produced for the purpose of restaurants. In the upscale
casual dining industry switching costs are high due to the “high quality” products
and services the firm offers. Ceasing operations in the industry would require
firms to sale supplies that are specific to the restaurant industry, thus having
little value to other industries. Kitchen supplies, décor, and fixtures within the
restaurant would be liquidated in order to exit the industry. Liquidating assets
can result in losses, thus increasing switching costs for the firm.
Along with costs to exit the industry a firm may incur costs to enter a new
industry. Purchasing of new assets related to the new industry, legal costs, as
well as a restructuring of business strategy are all factors associated with
switching costs for a firm.

30 | P a g e
Conclusion
Switching costs are costs that are related to ceasing operations in one
industry and beginning operations in a different industry. In the upscale
restaurant industry switching costs are high for firms due to the specialized
products used within the industry such as dining room furniture and heavy
kitchen appliances. Due to the high degree of switching costs firms are
discouraged from exiting the industry and thus create a highly competitive
market amongst firms in the industry.
Excess Capacity
Excess capacity occurs when the overall production is greater than the
consumers demand for products. High excess capacity results in increased
inventory expenses and unsold products increase the costs of goods sold.
In order to contain excess capacity to an acceptable level firms in the
upscale casual dining industry schedule inventory shipments based on current
demand of products. For example, The Cheesecake Factory Inc., “[negotiates]
short-term and long-term agreements” for the supply of inventory and
equipment requirements “depending on market conditions and expected
demand” (Cheesecake 10-K). By negotiating inventory shipment dates with
suppliers, firms in the industry control the level of excess capacity in the
company. The agreements help companies maintain stock and hedge against
over stocking in order to reduce costs related to inventory.
An industry’s excess capacity can be measured by dividing the total sales
by Plant, Property, and Equipment. The measure determines if the firms fixed
costs are producing profits for the company. The goal is to maintain a high sales
to plant, property, and equipment ratio in order to avoid pricing wars amongst

31 | P a g e
industry competitors. Below is the excess capacity ratios of the industry we are
valuing.
Threat of New Entrants
In the upscale casual dining industry the threat of new entrants is low due
to the market being relatively saturated. There are barriers to entry because
there are multiple firms that are established in the industry. Due to larger firms
being established, entering the industry is difficult due to market share already
being taken by other companies. A firm would have to compete on costs, which
is what the already established firms are already competing on. Also, a new firm
would have to compete against the brand value of the already established firms.
By entering a new market a new firm has to establish an economy of scale
to compete with the other firms. This can be difficult due to the new firm having
to create new relationships with their suppliers. Also, a new firm has little
negotiating power compared to firms that are already established and have been
in a relationship with their suppliers for an extended period of time.
-
0.50
1.00
1.50
2.00
2.50
3.00
2009 2010 2011 2012 2013
Excess Capacity (Sales/PPE)
Cheesecake Factory Inc. BJ's Restaurants, Inc. Darden Inc.
Brinker Intl. Industry

32 | P a g e
Threat of Substitute Products
Customers will think alternative products or services are substitutes based
on the price difference, how different a products function is, and how willing they
are to switch to another product. With such low concentration in the upscale
casual restaurant industry, the availability of substitutes is high. “Relevant
substitutes are not necessarily those that have the same form as the existing
products but those that perform the same function. For example, airlines and car
rental services might be substitutes for each other with it comes to travel over
medium distances.” (Palepu)
Because there are so many possible substitutes, we believe that it is
important to obtain differentiation. Offering customer satisfaction, superior
quality products, and a unique environment will help a company develop brand
loyalty and competitive advantage over competitors. By minimizing your product
cost and offering a reasonable price per plate allows you to compete on cost.
On the other hand, there will always be substitutes. Focusing on these
business operations can give you a competitive advantage. This reduces the
chance of customers going elsewhere and will potentially increase brand loyalty.
Bargaining Power of Suppliers
The bargaining power of suppliers in the upscale casual dining industry is
low. The companies in the industry mainly obtain their goods through suppliers
that they have negotiated long term contracts with (CAKE 10K) and therefore the
suppliers have very little control over who they supply to and by how much once
the contracts are signed. This results in very little bargaining power of suppliers
since the only chance they have to negotiate is during the contract negotiations

33 | P a g e
and even then the volume of suppliers in the industry is very large which creates
very little room for the suppliers to negotiate a price they want.
This method of contract negotiation allows the companies in the industry
to use a cost control method to keep the suppliers from changing prices on
them. Once the contracts are signed and the prices are negotiated, the supplier
has no ability to change their prices or stop supplying these companies. Because
of this the companies can maintain a consistent cost allocation to supplies that
allows them a high degree of flexibility with their other expenses.
Due to this the suppliers have very little bargaining power within the
upscale casual dining industry. A high volume of suppliers creates little room for
the suppliers to negotiate prices when writing up a long term contract with these
companies. This creates a large amount of flexibility for the companies and next
to nothing for the suppliers.
Bargaining Power of Customers
The bargaining power of customers is directly correlated to the threat of
substitute products and whether or not the product being supplied is a
commodity or a necessity. The upscale casual dining industry provides a
commodity service and there is a high threat of substitution within the industry
that creates a very high degree of bargaining power for the customers. As
evidenced by the financial statements from each company’s 10K, when the
economy crashes the upscale casual dining industry takes the crash very hard.
Sales decreased substantially across the board which ultimately negatively
affected net income and retained earnings.
This was all caused by the fact that the industry provides a commodity
service and the consumer base can substitute that product with cheaper

34 | P a g e
alternatives. This causes a massive backlash to the industry because the value
drivers that these companies use to obtain and retain business are rendered
useless because the customer has enough bargaining power that they can
choose to not utilize the product supplied whenever they want.
Because of these reasons we have concluded that the customers have a
very high degree of bargaining power within the upscale casual dining industry.
The ability for the customers to come and go as they please due to the high
availability of substitute products creates a very large amount of bargaining
power that the companies in the industry must follow. These companies do not
offer anything that the consumer needs to have that they cannot get anywhere
else.
Analysis of Key Success Factors for Value Creation in the
Industry
We have discussed how the five forces model can influence the
profitability of an industry as a whole. Now, we will express our analysis on the
industry's business activities that can add value and also create a competitive
advantage. There are two primary categories for achieving competitive
advantage – cost leadership and differentiation. After analyzing The Cheesecake
Factory and its competitors, we have determined our industry is primarily price
setters with a little price taking.

35 | P a g e
Cost Leadership
Cost leadership is “supplying the same product or service at a lower
cost.” (Palepu) It is possible to achieve a competitive advantage by cost
leadership from the following: economies of scale and scope, efficient
production, simple product designs, lower input costs, low-cost distribution, little
research and development or brand advertising, and also tight cost control
system. (Palepu) However, in the upscale casual restaurant industry, we think it’s
necessary to focus on achieving economies of scale and a tight cost control
system.
Economies of Scale
Economies of scale are a cost benefit a firm receives whenever they
buy, produce, or sell a large quantity of a product. The more the firm is able to
produce or sale, the more they fixed cost-per unit is going to decrease. In the
restaurant industry, with such a low concentration, it’s critical to the companies
in the industry to get inputs at a cheaper cost than competitors.
The Cheesecake Factory has 181 company restaurants and is also
currently expanding into the Middle East and Mexico. The firm has a bakery in
California and North Carolina. In this upscale casual industry firms are constantly
expanding not only nationally but also globally.
Based on the information above we’ve concluded that it’s important to
take advantage of the cost benefit from economies of scale. The more
restaurants a firm has the more inputs it will need. Having 2 bakeries makes it
possible for them to make their own products and offer a lower cost than their
competitors.

36 | P a g e
Tight Cost Control System
No matter the industry a company is in, every company is always seeking
to minimize cost. Obtaining a tight cost control system can be difficult to achieve
if a company’s budget is not tight. A way of cutting cost within a company can
be done by observing business operations over time and looking for possible
trends.
“Substantially all of our food and supplies are available from multiple
qualified suppliers, which helps to diversify our overall commodity availability and
cost risks. Independent foodservice distributors, including the largest foodservice
distributor in North America, deliver most items multiple times per week to our
restaurants. We attempt to negotiate short-term and long-term agreements for
our principal commodity, supply and equipment requirements, depending on
market conditions and expected demand.” (CAKE 10-K)
After analyzing the information above, we as a team of analyst have
determined that having multiple suppliers is beneficial because it ensures quality
products. It also prevents a company from putting all of its eggs in one basket.
Having high quality distribution is important because the firms in the industry
can’t sell something if they can’t make it. The Cheesecake Factory also hedges
for better prices by negotiating short and long term contracts with its suppliers.
Differentiation
We believe differentiation is the primary target for the upscale casual
restaurant industry. Specializing in differentiation, companies are able to set
prices for unique characteristics that they have. Differentiation is “supplying a
unique product or service at a cost lower than the price premium customers are
willing to pay.” (Palepu) The ways the industry achieves differentiation are by
having superior product quality, superior product variety, superior customer

37 | P a g e
service, more flexible delivery, quality investment in brand image, investment in
research and development, and control system focus on creativity and
innovation. In the upscale casual restaurant industry, we believe it’s important to
achieve product quality, customer service, and a brand image.
Superior Product Quality
Customers in the upscale casual restaurant industry pay the extra cost for
the high quality food. A superior product makes people not only remember the
company but also makes them want to return for more.
“As of February 27, 2014, we operated 181 Company-owned upscale,
casual, full-service dining restaurants.” (Cheesecake 10-k) The Cheesecake
Factory also prepares their menu items fresh from scratch daily, use all natural
chicken with no hormones, and premium beef that is Certified Angus, U.S.D.A.
(Cheesecake Investors)
Most chains in this industry have a lot of restaurants. We think it is
important that a guest can have a good quality meal in Texas and then goes to
California and have the same meal. The quality of the inputs should be equally
superior at all locations. In this upscale industry it only takes one mess up to lose
a customer, and providing superior quality products at all locations will prevent
this from happening. This will create a brand image and keep loyal customers
returning.
Superior Customer Service
When customers pay extra for a quality product they expect the service as
well. Service in the upscale casual industry is to be superior to the rest.
“Commitment to excellent service and hospitality through the selection, training

38 | P a g e
and retention of high quality staff members. Our mission is to create an
environment where absolute guest satisfaction is our highest priority. We strive
to consistently exceed the expectations of our guests in all aspects of their
experience in our restaurants and with our bakery products.” (Cheesecake 10-K)
As a team of analysts we think providing superior customer quality service
is one of the most critical factors in achieving a competitive advantage.
Employees must be experienced and knowledgeable in order to exceed guest
expectations. Also, employees need to dress professionally. Attire helps set the
more upscale atmosphere. Overall, employees should focus on doing whatever
necessary to have customers leave with the feeling of satisfaction.
Investment in Brand Image
Achieving a good brand image is necessary to gain people’s trust.
Whenever people talk about a company they should only say positive things by
the experiences they have had in the past. Having superior quality products and
superior quality customer service at one location is just as important as having
those at every other location. This comforts people in knowing that you’re going
to get the quality service you pay for everywhere you go and not just a specific
location.
“Our restaurants’ distinctive contemporary design and décor create a high
energy, non-chain image and upscale ambiance in a casual setting… We apply
high standards to the maintenance of our restaurants to keep them in “like new”
condition.”(Cheesecake 10-K)
The feeling you get whenever you go to a restaurant chain should be
unique to others. Having a clean and “like new” feeling impresses customers and
leads to improved customer satisfaction that leads to people talking about a
company which increases overall traffic.
39 | P a g e
Conclusion
Overall, in this upscale casual restaurant industry we think it’s important
to target differentiation with some cost control. This allows the companies to
develop superior business strategies that add value to their respective company
and help themselves stand out to competitors. All of these key success factors
assist the companies in gaining a competitive advantage over competition and
most importantly to increase shareholder’s wealth.
Firm Competitive Advantage Analysis
Superior Product Variety
At first glance, the Cheesecake Factory’s menu can be slightly
intimidating. It features over 200 items to choose from and a variety of food
types. Considering that you can get anything from a steak, to pasta, it seems to
us that the Cheesecake Factory is a great compromise to take a family that can’t
decide on a place to eat. The Cheesecake Factory’s menu serves pizzas, burgers,
sandwiches, pastas, seafood, steaks, and salads. Recently the Cheesecake
factory came out with their “Skinnylicious Menu”. It contains over 40 meals and 5
drinks that are healthier alternatives to the other options. The Cheesecake
Factory also features a diverse desert menu with over 50 different types of
cheesecakes. In addition to their food, the Cheesecake Factory has an abundant
drink menu featuring specialty drinks, cocktails, mojitos, margaritas, martinis,
and an impressive beer and wine selection. Their beer selection varies depending
on the location so they can offer local brews as well as the national know beers.

40 | P a g e
They offer wines from California, Washington, Europe, South America, and
Australia ranging from $7.95-$12.95 per glass. The selection of food and drink
show us that The Cheesecake Factory utilizes product differentiation as a major
value driver. In order to separate themselves in the industry they must use
product differentiation to maintain business.
Superior Product Quality
In our opinion, the fact that the cheesecake factory makes all of their
meals from scratch daily gives them a huge advantage over some of their other
competitor chains. They will also cater to every one of the diner’s needs. “We will
gladly honor requests to modify your order to suit specific health or dietary
needs” (Cheesecake Investors). The Cheesecake Factory also sells their famous
cheesecakes to other restaurants. To guarantee their superior food quality, the
Cheesecake Factory claims to use only the highest quality ingredients to produce
the best product. We believe that this product quality is leaps and bounds
beyond their industry competitors. The flexibility The Cheesecake Factory has
with its products and customer service represent a superior product quality,
another value driver for the company. In order to compete in the industry the
company must maintain this level of quality to pull business from the
competition.
Locations and Future Growth
The Cheesecake Factory has become an international brand name.
Cheesecake Factory has 169 locations in the United States including Puerto Rico.
In 2012, the Cheesecake Factory expanded its international boarders to the
United Arab Emirates, opening in the Dubai Mall, and in 2013, another location

41 | P a g e
opened in the Mall of the Emirates. The Cheesecake Factory also came out with
2 different restaurants, the Grand Lux Café and Rocksugar Pan Asian Kitchen.
The Grand Lux Café, which serves American, European, Thai, and Caribbean
cuisine, has 11 locations featured in the United States. The Cheesecake Factory
opened the Rocksugar Pan Asian Kitchen in 2008 with their only location in Los
Angeles. By the end of 2014, the Cheesecake Factory plans to open several more
locations in the U.S. and plans to have 3-5 locations in the Middle East
(thecheesecakefactory.com). We believe that with the amount of locations, both
nationally and abroad, and the plan for future growth gives the Cheesecake
Factory staying power. The way The Cheesecake Factory grows is by building
new restaurants. By showing us that they are aggressively expanding, not only in
the US, but in foreign countries as well, we see that The Cheesecake Factory
plans to stay competitive with its growth.
Strengthening Brand Image
The Cheesecake Factory’s community involvement and charitable giving’s
have helped strengthen the Cheesecake Factory’s brand name. They are involved
with several charities including: Feeding America, The Salvation Army, City of
Hope, and The Harvest Food Donation Program. On Thanksgiving Day, the
Cheesecake Factory’s staff members volunteer at their local Salvation Army.
They “prepare and serve an elaborate “Cheesecake Factory” traditional holiday

42 | P a g e
meal to thousands of disadvantaged individuals and families at Salvation Army
Community Centers across the country” (thecheesecakefactory.com). For City of
Hope, they host an annual golf tournament and auction fundraiser. Together
with their vendor partners, they have donated more than $2.1 million to City of
Hope. Through the Harvest Program, they donate all of their surplus food to local
soup kitchens, shelters, and after-school programs. Through this program, they
have donated more than 500,000 pounds of food each year. In addition to these
charities, they also contribute through their very own “Give back” Foundation
Team Sponsorship by getting involved with local communities and non-profit
organizations. In our opinion, all of their charitable donations and community
service have helped to improve their brand name. Now people don’t just like the
Cheesecake Factory for their cheesecakes, but they also like the fact that they
are getting involved in their community. This shows us that the Cheesecake
Factory isn’t only concerned with what’s going on inside their restaurant walls
and are focused on improving brand recognition nation-wide.
Accounting Analysis
After analyzing the business strategies, we’ve determined the key value
drivers, risks, and potential industry profitability by using Porters Five Forces
Analysis. We then used qualitative measures to determine whether a firm is able
to sustain a competitive advantage. Now, we will perform step three of analyzing
corporate financial statements, an accounting analysis. “Accounting analysis
evaluates accounting quality by assessing accounting policies and
estimates”…”The purpose of accounting analysis is to evaluate the degree to
which a firm’s accounting captures its underlying business economics.”(palepu)
We have performed an accounting analysis to potentially discover any
distortion and biased information in the financial statements. Distortion is caused
43 | P a g e
by the flexibility allowed to a firm’s management from the Generally Accepted
Accounting Principles. Management is given flexibility so they can show the
financial position of the firm. However, they can often be inclined to manipulate
and forecast their financials to benefit them personally. They could have a lot of
stock in the company, quarterly targets to hit, and questionable job security. It is
our job to undo any biased opinions or distortion.
In order to undo distortion and biased opinions from management we will
perform an accounting analysis that consists of 6 steps. First, we have to identify
the accounting policies. This involves the analyst identifying and analyzing the
firm’s policies and estimations. Next, we will assess the degree of flexibility given
to a firm. When management does the firm’s financials they have to make
estimations. They also might be inclined to make biased decisions for their
personal benefit. The third step is to evaluate the accounting strategy.
Evaluating the accounting strategy looks for possible causes of distortion and
biased opinion. The fourth step is to determine the degree of disclosure. If
management doesn’t disclose all the necessary information and make it easily
assessable, it can have a negative impact on the quality of the firms accounting.
This would lead to the firm presenting skewed information to potential investors
and stockholders giving them a misleading idea of what’s going on internally.
The fifth step of the analysis is to identify potential red flags. We will look for any
information presented that could point to any questionable accounting. Finally,
the last step of the analysis is to undo any accounting distortion by restating the
firm’s financials to eliminate any distortions in the financials.

44 | P a g e
Key Accounting Policies
After analyzing the firms within the industry, we have determined the key
accounting policies by focusing on success factors that will provide the company
with a competitive advantage. If key accounting policies can’t be linked to
success factors, it will possibly signal a red flag thus needing to be further
analyzed. The key accounting policies are important because estimations and
forecasting have to be done whenever the financials are created. There are two
types of accounting policies. Type I accounting policies can be directly linked to
the key success factors. In the upscale casual industry we believe economies of
scale, superior customer service, and superior product quality are critical
accounting policies. Type II accounting policies are policies that can potentially
distort our view of the financial position of the company. We feel capital vs.
operating leases, disclosure, and assumptions are the main type II policies.
Type I Accounting Policies
Type I accounting policies can be directly or indirectly related to the key
success factors of a firm. In the upscale casual restaurant industry we have
identified 3 main policies that are economies of scale, superior customer service,
and superior product quality.
Economies of Scale
Economies of scale play an important role in cost leadership. Economies of
scale can be achieved from lowering the fixed cost per unit by increasing output
or production. An idea is to grow a company’s locations. This will lead to larger
purchases from a company’s suppliers. With larger purchases a company can
negotiate short and long term contracts to hedge prices. The Cheesecake Factory

45 | P a g e
has many suppliers and hedges their prices by using contracts. In the
Cheesecake Factory’s 10K, it states how they use short term and long term
contracts for their main commodities. This enables them to get their inputs at a
lower cost and also ensures quality products.
The Cheesecake Factory also maximized economies of scale by using
vertical integration. “Vertical integration of this vital part of our brand gives us
control over the creativity and quality of our desserts and is also more profitable
than buying from a third party.” The Cheesecake Factory has a bakery in
California and North Carolina. We believe by being able to hedge input prices and
produce their own goods allows them to take advantage of economies of scale.
Fiscal Year
2009 2010 2011 2012 2013
Average sales per productive
square foot 830 850 885 887 913
By looking at the table above, we as a group of analysts have concluded
that The Cheesecake Factory is achieving economies of scale by increasing
average sales per square foot. The Cheesecake Factory targets total costs of
about $700-$800 per square foot. We believe by closing non-profitable locations,
increasing menu prices by 1-2% every year, and hedging input costs by
negotiating short and long term contracts have all attributed to increasing their
profits.
On May 19, 2014, The Cheesecake Factory Incorporated announced that
it was entering into an exclusive licensing agreement with an operator in Asia.
This agreement would provide for a minimum of 14 restaurants over the next 10

46 | P a g e
years in various countries. The first restaurant is expected to open sometime in
their fiscal year 2015. (investors.cheesecake.com) CAKE is showing future
expansion growth as well in the present. They’ve increase capital investment
about 38.5% since fiscal year 2011.
Fiscal
Year
2011 2012 2013
Additions to property
and equipment
-
76,746.00
-
86,442.00
-
106,289.00
Superior Customer Service
In the upscale casual restaurant industry, we believe superior customer
service and hospitality is extremely vital to success. Customers pay top dollar for
a meal and it is imperative that they are treated as so. In the Cheesecake
Factory 10-K it states “Our recruitment, selection, training and retention
programs are among the most comprehensive in the restaurant industry,
enabling us to attract and retain qualified staff members who are motivated to
consistently provide excellence in guest hospitality. This tells us they put a strong
emphasis on hiring good employees, training them to serve professionally,
focusing on customer retention, and offering customers a superior experience to
make guests return.

47 | P a g e
Superior Product Quality
Superior product quality is extremely important because customers go to a
upscale casual restaurant for the quality of the product and the experience. If
the quality of the product is sub-par then the customer is unlikely to return
because they will feel like they didn’t get their money’s worth. The Cheesecake
Factory makes their products handmade fresh daily using high quality products
and fresh ingredients using innovative and proprietary recipes. (CAKE 10k)
When analyzing information given within the 10k of a company, we can
determine the firm’s financial position among other things. Managers should
present both good and bad information that could help make a decision in the
company’s financial standing. However, what is presented might not be very
transparent. Good disclosure is when information represented in a firms
financials, estimations, and business activities are transparent. Financial
statements can also be misleading due to the amount of flexibility given to a
firm’s management by GAAP. Flexibility allows for estimations to be included and
also allows for management to manipulate certain things to portray a better
financial statement than they currently are in.
Fiscal Year
2009 2010 2011 2012 2013
Intangible assets, net N/A 14,482 14,674 17,829 18,647
Total Assets N/A 1,037,307 1,022,570 1,092,167 1,124,114
0.01396 0.01435 0.01632 0.01658
Goodwill isn’t directly stated in the 10k. As a team of analysts we’ve come
to the conclusion that goodwill is included in intangible assets. Intangible assets
are less than 2% and not at the threshold. Other relevant information that helps
investors make decisions such as discount rates and suppliers should give,

48 | P a g e
however, The Cheesecake Factory doesn’t think it’s too important. They aren’t
supplying enough material and transparent information and can prevent analyst
from being able to see the underlying economic value in business activities. This
is why we have decided the Cheesecake Factory has a low quality of disclosure.
Type II Accounting Policies
The Type II accounting policies lead to distortion. Distortion hides or
covers material information and can lead investors to believing a firm is doing
better or worse than it actually is. In the upscale casual restaurant industry we
believe leasing is the most important policy.
Operating Leases
A lease is an agreement between two parties that allows the usage of
land, buildings, property or equipment. There are two primary methods of
recording your lease. The first is a capital lease which recognized the asset and
liability on the balance sheet. The other method is an operating lease. The
operating lease does not claim the rights or ownership on the balance sheet and
just expenses the rent under operating expenses.
“Capital leases are considered equivalent to a purchase, while operating
leases cover the use of an asset for a period of time and are treated by the
lessee as periodic expenses.” (fasab.gov) A capital lease shows transfer of
ownership, rights, and liabilities when the lease is signed for. They are shown on
the balance sheet as an asset under PPE and a liability such as Capital Leasing
Liability. There are four main criteria that constitute a capital lease:
Ownership of Property – The lease will transfer ownership to the
person leasing at or before the ending lease date.
Bargaining Option – The lease allows for purchase of the lease

49 | P a g e
property at a discounted price.
Estimated Economic Life – The leasing term must be equal to or
greater than 75% of the estimated life of the property.
Fair Value – “The present value of rental and other minimum lease
payments, excluding that portion of the payments representing
executory costs, equals or exceeds 90% of the fair value of the
leased property.” (fasab.gov)
If the leasing term is after 75% of the estimated economic life then
the last two do not apply.
Operating leases are the only type of lease used by The Cheesecake
Factory. An operating lease “is an agreement conveying the right to use property
for a limited time in exchange for periodic rental payments.” (fasab.gov) They do
not assume the risk or ownership of PPE nor does it recognize the PPE on the
balance sheet. Rent payments are just expensed as an operating expense on the
income statement. Operating leases have less disclosure. By not having
operating leases on the balance sheet it also doesn’t show any type of A/D or
interest expenses for the capital. This can lead to understating expenses thus
overstating net income and retained earnings.
Conclusion
In conclusion, a firm can look at their key success factors and distortion
and then determine their type I and type II accounting policies. There will always
be estimations and distortion within financial statements due to flexibility. We
were able to identify firms with biased and misleading accounting. Because of
this we are able to look past the distortion and see the true value of the
financials.

50 | P a g e
Assess Degree of Accounting Flexibility
Accounting flexibility is the level at which managers can choose their
company's accounting policies. Accounting flexibility is dependent upon GAAP
and the other standards that financial filings must follow. Highly flexible
companies have more room to account in ways that the managers see fit. This
will generally result in the company looking much better than if the accounting
flexibility were lower. The accounting flexibility of the Cheesecake Factory, as
well as the industry, have been analyzed below by looking at three key business
activities that are affected by the accounting flexibility of the companies. The
two business activities that we have analyzed are Operating vs. Capital Leases
and Goodwill.
Operating vs. Capital Leases
The restaurants that make up this industry have a high amount of
flexibility with the decision to classify their leases as operating or capital leases.
Capital leases show up on the financial reports while operating leases do not.
Capital leases are accounted for as an asset and liability when the contract gets
finalized while operating leases get treated as rent expense to be recorded each
period as it gets paid. The problem with this is that the company makes a large
asset deposit in prepaid rent. Cheesecake Factory records each lease it signs as
an operating lease and the industry as a whole classifies almost all of their leases
as operating leases (CAKE 10-K, Darden 10-K, Brinker 10-K, BJ's 10-K). The high
degree of accounting flexibility that these companies have in their choice of lease
classification results in misstated financials. These misstatements will be
represented in the table below.
51 | P a g e
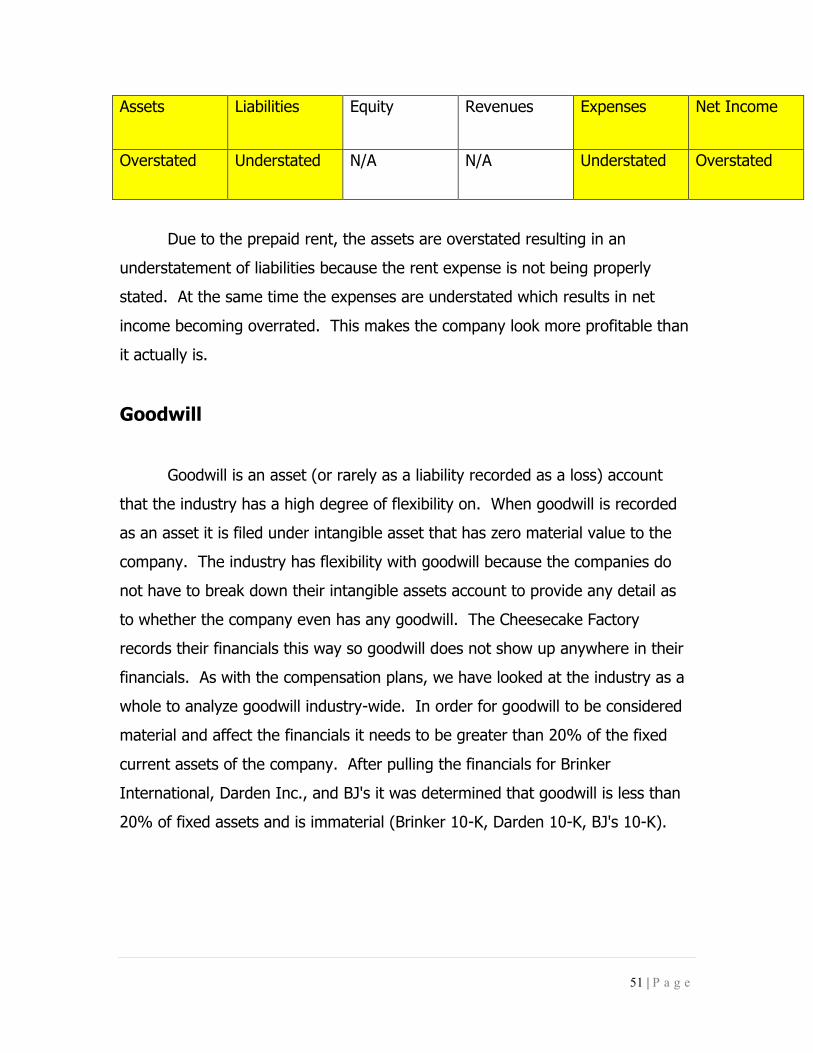
Assets Liabilities Equity Revenues Expenses Net Income
Overstated Understated N/A N/A Understated Overstated
Due to the prepaid rent, the assets are overstated resulting in an
understatement of liabilities because the rent expense is not being properly
stated. At the same time the expenses are understated which results in net
income becoming overrated. This makes the company look more profitable than
it actually is.
Goodwill
Goodwill is an asset (or rarely as a liability recorded as a loss) account
that the industry has a high degree of flexibility on. When goodwill is recorded
as an asset it is filed under intangible asset that has zero material value to the
company. The industry has flexibility with goodwill because the companies do
not have to break down their intangible assets account to provide any detail as
to whether the company even has any goodwill. The Cheesecake Factory
records their financials this way so goodwill does not show up anywhere in their
financials. As with the compensation plans, we have looked at the industry as a
whole to analyze goodwill industry-wide. In order for goodwill to be considered
material and affect the financials it needs to be greater than 20% of the fixed
current assets of the company. After pulling the financials for Brinker
International, Darden Inc., and BJ's it was determined that goodwill is less than
20% of fixed assets and is immaterial (Brinker 10-K, Darden 10-K, BJ's 10-K).

52 | P a g e
Conclusion
Almost all of the leases used by the industry are recorded as operating
leases which result in overstated assets and net income on these companies'
financials. Goodwill is also a highly flexible account because the company's don't
have to put it on the statements if they choose not to specify what goes into
intangible assets. The Cheesecake Factory takes advantage of this and only
records the total intangible assets without specifying what exactly makes up the
account. Therefore, after analyzing the upscale dining industry's financials and
accounts that are affected the most by accounting flexibility, we have
determined that the industry has a high degree of accounting flexibility.
Evaluation of Actual Accounting Strategy
As explained earlier, accounting flexibility allows managers of a company
to use strategies and loopholes as a means to communicate or hide the firm’s
current economic situation or performance during a period. By using accounting
flexibility companies can either be aggressive or conservative in their accounting
strategy as a means to distort information in their favor. A firm that employs an
aggressive accounting strategy will overstate its assets and understate its
liabilities in order to increase equity and net income on the balance sheet. In
doing so the firm distorts the financial information in its favor, making it appear
as if the company is better financial position than it may actually be. In contrast,
a firm that employs a conservative accounting strategy will understate its assets
and overstate its liabilities in order to decrease equity and net income on the
balance sheet. This strategy can result in managers using “big bath” accounting
as a means to distort information due to hard economic times or a period of loss
within the company.

53 | P a g e
Being able to identify a firm’s accounting strategy allows us, the financial
analysts, to be able to gain an insight on the firm’s current financial position. Due
to accounting regulations by GAAP, a firm’s financial statements will be fair and
transparent in its presented information. However, companies have the option of
choosing the amount of information to disclose on the financial statements.
Companies with high transparent disclosure present valuable information such as
interest rates used on operating and capital leases. Companies with low
disclosure, such as The Cheesecake Factory, fail to disclose information such as
interest rates and information regarding goodwill. Firms that present the
minimum amount of information required are attempting to conceal information
from investors and the outside public, making the process of valuing a firm more
difficult. Therefore, in order to be fully understanding of a firm’s performance
and value, it is critical to evaluate the accounting strategies used by the firm.
Capital and Operating Leases
In the restaurant industry capital and operating leases play a major role in
financing properties for a firm. As previously stated, The Cheesecake Factory
does not completely own all of its properties and therefore uses operating leases,
“All of our restaurant leases are classified as operating leases” (Cheesecake 10-
K). Similarly, in the industry that we have defined as upscale casual dining, BJ’s
Restaurants Inc., uses all operating leases as well, “All of [their] restaurant
leases are classified as operating leases” (BJ’s 10-K). In contrast to BJ’s and The
Cheesecake Factory, Brinker Intl uses both capital and operating leases “We
lease certain buildings under capital leases…we lease facilities and office space
under operating leases…” (Brinker 10-K) along with Darden Inc., “For operating
leases, we recognize rent expense on a straight line basis….Capital leases are
recorded as an asset…” (Darden 10-K).

54 | P a g e
In terms of disclosure of information with regards to operating leases, The
Cheesecake Factory states in their 10-K that “Minimum base rent, which
generally escalates over the term of the lease, is recorded on a straight-line basis
over the lease term. The initial lease term includes the build-out, or rent holiday,
period for our leases, where no rent payments are typically due under the terms
of the lease. “Contingent rent expense, which is based on a percentage of
revenue, is recorded as incurred to the extent it exceeds minimum base rent per
the lease agreement” (Cheesecake 10-K). Although this explanation is filled with
words that seem to explain their operating leases, it is confusing and misleading
and presents no real relevant information regarding the leases such as the
discount rate used or how long leases are contracted for. As compared to the
industry, The Cheesecake is a low quality, low disclosure company in terms of
presenting operating lease information on the financial statements, with Brinker
Intl., Darden Inc., and BJ’s Restaurants all presenting information in their
financials regarding discount rates and lease length.
The Cheesecake Factory is aggressive in terms of utilizing operating leases
as a means to finance its property in regards to accounting, with 100% of their
leases being operating leases. The upscale casual dining industry as a whole is
aggressive in their accounting strategy in terms of operating leases, with all of
the companies in the industry having above 85% of leases being operating
leases, as shown in the table below.
Operating Lease Capital Lease
The Cheesecake Factory 100.00% 0.00%
BJ's Restaurants Inc. 100.00% 0.00%
Brinker Intl. 87.01% 12.99%
Darden Inc. 92.86% 7.14%
Percentage of Leases by Type 2013

55 | P a g e
Although the disclosure of operating lease financials is low quality in
regards to The Cheesecake Factory Inc., operating lease financials will be
capitalized and disclosed on the restated financials for the firm.
Goodwill
In the defined upscale casual dining industry Goodwill is disclosed in the
financial statements of Brinker Intl., Darden Inc., and BJ’s Restaurants Inc. In
contrast, The Cheesecake Factory presents no information regarding the
disclosure of Goodwill, with “goodwill” appearing a total of zero times in the
company’s 10-K. Due to goodwill not being disclosed at all in the financial
statements, it will not be in the restated financials for the firm.
Research and Development
The Cheesecake Factory Inc. does not present any disclosure in terms of
research and development on the financial statements. The upscale casual dining
industry as a whole fails to provide minimum disclosure in regards to research
and development. Therefore research and development will not be included in
the restated financials as it is irrelevant to valuing the firm and industry as a
whole.
Conclusion
Based upon evaluating the firm’s accounting strategy, we the analysts
have come to the conclusion that The Cheesecake Factory has an aggressive
accounting strategy that is also present in the industry as a whole. Overall, The
Cheesecake Factory does a poor job in disclosing information regarding
operational and capital leases as compared to the industry.

56 | P a g e
This low quality of disclosure can be difficult to investors and the outside
public when determining the overall value of the company. The firm fails to
disclose any information regarding goodwill, in contrast with the other firms in
the industry providing some disclosure, therefore it will also not be used when
restating the financial statements. The industry as a whole fails to provide
minimum financial information regarding research and development. This is due
to the restaurant industry not being a research and development focused
industry. This also applies for The Cheesecake Factory Inc., as there is no
mention of research and development financials in the financial statements. The
low quality of disclosure makes research and development irrelevant in terms of
restating the financial statements.
Qualitative Analysis
It is important to assess the quality of information provided by the
companies 10-K. The greater the quality within Cheesecake Factory’s 10-K the
more the information is provided to potential investors and shareholders.
Managers of the company have the ability to decide the amount of
information to be disclosed in the financial statements, however there are GAAP
requirements that must be met first. Therefore, there is a possibility that public
companies may not choose to share data that could negatively affect their
business. It is up to the reader of the financial statements, such as us, to
interpret the information we are given and to understand the reasoning why
certain information is disclosed clearly or vaguely or not at all.
Cheesecake Factory overall does a poor job of disclosing vital information
to the readers of their 10-K. Interest rates associated with liabilities and leases
are not stated specifically. Also, important information about suppliers is not
provided either. Compared to their competitors, Brinker, BJ’s and Darden, the

57 | P a g e
quality of Cheesecake’s disclosures fail to be at the same level of standard with
the industry. Specific and useful information is throughout each of the three
competitors 10-K. However, there is still areas of the 10-K where the
information is very transparent for us to continue on our valuation of The
Cheesecake Factory.
Superior Product & Service Quality
Cheesecake Factory mentions clearly throughout their 10-K about their
superior product and service quality. The transparency of this disclosed
information is very clear, as data on quality of service and product is repeated
often.
Cheesecake Factory’s 10-K explains the variety of menu items that can be
selected at their restaurants. There is information on the distributors of supplies
as well as the troubling risk of cost fluctuations with certain supplies such as milk
and fish.
There is also disclosed area about the quality of employees and service
provided by Cheesecake Factory. They are proud of their staff e and offer
incentive programs to retain them to keep their financial performance stable.
The disclosure of the superior product and service quality is clearly stated,
which allows others who read their 10-K to identify their key accounting policies.
At the beginning of our evaluation of accounting analysis we have classified
superior service and product quality as type 1 accounting policy.

58 | P a g e
Operating Leases
Cheesecake Factory limits their disclosure about their operating leases.
The only information is that leases are contingent with a percentage of sales. In
the 10-K they choose to give a percentage of from 3 – 10%. This leads to a
problem with restating financial statements. In order for us to restate the
financials we have to calculate estimate that we see fit based on the given
numbers for sales and leases provided in the 10-K.
This lack of information also prevents to see the opportunity cost of choosing to
do a capital lease rather than operating.
Potential Red Flags
While identifying potential red flags for the Cheesecake Factory, it
is important to remember that red flags don’t necessarily mean any fraudulent
activity is going on. Red flags are just identified as part of the firm’s financials
that need to be reviewed and potentially restated. Red flags, in the financial
statements, could include a number of things from asset write-offs, to fourth
quarter adjustments, as well as special purpose entities. In any case, these are
identified as red flags because they are not very well understood or unusual, no
matter if they appear to be good or bad. This is vital to analyzing the company
because once a red flag is found, the distorted balances must be restated to
disclose as much information to the investors as possible. As far as the
Cheesecake Factory’s financial statements, there was one red flag that was
raised pretty quickly.

59 | P a g e
Operating Leases
An operating lease is a short-term, cancelable lease. It is a type of
lease in which the contract period is shorter than the life of the property or
equipment, and the lessor pays all maintenance and servicing costs. As it states
in the Cheesecake Factory’s 10-K, “We lease all of our restaurant locations under
operating leases”. The Cheesecake Factory legally treats all of their leases as
operating leases, but it’s still something worth taking a second look at. It’s worth
noting that it is very common for companies in the restaurant industry to mainly
classify their leases as operating leases. The reason we marked this as a red flag
was, by doing this, it is very possible they are reporting inaccurate information.
Since all of the Cheesecake Factory’s leases are classified by them as operating
leases, the Cheesecake Factory has been overstating their assets. In addition to
this, there is also great lack of information about the leases that are disclosed by
the Cheesecake Factory. They neglect to disclose information regarding the
operating lease rate. So we were left to improvise with our own operating lease
rate. To get this, we divided total lease expenses by total sales because in
Cheesecake Factory’s 10k, they stated that to get their discount rate they use a
percentage of sales ranging from 3%-10%. Every time we computed this, it
came out to approximately 7%. The lack of information also prevents us from
calculating the opportunity cost of choosing operating over capital leasing. In
closing, since the Cheesecake Factory classified all of their leases as operating
leases to overstate assets, it will be necessary to restate their financials in order
to clarify the information for investors.

60 | P a g e
Accounting Distortions
After analyzing red flags and looking closely at the financials we
determined that the only distortion on the financials for The Cheesecake Factory
is operating leases. Operating leases need to be capitalized otherwise assets
and net income will be overstated. Below is a table that shows the as stated
total assets, total liabilities, and adjustment and then the restated accounts after
capitalizing the operating leases.
Restatement table (In thousands) (All information from CAKE 10-K)
Years Rate As stated
Assets
As stated
Liabilities
Capitalization
adjustment
Restated
Assets
Restated
Liabilities
2008 6.55% 1,142,630 690,064 244,318 1,386,948 934,382
2009 6.64% 1,046,751 530,638 266,193 1,312,944 796,831
2010 6.45% 1,028,397 436,060 281,051 1,309,448 717,111
2011 6.36% 1,022,570 479,817 287,475 1,310,045 767,292
2012 6.45% 1,092,167 512,441 295,899 1,388,066 808,340
2013 6.37% 1,124,114 546,761 307,645 1,431,759 854,406
The restatement shows that the assets and liabilities increase by
the capitalization of the leases. This adjustment corrects the overstatement of
the assets that was created by filing the leases as an operating lease. Below we
will show the as stated and restated balance sheets along with the depreciation
table (All numbers presented in thousands).

61 | P a g e
CHEESECAKE FACTORY INC
10-K
Balance Sheet
dr cr
ASSETS
Current assets:
Cash and cash equivalents
Investments and marketable securities
Accounts receivable
Income tax receivable
Other receivables
Inventories
Prepaid expenses
Deferred income taxes
Total current assets
Property and equipment, net
OL Cap. Rights 244,318 244,318
Other assets:
Marketable securities
Trademarks
Prepaid rent
Other
Total other assets
Total assets
LIABILITIES AND STOCKHOLDERS EQUITY
Current liabilities:
Accounts payable
Income taxes payable
Other accrued expenses
Total current liabilities
Deferred income taxes
Deferred rent
Deemed landlord financing liability
Long-term debt
Other noncurrent liabilities
OL Cap. Liabilities 244,318 244,318
Total Liabilities 690,064.00 934,382
Commitments and contingencies
Stockholders equity:
Preferred stock, $.01 par value, 5,000,000
shares authorized; none issued
Junior participating cumulative preferred
stock, $.01 par value, 150,000 shares authorized;
none issued
Common stock, $.01 par value, 250,000,000
shares authorized; 82,846,857 and 82,660,209
shares issued at December 30, 2008 and January 1,
2008, respectively
Additional paid-in capital
Retained earnings
Accumulated other comprehensive loss
Treasury stock 23,100,079 and 13,508,424
shares at cost at December 30, 2008 and January 1,
2008, respectively
Total stockholders equity
Total liabilities and stockholders equity
(506,208)
58,323
4,177
$37,875
$1,142,630
(506,208)
57,286
54,887
275,000
29,422
As stated
December 30, 2008
Restated
$80,365
996
12,537
12,713
32,821
23,132
December 30, 2008
12,713
12,537
996
$80,365
23,132
32,821
24,654
3,001
190,219
860,489
58,323
370,919
828
30,013
(9,684)
596,711
24,654
860,489
190,219
3,001
$1,142,630
452,566
4,177
91,922
$1,386,948
$37,875
147,958
185,833
87,045
828
370,919
596,711
452,566
91,922
87,045
185,833
147,958
275,000
54,887
57,286
$1,386,948
29,422
30,013
(9,684)

62 | P a g e
CHEESECAKE FACTORY INC
10-K
Balance Sheet
dr cr
ASSETS
Current assets:
Cash and cash equivalents
Investments and marketable securities
Accounts receivable
Income tax receivable
Other receivables
Inventories
Prepaid expenses
Deferred income taxes
Total current assets
Property and equipment, net
OL Cap. Rights 266,193 266,193
Other assets:
Trademarks
Prepaid rent
Other
Total other assets
Total assets
LIABILITIES AND STOCKHOLDERS EQUITY
Current liabilities:
Accounts payable
Other accrued expenses
Total current liabilities
Deferred income taxes
Deferred rent
Deemed landlord financing liability
Long-term debt
OL Cap. Liabilities 266,193 266,193
Other noncurrent liabilities
Total Liabilities 530,638 796,831
Commitments and contingencies
Stockholders equity:
Preferred stock, $.01 par value, 5,000,000
shares authorized; none issued
Junior participating cumulative preferred
stock, $.01 par value, 150,000 shares authorized;
none issued
Common stock, $.01 par value, 250,000,000
shares authorized; 83,377,092 and 82,846,857
shares issued at December 29, 2009 and December 30,
2008, respectively
Additional paid-in capital
Retained earnings
Accumulated other comprehensive loss
Treasury stock 23,100,079 shares at cost
at December 29, 2009 and December 30, 2008
Total stockholders equity
Total liabilities and stockholders equity
22,202
27,871
7,737
172,227
788,402
December 29, 2009
$73,715
11,352
1,875
27,475
834
386,562
$33,948
166,513
200,461
87,048
64,209
4,338
54,243
27,541
86,122
$1,046,751
As Stated Restated
December 29, 2009
$73,715
11,352
1,875
27,475
22,202
27,871
7,737
172,227
788,402
4,338
639,544
(4,619)
(506,208)
516,113
$1,046,751
51,802
100,000
27,118
$1,312,944
100,000
27,118
834
386,562
639,544
166,513
200,461
87,048
64,209
51,802
(4,619)
(506,208)
516,113
54,243
27,541
86,122
$1,312,944
$33,948

63 | P a g e
CHEESECAKE FACTORY INC
10-K
Balance Sheet
dr cr
ASSETS
Current assets:
Cash and cash equivalents
Investments and marketable securities
Accounts receivable
Income tax receivable
Other receivables
Inventories
Prepaid expenses
Deferred income taxes
Total current assets
Property and equipment, net
OL Cap. Rights 266,193 266,193
Other assets:
Trademarks
Prepaid rent
Other
Total other assets
Total assets
LIABILITIES AND STOCKHOLDERS EQUITY
Current liabilities:
Accounts payable
Other accrued expenses
Total current liabilities
Deferred income taxes
Deferred rent
Deemed landlord financing liability
Long-term debt
OL Cap. Liabilities 266,193 266,193
Other noncurrent liabilities
Total Liabilities 530,638 796,831
Commitments and contingencies
Stockholders equity:
Preferred stock, $.01 par value, 5,000,000
shares authorized; none issued
Junior participating cumulative preferred
stock, $.01 par value, 150,000 shares authorized;
none issued
Common stock, $.01 par value, 250,000,000
shares authorized; 83,377,092 and 82,846,857
shares issued at December 29, 2009 and December 30,
2008, respectively
Additional paid-in capital
Retained earnings
Accumulated other comprehensive loss
Treasury stock 23,100,079 shares at cost
at December 29, 2009 and December 30, 2008
Total stockholders equity
Total liabilities and stockholders equity
22,202
27,871
7,737
172,227
788,402
December 29, 2009
$73,715
11,352
1,875
27,475
834
386,562
$33,948
166,513
200,461
87,048
64,209
4,338
54,243
27,541
86,122
$1,046,751
As Stated Restated
December 29, 2009
$73,715
11,352
1,875
27,475
22,202
27,871
7,737
172,227
788,402
4,338
639,544
(4,619)
(506,208)
516,113
$1,046,751
51,802
100,000
27,118
$1,312,944
100,000
27,118
834
386,562
639,544
166,513
200,461
87,048
64,209
51,802
(4,619)
(506,208)
516,113
54,243
27,541
86,122
$1,312,944
$33,948

64 | P a g e
CHEESECAKE FACTORY INC
10-K
Balance Sheet
dr cr
ASSETS
Current assets:
Cash and cash equivalents
Accounts receivable
Income tax receivable
Other receivables
Inventories
Prepaid expenses
Deferred income taxes
Total current assets
Property and equipment, net
OL Cap. Rights 281,051 281,051
Other assets:
Trademarks
Prepaid rent
Other
Total other assets
Total assets
LIABILITIES AND STOCKHOLDERS EQUITY
Current liabilities:
Accounts payable
Other accrued expenses
Total current liabilities
Deferred income taxes
Deferred rent
Deemed landlord financing liability
Long-term debt
Other noncurrent liabilities
Commitments and contingencies
OL Cap. Liabilities 281,051 281,051
Total Liabilities 436,060 717,111
Stockholders equity:
Preferred stock, $.01 par value, 5,000,000
shares authorized; none issued
Junior participating cumulative preferred
stock, $.01 par value, 150,000 shares authorized;
none issued
Common stock, $.01 par value, 250,000,000
shares authorized; 84,912,101 and 83,377,092
shares issued at December 28, 2010 and December 29,
2009, respectively
Additional paid-in capital
Retained earnings
Accumulated other comprehensive loss
Treasury stock 25,204,104 and 23,100,079
shares at cost at December 28, 2010 and December 29,
2009, respectively
Total stockholders equity
Total liabilities and stockholders equity
86,877
31,988
$32,651
170,054
50,391
86,877
As stated
(558,296)
721,257
428,527
$1,028,397
592,337
$1,028,397
67,258
86,918
202,705
849
27,225
51,954
$81,619
December 28, 2010
27,296
3,840
16,184
5,732
28,345
23,036
4,498
755,468
186,052
Restated
December 28, 2010
$81,619
16,184
3,840
27,296
23,036
28,345
5,732
$1,309,448
67,258
51,954
27,225
849
428,527
$1,309,448
$32,651
170,054
202,705
86,918
186,052
721,257
(558,296)
592,337
755,468
4,498
50,391
31,988

65 | P a g e
CHEESECAKE FACTORY INC
10-K
Balance Sheet
dr cr
ASSETS
Current assets:
Cash and cash equivalents
Accounts receivable
Income tax receivable
Other receivables
Inventories
Prepaid expenses
Deferred income taxes
Total current assets
Property and equipment, net
OL Cap. Rights 287,475 287,475
Other assets:
Intangible assets, net
Prepaid rent
Other
Total other assets
Total assets
LIABILITIES AND STOCKHOLDERS EQUITY
Current liabilities:
Accounts payable
Other accrued expenses
Total current liabilities
Deferred income taxes
Deferred rent
Deemed landlord financing liability
Other noncurrent liabilities
Commitments and contingencies
OL Cap. Liabilities 287,475 287,475
Total Liabilities 479,817 767,292
Stockholders equity:
Preferred stock, $.01 par value, 5,000,000
shares authorized; none issued
Junior participating cumulative preferred
stock, $.01 par value, 150,000 shares authorized;
none issued
Common stock, $.01 par value, 250,000,000
shares authorized; 85,863,313 and 84,912,101
shares issued at January 3, 2012 and December 28,
2010, respectively
Additional paid-in capital
Retained earnings
Treasury stock 31,196,128 and 25,204,104
shares at cost at January 3, 2012 and December 28,
2010, respectively
Total stockholders equity
Total liabilities and stockholders equity
$48,211
14,674
758,503
176,395
87,672
23,508
49,490
187,081
$36,159
$1,022,570
69,742
103,927
$1,022,570
542,753
(730,422)
816,977
455,339
As stated As stated
January 3, 2012
$48,211
11,334
5,472
32,096
28,210
36,498
January 3, 2012
32,096
5,472
11,334
36,498
28,210
14,574
176,395
758,503
14,674
49,490
223,240
859
27,822
55,086
223,240
103,927
69,742
55,086
27,822
23,508
87,672
$1,310,045
$36,159
187,081
14,574
$1,310,045
859
455,339
816,977
(730,422)
542,753

66 | P a g e
CHEESECAKE FACTORY INC
10-K
Balance Sheet
dr cr
ASSETS
Current assets:
Cash and cash equivalents
Accounts receivable
Income tax receivable
Other receivables
Inventories
Prepaid expenses
Deferred income taxes
Total current assets
Property and equipment, net
OL Cap. Rights 295,899 295,899
Other assets:
Intangible assets, net
Prepaid rent
Other
Total other assets
Total assets
LIABILITIES AND STOCKHOLDERS EQUITY
Current liabilities:
Accounts payable
Income tax payable
Other accrued expenses
Total current liabilities
Deferred income taxes
Deferred rent
Deemed landlord financing liability
Other noncurrent liabilities
Commitments and contingencies
OL Cap. Liabilities 295,899 295,899
Total Liabilities 512,441 808,340
Stockholders equity:
Preferred stock, $.01 par value, 5,000,000
shares authorized; none issued
Junior participating cumulative preferred
stock, $.01 par value, 150,000 shares authorized; none
issued
Common stock, $.01 par value, 250,000,000
shares authorized; 87,812,022 and 85,863,313 shares
issued at January 1, 2013 and January 3,
2012, respectively
Additional paid-in capital
Retained earnings
Treasury stock 34,414,222 and 31,196,128
shares at cost at January 1, 2013 and January 3,
2012, respectively
Total stockholders equity
Total liabilities and stockholders equity
76,144
91,852
253,034
January 1, 2013
48,100
14,558
$83,569
15,257
39,887
28,836
17,829
764,418
230,207
97,542
28,920
50,793
204,823
1,213
$1,092,167
579,726
As stated Restated
January 1, 2013
$83,569
14,558
48,100
28,836
39,887
15,257
230,207
764,418
17,829
50,793
28,920
878
36,288
55,123
(831,814)
902,532
508,130
$46,998
$1,092,167
97,542
$1,388,066
$46,998
1,213
204,823
508,130
902,532
(831,814)
579,726
253,034
91,852
76,144
55,123
36,288
$1,388,066
878

67 | P a g e
CHEESECAKE FACTORY INC
10-K
Balance Sheet
dr cr
ASSETS
Current assets:
Cash and cash equivalents
Accounts receivable
Income tax receivable
Other receivables
Inventories
Prepaid expenses
Deferred income taxes
Total current assets
Property and equipment, net
OL Cap. Rights 307,645 307,645
Other assets:
Intangible assets, net
Prepaid rent
Other
Total other assets
Total assets
LIABILITIES AND STOCKHOLDERS EQUITY
Current liabilities:
Accounts payable
Income tax payable
Other accrued expenses
Total current liabilities
Deferred income taxes
Deferred rent
Deemed landlord financing liability
Other noncurrent liabilities
Commitments and contingencies
OL Cap. Liabilities 307,645 307,645
Total Liabilities 546,761 854,406
Stockholders equity:
Preferred stock, $.01 par value, 5,000,000
shares authorized; none issued
Junior participating cumulative preferred
stock, $.01 par value, 150,000 shares authorized; none
issued
Common stock, $.01 par value, 250,000,000
shares authorized; 90,632,325 and 87,812,022
shares issued at December 31, 2013 and January 1,
2013, respectively
Additional paid-in capital
Retained earnings
Treasury stock 38,865,951 and 34,414,222
shares at cost at December 31, 2013 and January 1,
2013, respectively
Total stockholders equity
Total liabilities and stockholders equity
(1,015,473)
989,451
602,469
$35,418
$1,124,114
37,121
102,832
$1,431,759
$35,418
228,829
$1,124,114
577,353
December 31, 2013
55,461
4,529
10,081
$61,751
16,008
42,595
35,478
18,647
795,379
225,903
102,832
37,121
47,064
228,829
As stated Restated
December 31, 2013
$61,751
10,081
4,529
55,461
35,478
42,595
16,008
225,903
795,379
18,647
47,064
906
44,390
66,197
$1,431,759
906
602,469
989,451
(1,015,473)
577,353
264,247
97,237
74,690
66,197
44,390
74,690
97,237
264,247

68 | P a g e
Depreciation Table
Rate: 0.0655
2008 BB Int. Pmt. EB Depreciation
2009 244318.2 16002.84 81575 178746.1 81439.41
2010 178746.1 11707.87 92041 98412.95 81439.41
2011 98412.95 6446.048 104859 0 81439.41
Rate: 0.0664
2009 BB Int. Pmt. EB Depreciation
2010 266193 17675.22 92041 191827.2 88731.00
2011 191827.2 12737.33 104859 99705.55 88731.00
2012 99705.55 6620.449 106326 0 88731.00
Rate: 0.0645
2010 BB Int. Pmt. EB Depreciation
2011 281051.5 18127.82 104859 194320.3 93683.82
2012 194320.3 12533.66 106326 100527.9 93683.82
2013 100527.9 6484.053 107012 0 93683.82
Rate: 0.0636
2011 BB Int. Pmt. EB Depreciation
2012 287475 18283.41 106326 199432.5 95825.02
2013 199432.5 12683.9 107012 105104.4 95825.02
2014 105104.4 6684.637 111789 0 95825.02
Rate: 0.0645
2012 BB Int. Pmt. EB Depreciation
2013 295899.2 19085.5 107012 207972.7 98633.07
2014 207972.7 13414.24 111789 109597.9 98633.07
2015 109597.9 7069.067 116667 0 98633.07
Rate: 0.0637
2013 BB Int. Pmt. EB Depreciation
2014 307644.8 19596.97 111789 215452.8 102548.26
2015 215452.8 13724.34 116667 112510.1 102548.26
2016 112510.1 7166.894 119677 0 102548.26

69 | P a g e
The balance sheets show further what we saw with the restatement table.
The assets are overstated due to the lump sum of prepaid rent. After
capitalization of the operating leases we show an increase in assets and liabilities
by $244,318, $266,193, $281,051, $287,475, $295,899, and $307,844 (In
thousands). This is a very large increase in both accounts that would have
otherwise not been recognized if there was not capitalization of the leases. This
restatement changes our view of the company pretty substantially because the
lack of disclosure on top of the massive capitalization expenditures was eye-
opening. Fortunately, this was the only distortion on the financials.
Financial Analysis
Liquidity Ratios
Liquidity is the measure of how quickly assets can be turned into cash.
On the balance sheet the accounts are put in order of liquidity starting with cash.
The ratios we have analyzed for the liquidity of The Cheesecake Factory and the
industry are the current ratio, quick ratio, inventory turnover, inventory days,
accounts receivable turnover, accounts receivable days, cash to cash ratio, and
the working capital turnover. We analyze the liquidity of a company to see how
easily a company can pay its bills. Unhealthy liquidity ratios can be a signal of an
inability to pay debt and means a higher risk for investors and possibly
bankruptcy for the company.

70 | P a g e
Current Ratio
The current ratio is derived from dividing the firm’s current assets by the
current liabilities. This ratio tells how easily a company can pay off its short term
debt with its short term assets. When analyzing the current ratio we look for a
number above 1.0 as that shows that for every $1 of debt the company has $1
of assets to cover the debt with. Anything below 1.0 indicates an unhealthy
current ratio and the company should attempt to raise the ratio by utilizing less
short term debt or increasing highly liquid assets such as cash and receivables.
The table below shows that The Cheesecake Factory and the industry as a whole
has a very unhealthy current ratio. The industry is starting to move towards a
yearly current ratio of around 0.65 which indicates for every dollar of short term
debt the industry has $0.65 to pay it off with. It is likely that the low current
ratio is a result of very low receivables for the industry which we will look into
more detail when we analyze the accounts receivable turnover and days ratios.
The industry also has a large majority of the assets wrapped up in PPE because
the industry grows through opening new restaurants and PPE is not considered a
current asset.
Date 2008 2009 2010 2011 2012 2013
CAKE 1.02 0.86 0.92 0.79 0.91 0.85
Brinker 0.87 0.90 1.11 0.55 0.49 0.51
Darden 0.41 0.51 0.54 0.55 0.43 0.54
BJ’s 0.65 1.11 1.29 1.17 0.91 0.77

71 | P a g e
Quick Ratio
The quick ratio is an even better determinant of the liquidity of a company
than the current ratio because it does not include inventory in the calculation.
We derive the quick ratio by subtracting inventory from current assets and then
dividing by current liabilities. Even though inventory is taken from the ratio we
still want to see a ratio of 1.0. From the table below we see that the industry is
still quite low and relatively unhealthy for the quick ratio. This is also likely
attributed to very low receivables across the industry which we will look into in
more detail with the accounts receivable turnover and days ratios. The overall
poor performance with the current ratio set up the quick ratio for poor results for
all the same reasons as what went wrong with the current ratio. The industry
performed better than expected, however, because inventory is not a major
portion of the assets. Even though CAKE exceeded our expectations the average
quick ratio is .72 which means they can only pay off $0.72 for every dollar of
0
0.2
0.4
0.6
0.8
1
1.2
1.4
2008 2009 2010 2011 2012 2013
CAKE
BJ's
Brinker
Darden

72 | P a g e
current debt. This still signals an unhealthy ratio that could mean CAKE cannot
pay off its debt and would be a more risky investment.
Date 2008 2009 2010 2011 2012 2013
CAKE 0.90 0.75 0.80 0.66 0.80 0.72
Brinker 0.8 0.81 1.05 0.48 0.43 0.45
Darden 0.22 0.28 0.36 0.30 0.20 0.29
BJ’s 0.58 1.05 1.22 1.09 0.84 0.69
Inventory Turnover
Inventory turnover shows how many times per year inventory is replaced
and is derived by dividing net sales by inventory. When analyzing inventory
turnover a higher inventory turnover ratio is much better than a lower turnover
number because it indicated a good rate of sales due to inventory needing to be
0
0.2
0.4
0.6
0.8
1
1.2
1.4
2008 2009 2010 2011 2012 2013
CAKE
Brinker
Darden
BJ's

73 | P a g e
replaced more often. Here we see where the industry really shines. Every
company in the industry except for Darden has a very high inventory turnover
rate. This can be attributed to two different causes. The first is very high sales
resulting in a need to replace inventory often. The second is that the inventory
of the industry is made up primarily of perishable goods, therefore the
companies in the industry must replace inventory more often.
The companies in the industry generally buy smaller amounts of inventory
and restock at a much higher rate because the goods are perishable and the
companies do not want to waste money on inventory for it to perish. This is a
case of “less is more” in that buying a smaller inventory and selling the great
majority of it is better than buying a large number of inventory and not selling all
of it resulting in wasted money and wasted inventory. The industry is clearly
segmented with Brinker and BJ’s turning over inventory over 100 times a period,
CAKE in the middle turning over on average about 65 times per period, and
Darden only turning over about 28 times per period. The segmentation can
show the front runners in the industry compared to the companies that are
beginning to lag behind because a larger inventory turnover can mean a larger
volume of sales. Volume of sales is not the only indicator of high turnover
though because, as stated above, the lesser companies can be simply buying
larger portions of inventory and needing to restock less than the front runners
who could be buying smaller portions of inventory and turning over more often
to restock.
Date 2008 2009 2010 2011 2012 2013
CAKE 69.26 72.16 72.04 62.30 62.73 52.93
Brinker 119.72 87.51 104.87 105.87 108.38 112.34
Darden 30.58 29.22 32.22 24.99 19.79 23.96
BJ’s 103.74 106.84 118.87 104.13 116.87 104.28

74 | P a g e
Inventory Days
Inventory days outstanding is directly related to inventory turnover and is
derived by taking the number of days in the period and dividing that number by
inventory turnover. The period for the industry is 365. Inventory days
outstanding is another way to look at how many times inventory is replaced per
period because it shows how many days it takes on average for a company to
replace inventory. When analyzing inventory days outstanding we are looking
for a low number and are comparing to the industry. As with inventory turnover
the industry performs very well with inventory days outstanding. The numbers
across the industry are very low with the exception of Darden. The Cheesecake
Factory performs very well, replacing their inventory about once every week.
This number can be attributed to the same causes that affected inventory
turnover, Perishable inventory and high sales volume. Looking at inventory days
outstanding we noticed the industry segmentation closed up drastically between
0
20
40
60
80
100
120
140
2008 2009 2010 2011 2012 2013
CAKE
Brinker
Darden
BJ's

75 | P a g e
0
2
4
6
8
10
12
14
16
18
20
2008 2009 2010 2011 2012 2013
CAKE
Brinker
Darden
BJ's
CAKE and the two frontrunners from inventory turnover. This tells us that CAKE
utilizes similar inventory practices with Brinker and BJ’s because CAKE’s inventory
is only outstanding for about 2-3 more days than theirs. The decrease in
segmentation between days outstanding and inventory turnover showed that
CAKE was still with the frontrunners of the industry and was not just middle of
the pack.
Date 2008 2009 2010 2011 2012 2013
CAKE 5.26 5.06 5.07 5.86 5.82 6.90
Brinker 3.05 4.17 3.48 3.45 3.37 3.25
Darden 11.94 12.49 11.33 14.60 18.44 15.23
BJ’s 3.52 3.42 3.07 3.51 3.12 3.50

76 | P a g e
Accounts Receivable Turnover
Accounts receivable turnover is very similar to inventory turnover and is
derived by dividing net sales by accounts receivable. As with inventory turnover
this ratio shows how many times per period accounts receivables are collected.
When analyzing accounts receivable turnover, we are looking for a higher
number and are comparing CAKE to the rest of the industry. In the table and
graph below we see that the industry as a whole has relatively high turnover for
receivables. The Cheesecake Factory leads the industry in this category, but is
not too far ahead of the industry. The reason the industry has large accounts
receivable turnover rates are because the industry requires the vast majority of
the revenues to be paid for on the spot which results in a very low number of
receivables. The majority of those receivables are included in gift cards which
are generally used within a week or two which attributes to the high turnover as
well. Because the industry does not have much in the way of accounts
receivable and it is such a small amount of total assets this metric does not hold
much weight in the valuation of The Cheesecake Factory, however, the numbers
for the turnover are very encouraging and show that CAKE does not allow
receivables to stay outstanding for very long.
Date 2008 2009 2010 2011 2012 2013
CAKE 128.13 141.12 102.53 155.08 124.26 186.28
Brinker 80.97 64.89 62.11 62.77 63.35 73.11
Darden 95.35 194.54 119.75 114.68 112.03 100.14
BJ’s 37.10 32.34 51.18 42.71 37.42 60.67

77 | P a g e
Accounts Receivable Days
Like with inventory days, accounts receivable days shows how many days
the receivables are generally outstanding before being collected. It is derived
from taking the number of days in the period (365 for the industry) and dividing
by the accounts receivable turnover. When analyzing accounts receivable days
outstanding a lower number is more desirable and we will also be comparing
CAKE to the industry. Since accounts receivable days is directly related to
inventory turnover it is no surprise that the Cheesecake Factory leads the way in
this category as well. They only have their receivables outstanding for about 2.5
days at a time which is a very fast rate of collecting receivables. The almost
immediate collection of receivables shows that the receivables for The
Cheesecake Factory are very liquid in that they are turned to cash in about 2-3
days. As stated above, this low accounts receivable days outstanding rate is
0
50
100
150
200
250
2008 2009 2010 2011 2012 2013
CAKE
Brinker
Darden
BJ's

78 | P a g e
caused by a lack of sales that go on credit and a quick gift card turnover which is
the main component of accounts receivable.
Date 2008 2009 2010 2011 2012 2013
CAKE 2.85 2.59 3.56 2.35 2.94 1.96
Brinker 4.51 5.63 5.88 5.82 5.76 4.99
Darden 3.83 1.88 3.05 3.18 3.26 3.84
BJ’s 9.84 11.29 7.13 8.55 9.75 6.02
Cash to Cash
The cash to cash cycle shows how quickly a company can turn its
resources into cash through sales. A smaller number is more desirable but we
are also comparing The Cheesecake Factory to the rest of the industry. The
industry as a whole stays on a relatively same level with only Darden being the
major outlier. The industry performs well too with only about 9 days between
0
2
4
6
8
10
12
2008 2009 2010 2011 2012 2013
CAKE
Brinker
Darden
BJ's

79 | P a g e
obtaining a resource and turning it into cash and that number of days is trending
down as well showing a healthy trend. This ratio is a great tool to determine
liquidity as it relates to all resources instead of just how quickly specific items are
turned into cash. The low rates of just about 9 days for the Cheesecake Factory
show that the company is quick about turning resources to cash and is also not
very far off from the rest of the industry. This quick turnover relates to the
strategies discussed in the inventory turnover and the accounts receivable
turnover. Quick turnover of inventory and low amounts of accounts receivable
allow for a quick cash turnover of resources.
Date 2008 2009 2010 2011 2012 2013
CAKE 8.10 7.64 8.63 8.21 8.76 8.86
Brinker 7.56 9.80 9.36 9.26 9.13 8.24
Darden 15.76 14.37 14.38 17.79 21.70 18.88
BJ’s 13.36 14.70 10.20 12.05 12.88 9.52
0
5
10
15
20
25
2008 2009 2010 2011 2012 2013
CAKE
Brinker
Darden
BJ's

80 | P a g e
Working Capital Turnover
Working capital turnover shows how effectively the company uses its
working capital to create sales. This is another ratio that does not have a
specific number we want to see and are using this number as a comparison to
the rest of the industry, but generally higher is better. Unfortunately the entire
industry suffers from very low working capital turnover. This is likely attributed
to the fact that there is a low amount of current assets throughout the industry
which creates negative working capital and combined with the high volume of
sales creates large, negative working capital turnover. What this tells us is that
current assets and liabilities are not used effectively in turning in sales. The
companies in the industry use a large amount of non current assets and liabilities
to create wealth in the companies. In terms of liquidity there is not much to be
said of the working capital turnover ratio other than it provides very little value
for the companies in the industry.
Date 2008 2009 2010 2011 2012 2013
CAKE 366.26 -56.74 -99.65 -37.52 -79.25 -48.98
Brinker -59.82 -80.99 54.77 -14.58 -13.50 -14.44
Darden -9.92 -13.33 -11.92 -13.74 -7.87 -13.13
BJ’s -19.07 56.47 27.57 48.39 -99.50 -36.39

81 | P a g e
Conclusion
After analyzing the liquidity ratios of The Cheesecake Factory and the
industry we see that generally the industry suffers from very unhealthy ratios,
with the only healthy ratios being inventory and receivables turnover and days.
The other ratios are very low and that shows a higher level of risk for the
companies in the industry and investors. The industry as a whole needs to
utilize more current assets instead of relying on equity and non-current assets to
provide the majority of the value in the companies. An increase in receivable
acceptance and resource management can assist in getting the current assets up
and ultimately increasing the liquidity of the industry.
-200
-100
0
100
200
300
400
CAKE
Brinker
Darden
BJ's

82 | P a g e
Profitability Ratios
The profitability ratios show how well a company retains revenues after
deducting expenses starting with gross profit and going all the way to net
income. As with the liquidity ratios we want to mainly compare to the industry
but generally higher will be better with these ratios. We will be analyzing the
sales growth, gross profit margin, operating profit margin, net profit margin,
asset turnover, return on assets, and return on equity.
Sales Growth
The sales growth method shows the percent increase in sales from year to
year. It is derived with the following equation: (New sales-Prior year sales)/Prior
year sales. The higher the growth the better because it shows a larger increase
in sales from year to year, but we will be focusing primarily on comparing The
Cheesecake Factory to the industry and seeing where the company stacks up to
the competitors. The industry as a whole fluctuates pretty largely on a year to
year basis for the sales growth, but are all moving towards a steady growth rate
of about 6% per year. Cheesecake Factory has been steadily growing by about
4% per year since 2009. The abnormally low growth rates across 2009 can be
attributed to the economic crash in 2008. Stable growth in sales is always a
good trend even if the growth is only a small percentage. The sales growth is
smaller in this industry because the companies do not achieve growth by way of
increasing sales per store but by opening new restaurants and expanding that
way. Therefore, the value of the companies that can be attributed to the sales
growth is nice and consistent but is not the main way the industry expands.

83 | P a g e
Date 2008 2009 2010 2011 2012 2013
CAKE NA -.27% 3.58% 5.92% 2.92% 3.81%
Brinker NA -24.15% -12.73% -4.22% 2.35% 0.66%
Darden NA 8.92% -1.45% 5.44% 6.65% 6.92%
BJ’s NA 14.07% 20.42% 20.84% 14.07% 9.43%
Gross Profit Margin
Gross profit margin shows how much money a company retains after cost
of sales is taken into account. It is calculated by dividing gross profit by
revenue. A higher number is better as it shows more retention of money after
the initial costs are deducted from sales. The industry is extremely consistent
with the gross profit margin. The Cheesecake Factory has a good gross profit
margin and retains about $0.75 of every $1 of revenue they obtain as it pertains
-30
-25
-20
-15
-10
-5
0
5
10
15
20
25
2009 2010 2011 2012 2013
CAKE
Brinker
Darden
BJ's

84 | P a g e
to the gross profit. The industry does not fluctuate much from that number
either averaging about $0.72 per dollar.
The Cheesecake Factory’s retention of profits after cost of goods is
promising but can be attributed to the fact that the company serves fresh food
daily and the only expense that goes into the cost of the food is how much it
cost the company to purchase it. Since the industry is upscale casual there is an
understanding that the companies in the industry are going to charge
substantially more for the product than it cost them to obtain it. Because of this
the expenses are going to come on later with the operating expenses and
income taxes.
Date 2008 2009 2010 2011 2012 2013
Cake .74 .75 .75 .74 .75 .76
Brinker .72 .71 .71 .72 .72 .73
Darden .70 .70 .71 .71 .69 .69
BJ’s .75 .75 .75 .75 .75 .75
0.64
0.66
0.68
0.7
0.72
0.74
0.76
0.78
2008 2009 2010 2011 2012 2013
CAKE
Brinker
Darden
BJ's

85 | P a g e
Operating Profit Margin
The operating profit margin is like the gross profit margin but the
expenses up to operating income are being taken out of revenues. Like gross
profit margin the higher the better but we are also comparing The Cheesecake
Factory to the industry. There is a significant drop off in retention with this profit
margin mainly because there are a large number of expenses that have now
been taken out of revenue. The expenses mainly include depreciation and
amortization but there is a huge expense in labor. The labor expense is actually
more expensive than the costs of goods with labor expense totaling $533,080
and cost of goods totaling $416,000 in 2008 (CAKE 10-K). Those numbers do
not fluctuate far from that with the difference in labor expense to cost of goods
staying around $120,000-$150,000.
The industry is still very consistent as a whole when it comes to this ratio.
The Cheesecake Factory averages about $0.08 per dollar retention by the
operating profit margin. Compared to the industry that is a really good retention
rate and shows a healthy operating profit margin. Even then, the massive
increase in expenses between gross profit and operating income is a concern and
the companies should attempt to cut down on those expenses by lowering wages
slightly and finding a way to lower the costs of operation to manageable
numbers. By decreasing expenses, the industry can achieve a higher retention
rate and not experience such a dramatic decrease in retention between gross
profit and operating income.

86 | P a g e
Date 2008 2009 2010 2011 2012 2013
CAKE .05 .05 .08 .08 .08 .09
Brinker .02 .03 .06 .08 .08 .09
Darden .08 .07 .08 .09 .08 .06
BJ’s .03 .05 .06 .07 .06 .03
Net Profit Margin
The net profit margin is the same as the previous two margins except it is
using net income divided by revenues instead of gross profit or operating
income. Also like the previous two margins higher is better but we are also
looking at comparison with the rest of the industry as well. The numbers
decrease further due to the last of the expenses being taken out of revenues,
but there are significantly fewer expenses than with operating income. The
numbers for net profit margin stay consistent with the previous margins that the
0
0.01
0.02
0.03
0.04
0.05
0.06
0.07
0.08
0.09
0.1
2008 2009 2010 2011 2012 2013
CAKE
Brinker
Darden
BJ's

87 | P a g e
industry is very consistent and the Cheesecake Factory has a healthy net profit
margin. Even though The Cheesecake Factory stays ahead of the competition
again with this ratio, retention of around 5 cents for every dollar earned is pretty
eye opening. The expenses incurred after operating income is very manageable
but the ratio suffers from the extreme amount of expenses incurred before
operating income. There is almost no separation at this point between the
industry with CAKE and Brinker leading the way retaining $0.06 for every dollar
and BJ’s trailing with a retention rate of $0.03 for every dollar. The lack of
separation shows just how consistent and competitive the industry is, making
every cent retained count. CAKE appears more stable than the competition by
leading in retention after net profit margin, leading to an increase in overall value
compared to the competition.
Date 2008 2009 2010 2011 2012 2013
CAKE .03 .03 .05 .05 .05 .06
Brinker .01 .02 .05 .05 .05 .06
Darden .06 .05 .06 .06 .06 .05
BJ’s .03 .03 .05 .05 .04 .03
0
0.01
0.02
0.03
0.04
0.05
0.06
0.07
2008 2009 2010 2011 2012 2013
CAKE
Brinker
Darden
BJ's

88 | P a g e
Asset Turnover
Asset turnover ratio deduces the amount of sales per dollar of total assets.
This is another ratio where higher is better but we are also comparing the
Cheesecake Factory to the industry. The asset turnover ratios for the industry
are very consistent and very healthy. The Cheesecake Factory produces an
average of $1.50 for every dollar of assets. That number is desirable and
achieves a healthy asset turnover ratio. The industry stays consistent with the
Cheesecake Factory and maintains a healthy asset turnover ratio overall.
Generating a $1.50 in sales per every dollar in assets is great and provides a
large amount of stability since they are producing more than it cost to obtain the
assets. This metric shows how important plant, property, and equipment is to
these companies. As we saw when analyzing current ratio and quick ratio, there
are very few readily convertible assets on the books of these companies and
provide little value. PP&E creates the majority of the assets on the books
because the industry expands and grows by way of opening more restaurants.
Because asset turnover takes PP&E into account we now see the true value of
the assets of these companies, especially PP&E.
Date 2008 2009 2010 2011 2012 2013
CAKE 1.41 1.53 1.61 1.72 1.66 1.67
Rested 1.16 1.12 1.2 1.34 1.38 1.43
Brinker 1.93 1.68 1.54 1.86 1.96 1.96
Darden 1.40 1.44 1.35 1.37 1.35 1.23
BJ’s 1.12 1.12 1.19 1.24 1.27 1.27

89 | P a g e
Return on Assets
Return on Assets evaluates how efficient a company is at making profits
with the assets used. It is derived by dividing net income by total assets and is
shown as a percentage. The higher the number the better off the company is.
The table below shows that the Cheesecake Factory and the industry as a whole
do not get a very large return on assets with the Cheesecake Factory topping out
at 10%. Unfortunately the massive expenses taken out of revenues greatly
reduce the return on assets. There will be a larger return on assets if the
companies reduce expenses that get taken out of revenue. As pointed out in the
operating margin, there is an extreme expenditure in labor expense and other
operating expense that make up over half of the total expenses before operating
income. If these expenses can get reduced, either through wage cuts or
improvements in operating efficiency, then many of the profitability ratios will
0
0.5
1
1.5
2
2.5
2008 2009 2010 2011 2012 2013
CAKE
Restated
Brinker
Darden
BJ's

90 | P a g e
increase dramatically which will add substantial value to The Cheesecake Factory
and really separate it from the competition.
Date 2008 2009 2010 2011 2012 2013
CAKE 4.58% 4.09% 7.95% 9.36% 9.01% 10.17%
Restated 3.99% 3.27% 5.89% 6.69% 7.89% 7.99%
Brinker 2.36% 4.06% 7.44% 9.50% 10.51% 11.25%
Darden 7.97% 7.41% 7.67% 8.71% 8.00% 5.94%
BJ’s 3.08% 3.42% 5.39% 6.29% 5.61% 3.44%
Return on Equity
Like with return on assets, the return on equity shows how efficient the
company is at creating sales with equity. The higher the number the better but
too high of a number can show too much reliance on equity to create income. It
is derived by dividing net income by total shareholder equity. The industry has
0
2
4
6
8
10
12
2008 2009 2010 2011 2012 2013
CAKE
Restated
Brinker
Darden
BJ's

91 | P a g e
much healthier numbers for the return on equity than the return on assets which
shows a higher reliance on equity to provide income. The Cheesecake Factory
tops out at 20% which is 10% higher than the maximum reached with return on
assets. The industry does a good job of staying at a healthy level of return on
equity with the only exception being Brinker relying too heavily on equity to
provide income. The reliance on equity has been mentioned throughout the
analysis and is showing here with almost double a return on equity than assets.
We do not see an over reliance on the equity, however, and the ratio is a good
indicator of value of equity to the company.
Date 2008 2009 2010 2011 2012 2013
CAKE 11.55% 8.30% 13.80% 17.64% 16.98% 19.81%
Brinker 8.69% 12.24% 18.90% 32.14% 48.80% 109.37%
Darden 26.77% 23.18% 20.89% 25.15% 25.81% 20.00%
BJ’s 4.44% 5.15% 8.08% 9.50% 8.54% 5.24%
0
20
40
60
80
100
120
2008 2009 2010 2011 2012 2013
CAKE
Brinker
Darden
BJ's

92 | P a g e
Conclusion
The profitability ratios were much healthier than the liquidity ratios since
almost every ratio had positive, healthy results. The Cheesecake Factory looks
more stable after analysis of the profitability ratios than it did post-liquidity
analysis. These ratios show that the Cheesecake Factory along with the industry
are healthy when it comes to looking at how they obtain and maintain income.
The Cheesecake Factory stayed that the top of the competition for the majority
of the profitability ratios and if the company can delete some of the expenses
incurred with labor costs and other operating expenses the company could set
themselves apart from the competition and increase overall company value
dramatically.
Capital Structure Ratios
When valuing a firm, analyzing the capital structure ratios is a vital step.
Analyzing capital structure ratios can reveal how a company has been spending
its money as well as where it is derived from. By analyzing the right ratios, it will
be apparent how the company has been dealing with its stockholders’ equity,
and debt. In short, capital structure ratios measure a company’s ability to meet
its obligations and how much of the company’s assets are being financed with
debt.

93 | P a g e
Debt to Equity Ratio
The debt to equity ratio shows how much of the company’s financing has
come from outside sources like a creditor or an investor. This ratio is found by
dividing the total debt, or liabilities, by the total stockholders’ equity. So
therefore, the higher the ratio represents a high amount of debt to equity. In
that case, a ratio around one shows a balance between the company’s debt and
equity. The table shows that CAKE has a higher debt to equity ratio than its
competitors which shows a higher reliance on debt to finance the company’s
assets.
2008 2009 2010 2011 2012 2013
CAKE 1.04 1.52 1.03 0.74 0.88 0.95
CAKE
Restated 2.06 1.54 1.21 1.41 1.39 1.48
Brinker 2.69 2.01 1.54 2.38 3.65 8.73
Darden 2.36 2.13 1.82 1.79 2.23 2.37
BJ’s 0.44 0.51 0.49 0.51 0.50 0.52

94 | P a g e
The Cheesecake Factory, prior to restatement has a debt to equity ratio of
.95. This shows that the company’s assets are being funded more so by investors
than creditors. After restating the financial statements, this is no longer the case.
Cheesecake Factory’s restated debt to equity ratio is 1.48. This is unfavorable to
creditors because it shows that the creditors are pumping in more money to the
Cheesecake Factory to finance their assets than the investors are.
Times Interest Earned
The times interest earned ratio is used to determine if a company can
fulfill its debt obligations. This ratio indicates how many times a company can
cover its interest charges with its income on a pretax basis. This is a particularly
important benchmark because this is one of the earlier signs of a firm headed
towards bankruptcy. The times interest earned ratio can be found by taking
income before interest and taxes, and dividing it by the interest expense. Any
0
1
2
3
4
5
6
7
8
9
10
2008 2009 2010 2011 2012 2013
Cake
Cake Restated
Brinker
Darden
BJ's

95 | P a g e
value below one would be seen as a risk not worth taking for the investors. Since
2008, the Cheesecake Factory and its competition have had a steady increase to
their times interest earned ratio. The only hiccup comes from Darden as its ratio
dropped over 2 points in the span of a year. That being said, Darden is still well
within the safe zone for now. BJ’s Brewhouse was left out because they are debt
free. The same can be said for the Cheesecake Factory as of 2012.
2008 2009 2010 2011 2012 2013
CAKE 5.89 3.15 7.63 30.98 29.35 35.74
Brinker 2.11 3.08 5.42 7.26 8.65 8.82
Darden 7.01 5.88 6.86 7.92 7.28 5.15
Note that starting in 2011 and continuing on through 2012 and 2013, the
Cheesecake Factory had a times interest earned ratio that was exceedingly high.
0
5
10
15
20
25
2008 2009 2010 2011 2012 2013
Cake Restated
Brinker
Darden

96 | P a g e
This means that the Cheesecake Factory had enough income to pay off their
interest expense several times over, boding well for them.
Altman’s Z-Score
Altman’s Z-Score is made up of five different performance judging
formulas and then added together to get one score. When the overall score is
assessed and analyzed, it can determine the likeliness of a firm headed towards
bankruptcy. Altman came up with guidelines to remember when analyzing the z-
score. They are as follows:
If a firm has a z-score greater than 3, then it is in no danger of
bankruptcy
If a firm has a score between 3-1.8, this is considered a gray area
If a firm’s z-score is lower than 1.8 then it is headed for bankruptcy
The Cheesecake Factory and nearly all of its competition have no reason to
worry about falling into the danger zone. However, for Darden, their z-score has
been slightly declining since 2011. Darden must find a way to turn this ship
around before they fall out of the gray area and are considered as nearing
bankruptcy.

97 | P a g e
2008 2009 2010 2011 2012 2013
CAKE 2.53 3.21 4.87 4.74 4.93 5.43
Cake
Restated
2.38 3.11 3.61 3.64 3.7 3.74
Brinker 3.65 3.94 4.03 4.96 5.39 5.47
Darden 3.10 3.04 3.17 3.35 3.02 2.17
BJ’s 2.95 3.77 5.56 5.96 4.95 4.09
As stated before the benchmark Z-score is anything above a 3.00. After
2008, the Cheesecake Factory has consistently stayed above the 3.00 safe zone.
Cheesecake Factory has shown no signs of worry as they have had a steady
increase of Z-scores in the past 5 years.
0
1
2
3
4
5
6
7
2008 2009 2010 2011 2012 2013
Cake
Cake Restated
Brinker
Darden
BJ's

98 | P a g e
Financial Forecasting
In order for us to value a firm there must be financial forecasting. When
forecasting financial statements it is important that we make well educated
assumptions using historical ratios, trends, industry patterns, as well as taking
into account the current economic situations. By using these methods of
valuation we, the financial analysts, will be able to define the intrinsic value of a
firm based upon our assumptions. However, it is important to keep in mind that
the longer a period is forecasted out the less reliable the estimates become. In
order to forecast out the next 10 years of financial information we will use the
income statement, balance sheet, and statement of cash flows of The
Cheesecake Factory Inc. and a series of ratios that allow us to make our
assumptions.
Income Statement
In order to be able to forecast the balance sheet and statement of cash
flows, the first step we will take is examining is the income statement. The
income statement must use logical assumptions due to these numbers being
used later in the balance sheet and statement of cash flows. In general, the most
important factor used in forecasting the income statement is the sales growth
percentage. Current economic situations must be taken into account when
estimating sales growth along with historical sales figures as well. The future
revenues forecasted in this section will be used in multiple liquidity and
profitability ratios used to forecast the balance sheet and statement of cash
flows.
Because the current economic situation is not as severe as it was in the
recession of 2008, with economies failing and then slowly recovering, we used
an average estimate of sales growth over the past 5 years in order to signify the

99 | P a g e
currently stabilizing economy. Over the past 5 years The Cheesecake Factory has
shown a relatively consistent sales growth trend, with sales either going up or
down a few percentage points between periods. We computed the average by
calculating the sales growth between 2009 and 2013 and then averaging the
numbers together. We decided to assume the average of 3.0% sales growth rate
experienced between 2009 and 2013 in order to forecast the next 10 years of
revenues. We are assuming the average based on the trend of growth in sales
between the periods being relatively consistent from year to year, with years
2010-2013 having relatively similar growth rates. Every year will increase by
3.0% due to the current economic situation being more stable than in 2008. This
will lead to an aggregate increase in sales growth by 30% over the next 10
years. This aggregate growth is on par for the aggregate growth experienced
between the years of 2009 and 2013. The aggregate growth over the five year
period was 15.96%.
After the percentage of sales growth is forecasted for the next 10 years a
common sized income statement can be created. A common size income
statement is used to report each factor in the income statement as a percentage
of revenues. By using this method trends and patterns can be seen and
forecasted relatively easily. We as financial analysts have decided to use an
average gross profit margin in order to represent a stabilizing economy as well
as the steady trend currently being experienced by The Cheesecake Factory Inc.
in terms of gross profits. Gross profit has been steadily consistent in accordance
to revenues, with gross profit being around 75% of revenues from years 2009 to
2013. In order to forecast out this consistent trend we took an average of the
gross profit margin divided by revenues of the each period, resulting in an
average gross profit relative to sales of 75.17%. By doing so we have also found
an average for costs of goods sold, due to revenues subtracted from costs of
goods sold equaling gross profit. The average of the costs of goods sold,
24.83%, is a product of the costs of goods sold for each period being around
25% consistently.

100 | P a g e
The Cheesecake Factory Inc. has also been experiencing relative
steadiness in accordance with its expenses. The only line item that experienced
growth was “Pre-Opening Expenses”. However, the amount of pre-opening
expenses to revenues is a relative non-factor when forecasting the income
statement because although it experienced growth from 2009 to 2013, it only
represents an average of 0.49% of total revenues. Expenses such as Other
Operating Costs and Expenses as well as Labor are a key factor in forecasting
out the income statements, averaging 24.51% and 32.36% of revenues,
respectably. Both of these items experienced a steady percentage year to year in
regards to revenues, with the percentages varying little if any. Therefore, we
are using an average of the period’s labor and operating costs and expenses
data as a means to continue the trend the company is experiencing.
The next important part of the common size income statement is the
income from operations factor. The Cheesecake Factory experienced an increase
in 2010 income from operations as compared to revenues from 2009 with
income from operations being 4.60% of revenues to 7.73% of revenues in 2010.
Between 2010 and 2012 the percentage was steady, varying only a decimal of a
percentage point between 7.73% , 7.59%, and 7.67% respectably. In 2013 the
percentage rose to 8.57%. In order to accurately forecast the income from
operations we are going to use a slightly increasing percentage from 2013,
accounting for a 0.05% increase in the first 2 years then leveling out the next 8.
Because the percentage has experienced an increasing trend between 2011 and
2013, we are increasing the forecasted percentage slightly for the first two years
and then leveling off as a means to maintain the steady growth that the
company is trending in accordance with all other factors to the income
statement. In doing so the forecasted income from operations rises from 8.57%
in 2013 to 8.62% in 2014 and 8.67% in 2015. After 2015 we have leveled off
with an average percentage of 8.67% for years 2016 to 2023, reflecting the
steady trend that is present throughout the income statement.

101 | P a g e
Along with forecasting income from operations we are also forecasting
income before taxes. Income before taxes has experienced a growing trend
between 2009 and 2013. Although the trend is increasing, it is not doing so by
much. Due to the increasing trend we are forecasting income before income
taxes as growing 0.5% from period to period. This steady increase is
representative of the increase experienced between 2009 and 2013 in income
before taxes and will rise from 8.83% in 2014 to 13.33% in 2023. The growth in
income before taxes is aggressive due to the steadily increasing growth rate of
total revenues.
Net income is the last factor we forecasted in the income statement. Net
income has experienced a growing trend at 2.67% of revenues in 2009 to 6.09%
of revenues in 2013. For forecasting purposes we have forecasted net income as
increasing from 6.34% in 2014 to 8.74% in 2023. The growth over the period is
meant to be small in order to accurately forecast based upon previous historical
data for net income.
Once again, due to the forecasted period being 10 years, unexpected
factors can affect our forecasted projections for the income statement. Using the
forecasted numbers we are now able to forecast the balance sheet, statement of
cash flows, and observe dividends.

102 | P a g e
Inco
me
Stat
emen
t As S
tate
d
2008
2009
2010
2011
2012
2013
Assu
me
Aver
age
2014
2015
2016
2017
2018
2019
2020
2021
2022
2023
2024
Reve
nues
$1,6
06,4
06$1
,602
,020
$1,6
59,4
04$1
,757
,624
$1,8
09,0
17$1
,877
,910
3.00%
100%
$1,9
34,2
47.3
0$1
,992
,274
.72
$2,0
52,0
42.9
6$2
,113
,604
.25
$2,1
77,0
12.3
8$2
,242
,322
.75
$2,3
09,5
92.4
3$2
,378
,880
.20
$2,4
50,2
46.6
1$2
,523
,754
.01
$2,5
99,4
66.6
3
Cost
of s
ales
416,
801
394,
409
412,
855
448,
468
450,
153
455,
685
24.8
3%$4
80,3
28.4
0$4
94,7
38.2
5$5
09,5
80.4
0$5
24,8
67.8
1$5
40,6
13.8
4$5
56,8
32.2
6$5
73,5
37.2
3$5
90,7
43.3
4$6
08,4
65.6
5$6
26,7
19.6
1
GROS
S PRO
FIT
1,18
9,60
51,
207,
611
1,24
6,54
91,
309,
156
1,35
8,86
41,
422,
225
75%
$1,4
53,9
18.9
0$1
,497
,536
.47
$1,5
42,4
62.5
6$1
,588
,736
.44
$1,6
36,3
98.5
3$1
,685
,490
.49
$1,7
36,0
55.2
0$1
,788
,136
.86
$1,8
41,7
80.9
6$1
,897
,034
.39
Labo
r exp
ense
s53
3,08
052
8,57
853
6,95
456
7,35
858
0,19
260
3,06
932
.36%
$625
,994
.40
$644
,774
.23
$664
,117
.46
$684
,040
.99
$704
,562
.21
$725
,699
.08
$747
,470
.05
$769
,894
.16
$792
,990
.98
$816
,780
.71
Othe
r ope
ratin
g cos
ts an
d ex
pens
es39
7,49
840
2,87
740
8,36
242
8,44
243
9,55
945
2,57
124
.51%
$474
,011
.14
$488
,231
.48
$502
,878
.42
$517
,964
.78
$533
,503
.72
$549
,508
.83
$565
,994
.10
$582
,973
.92
$600
,463
.14
$618
,477
.03
Gene
ral a
nd ad
min
istra
tive
expe
nses
83,7
3197
,432
95,7
2996
,263
104,
156
114,
728
5.84
%$1
12,9
38.8
8$1
16,3
27.0
5$1
19,8
16.8
6$1
23,4
11.3
6$1
27,1
13.7
0$1
30,9
27.1
2$1
34,8
54.9
3$1
38,9
00.5
8$1
43,0
67.5
9$1
47,3
59.6
2
Depr
ecia
tion
and
amor
tizat
ion
expe
nses
73,2
9075
,184
72,1
4071
,958
74,4
3378
,558
4.29
%$8
2,91
0.70
$85,
398.
02$8
7,95
9.96
$90,
598.
76$9
3,31
6.73
$96,
116.
23$9
8,99
9.72
$101
,969
.71
$105
,028
.80
$108
,179
.66
Impa
irmen
t of a
sset
s2,
952
26,5
411,
547
9,53
6(5
61)
Preo
peni
ng co
sts
11,8
833,
282
5,15
310
,138
12,2
8912
,906
0.49
%9,
511.
75$
9,79
7.10
$
10,0
91.0
2$
10
,393
.75
$
10,7
05.5
6$
11,0
26.7
3$
11,3
57.5
3$
11,6
98.2
6$
12,0
49.2
0$
12,4
10.6
8$
Tota
l cos
ts an
d ex
pens
es1,
519,
235
1,52
8,30
31,
531,
193
1,62
4,17
41,
670,
318
1,71
6,95
6
Inco
me
from
ope
ratio
ns87
,171
73,7
1712
8,21
113
3,45
013
8,69
916
0,95
4+.0005%
7.23
%$1
66,7
49.7
4$1
72,7
48.3
7$1
77,9
30.8
2$1
83,2
68.7
5$1
88,7
66.8
1$1
94,4
29.8
2$2
00,2
62.7
1$2
06,2
70.5
9$2
12,4
58.7
1$2
18,8
32.4
7
Inte
rest
exp
ense
(14,
788)
(23,
433)
(16,
808)
(4,3
07)
(4,7
25)
(4,5
04)
-0.6
4%($
12,4
63.0
9)($
12,8
36.9
8)($
13,2
22.0
9)($
13,6
18.7
5)($
14,0
27.3
1)($
14,4
48.1
3)($
14,8
81.5
8)($
15,3
28.0
2)($
15,7
87.8
7)($
16,2
61.5
0)
Inte
rest
inco
me
1,84
937
219
2
Othe
r inc
ome/
(exp
ense
), ne
t(9
77)
651
(506
)
Inco
me
befo
re in
com
e ta
xes
73,2
5551
,307
111,
089
129,
143
133,
974
156,
450
+.005
6.60
%$1
70,8
14.7
4$1
85,9
00.5
5$2
01,7
37.7
8$2
18,3
57.9
4$2
35,7
93.7
4$2
54,0
79.1
6$2
73,2
49.5
0$2
93,3
41.3
9$3
14,3
92.8
6$3
36,4
43.4
2
Inco
me
tax p
rovi
sion
20,9
628,
474
29,3
7633
,423
35,5
5142
,094
1.68
%$3
2,52
4.67
$33,
500.
41$3
4,50
5.42
$35,
540.
59$3
6,60
6.80
$37,
705.
01$3
8,83
6.16
$40,
001.
24$4
1,20
1.28
$42,
437.
32
Net i
ncom
e$5
2,29
3$4
2,83
3$8
1,71
3$9
5,72
0$9
8,42
3$1
14,3
56+.0025
4.91
%$1
22,6
22.3
0$1
31,2
81.6
5$1
40,3
50.2
1$1
49,8
44.7
3$1
59,7
82.6
0$1
70,1
81.8
9$1
81,0
61.3
2$1
92,4
40.3
6$2
04,3
39.1
9$2
20,5
64.3
8
Com
mon
Siz
e In
com
e St
atem
ent
Fisc
al Y
ear
2008
2009
2010
2011
2012
2013
2014
2015
2016
2017
2018
2019
2020
2021
2022
2023
(Dol
lars
in th
ousa
nds,
exc
ept p
er s
hare
and
sal
es p
er s
quar
e fo
ot d
ata)
Aggr
egat
e SG
Stat
emen
t of I
ncom
e D
ata:
15.9
60%
Aggr
egat
e
Sale
s G
row
th P
erce
nt-0
.273
%3.
582%
5.91
9%2.
924%
3.80
8%0.
033.
192%
3.00
%3.
00%
3.00
%3.
00%
3.00
%3.
00%
3.00
%3.
00%
3.00
%3.
00%
30.0
0%
Net
sal
es10
0.00
%10
0.00
%10
0.00
%10
0.00
%10
0.00
%10
0%10
0.00
%10
0.00
%10
0.00
%10
0.00
%10
0.00
%10
0.00
%10
0.00
%10
0.00
%10
0.00
%10
0.00
%
Cost
of g
oods
sol
d (1
)24
.62%
24.8
8%25
.52%
24.8
8%24
.27%
24.8
3%24
.83%
24.8
3%24
.83%
24.8
3%24
.83%
24.8
3%24
.83%
24.8
3%24
.83%
24.8
3%
Gro
ss p
rofi
t75
.38%
75.1
2%74
.48%
75.1
2%75
.73%
75.1
7%75
.17%
75.1
7%75
.17%
75.1
7%75
.17%
75.1
7%75
.17%
75.1
7%75
.17%
75.1
7%
Selli
ng, g
ener
al a
nd a
dmin
istr
ativ
e ex
pens
es6.
08%
5.77
%5.
48%
5.76
%6.
11%
5.84
%5.
84%
5.84
%5.
84%
5.84
%5.
84%
5.84
%5.
84%
5.84
%5.
84%
5.84
%
Pre-
open
ing
expe
nses
0.20
%0.
31%
0.58
%0.
68%
0.69
%0.
49%
0.49
%0.
49%
0.49
%0.
49%
0.49
%0.
49%
0.49
%0.
49%
0.49
%0.
49%
Labo
r Ex
pens
es32
.99%
32.3
6%32
.28%
32.0
7%32
.11%
32.3
6%32
.36%
32.3
6%32
.36%
32.3
6%32
.36%
32.3
6%32
.36%
32.3
6%32
.36%
32.3
6%
Oth
er O
pera
ting
Cos
ts a
nd E
xpen
ses
25.1
5%24
.61%
24.3
8%24
.30%
24.1
0%24
.51%
24.5
1%24
.51%
24.5
1%24
.51%
24.5
1%24
.51%
24.5
1%24
.51%
24.5
1%24
.51%
Dep
reci
atio
n an
d Am
orti
zati
on E
xpen
ses
4.69
%4.
35%
4.09
%4.
11%
4.18
%4.
29%
4.29
%4.
29%
4.29
%4.
29%
4.29
%4.
29%
4.29
%4.
29%
4.29
%4.
29%
Inco
me
from
ope
rati
ons
4.60
%7.
73%
7.59
%7.
67%
8.57
%+.0005%
7.23
%8.
62%
8.67
%8.
67%
8.67
%8.
67%
8.67
%8.
67%
8.67
%8.
67%
8.67
%
(Gai
n) o
n sa
le /
loss
on
wri
te-d
own
of n
on-c
ash
inve
stm
ent (
2) (
3)
Inte
rest
exp
ense
-1.4
63%
-1.0
13%
-0.2
45%
-0.2
61%
-0.2
40%
-0.6
4%-0
.64%
-0.6
4%-0
.64%
-0.6
4%-0
.64%
-0.6
4%-0
.64%
-0.6
4%-0
.64%
-0.6
4%
Oth
er in
com
e
Inco
me
befo
re in
com
e ta
xes
3.20
%6.
69%
7.35
%7.
41%
8.33
%+.005
6.60
%8.
83%
9.33
%9.
83%
10.3
3%10
.83%
11.3
3%11
.83%
12.3
3%12
.83%
13.3
3%
Prov
isio
n fo
r in
com
e ta
xes
0.53
%1.
77%
1.90
%1.
97%
2.24
%1.
68%
1.68
%1.
68%
1.68
%1.
68%
1.68
%1.
68%
1.68
%1.
68%
1.68
%1.
68%
Net
inco
me
2.67
%4.
92%
5.45
%5.
44%
6.09
%+.0025
4.91
%6.
34%
6.59
%6.
84%
7.09
%7.
34%
7.59
%7.
84%
8.09
%8.
34%
8.74
%
Actu
al Fi
nanc
ials
Fore
cast
ed Fi
nanc
ial S
tate
men
ts
Fore
cast
ed Fi
nanc
ial S
tate
men
ts

103 | P a g e
Dividends Forecasting
Future expectations of dividend growth and value are heavy variables
when valuing a firm. The Cheesecake Factory Inc., announced on July 22nd, 2013
that the “Board increased the authorization to repurchase our common stock by
7.5 million shares to 48.5 million shares. Under this
and all previous authorizations, we have cumulatively repurchased 38.9 million
shares at a total cost of $1,015.5 million through December 31,2013, including
4.5 million shares of our common stock at a cost of $183.7 million during fiscal
year 2013”(Cheesecake 10-K).
When forecasting this trend we have data regarding the first quarter of
2014. In order to accurately forecast 2014 dividend payout we have total shares
outstanding as of June 25th, 2014 at 48,300,000. The first quarterly dividend of
the year was priced at .14 cents per share. Based on a trend of The Cheesecake
Factory increasing the share price by .02 cents every 4 quarters, we have
assumed the dividend will increase to 0.16 cents per share for the next 3
quarters of 2014. After calculating the dividend payout for 2014 based upon our
assumptions, we have observed similar statistics in terms of 2013. In 2013 the
first quarter paid a dividend of .12 cents with the next 3 quarters paying .14
cents per share. In 2014 the first quarter dividend price per share is .14 cents,
with the next 3 quarters increasing by .02 cents, identical to the increase seen in
2013. Due to the similarities in dividend payout structure, we have assumed a
continuous dividend payout structure and have forecasted dividends paid out for
the next ten years according to the table below.

104 | P a g e
Shares outstanding 2014 48300000
Dividends Declared
May 9th 0.14
Dividends Paid as of May 9th 7214000
Paid/ Outstanding 0.149358178
Calculations for next 3 quarters Assuming Shares outstanding Estimation of Dividends paidEstimation + 1st quarter
Dividend per share:
2nd quarter 0.16 48300000 7728000
3rd quarter 0.16 48300000 7728000
4th quarter 0.16 48300000 7728000 Thousands
total dividends paid 23184000 30398000 30398
Calculations Assuming Similar Payouts
2015
0.16 48300000 7728000
0.18 48300000 8694000
0.18 48300000 8694000
0.18 48300000 8694000 Thousands
total dividends paid 33810000 33810
2016
0.18 48300000 8694000
0.2 48300000 9660000
0.2 48300000 9660000
0.2 48300000 9660000 Thousands
total dividends paid 37674000 37674
2017 0.2 48300000 9660000
0.22 48300000 10626000
0.22 48300000 10626000
0.22 48300000 10626000 Thousands
total dividends paid 41538000 41538
2018 0.22 48300000 10626000
0.24 48300000 11592000
0.24 48300000 11592000
0.24 48300000 11592000 Thousands
total dividends paid 45402000 45402
2019 0.24 48300000 11592000
0.26 48300000 12558000
0.26 48300000 12558000
0.26 48300000 12558000 Thousands
total dividends paid 49266000 49266
2020 0.26 48300000 12558000
0.28 48300000 13524000
0.28 48300000 13524000
0.28 48300000 13524000 Thousands
total dividends paid 53130000 53130
2021 0.28 48300000 13524000
0.3 48300000 14490000
0.3 48300000 14490000
0.3 48300000 14490000 Thousands
total dividends paid 56994000 56994
2022 0.3 48300000 14490000
0.32 48300000 15456000
0.32 48300000 15456000
0.32 48300000 15456000 Thousands
total dividends paid 60858000 60858
2023 0.32 48300000 15456000
0.34 48300000 16422000
0.34 48300000 16422000
0.34 48300000 16422000 Thousands
total dividends paid 64722000 64722

105 | P a g e
Balance Sheet
The next step in the forecasting process for valuation is to forecast the
balance sheet now that we have the income statement forecasted. Many ratios
and methods can be used to forecast the balance sheet, but we find the asset
turnover ratio to be best suited at incorporating the income statement with the
balance sheet. Just as sales on the income statement were observed as steadily
increasing at a constant rate, the asset turnover ratio is also steadily increasing
at a constant rate. The average increase in forecasted asset turnover will
correlate to the steady increase observed over the previous 6 years for The
Cheesecake Factory. We calculated the forecasted asset turnover ratios by
adding 0.03 points to the 2013 1.67 asset turnover ratio. After calculating the
2014 forecasted ratio we continue to add 0.03 points as a means to forecast the
trend seen in the asset turnover ratio of the Cheesecake Factory. Using this
method the asset turnover ratio increases by 0.03 points from years 2014 to
2016. After 2016 the ratio is constant as a means to not over project based on
the asset turnover ratios seen in the previous 6 years.
Using this ratio we are able to forecast total assets for the next 10 years.
Total assets is the key to forecasting on the balance sheet. Along with the asset
turnover ratio we are able to use liquidity ratios as a means to forecast current
assets and current liabilities. The next step in forecasting the balance sheet is to
create a common size balance sheet to identify trends.
After creating the common size balance sheet we noticed a trend of
current assets decreasing and increasing and then decreasing again. This
mixture of increasing and decreasing led us to use an average of 18.59% in
terms of forecasting for current assets. The average will allow us to forecast
steady growth, which is seen in the income statement for The Cheesecake
Factory. Long-term assets also experienced volatility in terms of increasing and
decreasing, therefore we took an average of all the periods and used the number

106 | P a g e
as the growth for long-term assets for the forecasted periods. Current and long
term liabilities experienced more of an increasing trend as compared to current
and long term assets. Due to this the projected forecasts increase from 36.70%
in 2014 to 57.51% in 2023. The trends we have found in The Cheesecake
Factory financial statements are on par with trends of the casual dining industry,
along with the evidence of a steadily growing economy.

107 | P a g e
Balance Sheet
Assume
Ave
rage
2008
2009
2010
2011
2012
2013
2014
2015
2016
2017
2018
2019
2020
2021
2022
2023
2024
ASSETS
Current assets:
Cash and cash equivalents
$80,365
$73,715
$81,619
$48,211
$83,569
$61,751
6.57
%65
,806
.61
$
70
,128
.59
$
74
,734
.42
$
79,6
42.7
5$
84,8
73.4
3$
90,4
47.6
6$
96
,387
.98
$
10
2,71
8.45
$
10
9,46
4.68
$
11
6,65
3.98
$
Investments and marketable securities
996
Accounts receivable
12,537
11,352
16,184
11,334
14,558
10,081
1.20
%
Income tax receivable
12,713
1,875
3,840
5,472
4,529
Other receivables
32,821
27,475
27,296
32,096
48,100
55,461
3.55
%
Inventories
23,132
22,202
23,036
28,210
28,836
35,478
2.58
%29
,954
.95
$
31
,469
.68
$
33
,176
.03
$
34,2
12.9
7$
35,3
30.5
6$
35,5
55.0
7$
36
,836
.07
$
38
,130
.96
$
39,3
71.7
3$
40
,511
.60
$
Prepaid expenses
24,654
27,871
28,345
36,498
39,887
42,595
3.29
%
Deferred income taxes
3,001
7,737
5,732
14,574
15,257
16,008
Total current assets
190,219
172,227
186,052
176,395
230,207
225,903
18.5
9%21
4,05
6.98
$
216,
721.
75$
22
3,22
3.40
$
22
9,92
0.10
$
23
6,81
7.70
$
243,
922.
24$
25
1,23
9.90
$
25
8,77
7.10
$
26
6,54
0.41
$
27
4,53
6.62
$
Property and equipment, net
860,489
788,402
755,468
758,503
764,418
795,379
72.7
4%85
0,43
9.59
$
873,
648.
06$
89
8,67
5.24
$
92
5,63
5.50
$
95
3,40
4.56
$
982,
006.
70$
1,
011,
466.
90$
1,
041,
810.
91$
1,
073,
065.
24$
1,
105,
257.
19$
$1
,138
,414
.91
Other assets:
Intangible assets, net
4,177
4,338
4,498
14,674
17,829
18,647
1.12
%
Prepaid rent
58,323
54,243
50,391
49,490
50,793
47,064
4.75
%
Other
29,422
27,541
31,988
23,508
28,920
37,121
2.80
%
Total otherassets
91,922
86,122
86,877
87,672
97,542
102,832
8.67
%11
1,74
3.00
$
121,
426.
18$
13
1,94
8.47
$
14
3,38
2.58
$
15
5,80
7.52
$
169,
309.
16$
18
3,98
0.79
$
19
9,92
3.80
$
21
7,24
8.37
$
23
6,07
4.22
$
Total Noncurrent Assets
952,411
874,524
842,345
846,175
861,960
898,211
82.1
0%93
7,16
8.26
$
948,
834.
93$
97
7,29
9.98
$
1,
006,
618.
98$
1,
036,
817.
55$
1,06
7,92
2.08
$
1,
099,
959.
74$
1,
132,
958.
53$
1,
166,
947.
29$
1,
201,
955.
71$
Total assets
$1,142,630
$1,046,751
$1,028,397
$1,022,570
$1,092,167
$1,124,114
100.
00%
1,15
1,22
5.24
$
1,
165,
556.
68$
1,20
0,52
3.38
$
1,23
6,53
9.08
$
1,27
3,63
5.26
$ 1,
311,
844.
31$
1,35
1,19
9.64
$
1,39
1,73
5.63
$
1,43
3,48
7.70
$
1,47
6,49
2.33
$
LIABILITIES AND STOCKHOLDERS EQUITY
Current liabilities:
Accounts payable
$37,875
$33,948
$32,651
$36,159
$46,998
$35,418
7.21
%
Income tax payable
1,213
Other accrued expenses
147,958
166,513
170,054
187,081
204,823
228,829
38.2
4%
Total current liabilities
185,833
200,461
202,705
223,240
253,034
264,247
45.7
0%24
5,83
4.68
$
248,
344.
54$
25
8,02
1.29
$
26
1,97
7.88
$
27
1,49
5.07
$
278,
714.
40$
28
8,03
0.51
$
29
6,58
4.56
$
30
5,49
0.37
$
31
4,21
3.05
$
Deferred income taxes
87,045
87,048
86,918
103,927
91,852
97,237
18.7
4%
Deferred rent
57,286
64,209
67,258
69,742
76,144
74,690
14.1
2%
Deemed landlord financing liability
54,887
51,802
51,954
55,086
55,123
66,197
11.2
0%
Long term debt
275,000
100,000
Other noncurrent liabilities
30,013
27,118
27,225
27,822
36,288
44,390
6.47
%
Total Noncurrent Liabilities:
504,231
330,177
233,355
256,577
259,407
282,514
54.3
0%23
5,81
3.27
$
150,
163.
19$
72
,776
.93
$
(3,4
70.6
8)$
(9
0,27
2.31
)$
(180
,198
.47)
$
(2
78,0
90.5
7)$
(3
81,5
54.9
9)$
(492
,189
.93)
$
(6
13,7
50.3
6)$
Total Liabilities:
690,064
530,638
436,060
479,817
512,441
546,761
100.
00%
481,
647.
95$
39
8,50
7.73
$
330,
798.
22$
258,
507.
19$
181,
222.
76$
98
,515
.94
$
9,93
9.94
$
(84,
970.
43)
$
(1
86,6
99.5
5)$
(299
,537
.31)
$
Commitments and contingencies
Stockholders equity:
Preferred stock, $.01 par value, 5,000,000
shares authorized; none issued
Junior participating cumulative preferred
stock, $.01 par value, 150,000 shares authorized; none
828
834
849
859
878
906
issued
Common stock, $.01 par value, 250,000,000
shares authorized; 90,632,325 and 87,812,022
shares issued at December 31, 2013 and January 1,
370,919
386,562
428,527
455,339
508,130
602,469
2013, respectively
596,711
639,544
721,257
816,977
902,532
989,451
Additional paid-in capital
(9,684)
(4,619)
Retained earnings
(506,208)
(506,208)
(558,296)
(730,422)
(831,814)
(1,015,473)
129.
26%
(923
,248
.70)
$
(825
,777
.05)
$
(723
,100
.84)
$
(6
14,7
94.1
1)$
(5
00,4
13.5
1)$
(3
79,4
97.6
2)$
(251
,566
.30)
$
(116
,119
.94)
$
27
,361
.26
$
183,
203.
64$
Accmulated other comprehensive loss
Treasury stock 38,865,951 and 34,414,222
shares at cost at December 31, 2013 and January 1,
2013, respectively
Total stockholders equity
452,566
516,113
592,337
542,753
579,726
577,353
100.
00%
669,
577.
30$
76
7,04
8.95
$
869,
725.
16$
978,
031.
89$
1,09
2,41
2.49
$ 1,
213,
328.
38$
1,34
1,25
9.70
$
1,47
6,70
6.06
$
1,62
0,18
7.26
$
1,77
6,02
9.64
$
Total liabilities and stockholders equity
$1,142,630
$1,046,751
$1,028,397
$1,022,570
$1,092,167
$1,124,114
100.
00%
1,15
1,22
5.24
$
1,
165,
556.
68$
1,20
0,52
3.38
$
1,23
6,53
9.08
$
1,27
3,63
5.26
$ 1,
311,
844.
31$
1,35
1,19
9.64
$
1,39
1,73
5.63
$
1,43
3,48
7.70
$
1,47
6,49
2.33
$
ROE
9.46
%15
.83%
16.1
6%18
.13%
19.7
3%21
.24%
19.6
1%18
.30%
17.2
3%16
.34%
15.5
8%14
.92%
14.3
5%13
.84%
13.6
1%
% c
hang
e of
RO
E6.
37%
0.33
%1.
97%
1.59
%1.
51%
-1.6
3%-1
.31%
-1.0
7%-0
.89%
-0.7
6%-0
.66%
-0.5
7%-0
.51%
-0.2
2%
TL/S
E1.
521.
030.
740.
880.
880.
950.
720.
520.
380.
260.
170.
080.
01-0
.06
-0.1
2-0
.17
Act
ual F
inan
cial
Sta
tem
ents
Fore
cast
ed

108 | P a g e
Com
mon
Size
Bal
ance
She
etAs
sum
eAv
erag
e
2008
2009
2010
2011
2012
2013
2014
2015
2016
2017
2018
2019
2020
2021
2022
2023
Asse
ts
Current assets:
Cash and cash equivalents
7.04
%7.
94%
4.71
%7.
65%
5.49
%6.
57%
5.72
%6.
02%
6.23
%6.
44%
6.66
%6.
89%
7.13
%7.
38%
7.64
%7.
90%
Investments and marketable securities
Accounts receivable
1.08
%1.
57%
1.11
%1.
33%
0.90
%1.
20%
Income tax receivable
Other receivables
2.62
%2.
65%
3.14
%4.
40%
4.93
%3.
55%
Inventories
2.12
%2.
24%
2.76
%2.
64%
3.16
%2.
58%
2.60
%2.
70%
2.76
%2.
77%
2.77
%2.
71%
2.73
%2.
74%
2.75
%2.
74%
Prepaid expenses
2.66
%2.
76%
3.57
%3.
65%
3.79
%3.
29%
Deferred income taxes
Total current assets
16.4
5%18
.09%
17.2
5%21
.08%
20.1
0%18
.59%
18.5
9%18
.59%
18.5
9%18
.59%
18.5
9%18
.59%
18.5
9%18
.59%
18.5
9%18
.59%
Property and equipment, net
75.3
2%73
.46%
74.1
8%69
.99%
70.7
6%72
.74%
73.8
7%74
.96%
74.8
6%74
.86%
74.8
6%74
.86%
74.8
6%74
.86%
74.8
6%74
.86%
Other assets:
2.63
%3.
11%
2.30
%2.
65%
3.30
%2.
80%
Intangible assets, net
0.41
%0.
44%
1.44
%1.
63%
1.66
%1.
12%
Prepaid rent
5.18
%4.
90%
4.84
%4.
65%
4.19
%4.
75%
Other
2.63
%3.
11%
2.30
%2.
65%
3.30
%2.
80%
Total other assets
8.23
%8.
45%
8.57
%8.
93%
9.15
%8.
67%
Total Noncurrent Assets
83.3
5%83
.55%
81.9
1%82
.75%
78.9
2%82
.10%
81.4
1%81
.41%
81.4
1%81
.41%
81.4
1%81
.41%
81.4
1%81
.41%
81.4
1%81
.41%
Total assets
100.
00%
100.
00%
100.
00%
100.
00%
100.
00%
100.
00%
LIABILITIES AND STOCKHOLDERS EQUITY
Current liabilities:
Accounts payable
4.92
%6.
15%
8.29
%9.
79%
6.91
%7.
21%
Income tax payable
Other accrued expenses
31.3
8%39
.00%
38.9
9%39
.97%
41.8
5%38
.24%
Total current liabilities
37.7
8%46
.49%
46.5
3%49
.38%
48.3
3%45
.70%
51.0
4%62
.32%
78.0
0%10
1.34
%14
9.81
%28
2.91
%28
97.7
1%-3
49.0
4%-1
63.6
3%-1
04.9
0%
Deferred income taxes
16.4
0%19
.93%
21.6
6%17
.92%
17.7
8%18
.74%
Deferred rent
12.1
0%15
.42%
14.5
4%14
.86%
13.6
6%14
.12%
Deemed landlord financing liability
9.76
%11
.91%
11.4
8%10
.76%
12.1
1%11
.20%
Long term debt
18.8
5%18
.85%
Other noncurrent liabilities
5.11
%6.
24%
5.80
%7.
08%
8.12
%6.
47%
Total noncurrent Liabilities
62.2
2%53
.51%
53.4
7%50
.62%
51.6
7%54
.30%
48.9
6%37
.68%
22.0
0%-1
.34%
-49.
81%
-182
.91%
-279
7.71
%44
9.04
%26
3.63
%20
4.90
%
Total Liabilities
100.
00%
100.
00%
100.
00%
100.
00%
100.
00%
100.
00%
100.
00%
100.
00%
100.
00%
100.
00%
100.
00%
100.
00%
100.
00%
100.
00%
100.
00%
100.
00%
Tota
l Lia
bilit
ies t
o To
tal L
&E
50.6
9%42
.40%
46.9
2%46
.92%
48.6
4%47
.12%
41.8
4%34
.19%
27.5
5%20
.91%
14.2
3%7.
51%
0.74
%-6
.11%
-13.
02%
-20.
29%
Stockholders equity:
Preferred stock, $.01 par value, 5,000,000
shares authorized; none issued
Junior participating cumulative preferred
stock, $.01 par value, 150,000 shares authorized; none
0.16
%0.
14%
0.16
%0.
15%
0.16
%0.
15%
issued
Common stock, $.01 par value, 250,000,000
76.3
6%76
.76%
62.3
4%61
.09%
59.3
3%67
.18%
0.00
%0.
00%
0.00
%0.
00%
0.00
%0.
00%
0.00
%0.
00%
0.00
%0.
00%
shares authorized; 90,632,325 and 87,812,022
shares issued at December 31, 2013 and January 1,
61.1
0%70
.13%
79.8
9%82
.64%
88.0
2%76
.36%
73.8
7%74
.96%
74.8
6%74
.86%
74.8
6%74
.86%
74.8
6%74
.86%
74.8
6%74
.86%
2013, respectively
Additional paid-in capital
Retained earnings
98.0
8%94
.25%
134.
58%
143.
48%
175.
88%
129.
26%
137.
89%
107.
66%
83.1
4%62
.86%
45.8
1%31
.28%
18.7
6%7.
86%
-1.6
9%-1
0.32
%
Accmulated other comprehensive loss
Treasury stock 38,865,951 and 34,414,222
shares at cost at December 31, 2013 and January 1,
2013, respectively
Total stockholders equity
100.
00%
100.
00%
100.
00%
100.
00%
100.
00%
100.
00%
100.
00%
100.
00%
100.
00%
100.
00%
100.
00%
100.
00%
100.
00%
100.
00%
100.
00%
100.
00%
Equity to Total L&E
49.3
1%57
.60%
53.0
8%53
.08%
51.3
6%52
.88%
58.1
6%65
.81%
72.4
5%79
.09%
85.7
7%92
.49%
99.2
6%10
6.11
%11
3.02
%12
0.29
%
Total liabilities and stockholders equity
100.
00%
100.
00%
100.
00%
100.
00%
100.
00%
100.
00%
100.
00%
100.
00%
100.
00%
100.
00%
100.
00%
100.
00%
100.
00%
100.
00%
100.
00%
100.
00%
Cons
olid
ated
Fin
anci
al S
tate
men
tsFo
reca
sted
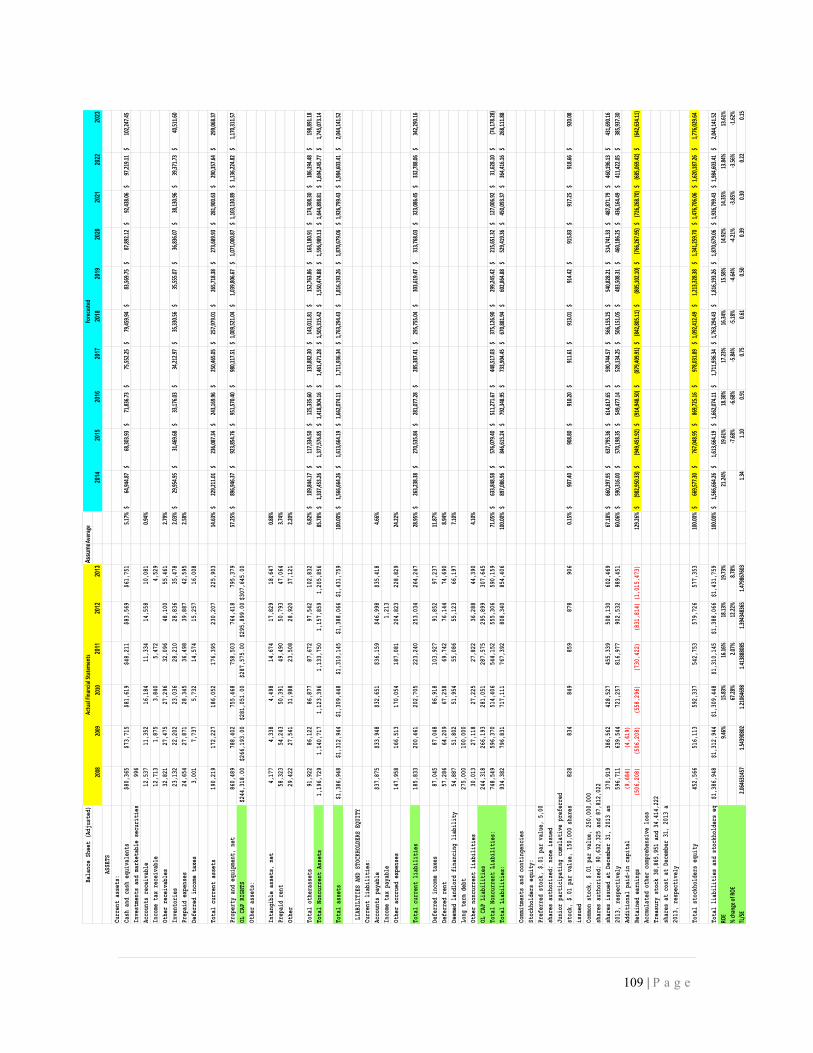
109 | P a g e
Balance Sheet (Adjusted)
AssumeA
vera
ge
2008
2009
2010
2011
2012
2013
2014
2015
2016
2017
2018
2019
2020
2021
2022
2023
ASSETS
Current assets:
Cash and cash equivalents
$80,365
$73,715
$81,619
$48,211
$83,569
$61,751
5.17
%64
,944
.87
$
68
,303
.93
$
71
,836
.73
$
75,5
52.2
5$
79,4
59.9
4$
83
,569
.75
$
87
,892
.12
$
92,4
38.0
6$
97
,219
.11
$
102,
247.
45$
Investments and marketable securities
996
Accounts receivable
12,537
11,352
16,184
11,334
14,558
10,081
0.94
%
Income tax receivable
12,713
1,875
3,840
5,472
4,529
Other receivables
32,821
27,475
27,296
32,096
48,100
55,461
2.79
%
Inventories
23,132
22,202
23,036
28,210
28,836
35,478
2.03
%29
,954
.95
$
31
,469
.68
$
33
,176
.03
$
34,2
12.9
7$
35,3
30.5
6$
35
,555
.07
$
36
,836
.07
$
38,1
30.9
6$
39
,371
.73
$
40,5
11.6
0$
Prepaid expenses
24,654
27,871
28,345
36,498
39,887
42,595
2.58
%
Deferred income taxes
3,001
7,737
5,732
14,574
15,257
16,008
Total current assets
190,219
172,227
186,052
176,395
230,207
225,903
14.6
3%22
9,21
1.01
$
236,
087.
34$
24
3,16
9.96
$
25
0,46
5.05
$
25
7,97
9.01
$
26
5,71
8.38
$
273,
689.
93$
28
1,90
0.63
$
29
0,35
7.64
$
29
9,06
8.37
$
Property and equipment, net
860,489
788,402
755,468
758,503
764,418
795,379
57.2
5%89
6,94
6.37
$
923,
854.
76$
95
1,57
0.40
$
98
0,11
7.51
$
1,
009,
521.
04$
1,
039,
806.
67$
1,07
1,00
0.87
$
1,
103,
130.
89$
1,
136,
224.
82$
1,
170,
311.
57$
OL CAP RIGHTS
$244,318.00
$266,193.00
$281,051.00
$287,575.00
$295,899.00$307,645.00
Other assets:
Intangible assets, net
4,177
4,338
4,498
14,674
17,829
18,647
0.88
%
Prepaid rent
58,323
54,243
50,391
49,490
50,793
47,064
3.74
%
Other
29,422
27,541
31,988
23,508
28,920
37,121
2.20
%
Total otherassets
91,922
86,122
86,877
87,672
97,542
102,832
6.82
%10
9,84
4.17
$
117,
334.
50$
12
5,33
5.60
$
13
3,88
2.30
$
14
3,01
1.81
$
15
2,76
3.86
$
163,
180.
91$
17
4,30
8.30
$
18
6,19
4.48
$
19
8,89
1.18
$
Total Noncurrent Assets
1,196,729
1,140,717
1,123,396
1,133,750
1,157,859
1,205,856
85.7
8%1,
337,
453.
26$
1,37
7,57
6.85
$
1,
418,
904.
16$
1,
461,
471.
28$
1,
505,
315.
42$
1,
550,
474.
88$
1,59
6,98
9.13
$
1,
644,
898.
81$
1,
694,
245.
77$
1,
745,
073.
14$
Total assets
$1,386,948
$1,312,944
$1,309,448
$1,310,145
$1,388,066
$1,431,759
100.
00%
1,56
6,66
4.26
$
1,
613,
664.
19$
1,66
2,07
4.11
$
1,71
1,93
6.34
$
1,76
3,29
4.43
$
1,81
6,19
3.26
$
1,
870,
679.
06$
1,92
6,79
9.43
$
1,98
4,60
3.41
$
2,04
4,14
1.52
$
LIABILITIES AND STOCKHOLDERS EQUITY
Current liabilities:
Accounts payable
$37,875
$33,948
$32,651
$36,159
$46,998
$35,418
4.66
%
Income tax payable
1,213
Other accrued expenses
147,958
166,513
170,054
187,081
204,823
228,829
24.2
2%
Total current liabilities
185,833
200,461
202,705
223,240
253,034
264,247
28.9
5%26
3,23
8.38
$
270,
535.
84$
28
1,07
7.28
$
28
5,38
7.41
$
29
5,75
5.04
$
30
3,61
9.47
$
313,
768.
03$
32
3,08
6.45
$
33
2,78
8.06
$
34
2,29
0.16
$
Deferred income taxes
87,045
87,048
86,918
103,927
91,852
97,237
11.8
7%
Deferred rent
57,286
64,209
67,258
69,742
76,144
74,690
8.94
%
Deemed landlord financing liability
54,887
51,802
51,954
55,086
55,123
66,197
7.10
%
Long term debt
275,000
100,000
Other noncurrent liabilities
30,013
27,118
27,225
27,822
36,288
44,390
4.10
%
OL CAP Liabilities
244,318
266,193
281,051
287,575
295,899
307,645
Total Noncurrent Liabilities:
748,549
596,370
514,406
544,152
555,306
590,159
71.0
5%63
3,84
8.58
$
576,
079.
40$
51
1,27
1.67
$
44
8,51
7.03
$
37
5,12
6.90
$
29
9,24
5.42
$
215,
651.
32$
12
7,00
6.92
$
31
,628
.10
$
(74,
178.
28)
$
Total Liabilities:
934,382
796,831
717,111
767,392
808,340
854,406
100.
00%
897,
086.
96$
84
6,61
5.24
$
792,
348.
95$
733,
904.
45$
670,
881.
94$
602,
864.
88$
52
9,41
9.36
$
450,
093.
37$
364,
416.
16$
268,
111.
88$
Commitments and contingencies
Stockholders equity:
Preferred stock, $.01 par value, 5,000,000
shares authorized; none issued
Junior participating cumulative preferred
stock, $.01 par value, 150,000 shares authorized; none
828
834
849
859
878
906
0.15
%90
7.40
$
908.
80$
910.
20$
91
1.61
$
91
3.01
$
91
4.42
$
91
5.83
$
917.
25$
918.
66$
920.
08$
issued
Common stock, $.01 par value, 250,000,000
shares authorized; 90,632,325 and 87,812,022
shares issued at December 31, 2013 and January 1,
370,919
386,562
428,527
455,339
508,130
602,469
67.1
8%66
0,29
7.95
$
637,
795.
36$
61
4,61
7.65
$
59
0,74
4.57
$
56
6,15
5.25
$
54
0,82
8.21
$
514,
741.
33$
48
7,87
1.79
$
46
0,19
6.13
$
43
1,69
0.16
$
2013, respectively
596,711
639,544
721,257
816,977
902,532
989,451
60.0
6%59
0,31
6.00
$
570,
198.
35$
54
9,47
7.14
$
52
8,13
4.25
$
50
6,15
1.05
$
48
3,50
8.31
$
460,
186.
25$
43
6,16
4.49
$
41
1,42
2.05
$
38
5,93
7.30
$
Additional paid-in capital
(9,684)
(4,619)
Retained earnings
(506,208)
(506,208)
(558,296)
(730,422)
(831,814)(1,015,473)
129.
26%
(982
,950
.33)
$
(949
,451
.92)
$
(914
,948
.50)
$
(8
79,4
09.9
1)$
(8
42,8
05.1
1)$
(805
,102
.10)
$
(766
,267
.95)
$
(7
26,2
68.7
0)$
(685
,069
.42)
$
(6
42,6
34.1
1)$
Accmulated other comprehensive loss
Treasury stock 38,865,951 and 34,414,222
shares at cost at December 31, 2013 and January 1,
2013, respectively
Total stockholders equity
452,566
516,113
592,337
542,753
579,726
577,353
100.
00%
669,
577.
30$
76
7,04
8.95
$
869,
725.
16$
978,
031.
89$
1,09
2,41
2.49
$
1,21
3,32
8.38
$
1,
341,
259.
70$
1,47
6,70
6.06
$
1,62
0,18
7.26
$
1,77
6,02
9.64
$
Total liabilities and stockholders equity
$1,386,948
$1,312,944
$1,309,448
$1,310,145
$1,388,066
$1,431,759
100.
00%
1,56
6,66
4.26
$
1,
613,
664.
19$
1,66
2,07
4.11
$
1,71
1,93
6.34
$
1,76
3,29
4.43
$
1,81
6,19
3.26
$
1,
870,
679.
06$
1,92
6,79
9.43
$
1,98
4,60
3.41
$
2,04
4,14
1.52
$
ROE
9.46
%15
.83%
16.1
6%18
.13%
19.7
3%21
.24%
19.6
1%18
.30%
17.2
3%16
.34%
15.5
8%14
.92%
14.3
5%13
.84%
13.6
1%
% ch
ange
of R
OE67
.28%
2.07
%12
.22%
8.78
%-7
.68%
-6.6
8%-5
.84%
-5.1
8%-4
.64%
-4.2
1%-3
.85%
-3.5
6%-1
.62%
TL/S
E2.
0646
3145
71.
5439
0802
1.21
0646
981.
4138
8808
51.
3943
4836
51.
4798
6760
31.
341.
100.
910.
750.
610.
500.
390.
300.
220.
15
Actu
al Fi
nanc
ial S
tate
men
tsFo
reca
sted

110 | P a g e
Com
mon
Size
Bal
ance
She
et (A
djus
ted)
Assu
me
Aver
age
2008
2009
2010
2011
2012
2013
2014
2015
2016
2017
2018
2019
2020
2021
2022
2023
Asse
ts
Current assets:
Cash and cash equivalents
5.61
%6.
23%
3.68
%6.
02%
4.31
%5.
17%
4.15
%4.
23%
4.32
%4.
41%
4.51
%4.
60%
4.70
%4.
80%
4.90
%5.
00%
Investments and marketable securities
Accounts receivable
0.86
%1.
24%
0.87
%1.
05%
0.70
%0.
94%
Income tax receivable
Other receivables
2.09
%2.
08%
2.45
%3.
47%
3.87
%2.
79%
Inventories
1.69
%1.
76%
2.15
%2.
08%
2.48
%2.
03%
1.91
%1.
95%
2.00
%2.
00%
2.00
%1.
96%
1.97
%1.
98%
1.98
%1.
98%
Prepaid expenses
2.12
%2.
16%
2.79
%2.
87%
2.98
%2.
58%
Deferred income taxes
Total current assets
13.1
2%14
.21%
13.4
6%16
.58%
15.7
8%14
.63%
14.6
3%14
.63%
14.6
3%14
.63%
14.6
3%14
.63%
14.6
3%14
.63%
14.6
3%14
.63%
Property and equipment, net
60.0
5%57
.69%
57.8
9%55
.07%
55.5
5%57
.25%
57.2
5%57
.25%
57.2
5%57
.25%
57.2
5%57
.25%
57.2
5%57
.25%
57.2
5%57
.25%
CAP OL RIGHTS
20.2
7%21
.46%
21.9
5%21
.32%
21.4
9%21
.30%
0.00
%0.
00%
0.00
%0.
00%
0.00
%0.
00%
0.00
%0.
00%
0.00
%0.
00%
Other assets:
2.10
%2.
44%
1.79
%2.
08%
2.59
%2.
20%
Intangible assets, net
0.33
%0.
34%
1.12
%1.
28%
1.30
%0.
88%
Prepaid rent
4.13
%3.
85%
3.78
%3.
66%
3.29
%3.
74%
Other
2.10
%2.
44%
1.79
%2.
08%
2.59
%2.
20%
Total other assets
6.56
%6.
63%
6.69
%7.
03%
7.18
%6.
82%
Total Noncurrent Assets
86.2
9%86
.88%
85.7
9%86
.54%
83.4
2%85
.78%
Total assets
100.
00%
100.
00%
100.
00%
100.
00%
100.
00%
100.
00%
LIABILITIES AND STOCKHOLDERS EQUITY
Current liabilities:
Accounts payable
3.63
%4.
10%
5.04
%6.
12%
4.38
%4.
66%
Income tax payable
Other accrued expenses
20.9
0%23
.71%
24.3
8%25
.34%
26.7
8%24
.22%
Total current liabilities
25.1
6%28
.27%
29.0
9%31
.30%
30.9
3%28
.95%
29.3
4%31
.95%
35.4
7%38
.89%
44.0
8%50
.36%
59.2
7%71
.78%
91.3
2%12
7.67
%
Deferred income taxes
10.9
2%12
.12%
13.5
4%11
.36%
11.3
8%11
.87%
Deferred rent
8.06
%9.
38%
9.09
%9.
42%
8.74
%8.
94%
Deemed landlord financing liability
6.50
%7.
24%
7.18
%6.
82%
7.75
%7.
10%
Long term debt
12.5
5%12
.55%
Other noncurrent liabilities
3.40
%3.
80%
3.63
%4.
49%
5.20
%4.
10%
CAP OL LIAB
33.4
1%39
.19%
37.4
7%36
.61%
36.0
1%36
.54%
Total noncurrent Liabilities
74.8
4%71
.73%
70.9
1%68
.70%
69.0
7%71
.05%
70.6
6%68
.05%
64.5
3%61
.11%
55.9
2%49
.64%
40.7
3%28
.22%
8.68
%-2
7.67
%
Total Liabilities
100.
00%
100.
00%
100.
00%
100.
00%
100.
00%
100.
00%
100.
00%
100.
00%
100.
00%
100.
00%
100.
00%
100.
00%
100.
00%
100.
00%
100.
00%
100.
00%
Tota
l Lia
bilit
ies t
o To
tal L
&E
60.6
9%54
.76%
58.5
7%58
.23%
59.6
8%58
.39%
57.2
6%52
.47%
47.6
7%42
.87%
38.0
5%33
.19%
28.3
0%23
.36%
18.3
6%13
.12%
Stockholders equity:
Preferred stock, $.01 par value, 5,000,000
shares authorized; none issued
Junior participating cumulative preferred
stock, $.01 par value, 150,000 shares authorized; none
0.16
%0.
14%
0.16
%0.
15%
0.16
%0.
15%
issued
Common stock, $.01 par value, 250,000,000
76.3
6%76
.76%
62.3
4%61
.09%
59.3
3%67
.18%
67.1
8%67
.18%
67.1
8%67
.18%
67.1
8%67
.18%
67.1
8%67
.18%
67.1
8%67
.18%
shares authorized; 90,632,325 and 87,812,022
shares issued at December 31, 2013 and January 1,
48.7
1%55
.08%
62.3
6%65
.02%
69.1
1%60
.06%
2013, respectively
Additional paid-in capital
Retained earnings
98.0
8%94
.25%
134.
58%
143.
48%
175.
88%
129.
26%
146.
80%
123.
78%
105.
20%
89.9
2%77
.15%
66.3
5%57
.13%
49.1
8%42
.28%
36.1
8%
Accmulated other comprehensive loss
Treasury stock 38,865,951 and 34,414,222
shares at cost at December 31, 2013 and January 1,
2013, respectively
Total stockholders equity
100.
00%
100.
00%
100.
00%
100.
00%
100.
00%
100.
00%
100.
00%
100.
00%
100.
00%
100.
00%
100.
00%
100.
00%
100.
00%
100.
00%
100.
00%
100.
00%
Equity to Total L&E
39.3
1%45
.24%
41.4
3%41
.77%
40.3
2%41
.61%
42.7
4%47
.53%
52.3
3%57
.13%
61.9
5%66
.81%
71.7
0%76
.64%
81.6
4%86
.88%
Total liabilities and stockholders equity
100.
00%
100.
00%
100.
00%
100.
00%
100.
00%
100.
00%
100.
00%
100.
00%
100.
00%
100.
00%
100.
00%
100.
00%
100.
00%
100.
00%
100.
00%
100.
00%
Cons
olid
ated
Fina
ncia
l Sta
tem
ents
Fore
cast
ed

111 | P a g e
Statement of Cash Flows
The last part of forecasting financial statements is calculating the
statement of cash flows. The statement of cash flows is made up of sections
including: cash flows from operating activities or CFFO, cash flows from investing
activities or CFFI, and cash flows from financing activities or CFFF. In general,
cash flows are naturally volatile, making the statement of cash flows the most
difficult to predict.
In order to forecast cash flows from operations there are three different
ratios we can use: the CFFO/Sales ratio, the CFFO/Operating Income ratio, and
the CFFO/Net Income ratio. In terms of the least volatile, we have chosen the
CFFO/Net Income method. This method forecasts our CFFO at $46,997.37 for
2014 and $62,178.16 for 2023.

112 | P a g e
Chee
seca
ke C
ash
Flow
s2008
2009
2010
2011
2012
2013
Assu
me
2014
2015
2016
2017
2018
2019
2020
2021
2022
2023
Cash flows from operating activities:
Net income
$52,293
$42,833
$81,713
$95,720
$98,423
$114,356
Adjustments to reconcile net income to
cash provided by operating activities:
Depreciation and amortization
73,290
75,184
72,140
71,958
74,433
78,558
Impairment of assets
2,952
26,541
1,547
5,469
3,294
Realized loss on derivative financial
7,421
7,376
instruments
Deferred income taxes
22,179
(4,798)
(4,087)
7,907(12,758)
4,633
Stock-based compensation
13,132
14,610
10,913
9,635
10,838
14,135
Tax impact of stock options exercised,
(822)
(1,117)
233
844
2,435
7,159
net of cancellations
Excess tax benefit related to stock options
(410)
(857)
(3,357)
(741)
(2,801)
(7,765)
exercised
Other
(145)
1,957
178
1,023
1,259
(464)
Changes in assets and liabilities:
Change in Current Assets
(17,992)
13,825
(9,657)
53,812
(4,304)
Change in PPE, net
(72,087)
(32,934)
3,035
5,915
30,961
Accounts receivable
(1,190)
1,185
(4,832)
4,850
(3,224)
4,477
Other receivables
28,224
5,346
179
(4,800)(16,004)
(6,486)
Inventories
926
930
(834)
(5,174)
(626)
(6,642)
Prepaid expenses
3,225
(3,217)
(474)
(8,153)
(3,389)
(2,708)
Other assets
2,654
5,013
(1,259)
(545)
(6,533)
(3,997)
Accounts payable
(20,047)
(3,927)
(1,297)
3,508
10,839
(11,580)
Income taxes payable
(9,281)
7,865
(1,964)
(1,632)
6,685
(5,742)
Termination of derivative financial instruments
(7,421)
(7,376)
Other accrued expenses
2,205
29,587
17,984
20,117
30,325
23,557
Aver
age
Cash provided by operating activities
169,185
197,135
165,236
196,064
195,371
204,785
Ni M
etho
d2.
6146
,997
.37
$
36,4
61.4
9$
39
,052
.82
$
41
,772
.44
$
44,6
25.8
9$
47,6
18.9
4$
50
,757
.61
$
54
,048
.13
$
57,4
97.0
0$
62
,178
.16
$
OP
Met
hod
1.68
$99,
698.
55$1
03,4
77.6
7$1
06,7
80.7
3$1
10,1
89.2
3$1
13,7
06.5
2$1
17,3
36.0
9$1
21,0
81.5
2$1
24,9
46.5
1$1
28,9
34.8
6$1
33,0
50.5
3
Cash flows from investing activities:
Additions to property and equipment
(84,907)
(37,243)
(41,847)
(76,746)(86,442)
(106,289)
Sales of available-for-sale securities
11,469
1,000
Additons to intangible assets
(870)
(1,712)
(1,654)
Cash used in investing activities
(73,438)
(36,243)
(41,847)
(77,616)(88,154)
(107,943)
Cash flows from financing activities:
Deemed landlord financing proceeds
17,862
6,354
4,198
5,070
2,098
13,672
Deemed landlord financing payments
(1,247)
(1,436)
(1,529)
(1,687)
(1,887)
(2,143)
Proceeds from exercise of employee stock
2,669
1,683
30,577
16,146
39,283
72,896
options
Excess tax benefit related to stock options
410
857
3,357
741
2,801
7,765
exercised
Cash Dividends Paid
(12,762)
(27,191)
(Repayment) /borrowings on credit facility
100,000
(175,000)
(100,000)
Purchase of treasury stock
(172,459)
(52,088)
(172,126)########
(183,659)
Capital contribution
516
Cash used in financing activities
(52,249)
(167,542)
(115,485)
(151,856)(71,859)
(118,660)
Aver
age
CF
FO
/Sal
es9.49
8.13
10.04
8.96
9.26
9.17
Sale
s met
hod
9.18
CF
FO
/Net
Inco
me
3.24
4.60
2.02
2.05
1.99
1.79
NI I
ncom
e M
etho
d2.
61
CF
FO
/Op
erat
ing
Inco
me
1.94
2.67
1.29
1.47
1.41
1.27
OP
INC
MET
HOD
1.68
Div
iden
d P
ayo
ut
(12,762)
(27,191)
11.7
9%(3
0,39
8.00
)$
(33,983)
(37,991)
(42,472)
(47,481)
(53,082)
(59,342)
(66,341)
(74,166)
(82,913)
Net change in cash and cash equivalents
43,498
(6,650)
7,904
(33,408)
35,358
(21,818)
Cash and cash equivalents at beginning
36,867
80,365
73,715
81,619
48,211
83,569
of period
Cash and cash equivalents at end of period
$80,365
$73,715
$81,619
$48,211
$83,569
$61,751

113 | P a g e
Co
mm
on
Siz
e C
as
h F
low
s2
00
82
00
92
01
02011
2012
2013
Ne
t In
co
me
30
.91
%2
1.7
3%
49
.45
%4
8.8
2%
50
.38
%5
5.8
4%
Ad
justm
ents
to
re
co
ncile
ne
t in
co
me
to
ne
t ca
sh b
y O
pe
rating
Activitie
s
Lo
ss o
n w
rite
do
wn o
f no
n-c
ash inve
stm
ent
De
pre
cia
tio
n a
nd
am
ort
iza
tio
n4
3.3
2%
38
.14
%4
3.6
6%
36
.70
%3
8.1
0%
38
.36
%
De
ferr
ed
Inco
me
Ta
xe
s1
3.1
1%
-2.4
3%
-2.4
7%
4.0
3%
-6.5
3%
2.2
6%
Sto
ck B
ase
d C
om
pe
nsa
tio
n7
.76
%7
.41
%6
.60
%4
.91
%5
.55
%6
.90
%
Exce
ss ta
x b
ene
fit fr
om
sto
ck--
ba
se
d c
om
pe
nsa
tio
n-0
.24
%-0
.43
%-2
.03
%-0
.38
%-1
.43
%-3
.79
%
Ta
x b
ene
fit fr
om
exe
rcis
e o
f S
tock o
ptio
ns
-0.4
9%
-0.5
7%
0.1
4%
0.4
3%
1.2
5%
3.5
0%
Oth
er
no
n-c
ash ite
ms
-0.0
9%
Cha
ng
es in A
sse
ts a
nd
Lia
bilitie
s:
-9.1
3%
8.3
7%
-4.9
3%
27
.54
%-2
.10
%
Change in Current Assets
-36
.57
%-1
9.9
3%
1.5
5%
3.0
3%
15
.12
%
Change in PPE, net
A
cco
unts
Re
ce
iva
ble
s-0
.70
%0
.60
%-2
.92
%2
.47
%-1
.65
%2
.19
%
In
ve
nto
rie
s0
.55
%0
.47
%-0
.50
%-2
.64
%-0
.32
%-3
.24
%
P
rep
aid
exp
ense
s a
nd
oth
er
asse
ts1
.91
%-1
.63
%-0
.29
%-4
.16
%-1
.73
%-1
.32
%
A
cco
unts
Pa
ya
ble
-11
.85
%-1
.99
%-0
.78
%1
.79
%5
.55
%-5
.65
%
A
ccru
ed
exp
ense
s1
.30
%1
5.0
1%
10
.88
%1
0.2
6%
15
.52
%1
1.5
0%
In
co
me
Ta
xe
s P
aya
ble
D
efe
rre
d C
onstr
uctio
n A
llow
ance
s
D
effe
red
Re
ve
nue
and
oth
er
Lia
bilitie
s
Ne
t C
as
h p
rov
ide
d b
y O
pe
rati
ng
Ac
tiv
itie
s1
00
.00
%1
00
.00
%1
00
.00
%1
00
.00
%1
00
.00
%1
00
.00
%
Cash flows from investing activities:
Additions to property and equipment
11
5.6
2%
10
2.7
6%
10
0.0
0%
98
.88
%9
8.0
6%
98
.47
%
Sales of available-for-sale securities
-15
.62
%-2
.76
%
Additons to intangible assets
0.0
0%
0.0
0%
0.0
0%
1.1
2%
1.9
4%
1.5
3%
Cash used in investing activities
10
0.0
0%
10
0.0
0%
10
0.0
0%
10
0.0
0%
10
0.0
0%
10
0.0
0%
Cash flows from financing activities:
Deemed landlord financing proceeds
-34
.19
%-3
.79
%-3
.64
%-3
.34
%-2
.92
%-1
1.5
2%
Deemed landlord financing payments
2.3
9%
0.8
6%
1.3
2%
1.1
1%
2.6
3%
1.8
1%
Proceeds from exercise of employee stock
-5.1
1%
-1.0
0%
-26
.48
%-1
0.6
3%
-54
.67
%-6
1.4
3%
options
Excess tax benefit related to stock options
-0.7
8%
-0.5
1%
-2.9
1%
-0.4
9%
-3.9
0%
-6.5
4%
exercised
Cash Dividends Paid
0.0
0%
0.0
0%
0.0
0%
0.0
0%
17
.76
%2
2.9
2%
(Repayment) /borrowings on credit facility
-19
1.3
9%
10
4.4
5%
86
.59
%0
.00
%0
.00
%0
.00
%
Purchase of treasury stock
33
0.0
7%
45
.10
%1
13
.35
%1
41
.10
%1
54
.78
%
Capital contribution
-0.9
9%
Cash used in financing activities
10
0.0
0%
10
0.0
0%
10
0.0
0%
10
0.0
0%
10
0.0
0%
10
0.0
0%
Net change in cash and cash equivalents
25
.71
%-3
.37
%4
.78
%-1
7.0
4%
18
.10
%-1
0.6
5%
Cash and cash equivalents at beginning
21
.79
%4
0.7
7%
44
.61
%4
1.6
3%
24
.68
%4
0.8
1%
of period
Cash and cash equivalents at end of period
47
.50
%3
7.3
9%
49
.40
%2
4.5
9%
42
.77
%3
0.1
5%

114 | P a g e
Restated Financial Statements
After restating the financial statements for The Cheesecake Factory we
have found no significant changes to the income statement or balance sheet.
Because The Cheesecake Factory Inc. is a low-quality, low disclosure company
they do not disclose goodwill, therefore there is no change to the balance sheet
or income statement that is needed. Also, capitalization of operating leases is an
immaterial amount in regards to restatements
Cost of Capital Estimation
To value to the firm, we must estimate the cost of financing Cheesecake
Factory. To find an estimate for cost we must understand where the capital
comes from and it’s cost. Capital derives from either debt or equity. Debt being
money borrowed with intentions of principal being paid back plus interest. And
equity is a share of ownership in the company. There is no principal and interest
due to the investor, only the intention of growth in the shares and possibly a
dividend being paid out. We will calculate a cost of capital called WACC, or
weighted average cost of capital. This is an expected rate of return on a source
of capital that can be compared to competitors within the industry. We will take
this discount rate and discount the firm’s financials. We will now go in depth
about the cost of debt and cost of equity for Cheesecake Factory.

115 | P a g e
Cost of Debt
First step is to calculate the cost of debt. The rate that cheesecake factory
is paying in order to finance their debt that is paid to them. Debt can be a simple
loan from a bank that does not take control of the company from the existing
management. Cheesecake Factory has historically rarely used a large amount of
debt to finance their business. The past couple of years there has been nothing
for long and short term debt. However, in the most recent quarter, April 1st
2014, announced $25 million of debt has been reported.
Cheesecake Factory poorly discloses information that could allow us to
accurately estimate their weighted cost of debt. Unfortunately, the necessary
information regarding the interest rate used for their recent outstanding debt
fails to be present in Cheesecake Factory’s recent 10-K.
There a small disclaimer that describes the options of how Cheesecake
Factory can choose a rate to finance interest bearing liabilities.
“Borrowings under the Facility bear interest, at our option, at a rate equal to
either (i) the Adjusted LIBOR Rate plus a margin ranging from 1.00% to1.75%
based on our Net Adjusted Leverage Ratio or (ii) the highest of (a) the rate of
interest publicly announced by JPMorgan Chase Bank as its prime rate ineffect,
(b) the Federal Funds Effective Rate from time to time plus 0.5% or (c) the one-
month Adjusted LIBOR Rate plus 1.0%, plus a margin ranging from0.00% to
0.75% based on our Net Adjusted Leverage Ratio.” (Cheesecake Factory 10-Q)

116 | P a g e
There is no specific information related to the $25 million debt, so it up to
us to choose an appropriate interest rate. We looked at the possibilities and
decided to use the JP Morgan prime rate that is in effect. The current prime rate
is 3.25%
(Table 1)
(Table 2)
We then restated the cost of debt and included the capitalized operating
leases, seen on Table 2 shown above. The interest rate we calculated for
capitalize operating leases is 6.47%, which is an average of the last 6 years
interest rates. We derived the interest rates by taking our total rent expenses
and dividing them by the total sales. We then divided the amounts of the debt
by the total amount of debt to get each weight.
Once we found the weights, we multiplied the weights to the
corresponding interest rates, giving us .244% and 5.984%. Finally, we added
them together to get a 6.23% weighted cost of debt. Here we see a cost of debt
nearly doubled after the restatement. The restatement affects our view of cost of
debt.
Interest Bearing Liabilities Amount (Thousands) Interest Rate Weight Source Weight*Rate Kd
Long Term Debt $25,000 3.25% 100% 10-Q Cheesecake 3.25%
3.25% Weighted Cost of Debt
The Cheesecake Factory's Cost of Debt - As stated
Interest Bearing Liabilities Amount (Thousands) Interest Rate Weight Source Weight*Rate Kd
Long Term Debt $25,000 3.25% 7.52% 10-Q Cheesecake 0.244%
Capitalized Operating Leases $307,645 6.47% 92.48% 10-K Cheesecake 5.984%
$332,645 6.23% Weighted Cost of Debt
The Cheesecake Factory's Cost of Debt - Restated

117 | P a g e
Cost of Equity
The next step in the process of estimating the cost of capital is developing
a cost of equity. The cost of equity is the required rate of return that investors
and shareholders expect to earn for investing in the firm. This rate is a measure
of risk that people expect to take on for the investment they intend to pursue in
a specific company. To calculate the expected rate of return we will use the
CAPM formula or formally known as the Capital Asset Pricing Model. The CAPM
model requires three variables to develop a measure for cost of equity: a risk
free rate, a beta, and market risk premium or market risk minus risk free rate.
The formula is structured as follows:
Ke = Rf + B ( Rm – Rf)
In order to estimate a risk free rate, we took historical yields from 10
year, 7 year, 2 year, 1 year, and 3 months treasury yields. We took the yields
from different timeframes to see the stability over both the short and long term.
The numbers we acquired from the Federal Reserve Bank of St. Louis site
(FRED) were annualized rates. We divided each rate by 1200 to bring the 10
year yield to a monthly basis. This provided better accuracy for our estimation of
a risk free rate that applies to Cheesecake Factory.
We also recorded historical monthly prices for the S&P 500 from Yahoo
Finance. These numbers will represent the market return that investors or
shareholders can expect to earn in addition to the risk free returns. This was
calculated simply by reducing the market premium (Rm)) by the risk free rate(Rf))
the correspond with same month.
The last remaining variable of the formula is Beta. Beta is listed on Yahoo
Finance as .91, but we don’t know how they got their beta. Therefore, we had to
find a reasonable estimation for beta. We developed our estimation through a

118 | P a g e
series of regressions. We conducted 5 regressions for each Treasury bond (3
month, 1 year, 2 year, 7 year, and 10 year) with each one varied 12 months
apart. This is good because it shows long and short term stability.
Above are the 25 regressions for Cheesecake Factory. We used the 2.56%
risk free rate from the 2014 10 year Treasury bill in all of our regressions. The
table lists beta’s that correlate R2 information and other useful numbers that can
help calculate a number for cost of equity. Highlighted in each regression is the

119 | P a g e
largest number of r-squared. The larger the percentage for r-squared is
significant because, the higher the number the more likely the security will move
due to the systematic risk. When we analyze The Cheesecake Factory’s data, we
saw that the highest R2 of 45.12% is present in the 7 year regression for the 72
month period. However, we decided to use the 36 month cost of equity with a
cost of capital of 11.68%. This is the post-recession era and provides for more
stable results. Our backdoor cost of equity also falls within the upper and lower
bounds. Because of these two reasons we have decided to choose 11.68% cost
of equity.
From there we can use CAPM to give us a cost of equity (Ke) of 15.66%.
We did this by taking our 10 year risk free rate and adding it to the product of
our 8%MRP and our Beta of 1.637. This can be interpreted as the required rate
of return for an investor of no less than 15.22%.
Next, we used Table 8-5 (Palepu) to determine the size premium that we
adjusted to Cheesecake Factory’s cost of equity. Throughout history, smaller
stocks have been more risky and generated higher returns than larger stocks.
This could lead some to assuming that CAPM formula comes with some
inaccuracy. To compensate for the “size effect” we added on the size premium
for good measure. We can estimate the appropriate size premium through the
Palepu table of historical data. It shows that larger companies often have lower
returns and beta rather than smaller stocks. The reasoning behind this pattern is
still unknown but fits well for our valuation of Cheesecake Factory.
We must first formulate the market value of the company. This is done by
multiplying the number of shares outstanding to the current price of a share.
𝑴𝑽 = (# 𝒐𝒇 𝒐𝒖𝒕𝒔𝒕𝒂𝒏𝒅𝒊𝒏𝒈 𝒔𝒉𝒂𝒓𝒆𝒔 ∗ 𝑪𝒖𝒓𝒓𝒆𝒏𝒕 𝒔𝒉𝒂𝒓𝒆 𝒑𝒓𝒊𝒄𝒆)
$2,250,780,000 = 48,300,000 X $46.60
We have calculated that Cheesecake Factory’s market value is roughly
$2.25 billion. Now, we take the market value and see what its corresponding
decile is.

120 | P a g e
Clearly Cheesecake Factory falls in the size 6 decile category. The
corresponding size premium in 6th decile is 1.8%. We added the size premium to
the cost of equity we previously estimated with the CAPM method, 15.22%. We
then have a two factor cost of equity of 17.02%. The cost of equity lower and
upper bounds from the year 7 regression are 11.77% and 18.66%. The
estimated two factor cost of equity will soon be used to help calculate
Cheesecake Factory’s WACC, weighted average cost of capital.
Backdoor Cost of Equity
We also performed another way to calculate the cost of equity. The
backdoor method is unlike the CAPM model because it is a total risk measure.
CAPM is just a systematic risk measurement. The formula is listed below and
includes the price to book ratio, growth rate from Cheesecake’s IGR, and the
return on equity. We used the average of the forecasted IGR for 10 years on a
stated and restated basis for our growth rate. The internal growth rate is where
no external financing of any sort is obtained, as opposed to the sustainable

121 | P a g e
growth rate where equity financing cannot be obtained. We wanted to use the
IGR because it was the more conservative growth rate, and because it included
ROA, which changed when we add the capitalization of the leases. We calculated
IGR and SGR by using the following equations:
The price to book ratio is currently 4.49 on Yahoo Finance. The ROE, on
both a stated and restated basis, is 16.50%. This is the average of all the ROE
forecasted for the next 10 years taken from the forecast. The growth rate is the
average of the 10 year forecast for the stated and restated IGR, which is 9.19%
and 6.87%, respectively.
(𝑃𝑟𝑖𝑐𝑒
𝐵𝑜𝑜𝑘) = 1 + (
𝑅𝑂𝐸−𝐾𝑒
𝐾𝑒−𝑔)
In essence, this formula states that the price to book ratio equals the
market share price of the firm (the 1 in the equation) plus the firm’s growth
potential,(𝑅𝑂𝐸−𝐾𝑒
𝐾𝑒−𝑔). Inside the parenthesis of the growth potential would be 4.46-
1=3.46, indicating that the firm has huge growth potential.
ROE Price/Book IGR Growth Backdoor Ke
As Stated 16.50% 4.49 9.19% 10.81%
The Cheesecake Factory Backdoor Cost of Equity
ROE Price/Book IGR Growth Backdoor Ke
Restated 16.50% 4.49 6.87% 9.01%
The Cheesecake Factory Backdoor Cost of Equity

122 | P a g e
After calculating the as stated backdoor cost of equity, we decided to do a
restated backdoor too. We restated IGR because this affects our total ROA,
which ultimately affects our IGR growth. We ran an as stated and a restated
analysis of the backdoor cost of equity, restating the IGR growth. The as stated
and restated backdoor costs of equity are 10.81% and 9.01%, respectively.
These both fall within the parameters of our CAPM approach.
Weighted Average Cost of Capital (WACC)
The weighted average cost of capital displays both the required rate of
return for investors, and the firm’s average costs in order to finance debt or
equity. By taking the weight of the market value of liabilities and the market
value of the firm and multiplying them by their cost of debt and equity values,
we were able to come up with the average return that is required by all
shareholders and investors. Below are the formulas we used to calculate the
WACC for before tax and after taxes:
𝑊𝐴𝐶𝐶𝑏𝑡 = ((𝑀𝑉𝐷
𝑀𝑉𝐹) 𝐾𝑑) + ((
𝑀𝑉𝐸
𝑀𝑉𝐹) 𝐾𝑒)
𝑊𝐴𝐶𝐶𝑎𝑡 = ((𝑀𝑉𝐷
𝑀𝑉𝐹) 𝐾𝑑) + ((
𝑀𝑉𝐸
𝑀𝑉𝐹) 𝐾𝑒) + (1 − 𝑇𝑎𝑥𝑟𝑎𝑡𝑒)
To get the as stated market value of debt, we took the 25 million in debt
(assuming its interest bearing.) The market value of equity is calculated by
taking the number of outstanding shares and the stock price listed on Yahoo
Finance, and multiplying them together. After adding the values of market
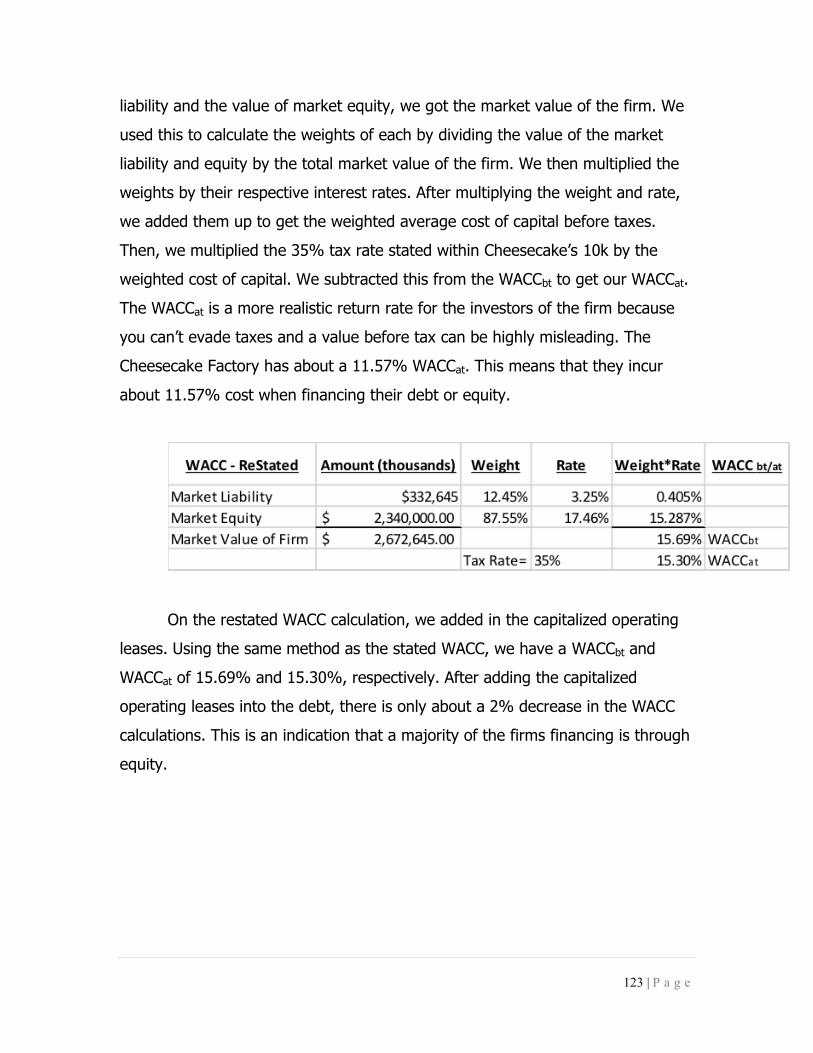
123 | P a g e
liability and the value of market equity, we got the market value of the firm. We
used this to calculate the weights of each by dividing the value of the market
liability and equity by the total market value of the firm. We then multiplied the
weights by their respective interest rates. After multiplying the weight and rate,
we added them up to get the weighted average cost of capital before taxes.
Then, we multiplied the 35% tax rate stated within Cheesecake’s 10k by the
weighted cost of capital. We subtracted this from the WACCbt to get our WACCat.
The WACCat is a more realistic return rate for the investors of the firm because
you can’t evade taxes and a value before tax can be highly misleading. The
Cheesecake Factory has about a 11.57% WACCat. This means that they incur
about 11.57% cost when financing their debt or equity.
On the restated WACC calculation, we added in the capitalized operating
leases. Using the same method as the stated WACC, we have a WACCbt and
WACCat of 15.69% and 15.30%, respectively. After adding the capitalized
operating leases into the debt, there is only about a 2% decrease in the WACC
calculations. This is an indication that a majority of the firms financing is through
equity.

124 | P a g e
WACC-LB ReStated Amount (thousands) Weight Rate Weight*Rate WACC bt/at
Market Liability $332,645 12.45% 3.25% 0.405%
Market Equity $ 2,340,000.00 87.55% 12.21% 10.690%
Market Value of Firm $ 2,672,645.00 11.09% WACCbt
Tax Rate= 35% 10.70% WACCat
WACC-UB ReStated Amount (thousands) Weight Rate Weight*Rate WACC bt/at
Market Liability $332,645 12.45% 3.25% 0.405%
Market Equity $ 2,340,000.00 87.55% 19.10% 16.723%
Market Value of Firm $ 2,672,645.00 17.13% WACCbt
Tax Rate= 35% 16.73% WACCat
WACC-UB Stated Amount (thousands) Weight Rate Weight*Rate WACC bt/at
Market Liability $ 25,000.00 1.06% 3.25% 0.034%
Market Equity $ 2,340,000.00 98.94% 19.10% 18.898%
Market Value of Firm $ 2,365,000.00 18.93% WACCbt
Tax Rate= 35% 18.91% WACCat
WACC-LB Stated Amount (thousands) Weight Rate Weight*Rate WACC bt/at
Market Liability $ 25,000.00 1.06% 3.25% 0.034%
Market Equity $ 2,340,000.00 98.94% 12.21% 12.081%
Market Value of Firm $ 2,365,000.00 12.12% WACCbt
Tax Rate= 35% 12.09% WACCat
By using the 95% confidence level of the cost of equity, we created 4
charts showing the upper and lower bounds for calculating WACC on a stated
and restated basis. On a Stated basis, the upper and lower bound of WACCat are
18.91% and 12.09%. The upper and lower bound of WACCat on a restated basis
are 16.73% and 10.70%. Both give a larger margin for our discount rate than
the Ke calculation that provided a high of 17.29% and a low of 15.30%. We
firmly believe somewhere within the upper and lower bound of the restated
WACCat, 16.73% and 10.70%, is where the most realistic weighted average cost
of capital lies.

125 | P a g e
Valuation Analysis
Now that we have analyzed the industry, the accounting strategies, and
financials, we have valued the company. We used two main methods to value
The Cheesecake Factory, market comparative valuation and intrinsic valuation.
While intrinsic valuation method is what we consider the more important method
of valuation, the market valuation method still holds significant value. The
comparative valuation method utilizes competitor numbers along with The
Cheesecake Factory's numbers to obtain a price the company should be selling at
on the market.
Comparative Valuation Table
Ratio Market Value
at 6/1/2014
Should sell for
at 6/1/2014
Overpriced/Underpriced/Fairly
Valued
Trailing P/E 45.87 39.52 Overpriced
Forward P/E 45.87 34.79 Overpriced
P/B 45.87 39.94 Overpriced
PEG 45.87 38.87 Overpriced
P/EBITDA 45.87 49.12 Fairly Valued
EV/EBITDA 45.87 57.89 Underpriced
When making these valuations we consider ourselves to be 10% analysts.
The prices derived change pretty dramatically from ratio to ratio but a trend can
be found. The majority of the ratios depict that The Cheesecake Factory is
currently overpriced. Below we look into more detail on each of these ratios.

126 | P a g e
Brinker 20.4 Average 19.19
Darden 18.71 CAKE EPS 2.06
BJ's 58.15 Should sell 39.52
McDonalds 18.45 Value Overvalued
Competitors Results
Brinker 16.13 Average 16.89
Darden 18.32 CAKE EPS 2.06
BJ's 37.92 Should sell 34.79
McDonalds 16.22 Value Overvalued
Competition Results
Trailing P/E
To get the trailing P/E ratio we took the trailing P/E of The Cheesecake
Factory’s competitors and obtained an industry average after taking out any
outliers. From that we multiplied the industry average by CAKE’s earnings per
share to obtain the price that the company should sell for. When we did this we
obtained a should sell for price of 39.52 which, once compared to the market
value at 6/1/2014 of 45.87, showed that The Cheesecake Factory is overvalued.
Forward P/E
In order to get the forward P/E we follow the same method as trailing P/E
by taking a forward P/E industry average after removing outliers. The price
obtained from the forward P/E shows a value of 34.79 which, compared to the
market value price at 6/1/2014, shows that The Cheesecake Factory is once
again overvalued. The only issue with the forward P/E model is that it relies on
the forecasts of each company which, as stated previously, is highly likely to
have errors. This makes this model less accurate because the forecasting error
that is likely present in the forward P/E will affect the price that comes out of the
model.

127 | P a g e
BJ's 2.44 Average 3.84
McDonalds 6.22 BV/S 10.4
Brinker 37.72 Should sell 29.94
Darden 2.86 value Overvalued
Competitors Results
P/B ratio
The P/B method gives us a price in a slightly more complicated manner.
Once again we obtained an industry average by getting the average of each
relevant competitor’s P/B and then multiplying that average by CAKE’s book
value/share. That result gave us a price that CAKE should sell for of 39.94 which
once compared to the market value at 6/1/2014 resulted in CAKE being
overpriced. This model is more reliable than the forward P/E model because it
does not require forecasting to obtain an accurate value.
Dividends/P
We chose not to calculate this ratio for two reasons. The first was a lack
of reliable information of the dividends paid by The Cheesecake Factory since the
company has only been paying dividends for 1.5 periods and we determined that
was not enough time to make a valuation estimate with. The second reason was
because the companies that make up the industry have substantially differing
dividends and we could not get an accurate average or price with the dividend
values provided.

128 | P a g e
Average 2.1
Brinker 1.42 CAKE g 9
Darden 207.9 CAKE EPS 2.06
McDonalds 2.31 Should sell 38.87
BJ's 2.56 value Overvalued
Competition Results
PEG
The PEG value is determined through the following equation:
(P/E)/g=PEG. In order to obtain a price from PEG we must take the PEG
industry average after removal of outliers. From there we need to multiply that
value by CAKE’s PEG growth rate and then once more by CAKE’s EPS. The issue
with that is PEG is determined off of a 5 year growth rate so in order to find the
proper growth rate we had to look at the forecasts for future sales for CAKE.
After looking at the forecasts we obtained a PEG growth rate of 9%. After
multiplying the average by the growth and then multiplying that product by the
CAKE EPS we obtained a price CAKE should sell at of 38.87 which results in CAKE
being overpriced. The issue with this model is the same as the issues with the
forward P/E model in that it takes forecasting into consideration way too much.
This can result in error due to the nature of forecasting.
P/EBITDA
P/EBITDA is determined by taking the P/EBITDA industry average after
removal of outliers and multiplying that number by CAKE’s EBITDA/CAKE’s
shares outstanding. In order to get the P/EBITDA for a company we multiplied
Competitors Market Cap EBITDA P/EBITDA
Average 10.10
Brinker 3,200,000,000 420,000,000 7.62 CAKE EBITDA 235,000,000
Darden 6,170,000,000 631,600,000 9.77 Shares outstanding 48,300,000
McD 100,280,000,000 10,130,000,000 9.90 Should sell for 49.12
BJ's 1,000,000,000 76,370,000 13.09 Value Fair
Results

129 | P a g e
Average 11.86
BJ's 12.65 CAKE EBITDA 235.8 M
McDonalds 11.05 shares outstanding 48.3 M
Brinker 9.73 should sell 57.89
Darden 14 value Undervalued
Competitors Results
the EBITDA by the market cap. This gives us a price that should be sold at
49.12 which results in CAKE being fairly priced. The only issue with this model is
that it does not include income tax, depreciation, or amortization in the
determining of the price which can overstate the price since expenses are left in.
EV/EBITDA
EV/EBITDA is determined in the exact same way as P/EBITDA except it
takes the EV/EBITDA industry average after removal of outliers. After
calculations we obtained a price to sell at of 57.89 which results in CAKE being
undervalued. This method has the same problems as above in that it neglects to
take into account important expenses which skew the results into becoming a
higher price due to the lesser expense costs.
Intrinsic Valuation Models
Although the method of comparables provides us, the financial analysts,
with a method to value stocks, the relevancy and accuracy of these methods is
often questionable. The method provides coarse views of pricing, with reliability
being an issue due to various flaws. In order to analyze the data with more
reliability and accuracy we will focus on pricing The Cheesecake Factory with four
intrinsic value models: Discounted Dividends, Discounted Free Cash Flow,
Residual Income, and Long Run Residual income. These four models are
considered to be more valuable than the method of comparables due to various
reasons. First, the models possess distinct theories in the formulation of each

130 | P a g e
intrinsic valuation model, which leads to more accurate depiction of the
company’s value than can be provided by the method of comparables. The
models account for ten years of financial data, as opposed to the comparables
only analyzing a single year’s performance. Providing ten years of financial data
decreases volatility in the model, thus leading to more accurate valuations for
the firm. Along with utilizing distinct theories and multiple years of financial data,
the intrinsic valuation models also take the time value of money into
consideration. Using present values in the model will allow us, the analyst, to be
able to determine a more realistic valuation of The Cheesecake Factory.
As stated above, the four models we will be using to value The
Cheesecake Factory will be the discounted dividends models, the discounted free
cash flow model, the residual income model, and the long run residual income
model. These four models considerably vary in their explanatory power, however
they are more reliable and accurate as compared to the method of comparables.
Each of these models possess its own strengths and weaknesses when used for
valuing the firm. Therefore, we the financial analysts will obtain a more accurate
idea of The Cheesecake Factory’s value through the analysis of the above stated
intrinsic value models.
After we have calculated the estimated growth rate and cost of equity for
the models a sensitivity analysis will be performed to explore how responsive the
results are to changes in the applied growth and cost of equity rates. Using
sensitivity analysis for a wide range of rates will allow us to account for errors in
forecasting as well as indicate how varying rates affect the models as a whole.
For example, if the models require a cost of equity that hovers around the risk
free rate of return to be classified as fairly valued, the firm is overvalued. It is
unreasonable for an investor to buy equities in a firm when the risk free
government securities are compensated as equally as publically traded firms that
bear greater amounts of risk.
When classifying the results of the intrinsic valuation models as either
undervalued, fair valued, or overvalued, we must set parameters for each of

131 | P a g e
these scenarios. In order to set the parameters we, the financial analysts, will
take the position of a 10% analysts. Taking a 10% analyst position means that
unless the price generated from the models varies by a minimum of 10% of the
observed price, then the value of the stock will be classified as fairly valued.
Applying this position to our June 1st observed price of $45.87 will reveal results
under $41.283 as overvalued and prices over $50.457 as undervalued. If the
price from the valuation models falls in between the range of $41.283 and
$50.457 then the stock is considered fairly valued. Overall, due to their accuracy
and reliability, these four intrinsic value models will be the basis for our final
recommendation of The Cheesecake Factory.
Discounted Dividends Model
The discounted dividends model approximated the stock value of a firm as
the present value of the future dividends into a perpetuity. Dividend yield and
capital gains return are the two variables that makeup a stock’s total return.
Although dividends are the only tangible cash flows of a stock, the discounted
dividends model ignores the potential cash flows that are a result of capital
gains. This model normally considers companies to be overvalued due to its
shortcomings and possesses a low explanatory power around 3%. When
analyzing the dividend payout it is not uncommon for companies to pay little to
no dividends at all. After these payouts are discounted back to present value, the
dividend stream is often of insignificant value or nonexistent. The model also
assumes the growth rate of dividend payments in perpetuity at a constant rate.
Realistically, dividend growth is normally stair stepped, with firms holding
dividends constant for an indefinite term and payouts increasing periodically.
This makes the smooth growth rate unrealistic. Finally, this model places a large
amount of value in the perpetuity portion that is present in the model. Over the
course of time forecasts become much less reliable due to volatility in the
132 | P a g e
forecasted data. Therefore, in order for the model to have a high level of
explanatory power the inputs to the model need to be heavily focused on the
current value of the company. Based on these reasons, the discounted dividends
model has a low explanatory power under 3% as it usually overvalues stocks at
this rate.
In order to value The Cheesecake Factory using the discounted dividends
model we must calculate the annual dividends per share using our ten year
forecast. Based off of our statement of cash flows forecast we already have an
annual dividend payout for the next ten years. We did this by following The
Cheesecake Factory’s dividend growth pattern while holding the number of
shares outstanding constant. Next, we divide the annual dividend payout by the
constant shares outstanding in order to get the annual forecasted dividends per
share that we must have for the model. The next step in this process is to
discount the individual payments back to the present value using our previously
approximated cost of equity and then sum these values. After the values are
summed we now have the present value of the forecasted ten year dividend
stream. The second part of the model consists of approximating The Cheesecake
Factory’s dividend payments from year 11 to infinity. In this part we must apply
a smooth growth rate in order to calculate the present value of the perpetual
dividend stream. For analysis purposes we applied a smooth growth rate of 3%
in order to correspond with our average growth for our ten year forecasts. We
then use these required inputs to find the value of the perpetuity which is then
discounted back to present value dollars. After these two aspects of the
discounted dividends model are added together we then have the model’s
implied price for the end of 2013. Because we are valuing The Cheesecake
Factory as of June 1st, 2014, we must grow the present value of the dividend
stream at the end of 2013 by five months in order to determine time consistent
price. We are using five months of growth due to the The Cheesecake Factory’s
fiscal year ending at the end of December. Once these steps are performed we
are now able to compare the actual closing price of The Cheesecake Factory,

133 | P a g e
$45.87 on June 1st, 2014, to the discounted dividend model price. Next, we are
able to value The Cheesecake Factory using sensitivity analysis for our cost of
equity and growth rate values. We included stated and restated backdoor costs
of equity in our sensitivity analysis. Our backdoor cost of equity is determined
using the average Internal Growth Rate value for stated and restated financials
as the “g” or growth for the backdoor costs of equity equation. We used IGR as
the growth due to it giving us backdoor costs of equity values that fall within the
parameters for our cost of equity based upon our previously ran regressions.
Based upon our discounted dividends model and our position as 10%
analysts, The Cheesecake Factory is consistently overvalued. However, as
previously stated, the discounted dividends model usually overvalues companies.
Taking this factor into account along with The Cheesecake Factory’s dividend
yield coincides with the results of the sensitivity analysis. In order for the
discounted dividends model to determine The Cheesecake Factory’s value the
required inputs by the model are implausible. In the sensitivity analysis stated
1.0% 2.0% 3.0% 4.0% 5.0%
6.56% 21.056 24.194 29.125 38 58.709
8.50% 14.963 16.296 18.114 20.739 24.864
Backdoor Ke 10.81% 11.081 11.695 12.467 13.465 14.808
Ke 11.68% 10.068 10.544 11.131 11.87 12.83
13.24% 8.627 8.94 9.315 9.771 10.337
Cost of Equity
41.283 < > 50.457
Overvalued Fair Value Undervalued
1.0% 2.0% 3.0% 4.0% 5.0%
6.56% 21.056 24.194 29.125 38 58.709
8.50% 14.963 16.296 18.114 20.739 24.864
Backdoor Ke 9.01% 13.907 15.013 16.488 18.551 21.6437
Ke 11.68% 10.068 10.544 11.131 11.87 12.83
13.22% 8.627 8.94 9.315 9.771 10.337
Cost of Equity
41.283 < > 50.457
Overvalued Fair Value Undervalued
The Cheesecake Factory's Dividends Sensitivity Analysis
Re Stated Backdoor Ke
As Stated Backdoor Ke
Growth Rate
Growth Rate
10% Analyst Position
10% Analyst Position
134 | P a g e
above there are no instances of the company being fairly valued and only one
instance of the company being overvalued, which occurred at a 6.56% cost of
equity and a 5% growth rate. If we assume that the Cheesecake Factory’s cost
of equity is consistent with the calculated size adjusted estimate of 6.56%, a
dividend growth rate of 6% is required to produce undervalued results. For the
purposes of the model, The Cheesecake Factory is depicted as undervalued
whenever the cost of equity is extremely close to the dividend growth rate.
Based upon the inputs and assumptions required in order to apply the
discounted dividends model, it is possible that the model does not depict the
most accurate idea of The Cheesecake Factory’s value. However, the models
does suggest that The Cheesecake Factory is quite overvalued.
Discounted Free Cash Flows Model
The second model we will use to value The Cheesecake Factory is the
discounted free cash flows model. It’s performed by taking the present value of
the free cash flows from equity and discounting them to present time. The model
operates under the assumption that market value of equity is equal to the
market value of assets minus market value of liabilities. Therefore, we need to
find the market value of the firm’s assets. In the model the market value of
assets equals the present value of the annual free cash flows into perpetuity.
The year by year free cash flows are discounted back to present value by using
the before tax WACC as a means to not count taxes twice, due to forecasted net
income being an after tax figure. There are 3 steps involved in performing the
valuation. First, we forecasted the free cash flows over a period of time. Second,
we calculate the present value of the free cash flows into perpetuity. Lastly, after
all future free cash flows have been summed to estimate the market value of
The Cheesecake Factory’s assets we are then able to value the firm. We are
assuming that the book value of liabilities is equal to the market value of

135 | P a g e
liabilities; therefore subtracting the book value of liabilities from our calculated
market value of assets will result in the market value of equity for The
Cheesecake Factory. Finally we divide by number of shares outstanding, giving
us a value for the year end at 2013. The resulting value is then compounded for
five months, resulting in a time consistent price that we can use in order to
compare the observed price of $45.87.
The above picture is the results from the sensitivity analysis from the
discounted free cash flow. As 10% analyst, we conclude from the discounted
cash flow model that The Cheesecake Factory is understated.
The discounted cash flow model can be effective, however, the models
downfall is being extremely sensitive to small changes in growth rate. This can
lead to drastic changes to the independent and dependent variables of the
model. For example, on an as stated bases with a 6.56% cost of capital and only
a 1% increase from 4% to 5%, the value jumps over $100.00. Along with being

136 | P a g e
extremely sensitive the model uses forecasted cash flows, which can be
extremely volatile, thus decreasing the validity of the model. Due to these
reasons the discounted free cash flows model possesses a low explanatory
power and will not have a significant affect in our final valuation of The
Cheesecake Factory.
Residual Income Model
The residual income model is considered to be one of the most accurate
and valuable valuation models as compared to the models. The model is
considered to have a high explanatory power due to many reasons. First of all,
the majority of the input values take into account the current state of the firm
rather than relying on perpetuity such as the discounted dividends and the
discounted cash flows model. Because forecasts of current and short term
figures tend to be more accurate and reliable than the approximation of terminal
values, the explanatory power the model possesses is higher than other
valuation models. The residual income model is also less susceptible to changes
in the applied growth rate. All of these factors combined increase the
explanatory power of the model, resulting in higher accuracy when valuing a
firm.
The residual income model is based upon the comparison between
annual net income and the calculated benchmark income. The model also uses
the present value of the sum of differences between net income and benchmark
income on an annual basis. The differences are then added to the current book
value of equity, giving a yield of the market value of The Cheesecake Factory’s
equity. Due to the process of the model, the first step in the residual income
model is to calculate the annual benchmark net income. This calculation is based
upon a distortion of the return on equity formula for the firm. Return on Equity is
a lagged ratio, with it being defined as net income of the current year divided by

137 | P a g e
value of equity for the previous year. By using this formula we are able to define
the benchmark net income as the firm’s cost of equity multiplied by the book
value of equity for the previous year. The results are then compared to the net
income of the forecasted years, with the difference being defined as residual
income. When the residual income is a positive number the firm has created
value during the year and the cost of equity was higher than the benchmark. If
the residual income is a negative number then the firm did not meet the
benchmark net income, with the actual cost of equity falling short of the
benchmark cost of equity of the firm. Next, the annual residual income results
are discounted back to present value for valuation purposes.
The next step in the residual income model involves valuing the perpetual
residual income. In order to approximate the value of the annual residual income
that is used in the perpetuity we multiplied the 2023 forecasted residual income
by 0.8. It is vital that the perpetuity residual income, or 2024 residual income, is
calculated as a percentage of the year ten results. Next we take the forecasted
residual income for 2024, the perpetuity, and divide it by the cost of equity
minus the growth rate for the model. This value is then multiplied by the present
value factor of year ten, thus giving us a terminal value for the perpetuity. Next,
we take the discounted to present value perpetuity and add it to the present
value sum of the year by year residual income and the book value of equity in
order to calculate the current market value of equity for The Cheesecake
Factory. This value is then divided by the shares outstanding and adjusted
accordingly to obtain the time consistent price for June 1st, 2014.
The final step in valuation using the residual income model is to perform
sensitivity analysis just as we did for the discounted dividends and discounted
free cash flow models. However, the sensitivity analysis differs for this model in
the respect that the growth rate for the model must be negative. Negative
growth rates are due to the fact that in the long run the values of net income
and the benchmark net income approach equilibrium, resulting in a residual

138 | P a g e
Growth Rate
-10 -20 -30 -40 -50
6.56% 30.88 27.33 24.96 22.93 20.97
8.50% 24.53 22.31 20.62 19.08 17.52
Backdoor Ke 10.81% 19.05 17.75 16.6 15.47 14.27
Ke 11.68% 17.4 16.34 15.35 14.33 13.24
13.22% 14.93 14.18 13.4 12.55 11.63
Cost of Equity
41.283 < > 50.457
Lb Fair Value Ub
As Stated Backdoor Ke
10% Analyst
income of zero. The sensitivity analysis for the residual income is therefore an
application of various rates for cost of equity and negative growth rates.
The above table shows our sensitivity analysis for The Cheesecake Factory
in regards to as stated backdoor cost of equity. Using a 10% analyst position we
have determined that The Cheesecake Factory is overvalued based upon the
residual income model. The sensitivity analysis shows that even at the lowest
cost of equity, 6.56%, and the lowest growth rate, -50%, the firm will still be
overvalued. Based on the trend we assume that at an even lower cost of equity
as well as lower growth rate that the firm will still be overvalued in regards to
the residual income model.
Due to operating leases causing us to restate our financials we must also
perform the residual income analysis on a restated basis in terms of backdoor
cost of equity. We used restated IGR in our backdoor cost of equity equation for
the “g” or growth portion of the equation. The restated backdoor cost of equity
allows us to view the value of the firm on a restated basis, even though the
operating leases in the restatements only affect assets and liabilities. By using
restated IGR in our backdoor cost of equity formula we produce backdoor cost of
equities that fall within our upper and lower bounds in terms of our regressions
in order to determine the cost of equity for the firm.

139 | P a g e
Growth Rate
-10 -20 -30 -40 -50
6.56% 30.88 27.33 24.96 22.93 20.97
8.55% 24.53 22.31 20.62 19.08 17.52
Backdoor Ke 9.01% 23.16 21.19 19.64 18.2 16.73
Ke 11.68% 17.4 16.34 15.35 14.33 13.24
13.22% 14.93 14.18 13.4 12.55 11.63
Ke
41.283 < > 50.457
Lb Fair Value Ub
10% Analyst
Re Stated Backdoor Ke
The restated sensitivity analysis using the restated backdoor cost of equity
closely resembles the as stated sensitivity analysis. However, the restated
backdoor cost of equity is lower than the as stated, resulting in higher numbers
in terms of growth rates to cost of equity. Even though the restated backdoor
costs of equity valuation numbers vary, the model itself is on par with the as
stated model, resulting in the firm being overvalued through the whole model.
In conclusion, our sensitivity analysis on both an as stated and restated
basis depicts The Cheesecake Factory as being overvalued. This conclusion is
supported by the lower and upper boundaries of our cost of equity and growth
rates resulting in overvalued prices. Because the residual income model is
considered one of the most effective models in order to value a firm these results
will have a significant impact on our final recommendation.
Long Run Residual Income
The long run residual income model is similar to the residual income
model in that it estimates the firm’s value by calculating the market value of
equity. The difference, however, is how the market value of the firm’s equity is
defined in each model. The residual income model determines the market value
of equity by calculating the present value of the forecasted annual residual
income figures into perpetuity. The figures are then added to the present book
value of equity, as a means to approximate market value of equity. The long run

140 | P a g e
residual income model, in contrast, does not use yearly forecasts of net income.
Instead the long run residual income model requires the current book value of
equity, the estimated cost of capital, long run return on equity, and the growth
rate. Although this model is not as accurate as the residual income model, it
possesses practical application in valuing a firm. Yearly forecasts are not required
to complete this model, therefore it can be computed easier than the residual
income model. Due to its similarities to the residual income model and it not
requiring forecasted values, the long run residual income model can be used as a
valuable screening to for the valuation of companies.
Long Run Residual Income Formula
MVE=BVE0+ BVE0(1+(ROE-KE)/(KE-g))
Because the model is highly dependent on the input rates for Return on
Equity, Cost of Equity, and the growth rate, it is sensitive to changes in the input
rates. The BVE0(1+(ROE-KE)/(KE-g)) portion of the formula defines the growing
perpetuity. The formula assumes that the book value of equity for the firm will
continue to grow by the difference between the long run return on equity and
cost of equity in perpetuity plus one. In order to value The Cheesecake Factory
using this model we must first determine the values for the rates used in the
model. Due to The Cheesecake Factory’s operating leases only affecting assets
and liabilities on a restated basis, ROE does not change between an as stated
and restated basis. However, we have decided to use as stated and re stated
IGR as a value for the “g” variable of the backdoor cost of equity model. Our as
stated and restated IGR’s are positive numbers, which is not normally seen in the
growth value of the backdoor cost of equity formula. However, our backdoor cost
of equity values fall within our lower and upper bound parameters in regards to
cost of equity regression analysis. By using our as stated and restated IGR’s we
are able to use this model in terms of an as stated and re stated backdoor cost

141 | P a g e
Hold g constant at -30% Hold ROE constant at 16.50%
ROE g
8% 10% 12% 14% 16% -10% -20% -30% -40% -50%
6.55% 12.76 13.43 14.10 14.78 15.45 6.55% 19.65 16.87 15.61 14.90 14.43
8.50% 12.21 12.85 13.49 14.13 14.78 8.50% 17.71 15.84 14.94 14.41 14.06
Backdoor Ke 10.81% 11.62 12.23 12.84 13.45 14.06 Backdoor Ke 10.81% 15.89 14.78 14.22 13.87 13.64
Ke 11.68% 11.41 12.01 12.61 13.21 13.81 Ke 11.68% 15.30 14.42 13.96 13.68 13.49
13.22% 11.07 11.65 12.23 12.82 13.40 13.22% 14.37 13.83 13.54 13.36 13.24
Ke Ke
41.283 < > 50.457 41.283 < > 50.457
LB Fair Value UB LB Fair Value UB
Hold Ke constant at 11.68%
g
-10% -20% -30% -40% -50%
11.0% 12.12 12.25 12.31 12.35 12.38
13.0% 13.28 13.04 12.91 12.84 12.78
15.0% 14.43 13.83 13.51 13.32 13.19
16.5% 15.30 14.42 13.96 13.68 13.49
19.0% 16.74 15.41 14.71 14.29 14.00
ROE
41.283 < > 50.457
LB Fair Value UB
Hold g constant at -30% Hold ROE constant at 16.50%
ROE g
8% 10% 12% 14% 16% -10% -20% -30% -40% -50%
6.55% 12.76 13.43 14.10 14.78 15.45 6.55% 19.65 16.87 15.61 14.9 14.43
8.50% 12.21 12.85 13.49 14.13 14.78 8.50% 17.71 15.84 14.94 14.41 14.06
Backdoor Ke 9.01% 12.07 12.71 13.34 13.98 14.61 Backdoor Ke 9.01% 17.27 15.59 14.77 14.28 13.96
Ke 11.68% 11.41 12.01 12.61 13.21 13.81 Ke 11.68% 15.3 14.42 13.96 13.68 13.49
13.22% 11.07 11.65 12.23 12.82 13.40 13.22% 14.37 13.83 13.54 13.36 13.24
Ke Ke
41.283 < > 50.457 41.283 < > 50.457
LB Fair Value UB LB Fair Value UB
Hold Ke constant at 11.68%
g
-10% -20% -30% -40% -50%
11.0% 12.12 12.25 12.31 12.35 12.38
13.0% 13.28 13.04 12.91 12.84 12.78
15.0% 14.43 13.83 13.51 13.32 13.19
16.5% 15.30 14.42 13.96 13.68 13.49
19.0% 16.74 15.41 14.71 14.29 14.00
ROE
41.283 < > 50.457
LB Fair Value UB
Restated Backdoor Ke
As Stated Backdoor Ke
of equity. Therefore, due to our ROE not experiencing change on an as stated
and re stated basis, we are using backdoor cost of equity in the model as a
means to produce an as stated and re stated long run residual income sensitivity
analysis. Below is the tables for long run residual income using a backdoor cost
of equity on a as stated and re stated basis.

142 | P a g e
In the model we used a cost of equity value of 11.68% that was
previously determined in our CAPM and regression analysis. Along with the cost
of equity we also used upper and lower boundary cost of equity that were
established through our regression. As previously stated we are going to include
a sensitivity analysis based upon as stated and re stated backdoor cost of equity.
Using as stated and re stated backdoor cost of equity in the valuation allows us
to deliver as stated and re stated long run residual income models even though
our company does not experience change in ROE. In our sensitivity analysis,
both on an as stated and re stated basis, we are using 12% as the centering
ROE values when holding growth constant at -30%. We are also using -30%
growths as a centering value for as stated and re stated sensitivity when holding
cost of equity constant at 11.68%. Lastly, we are using -30% growth as the
centering value on an as stated and restated basis when holding ROE constant at
16.50%. Also, we approximate the growth rates used within the long run
residual income model. These growth rates are negative due to it being based off
of residual income. After applying the formula we divide by the total outstanding
shares in order to obtain a value on a per share basis. A major difference
between this model and the other intrinsic valuation models used it that it
introduces three variables into the equation. Therefore, we must produce three
tables related to the three variables in the equation, which can be seen above.
These inputs result in the firm being overvalued based upon the long run
residual income model regardless of the applied rates. The firm is determined as
overvalued with respects to holding growth constant, holding cost of equity
constant, and holding return on equity constant, in terms of as stated and re
stated backdoor costs of equity. Overall, the long run residual income model
indicates that The Cheesecake Factory is consistently overvalued relative to the
observed stock price of $45.87 on an as stated and re stated basis. Therefore,
we will significantly take the long run residual income model into consideration
when determining our final recommendation for The Cheesecake Factory.

143 | P a g e
Analyst Recommendation
To recap the valuation process of Cheesecake Factory, we started with
analyzing the firm and the industry it is a part of. We looked at the nature of the
business and identified the three biggest competitors to Cheesecake Factory
being Brinker Intl., Darden Inc., and BJ’s Restaurants Inc. We researched these
competitors and identified their strengths and weakness and how well their
financial statements compare to Cheesecake Factory. With this research we
developed a five force model giving us more insight into the upscale casual
dining industry.
After we gained a better understanding of the casual upscale dining
industry, we look internally into Cheesecake Factory to learn more about their
key accounting policies and strategies to determine if there are any possible
distortions within their financial statements. We came across a poor quality of
disclosure throughout the entire Cheesecake Factory 10-K as relevant
information relating to liabilities was not present. One distortion relating to their
liabilities was Cheesecake’s operating leases. To correct this distortion, we
restated their liabilities with capitalization of the leases to give our valuation a
more accurate analysis. We forecasted Cheesecake Factory’s statements with
data that were based off trends and ratios found in previous years.
We further continued the valuation process by analyzing the forecasted
statements as well as the ratio analysis that give us further insight on the
financial position of Cheesecake Factory. With this calculated data, we ran the
intrinsic valuation method. The intrinsic valuation method consists of four models
that include discounted dividends, discounted cash flows, residual income, and
long run residual income. These models use sensitivity analysis to determine

144 | P a g e
whether the current price is undervalued, overvalued, or fair. This method allows
our valuation to have more certainty and accuracy in our recommendation. Our
biggest indicator from the intrinsic valuation is the residual income model on a
stated and restated basis. The data formulated in this model is based upon the
10% analyst position that we have taken, as well as the current stock price
$45.87 on June 1st, 2014. These models only resulted in overvalued price of The
Cheesecake Factory in terms of cost of equity and growth rates. Therefore, our
recommendation as financial analysts is that The Cheesecake Factory is
overvalued, and investors holding Cheesecake Factory stock should sell.

145 | P a g e
Appendices
LIQUIDITY RATIOS
Current Ratio
2008 2009 2010 2011 2012 2013
Brinker 0.87 0.87 0.87 0.87 0.87 0.87
Darden 0.41 0.41 0.41 0.41 0.41 0.41
BJ's 0.65 0.65 0.65 0.65 0.65 0.65
CAKE 1.02 1.02 1.02 1.02 1.02 1.02
Quick Ratio
2008 2009 2010 2011 2012 2013
Brinker 0.80 0.80 0.80 0.80 0.80 0.80
Darden 0.22 0.22 0.22 0.22 0.22 0.22
BJ's 0.58 0.58 0.58 0.58 0.58 0.58
CAKE 0.90 0.90 0.90 0.90 0.90 0.90
Inventory Turnover
2008 2009 2010 2011 2012 2013
Brinker 119.72 119.72 119.72 119.72 119.72 119.72
Darden 30.58 30.58 30.58 30.58 30.58 30.58
BJ's 103.74 103.74 103.74 103.74 103.74 103.74
CAKE 69.45 69.45 69.45 69.45 69.45 69.45

146 | P a g e
Inventory Days
2008 2009 2010 2011 2012 2013
Brinker 3 3 3 3 3 3
Darden 11.94 11.94 11.94 11.94 11.94 11.94
BJ's 3.52 3.52 3.52 3.52 3.52 3.52
CAKE 5.26 5.26 5.26 5.26 5.26 5.26
Accounts Receivable Turnover
2008 2009 2010 2011 2012 2013
Brinker 80.97 80.97 80.97 80.97 80.97 80.97
Darden 95.35 95.35 95.35 95.35 95.35 95.35
BJ's 37.10 37.10 37.10 37.10 37.10 37.10
CAKE 128.13 128.13 128.13 128.13 128.13 128.13
A/R days
2008 2009 2010 2011 2012 2013
Brinker 4.51 4.51 4.51 4.51 4.51 4.51
Darden 3.83 3.83 3.83 3.83 3.83 3.83
BJ's 9.84 9.84 9.84 9.84 9.84 9.84
CAKE 2.85 2.85 2.85 2.85 2.85 2.85

147 | P a g e
Cash to Cash
2008 2009 2010 2011 2012 2013
Brinker 7.56 7.56 7.56 7.56 7.56 7.56
Darden 15.76 15.76 15.76 15.76 15.76 15.76
BJ's 13.36 13.36 13.36 13.36 13.36 13.36
CAKE 8.10 8.10 8.10 8.10 8.10 8.10
Working Capital Turnover
2008 2009 2010 2011 2012 2013
Brinker -59.82 -59.82 -59.82 -59.82 -59.82 -59.82
Darden -9.92 -9.92 -9.92 -9.92 -9.92 -9.92
BJ's -19.07 -19.07 -19.07 -19.07 -19.07 -19.07
CAKE 366.26 366.26 366.26 366.26 366.26 366.26
PROFTIABILITY RATIOS
Sales Growth
2008 2009 2010 2011 2012 2013
Brinker N/A 24.15% 12.73% 4.22% 2.35% 0.66%
Darden N/A 0.09 -0.01 0.05 0.07 0.07
BJ's N/A 0.14 0.20 0.21 0.14 0.09
CAKE N/A 0.00 0.04 0.06 0.03 0.04

148 | P a g e
Gross Profit Margin
2008 2009 2010 2011 2012 2013
Brinker 0.72 0.72 0.72 0.72 0.72 0.72
Darden 0.70 0.70 0.70 0.70 0.70 0.70
BJ's 0.75 0.75 0.75 0.75 0.75 0.75
CAKE 0.74 0.74 0.74 0.74 0.74 0.74
Operating Profit Margin
2008 2009 2010 2011 2012 2013
Brinker 0.02 0.02 0.02 0.02 0.02 0.02
Darden 0.08 0.08 0.08 0.08 0.08 0.08
BJ's 0.03 0.03 0.03 0.03 0.03 0.03
CAKE 0.05 0.05 0.05 0.05 0.05 0.05
Net Profit Margin
2008 2009 2010 2011 2012 2013
Brinker 0.01 0.01 0.01 0.01 0.01 0.01
Darden 0.06 0.06 0.06 0.06 0.06 0.06
BJ's 0.03 0.03 0.03 0.03 0.03 0.03
CAKE 0.03 0.03 0.03 0.03 0.03 0.03

149 | P a g e
Asset Turnover
2008 2009 2010 2011 2012 2013
Brinker 1.93 1.93 1.93 1.93 1.93 1.93
Darden 1.40 1.40 1.40 1.40 1.40 1.40
BJ's 1.12 1.12 1.12 1.12 1.12 1.12
CAKE 1.41 1.41 1.41 1.41 1.41 1.41
Return on Assets
2008 2009 2010 2011 2012 2013
Brinker 2.36% 2.36% 2.36% 2.36% 2.36% 2.36%
Darden 0.08 0.08 0.08 0.08 0.08 0.08
BJ's 0.03 0.03 0.03 0.03 0.03 0.03
CAKE 0.05 0.05 0.05 0.05 0.05 0.05
Return On Equity
2008 2009 2010 2011 2012 2013
Brinker 9% 9% 9% 9% 9% 9%
Darden 0.27 0.27 0.27 0.27 0.27 0.27
BJ's 0.04 0.04 0.04 0.04 0.04 0.04
CAKE 0.12 0.12 0.12 0.12 0.12 0.12

150 | P a g e
IGR & SGR

151 | P a g e
CAPITAL STRUCTURE RATIOS
Debt to Equity Ratios
2008 2009 2010 2011 2012 2013
CAKE 1.04 1.52 1.03 0.74 0.88 0.95
CAKE Restated 2.06 1.54 1.21 1.41 1.39 1.48
Brinker 2.69 2.01 1.54 2.38 3.65 8.73
Darden 2.36 2.13 1.82 1.79 2.23 2.37
BJ’s 0.44 0.51 0.49 0.51 0.5 0.52
Z-Score
2008 2009 2010 2011 2012 2013
CAKE 2.53 3.21 4.87 4.74 4.93 5.43
Cake Restated 2.38 3.11 3.61 3.64 3.7 3.74
Brinker 3.65 3.94 4.03 4.96 5.39 5.47
Darden 3.1 3.04 3.17 3.35 3.02 2.17
BJ’s 2.95 3.77 5.56 5.96 4.95 4.09
Times Interest Earned
2008 2009 2010 2011 2012 2013
CAKE 5.89 3.15 7.63 30.98 29.35 35.74
Cake Restated 5.89 3.15 7.63 30.98 29.35 35.74
Brinker 2.11 3.08 5.42 7.26 8.65 8.82
Darden 7.01 5.88 6.86 7.92 7.28 5.15

152 | P a g e
3 MONTH REGRESSION

153 | P a g e

154 | P a g e
1 YEAR REGRESSION

155 | P a g e

156 | P a g e
2 YEAR REGRESSION

157 | P a g e

158 | P a g e

159 | P a g e
7 YEAR REGRESSION
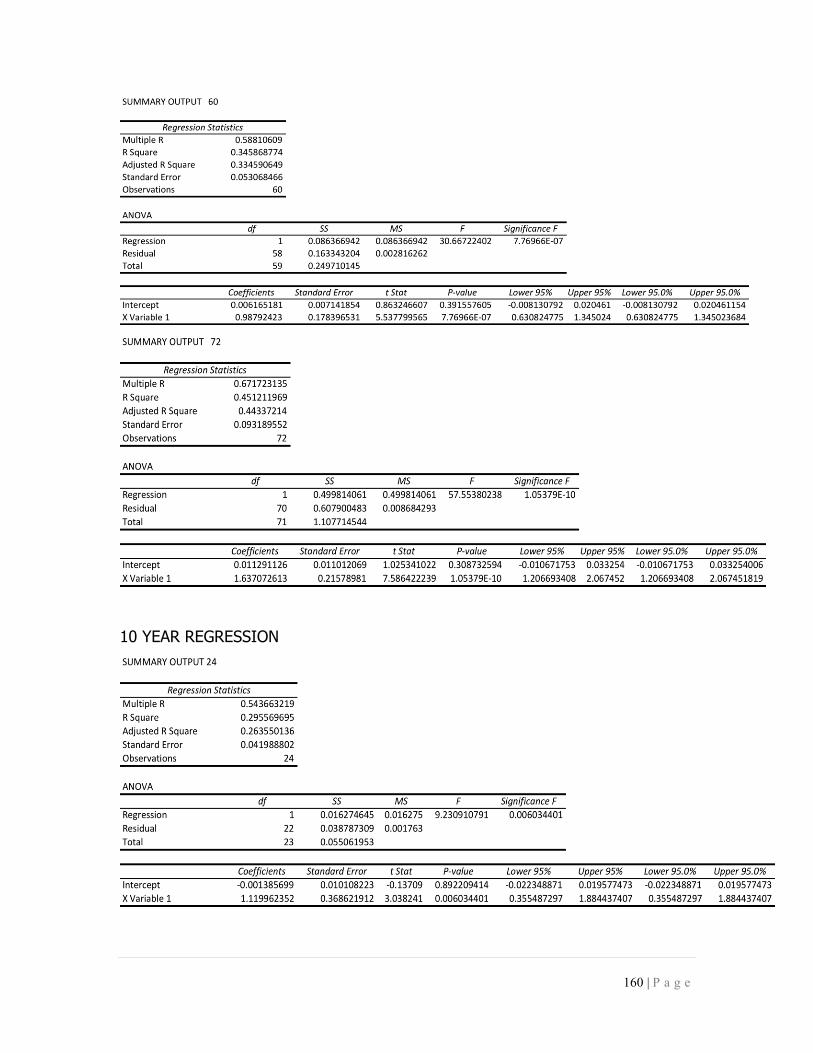
160 | P a g e
10 YEAR REGRESSION

161 | P a g e

162 | P a g e
COMPAREABLES
Trailing PE
Brinker 20.4
Darden 18.71
BJ 58.15
Mcdonalds 18.45
Future P/E
Brinker 16.13
Darden 18.32
BJ 37.92
Mcdonalds 16.22

163 | P a g e
P/B Average
Mcdonalds 6.22 6.22
BJ 2.44 2.44
Brinker 37.72 2.86
Darden 2.86
3.84
BV/S 10.4
Should
sell
39.94
PEG Average
Brinker 1.42 1.42
Darden 207.9 2.31
McD 2.31 2.56
BJ 2.56
2.10
CAKE g
9.00
CAKE
EPS 2.06
should
sell
38.87

164 | P a g e
Cap EBITDA P/EBITDA
Brinker 3,200,000,000
420,000,000 7.62
Darden
6,170,000,000
631,600,000 9.77
McD
100,280,000,000
10,130,000,000 9.90
BJ's
1,000,000,000
76,370,000 13.09
EV EBITDA
Brinker 9.73 9.73
Darden 14 14
McD 11.05 11.05
BJ 12.65 12.65
Average
11.86
Cake EBITDA
235,800,000
Shares
Outstanding
48,300,000
Should sell
57.89

165 | P a g e
VALUATION MODELS
DISCOUNTED DIVIDENDS
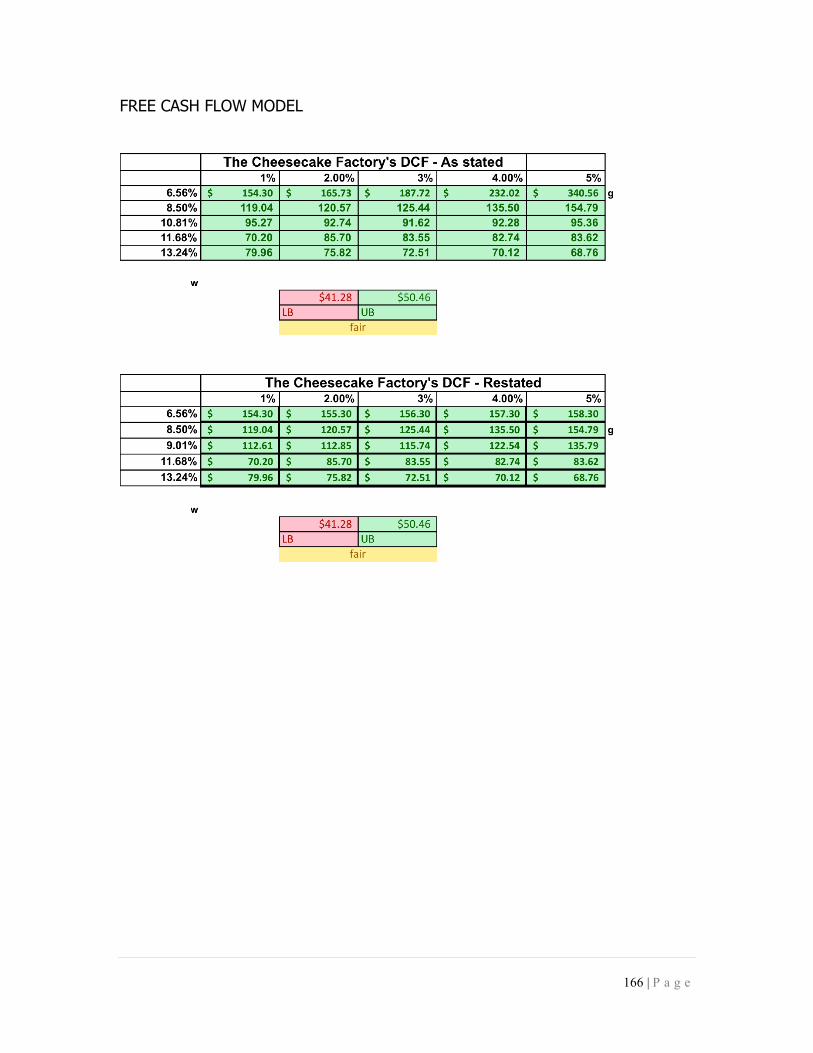
166 | P a g e
FREE CASH FLOW MODEL

167 | P a g e
RESIDUAL INCOME
LONG RUN RESIDUAL INCOME
Ke 11.68% As Stated ReStated
Estimated Price per Share (end of 2013) Backdoor Ke 10.81% 9.01%
Observed Share Price $45.87
Book Value Equity (THOUSANDS) 577,353
ROE (Based on Trend) 19.00%
Ke (What initial Ke is) 11.68%
Hold g constant at -30% Hold ROE constant at 16.50%
g (ROE cannot outperform Ke) -50% ROE g
8% 10% 12% 14% 16% -10% -20% -30% -40% -50%
Model Price 12/21/87 (MVE) 645871.55 6.55% 12.76 13.43 14.10 14.78 15.45 6.55% 19.65 16.87 15.61 14.90 14.43
Divide by shares 48300.00 8.50% 12.21 12.85 13.49 14.13 14.78 8.50% 17.71 15.84 14.94 14.41 14.06
Model share price 13.37 Backdoor Ke 10.81% 11.62 12.23 12.84 13.45 14.06 Backdoor Ke 10.81% 15.89 14.78 14.22 13.87 13.64
FV Factor (5 months) 1.05 Ke 11.68% 11.41 12.01 12.61 13.21 13.81 Ke 11.68% 15.30 14.42 13.96 13.68 13.49
13.22% 11.07 11.65 12.23 12.82 13.40 13.22% 14.37 13.83 13.54 13.36 13.24
Time consistent price 14.00 Ke Ke
41.283 < > 50.457 41.283 < > 50.457
LB Fair Value UB LB Fair Value UB
Hold Ke constant at 11.68%
g
-10% -20% -30% -40% -50%
11.0% 12.12 12.25 12.31 12.35 12.38
13.0% 13.28 13.04 12.91 12.84 12.78
15.0% 14.43 13.83 13.51 13.32 13.19 Analysis: Overvalued (Sell)16.5% 15.30 14.42 13.96 13.68 13.49
19.0% 16.74 15.41 14.71 14.29 14.00
ROE
41.283 < > 50.457
LB Fair Value UB
Hold g constant at -30% Hold ROE constant at 16.50%
ROE g
8% 10% 12% 14% 16% -10% -20% -30% -40% -50%
6.55% 12.76 13.43 14.10 14.78 15.45 6.55% 19.65 16.87 15.61 14.9 14.43
8.50% 12.21 12.85 13.49 14.13 14.78 8.50% 17.71 15.84 14.94 14.41 14.06
Backdoor Ke 9.01% 12.07 12.71 13.34 13.98 14.61 Backdoor Ke 9.01% 17.27 15.59 14.77 14.28 13.96
Ke 11.68% 11.41 12.01 12.61 13.21 13.81 Ke 11.68% 15.3 14.42 13.96 13.68 13.49
13.22% 11.07 11.65 12.23 12.82 13.40 13.22% 14.37 13.83 13.54 13.36 13.24
Ke Ke
41.283 < > 50.457 41.283 < > 50.457
LB Fair Value UB LB Fair Value UB
Hold Ke constant at 11.68%
g
-10% -20% -30% -40% -50%
11.0% 12.12 12.25 12.31 12.35 12.38
13.0% 13.28 13.04 12.91 12.84 12.78
15.0% 14.43 13.83 13.51 13.32 13.19
16.5% 15.30 14.42 13.96 13.68 13.49
19.0% 16.74 15.41 14.71 14.29 14.00
ROE
41.283 < > 50.457
LB Fair Value UB
Restated Backdoor Ke
As Stated Backdoor Ke

168 | P a g e
ESTIMATION OF DIVIDEND PAYOUT
Shares outstanding 2014 48300000
Dividends Declared
May 9th 0.14
Dividends Paid as of May 9th 7214000
Paid/ Outstanding 0.149358178
Calculations for next 3 quarters Assuming Shares outstanding Estimation of Dividends paidEstimation + 1st quarter
Dividend per share:
2nd quarter 0.16 48300000 7728000
3rd quarter 0.16 48300000 7728000
4th quarter 0.16 48300000 7728000 Thousands
total dividends paid 23184000 30398000 30398
Calculations Assuming Similar Payouts
2015
0.16 48300000 7728000
0.18 48300000 8694000
0.18 48300000 8694000
0.18 48300000 8694000 Thousands
total dividends paid 33810000 33810
2016
0.18 48300000 8694000
0.2 48300000 9660000
0.2 48300000 9660000
0.2 48300000 9660000 Thousands
total dividends paid 37674000 37674
2017 0.2 48300000 9660000
0.22 48300000 10626000
0.22 48300000 10626000
0.22 48300000 10626000 Thousands
total dividends paid 41538000 41538
2018 0.22 48300000 10626000
0.24 48300000 11592000
0.24 48300000 11592000
0.24 48300000 11592000 Thousands
total dividends paid 45402000 45402
2019 0.24 48300000 11592000
0.26 48300000 12558000
0.26 48300000 12558000
0.26 48300000 12558000 Thousands
total dividends paid 49266000 49266
2020 0.26 48300000 12558000
0.28 48300000 13524000
0.28 48300000 13524000
0.28 48300000 13524000 Thousands
total dividends paid 53130000 53130
2021 0.28 48300000 13524000
0.3 48300000 14490000
0.3 48300000 14490000
0.3 48300000 14490000 Thousands
total dividends paid 56994000 56994
2022 0.3 48300000 14490000
0.32 48300000 15456000
0.32 48300000 15456000
0.32 48300000 15456000 Thousands
total dividends paid 60858000 60858
2023 0.32 48300000 15456000
0.34 48300000 16422000
0.34 48300000 16422000
0.34 48300000 16422000 Thousands
total dividends paid 64722000 64722
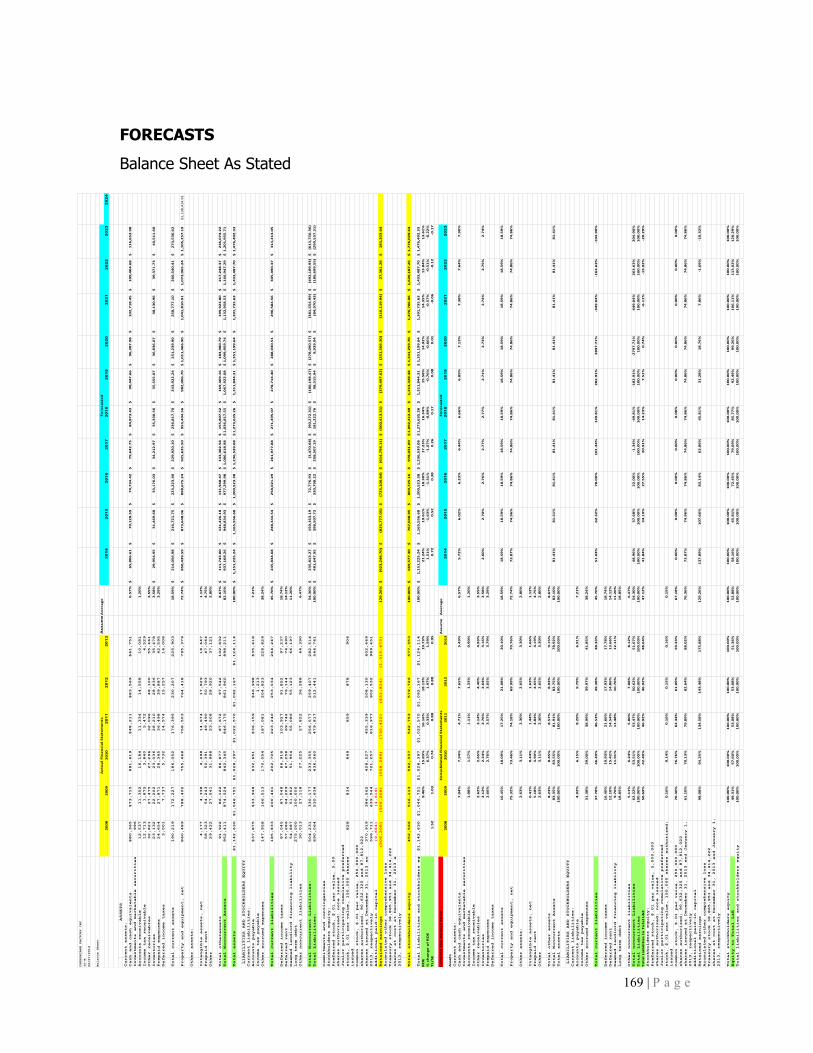
169 | P a g e
CHEESECAKE FACTORY INC
10-K
02/27/2014
Balance Sheet
Assume
Av
era
ge
20
08
20
09
20
10
2011
2012
2013
2014
2015
2016
2017
2018
2019
2020
2021
2022
2023
2024
ASSETS
Current assets:
Cash and cash equivalents
$80,365
$73,715
$81,619
$48,211
$83,569
$61,751
6.5
7%
65
,80
6.6
1$
70
,12
8.5
9$
74
,73
4.4
2$
7
9,6
42
.75
$
8
4,8
73
.43
$
90
,44
7.6
6$
9
6,3
87
.98
$
1
02
,71
8.4
5$
10
9,4
64
.68
$
11
6,6
53
.98
$
Investments and marketable securities
996
Accounts receivable
12,537
11,352
16,184
11,334
14,558
10,081
1.2
0%
Income tax receivable
12,713
1,875
3,840
5,472
4,529
Other receivables
32,821
27,475
27,296
32,096
48,100
55,461
3.5
5%
Inventories
23,132
22,202
23,036
28,210
28,836
35,478
2.5
8%
29
,95
4.9
5$
31
,46
9.6
8$
33
,17
6.0
3$
3
4,2
12
.97
$
3
5,3
30
.56
$
35
,55
5.0
7$
3
6,8
36
.07
$
3
8,1
30
.96
$
39
,37
1.7
3$
40
,51
1.6
0$
Prepaid expenses
24,654
27,871
28,345
36,498
39,887
42,595
3.2
9%
Deferred income taxes
3,001
7,737
5,732
14,574
15,257
16,008
Total current assets
190,219
172,227
186,052
176,395
230,207
225,903
18
.59
%2
14
,05
6.9
8$
2
16
,72
1.7
5$
2
23
,22
3.4
0$
22
9,9
20
.10
$
23
6,8
17
.70
$
2
43
,92
2.2
4$
25
1,2
39
.90
$
25
8,7
77
.10
$
2
66
,54
0.4
1$
2
74
,53
6.6
2$
Property and equipment, net
860,489
788,402
755,468
758,503
764,418
795,379
72
.74
%8
50
,43
9.5
9$
8
73
,64
8.0
6$
8
98
,67
5.2
4$
92
5,6
35
.50
$
95
3,4
04
.56
$
9
82
,00
6.7
0$
1,0
11
,46
6.9
0$
1
,04
1,8
10
.91
$
1,0
73
,06
5.2
4$
1,1
05
,25
7.1
9$
$
1,1
38
,41
4.9
1
Other assets:
Intangible assets, net
4,177
4,338
4,498
14,674
17,829
18,647
1.1
2%
Prepaid rent
58,323
54,243
50,391
49,490
50,793
47,064
4.7
5%
Other
29,422
27,541
31,988
23,508
28,920
37,121
2.8
0%
Total otherassets
91,922
86,122
86,877
87,672
97,542
102,832
8.6
7%
11
1,7
43
.00
$
12
1,4
26
.18
$
13
1,9
48
.47
$
1
43
,38
2.5
8$
1
55
,80
7.5
2$
16
9,3
09
.16
$
1
83
,98
0.7
9$
1
99
,92
3.8
0$
21
7,2
48
.37
$
23
6,0
74
.22
$
Total Noncurrent Assets
952,411
874,524
842,345
846,175
861,960
898,211
82
.10
%9
37
,16
8.2
6$
9
48
,83
4.9
3$
9
77
,29
9.9
8$
1,0
06
,61
8.9
8$
1
,03
6,8
17
.55
$
1,0
67
,92
2.0
8$
1
,09
9,9
59
.74
$
1,1
32
,95
8.5
3$
1
,16
6,9
47
.29
$
1
,20
1,9
55
.71
$
Total assets
$1,142,630
$1,046,751
$1,028,397
$1,022,570
$1,092,167
$1,124,114
10
0.0
0%
1,1
51
,22
5.2
4$
1
,16
5,5
56
.68
$
1
,20
0,5
23
.38
$
1
,23
6,5
39
.08
$
1,2
73
,63
5.2
6$
1
,31
1,8
44
.31
$
1,3
51
,19
9.6
4$
1
,39
1,7
35
.63
$
1,4
33
,48
7.7
0$
1,4
76
,49
2.3
3$
LIABILITIES AND STOCKHOLDERS EQUITY
Current liabilities:
Accounts payable
$37,875
$33,948
$32,651
$36,159
$46,998
$35,418
7.2
1%
Income tax payable
1,213
Other accrued expenses
147,958
166,513
170,054
187,081
204,823
228,829
38
.24
%
Total current liabilities
185,833
200,461
202,705
223,240
253,034
264,247
45
.70
%2
45
,83
4.6
8$
2
48
,34
4.5
4$
2
58
,02
1.2
9$
26
1,9
77
.88
$
27
1,4
95
.07
$
2
78
,71
4.4
0$
28
8,0
30
.51
$
29
6,5
84
.56
$
3
05
,49
0.3
7$
3
14
,21
3.0
5$
Deferred income taxes
87,045
87,048
86,918
103,927
91,852
97,237
18
.74
%
Deferred rent
57,286
64,209
67,258
69,742
76,144
74,690
14
.12
%
Deemed landlord financing liability
54,887
51,802
51,954
55,086
55,123
66,197
11
.20
%
Long term debt
275,000
100,000
Other noncurrent liabilities
30,013
27,118
27,225
27,822
36,288
44,390
6.4
7%
Total Noncurrent Liabilities:
504,231
330,177
233,355
256,577
259,407
282,514
54
.30
%2
35
,81
3.2
7$
1
50
,16
3.1
9$
7
2,7
76
.93
$
(3,4
70
.68
)$
(90
,27
2.3
1)
$
(18
0,1
98
.47
)$
(27
8,0
90
.57
)$
(38
1,5
54
.99
)$
(49
2,1
89
.93
)$
(6
13
,75
0.3
6)
$
Total Liabilities:
690,064
530,638
436,060
479,817
512,441
546,761
10
0.0
0%
48
1,6
47
.95
$
39
8,5
07
.73
$
33
0,7
98
.22
$
2
58
,50
7.1
9$
1
81
,22
2.7
6$
98
,51
5.9
4$
9
,93
9.9
4$
(8
4,9
70
.43
)$
(1
86
,69
9.5
5)
$
(29
9,5
37
.31
)$
Commitments and contingencies
Stockholders equity:
Preferred stock, $.01 par value, 5,000,000
shares authorized; none issued
Junior participating cumulative preferred
stock, $.01 par value, 150,000 shares authorized; none
828
834
849
859
878
906
issued
Common stock, $.01 par value, 250,000,000
shares authorized; 90,632,325 and 87,812,022
shares issued at December 31, 2013 and January 1,
370,919
386,562
428,527
455,339
508,130
602,469
2013, respectively
596,711
639,544
721,257
816,977
902,532
989,451
Additional paid-in capital
(9,684)
(4,619)
Retained earnings
(506,208)
(506,208)
(558,296)
(730,422)
(831,814)
(1,015,473)
12
9.2
6%
(92
3,2
48
.70
)$
(82
5,7
77
.05
)$
(7
23
,10
0.8
4)
$
(61
4,7
94
.11
)$
(50
0,4
13
.51
)$
(37
9,4
97
.62
)$
(25
1,5
66
.30
)$
(11
6,1
19
.94
)$
27
,36
1.2
6$
18
3,2
03
.64
$
Accmulated other comprehensive loss
Treasury stock 38,865,951 and 34,414,222
shares at cost at December 31, 2013 and January 1,
2013, respectively
Total stockholders equity
452,566
516,113
592,337
542,753
579,726
577,353
10
0.0
0%
66
9,5
77
.30
$
76
7,0
48
.95
$
86
9,7
25
.16
$
9
78
,03
1.8
9$
1
,09
2,4
12
.49
$
1,2
13
,32
8.3
8$
1
,34
1,2
59
.70
$
1,4
76
,70
6.0
6$
1
,62
0,1
87
.26
$
1
,77
6,0
29
.64
$
Total liabilities and stockholders equity
$1,142,630
$1,046,751
$1,028,397
$1,022,570
$1,092,167
$1,124,114
10
0.0
0%
1,1
51
,22
5.2
4$
1
,16
5,5
56
.68
$
1
,20
0,5
23
.38
$
1
,23
6,5
39
.08
$
1,2
73
,63
5.2
6$
1
,31
1,8
44
.31
$
1,3
51
,19
9.6
4$
1
,39
1,7
35
.63
$
1,4
33
,48
7.7
0$
1,4
76
,49
2.3
3$
RO
E9
.46
%1
5.8
3%
16
.16
%1
8.1
3%
19
.73
%2
1.2
4%
19
.61
%1
8.3
0%
17
.23
%1
6.3
4%
15
.58
%1
4.9
2%
14
.35
%1
3.8
4%
13
.61
%
% c
ha
ng
e o
f R
OE
6.3
7%
0.3
3%
1.9
7%
1.5
9%
1.5
1%
-1.6
3%
-1.3
1%
-1.0
7%
-0.8
9%
-0.7
6%
-0.6
6%
-0.5
7%
-0.5
1%
-0.2
2%
TL/S
E1
.52
1.0
30
.74
0.8
80
.88
0.9
50
.72
0.5
20
.38
0.2
60
.17
0.0
80
.01
-0.0
6-0
.12
-0.1
7
Co
mm
on
Siz
e B
ala
nce
Sh
ee
tA
ssu
me
Av
era
ge
20
08
20
09
20
10
20
11
20
12
20
13
2014
2015
2016
2017
2018
2019
2020
2021
2022
2023
Asse
ts
Current assets:
Cash and cash equivalents
7.0
4%
7.9
4%
4.7
1%
7.6
5%
5.4
9%
6.5
7%
5.7
2%
6.0
2%
6.2
3%
6.4
4%
6.6
6%
6.8
9%
7.1
3%
7.3
8%
7.6
4%
7.9
0%
Investments and marketable securities
Accounts receivable
1.0
8%
1.5
7%
1.1
1%
1.3
3%
0.9
0%
1.2
0%
Income tax receivable
Other receivables
2.6
2%
2.6
5%
3.1
4%
4.4
0%
4.9
3%
3.5
5%
Inventories
2.1
2%
2.2
4%
2.7
6%
2.6
4%
3.1
6%
2.5
8%
2.6
0%
2.7
0%
2.7
6%
2.7
7%
2.7
7%
2.7
1%
2.7
3%
2.7
4%
2.7
5%
2.7
4%
Prepaid expenses
2.6
6%
2.7
6%
3.5
7%
3.6
5%
3.7
9%
3.2
9%
Deferred income taxes
Total current assets
16
.45
%1
8.0
9%
17
.25
%2
1.0
8%
20
.10
%1
8.5
9%
18
.59
%1
8.5
9%
18
.59
%1
8.5
9%
18
.59
%1
8.5
9%
18
.59
%1
8.5
9%
18
.59
%1
8.5
9%
Property and equipment, net
75
.32
%7
3.4
6%
74
.18
%6
9.9
9%
70
.76
%7
2.7
4%
73
.87
%7
4.9
6%
74
.86
%7
4.8
6%
74
.86
%7
4.8
6%
74
.86
%7
4.8
6%
74
.86
%7
4.8
6%
Other assets:
2.6
3%
3.1
1%
2.3
0%
2.6
5%
3.3
0%
2.8
0%
Intangible assets, net
0.4
1%
0.4
4%
1.4
4%
1.6
3%
1.6
6%
1.1
2%
Prepaid rent
5.1
8%
4.9
0%
4.8
4%
4.6
5%
4.1
9%
4.7
5%
Other
2.6
3%
3.1
1%
2.3
0%
2.6
5%
3.3
0%
2.8
0%
Total other assets
8.2
3%
8.4
5%
8.5
7%
8.9
3%
9.1
5%
8.6
7%
Total Noncurrent Assets
83
.35
%8
3.5
5%
81
.91
%8
2.7
5%
78
.92
%8
2.1
0%
81
.41
%8
1.4
1%
81
.41
%8
1.4
1%
81
.41
%8
1.4
1%
81
.41
%8
1.4
1%
81
.41
%8
1.4
1%
Total assets
10
0.0
0%
10
0.0
0%
10
0.0
0%
10
0.0
0%
10
0.0
0%
10
0.0
0%
LIABILITIES AND STOCKHOLDERS EQUITY
Current liabilities:
Accounts payable
4.9
2%
6.1
5%
8.2
9%
9.7
9%
6.9
1%
7.2
1%
Income tax payable
Other accrued expenses
31
.38
%3
9.0
0%
38
.99
%3
9.9
7%
41
.85
%3
8.2
4%
Total current liabilities
37
.78
%4
6.4
9%
46
.53
%4
9.3
8%
48
.33
%4
5.7
0%
51
.04
%6
2.3
2%
78
.00
%1
01
.34
%1
49
.81
%2
82
.91
%2
89
7.7
1%
-34
9.0
4%
-16
3.6
3%
-10
4.9
0%
Deferred income taxes
16
.40
%1
9.9
3%
21
.66
%1
7.9
2%
17
.78
%1
8.7
4%
Deferred rent
12
.10
%1
5.4
2%
14
.54
%1
4.8
6%
13
.66
%1
4.1
2%
Deemed landlord financing liability
9.7
6%
11
.91
%1
1.4
8%
10
.76
%1
2.1
1%
11
.20
%
Long term debt
18
.85
%1
8.8
5%
Other noncurrent liabilities
5.1
1%
6.2
4%
5.8
0%
7.0
8%
8.1
2%
6.4
7%
Total noncurrent Liabilities
62
.22
%5
3.5
1%
53
.47
%5
0.6
2%
51
.67
%5
4.3
0%
48
.96
%3
7.6
8%
22
.00
%-1
.34
%-4
9.8
1%
-18
2.9
1%
-27
97
.71
%4
49
.04
%2
63
.63
%2
04
.90
%
Total Liabilities
10
0.0
0%
10
0.0
0%
10
0.0
0%
10
0.0
0%
10
0.0
0%
10
0.0
0%
10
0.0
0%
10
0.0
0%
10
0.0
0%
10
0.0
0%
10
0.0
0%
10
0.0
0%
10
0.0
0%
10
0.0
0%
10
0.0
0%
10
0.0
0%
To
ta
l Lia
bil
itie
s t
o T
ota
l L&
E5
0.6
9%
42
.40
%4
6.9
2%
46
.92
%4
8.6
4%
47
.12
%4
1.8
4%
34
.19
%2
7.5
5%
20
.91
%1
4.2
3%
7.5
1%
0.7
4%
-6.1
1%
-13
.02
%-2
0.2
9%
Stockholders equity:
Preferred stock, $.01 par value, 5,000,000
shares authorized; none issued
Junior participating cumulative preferred
stock, $.01 par value, 150,000 shares authorized; none
0.1
6%
0.1
4%
0.1
6%
0.1
5%
0.1
6%
0.1
5%
issued
Common stock, $.01 par value, 250,000,000
76
.36
%7
6.7
6%
62
.34
%6
1.0
9%
59
.33
%6
7.1
8%
0.0
0%
0.0
0%
0.0
0%
0.0
0%
0.0
0%
0.0
0%
0.0
0%
0.0
0%
0.0
0%
0.0
0%
shares authorized; 90,632,325 and 87,812,022
shares issued at December 31, 2013 and January 1,
61
.10
%7
0.1
3%
79
.89
%8
2.6
4%
88
.02
%7
6.3
6%
73
.87
%7
4.9
6%
74
.86
%7
4.8
6%
74
.86
%7
4.8
6%
74
.86
%7
4.8
6%
74
.86
%7
4.8
6%
2013, respectively
Additional paid-in capital
Retained earnings
98
.08
%9
4.2
5%
13
4.5
8%
14
3.4
8%
17
5.8
8%
12
9.2
6%
13
7.8
9%
10
7.6
6%
83
.14
%6
2.8
6%
45
.81
%3
1.2
8%
18
.76
%7
.86
%-1
.69
%-1
0.3
2%
Accmulated other comprehensive loss
Treasury stock 38,865,951 and 34,414,222
shares at cost at December 31, 2013 and January 1,
2013, respectively
Total stockholders equity
10
0.0
0%
10
0.0
0%
10
0.0
0%
10
0.0
0%
10
0.0
0%
10
0.0
0%
10
0.0
0%
10
0.0
0%
10
0.0
0%
10
0.0
0%
10
0.0
0%
10
0.0
0%
10
0.0
0%
10
0.0
0%
10
0.0
0%
10
0.0
0%
Equity to Total L&E
49
.31
%5
7.6
0%
53
.08
%5
3.0
8%
51
.36
%5
2.8
8%
58
.16
%6
5.8
1%
72
.45
%7
9.0
9%
85
.77
%9
2.4
9%
99
.26
%1
06
.11
%1
13
.02
%1
20
.29
%
Total liabilities and stockholders equity
10
0.0
0%
10
0.0
0%
10
0.0
0%
10
0.0
0%
10
0.0
0%
10
0.0
0%
10
0.0
0%
10
0.0
0%
10
0.0
0%
10
0.0
0%
10
0.0
0%
10
0.0
0%
10
0.0
0%
10
0.0
0%
10
0.0
0%
10
0.0
0%
Actu
al
Fin
an
cia
l S
ta
te
me
nts
Fo
re
ca
ste
d
Co
nso
lid
ate
d F
ina
ncia
l S
ta
te
me
nts
Fo
re
ca
ste
d
FORECASTS
Balance Sheet As Stated

170 | P a g e
CHEESECAKE FACTORY INC
10-K
02/27/2014
Balance Sheet (Adjusted)
Assume
Av
era
ge
20
08
20
09
20
10
2011
2012
2013
2014
2015
2016
2017
2018
2019
2020
2021
2022
2023
ASSETS
Current assets:
Cash and cash equivalents
$80,365
$73,715
$81,619
$48,211
$83,569
$61,751
5.1
7%
64
,94
4.8
7$
68
,30
3.9
3$
71
,83
6.7
3$
7
5,5
52
.25
$
79
,45
9.9
4$
83
,56
9.7
5$
87
,89
2.1
2$
9
2,4
38
.06
$
9
7,2
19
.11
$
1
02
,24
7.4
5$
Investments and marketable securities
996
Accounts receivable
12,537
11,352
16,184
11,334
14,558
10,081
0.9
4%
Income tax receivable
12,713
1,875
3,840
5,472
4,529
Other receivables
32,821
27,475
27,296
32,096
48,100
55,461
2.7
9%
Inventories
23,132
22,202
23,036
28,210
28,836
35,478
2.0
3%
29
,95
4.9
5$
31
,46
9.6
8$
33
,17
6.0
3$
3
4,2
12
.97
$
35
,33
0.5
6$
35
,55
5.0
7$
36
,83
6.0
7$
3
8,1
30
.96
$
3
9,3
71
.73
$
4
0,5
11
.60
$
Prepaid expenses
24,654
27,871
28,345
36,498
39,887
42,595
2.5
8%
Deferred income taxes
3,001
7,737
5,732
14,574
15,257
16,008
Total current assets
190,219
172,227
186,052
176,395
230,207
225,903
14
.63
%2
29
,21
1.0
1$
2
36
,08
7.3
4$
2
43
,16
9.9
6$
25
0,4
65
.05
$
2
57
,97
9.0
1$
2
65
,71
8.3
8$
2
73
,68
9.9
3$
28
1,9
00
.63
$
29
0,3
57
.64
$
29
9,0
68
.37
$
Property and equipment, net
860,489
788,402
755,468
758,503
764,418
795,379
57
.25
%8
96
,94
6.3
7$
9
23
,85
4.7
6$
9
51
,57
0.4
0$
98
0,1
17
.51
$
1
,00
9,5
21
.04
$
1
,03
9,8
06
.67
$
1
,07
1,0
00
.87
$
1,1
03
,13
0.8
9$
1,1
36
,22
4.8
2$
1,1
70
,31
1.5
7$
OL CAP RIGHTS
$244,318.00
$266,193.00
$281,051.00
$287,575.00
$295,899.00$307,645.00
Other assets:
Intangible assets, net
4,177
4,338
4,498
14,674
17,829
18,647
0.8
8%
Prepaid rent
58,323
54,243
50,391
49,490
50,793
47,064
3.7
4%
Other
29,422
27,541
31,988
23,508
28,920
37,121
2.2
0%
Total otherassets
91,922
86,122
86,877
87,672
97,542
102,832
6.8
2%
10
9,8
44
.17
$
11
7,3
34
.50
$
12
5,3
35
.60
$
1
33
,88
2.3
0$
14
3,0
11
.81
$
15
2,7
63
.86
$
16
3,1
80
.91
$
1
74
,30
8.3
0$
1
86
,19
4.4
8$
1
98
,89
1.1
8$
Total Noncurrent Assets
1,196,729
1,140,717
1,123,396
1,133,750
1,157,859
1,205,856
85
.78
%1
,33
7,4
53
.26
$
1,3
77
,57
6.8
5$
1,4
18
,90
4.1
6$
1,4
61
,47
1.2
8$
1,5
05
,31
5.4
2$
1,5
50
,47
4.8
8$
1,5
96
,98
9.1
3$
1
,64
4,8
98
.81
$
1
,69
4,2
45
.77
$
1
,74
5,0
73
.14
$
Total assets
$1,386,948
$1,312,944
$1,309,448
$1,310,145
$1,388,066
$1,431,759
10
0.0
0%
1,5
66
,66
4.2
6$
1
,61
3,6
64
.19
$
1
,66
2,0
74
.11
$
1
,71
1,9
36
.34
$
1
,76
3,2
94
.43
$
1
,81
6,1
93
.26
$
1
,87
0,6
79
.06
$
1,9
26
,79
9.4
3$
1,9
84
,60
3.4
1$
2,0
44
,14
1.5
2$
LIABILITIES AND STOCKHOLDERS EQUITY
Current liabilities:
Accounts payable
$37,875
$33,948
$32,651
$36,159
$46,998
$35,418
4.6
6%
Income tax payable
1,213
Other accrued expenses
147,958
166,513
170,054
187,081
204,823
228,829
24
.22
%
Total current liabilities
185,833
200,461
202,705
223,240
253,034
264,247
28
.95
%2
63
,23
8.3
8$
2
70
,53
5.8
4$
2
81
,07
7.2
8$
28
5,3
87
.41
$
2
95
,75
5.0
4$
3
03
,61
9.4
7$
3
13
,76
8.0
3$
32
3,0
86
.45
$
33
2,7
88
.06
$
34
2,2
90
.16
$
Deferred income taxes
87,045
87,048
86,918
103,927
91,852
97,237
11
.87
%
Deferred rent
57,286
64,209
67,258
69,742
76,144
74,690
8.9
4%
Deemed landlord financing liability
54,887
51,802
51,954
55,086
55,123
66,197
7.1
0%
Long term debt
275,000
100,000
Other noncurrent liabilities
30,013
27,118
27,225
27,822
36,288
44,390
4.1
0%
OL CAP Liabilities
244,318
266,193
281,051
287,575
295,899
307,645
Total Noncurrent Liabilities:
748,549
596,370
514,406
544,152
555,306
590,159
71
.05
%6
33
,84
8.5
8$
5
76
,07
9.4
0$
5
11
,27
1.6
7$
44
8,5
17
.03
$
3
75
,12
6.9
0$
2
99
,24
5.4
2$
2
15
,65
1.3
2$
12
7,0
06
.92
$
31
,62
8.1
0$
(74
,17
8.2
8)
$
Total Liabilities:
934,382
796,831
717,111
767,392
808,340
854,406
10
0.0
0%
89
7,0
86
.96
$
84
6,6
15
.24
$
79
2,3
48
.95
$
7
33
,90
4.4
5$
67
0,8
81
.94
$
60
2,8
64
.88
$
52
9,4
19
.36
$
4
50
,09
3.3
7$
3
64
,41
6.1
6$
2
68
,11
1.8
8$
Commitments and contingencies
Stockholders equity:
Preferred stock, $.01 par value, 5,000,000
shares authorized; none issued
Junior participating cumulative preferred
stock, $.01 par value, 150,000 shares authorized; none
828
834
849
859
878
906
0.1
5%
90
7.4
0$
90
8.8
0$
9
10
.20
$
91
1.6
1$
9
13
.01
$
91
4.4
2$
9
15
.83
$
9
17
.25
$
91
8.6
6$
9
20
.08
$
issued
Common stock, $.01 par value, 250,000,000
shares authorized; 90,632,325 and 87,812,022
shares issued at December 31, 2013 and January 1,
370,919
386,562
428,527
455,339
508,130
602,469
67
.18
%6
60
,29
7.9
5$
6
37
,79
5.3
6$
6
14
,61
7.6
5$
59
0,7
44
.57
$
5
66
,15
5.2
5$
5
40
,82
8.2
1$
5
14
,74
1.3
3$
48
7,8
71
.79
$
46
0,1
96
.13
$
43
1,6
90
.16
$
2013, respectively
596,711
639,544
721,257
816,977
902,532
989,451
60
.06
%5
90
,31
6.0
0$
5
70
,19
8.3
5$
5
49
,47
7.1
4$
52
8,1
34
.25
$
5
06
,15
1.0
5$
4
83
,50
8.3
1$
4
60
,18
6.2
5$
43
6,1
64
.49
$
41
1,4
22
.05
$
38
5,9
37
.30
$
Additional paid-in capital
(9,684)
(4,619)
Retained earnings
(506,208)
(506,208)
(558,296)
(730,422)
(831,814)(1,015,473)
12
9.2
6%
(98
2,9
50
.33
)$
(94
9,4
51
.92
)$
(9
14
,94
8.5
0)
$
(87
9,4
09
.91
)$
(8
42
,80
5.1
1)
$
(80
5,1
02
.10
)$
(7
66
,26
7.9
5)
$
(7
26
,26
8.7
0)
$
(68
5,0
69
.42
)$
(6
42
,63
4.1
1)
$
Accmulated other comprehensive loss
Treasury stock 38,865,951 and 34,414,222
shares at cost at December 31, 2013 and January 1,
2013, respectively
Total stockholders equity
452,566
516,113
592,337
542,753
579,726
577,353
10
0.0
0%
66
9,5
77
.30
$
76
7,0
48
.95
$
86
9,7
25
.16
$
9
78
,03
1.8
9$
1,0
92
,41
2.4
9$
1,2
13
,32
8.3
8$
1,3
41
,25
9.7
0$
1
,47
6,7
06
.06
$
1
,62
0,1
87
.26
$
1
,77
6,0
29
.64
$
Total liabilities and stockholders equity
$1,386,948
$1,312,944
$1,309,448
$1,310,145
$1,388,066
$1,431,759
10
0.0
0%
1,5
66
,66
4.2
6$
1
,61
3,6
64
.19
$
1
,66
2,0
74
.11
$
1
,71
1,9
36
.34
$
1
,76
3,2
94
.43
$
1
,81
6,1
93
.26
$
1
,87
0,6
79
.06
$
1,9
26
,79
9.4
3$
1,9
84
,60
3.4
1$
2,0
44
,14
1.5
2$
RO
E9
.46
%1
5.8
3%
16
.16
%1
8.1
3%
19
.73
%2
1.2
4%
19
.61
%1
8.3
0%
17
.23
%1
6.3
4%
15
.58
%1
4.9
2%
14
.35
%1
3.8
4%
13
.61
%
% c
ha
ng
e o
f R
OE
67
.28
%2
.07
%1
2.2
2%
8.7
8%
-7.6
8%
-6.6
8%
-5.8
4%
-5.1
8%
-4.6
4%
-4.2
1%
-3.8
5%
-3.5
6%
-1.6
2%
TL/S
E2
.06
46
31
45
71
.54
39
08
02
1.2
10
64
69
81
.41
38
88
08
51
.39
43
48
36
51
.47
98
67
60
31
.34
1.1
00
.91
0.7
50
.61
0.5
00
.39
0.3
00
.22
0.1
5
Co
mm
on
Siz
e B
ala
nce
Sh
ee
t (
Ad
juste
d)
Assu
me
Av
era
ge
20
08
20
09
20
10
20
11
20
12
20
13
2014
2015
2016
2017
2018
2019
2020
2021
2022
2023
Asse
ts
Current assets:
Cash and cash equivalents
5.6
1%
6.2
3%
3.6
8%
6.0
2%
4.3
1%
5.1
7%
4.1
5%
4.2
3%
4.3
2%
4.4
1%
4.5
1%
4.6
0%
4.7
0%
4.8
0%
4.9
0%
5.0
0%
Investments and marketable securities
Accounts receivable
0.8
6%
1.2
4%
0.8
7%
1.0
5%
0.7
0%
0.9
4%
Income tax receivable
Other receivables
2.0
9%
2.0
8%
2.4
5%
3.4
7%
3.8
7%
2.7
9%
Inventories
1.6
9%
1.7
6%
2.1
5%
2.0
8%
2.4
8%
2.0
3%
1.9
1%
1.9
5%
2.0
0%
2.0
0%
2.0
0%
1.9
6%
1.9
7%
1.9
8%
1.9
8%
1.9
8%
Prepaid expenses
2.1
2%
2.1
6%
2.7
9%
2.8
7%
2.9
8%
2.5
8%
Deferred income taxes
Total current assets
13
.12
%1
4.2
1%
13
.46
%1
6.5
8%
15
.78
%1
4.6
3%
14
.63
%1
4.6
3%
14
.63
%1
4.6
3%
14
.63
%1
4.6
3%
14
.63
%1
4.6
3%
14
.63
%1
4.6
3%
Property and equipment, net
60
.05
%5
7.6
9%
57
.89
%5
5.0
7%
55
.55
%5
7.2
5%
57
.25
%5
7.2
5%
57
.25
%5
7.2
5%
57
.25
%5
7.2
5%
57
.25
%5
7.2
5%
57
.25
%5
7.2
5%
CAP OL RIGHTS
20
.27
%2
1.4
6%
21
.95
%2
1.3
2%
21
.49
%2
1.3
0%
0.0
0%
0.0
0%
0.0
0%
0.0
0%
0.0
0%
0.0
0%
0.0
0%
0.0
0%
0.0
0%
0.0
0%
Other assets:
2.1
0%
2.4
4%
1.7
9%
2.0
8%
2.5
9%
2.2
0%
Intangible assets, net
0.3
3%
0.3
4%
1.1
2%
1.2
8%
1.3
0%
0.8
8%
Prepaid rent
4.1
3%
3.8
5%
3.7
8%
3.6
6%
3.2
9%
3.7
4%
Other
2.1
0%
2.4
4%
1.7
9%
2.0
8%
2.5
9%
2.2
0%
Total other assets
6.5
6%
6.6
3%
6.6
9%
7.0
3%
7.1
8%
6.8
2%
Total Noncurrent Assets
86
.29
%8
6.8
8%
85
.79
%8
6.5
4%
83
.42
%8
5.7
8%
Total assets
10
0.0
0%
10
0.0
0%
10
0.0
0%
10
0.0
0%
10
0.0
0%
10
0.0
0%
LIABILITIES AND STOCKHOLDERS EQUITY
Current liabilities:
Accounts payable
3.6
3%
4.1
0%
5.0
4%
6.1
2%
4.3
8%
4.6
6%
Income tax payable
Other accrued expenses
20
.90
%2
3.7
1%
24
.38
%2
5.3
4%
26
.78
%2
4.2
2%
Total current liabilities
25
.16
%2
8.2
7%
29
.09
%3
1.3
0%
30
.93
%2
8.9
5%
29
.34
%3
1.9
5%
35
.47
%3
8.8
9%
44
.08
%5
0.3
6%
59
.27
%7
1.7
8%
91
.32
%1
27
.67
%
Deferred income taxes
10
.92
%1
2.1
2%
13
.54
%1
1.3
6%
11
.38
%1
1.8
7%
Deferred rent
8.0
6%
9.3
8%
9.0
9%
9.4
2%
8.7
4%
8.9
4%
Deemed landlord financing liability
6.5
0%
7.2
4%
7.1
8%
6.8
2%
7.7
5%
7.1
0%
Long term debt
12
.55
%1
2.5
5%
Other noncurrent liabilities
3.4
0%
3.8
0%
3.6
3%
4.4
9%
5.2
0%
4.1
0%
CAP OL LIAB
33
.41
%3
9.1
9%
37
.47
%3
6.6
1%
36
.01
%3
6.5
4%
Total noncurrent Liabilities
74
.84
%7
1.7
3%
70
.91
%6
8.7
0%
69
.07
%7
1.0
5%
70
.66
%6
8.0
5%
64
.53
%6
1.1
1%
55
.92
%4
9.6
4%
40
.73
%2
8.2
2%
8.6
8%
-27
.67
%
Total Liabilities
10
0.0
0%
10
0.0
0%
10
0.0
0%
10
0.0
0%
10
0.0
0%
10
0.0
0%
10
0.0
0%
10
0.0
0%
10
0.0
0%
10
0.0
0%
10
0.0
0%
10
0.0
0%
10
0.0
0%
10
0.0
0%
10
0.0
0%
10
0.0
0%
To
ta
l Lia
bil
itie
s t
o T
ota
l L&
E6
0.6
9%
54
.76
%5
8.5
7%
58
.23
%5
9.6
8%
58
.39
%5
7.2
6%
52
.47
%4
7.6
7%
42
.87
%3
8.0
5%
33
.19
%2
8.3
0%
23
.36
%1
8.3
6%
13
.12
%
Stockholders equity:
Preferred stock, $.01 par value, 5,000,000
shares authorized; none issued
Junior participating cumulative preferred
stock, $.01 par value, 150,000 shares authorized; none
0.1
6%
0.1
4%
0.1
6%
0.1
5%
0.1
6%
0.1
5%
issued
Common stock, $.01 par value, 250,000,000
76
.36
%7
6.7
6%
62
.34
%6
1.0
9%
59
.33
%6
7.1
8%
67
.18
%6
7.1
8%
67
.18
%6
7.1
8%
67
.18
%6
7.1
8%
67
.18
%6
7.1
8%
67
.18
%6
7.1
8%
shares authorized; 90,632,325 and 87,812,022
shares issued at December 31, 2013 and January 1,
48
.71
%5
5.0
8%
62
.36
%6
5.0
2%
69
.11
%6
0.0
6%
2013, respectively
Additional paid-in capital
Retained earnings
98
.08
%9
4.2
5%
13
4.5
8%
14
3.4
8%
17
5.8
8%
12
9.2
6%
14
6.8
0%
12
3.7
8%
10
5.2
0%
89
.92
%7
7.1
5%
66
.35
%5
7.1
3%
49
.18
%4
2.2
8%
36
.18
%
Accmulated other comprehensive loss
Treasury stock 38,865,951 and 34,414,222
shares at cost at December 31, 2013 and January 1,
2013, respectively
Total stockholders equity
10
0.0
0%
10
0.0
0%
10
0.0
0%
10
0.0
0%
10
0.0
0%
10
0.0
0%
10
0.0
0%
10
0.0
0%
10
0.0
0%
10
0.0
0%
10
0.0
0%
10
0.0
0%
10
0.0
0%
10
0.0
0%
10
0.0
0%
10
0.0
0%
Equity to Total L&E
39
.31
%4
5.2
4%
41
.43
%4
1.7
7%
40
.32
%4
1.6
1%
42
.74
%4
7.5
3%
52
.33
%5
7.1
3%
61
.95
%6
6.8
1%
71
.70
%7
6.6
4%
81
.64
%8
6.8
8%
Total liabilities and stockholders equity
10
0.0
0%
10
0.0
0%
10
0.0
0%
10
0.0
0%
10
0.0
0%
10
0.0
0%
10
0.0
0%
10
0.0
0%
10
0.0
0%
10
0.0
0%
10
0.0
0%
10
0.0
0%
10
0.0
0%
10
0.0
0%
10
0.0
0%
10
0.0
0%
Actu
al
Fin
an
cia
l S
ta
te
me
nts
Fo
re
ca
ste
d
Co
nso
lid
ate
d F
ina
ncia
l S
ta
te
me
nts
Fo
re
ca
ste
d
Balance Sheet Re Stated

171 | P a g e
Incom
e Stat
emen
t As S
tated
2008
2009
2010
2011
2012
2013
Assu
meAv
erag
e20
1420
1520
1620
1720
1820
1920
2020
2120
2220
2320
24
Reve
nues
$1,60
6,406
$1,60
2,020
$1,65
9,404
$1,75
7,624
$1,80
9,017
$1,87
7,910
3.00
%10
0%$1
,934,2
47.30
$1,99
2,274
.72$2
,052,0
42.96
$2,11
3,604
.25$2
,177,0
12.38
$2,24
2,322
.75$2
,309,5
92.43
$2,37
8,880
.20$2
,450,2
46.61
$2,52
3,754
.01$2
,599,4
66.63
Cost
of sa
les41
6,801
394,4
0941
2,855
448,4
6845
0,153
455,6
8524
.83%
$480
,328.4
0$4
94,73
8.25
$509
,580.4
0$5
24,86
7.81
$540
,613.8
4$5
56,83
2.26
$573
,537.2
3$5
90,74
3.34
$608
,465.6
5$6
26,71
9.61
GROS
S PRO
FIT1,1
89,60
51,2
07,61
11,2
46,54
91,3
09,15
61,3
58,86
41,4
22,22
575
%$1
,453,9
18.90
$1,49
7,536
.47$1
,542,4
62.56
$1,58
8,736
.44$1
,636,3
98.53
$1,68
5,490
.49$1
,736,0
55.20
$1,78
8,136
.86$1
,841,7
80.96
$1,89
7,034
.39
Labo
r exp
ense
s53
3,080
528,5
7853
6,954
567,3
5858
0,192
603,0
6932
.36%
$625
,994.4
0$6
44,77
4.23
$664
,117.4
6$6
84,04
0.99
$704
,562.2
1$7
25,69
9.08
$747
,470.0
5$7
69,89
4.16
$792
,990.9
8$8
16,78
0.71
Othe
r ope
rating
costs
and e
xpen
ses
397,4
9840
2,877
408,3
6242
8,442
439,5
5945
2,571
24.51
%$4
74,01
1.14
$488
,231.4
8$5
02,87
8.42
$517
,964.7
8$5
33,50
3.72
$549
,508.8
3$5
65,99
4.10
$582
,973.9
2$6
00,46
3.14
$618
,477.0
3
Gene
ral an
d adm
inistr
ative
expe
nses
83,73
197
,432
95,72
996
,263
104,1
5611
4,728
5.84%
$112
,938.8
8$1
16,32
7.05
$119
,816.8
6$1
23,41
1.36
$127
,113.7
0$1
30,92
7.12
$134
,854.9
3$1
38,90
0.58
$143
,067.5
9$1
47,35
9.62
Depr
eciat
ion an
d amo
rtiza
tion e
xpen
ses
73,29
075
,184
72,14
071
,958
74,43
378
,558
4.29%
$82,9
10.70
$85,3
98.02
$87,9
59.96
$90,5
98.76
$93,3
16.73
$96,1
16.23
$98,9
99.72
$101
,969.7
1$1
05,02
8.80
$108
,179.6
6
Impa
irmen
t of a
ssets
2,952
26,54
11,5
479,5
36(56
1)
Preo
penin
g cos
ts11
,883
3,282
5,153
10,13
812
,289
12,90
60.4
9%9,5
11.75
$
9,797
.10$
10,09
1.02
$
10
,393.7
5$
10,70
5.56
$
11
,026.7
3$
11,35
7.53
$
11,69
8.26
$
12
,049.2
0$
12,41
0.68
$
Total
costs
and e
xpen
ses
1,519
,235
1,528
,303
1,531
,193
1,624
,174
1,670
,318
1,716
,956
Incom
e fro
m op
erati
ons
87,17
173
,717
128,2
1113
3,450
138,6
9916
0,954
+.00
05%
7.23%
$166
,749.7
4$1
72,74
8.37
$177
,930.8
2$1
83,26
8.75
$188
,766.8
1$1
94,42
9.82
$200
,262.7
1$2
06,27
0.59
$212
,458.7
1$2
18,83
2.47
Inter
est e
xpen
se(14
,788)
(23,43
3)(16
,808)
(4,30
7)(4,
725)
(4,50
4)-0.
64%
($12,4
63.09
)($1
2,836
.98)
($13,2
22.09
)($1
3,618
.75)
($14,0
27.31
)($1
4,448
.13)
($14,8
81.58
)($1
5,328
.02)
($15,7
87.87
)($1
6,261
.50)
Inter
est in
come
1,849
372
192
Othe
r inco
me/(e
xpen
se), n
et(97
7)65
1(50
6)
Incom
e bef
ore i
ncom
e tax
es73
,255
51,30
711
1,089
129,1
4313
3,974
156,4
50+.
005
6.60%
$170
,814.7
4$1
85,90
0.55
$201
,737.7
8$2
18,35
7.94
$235
,793.7
4$2
54,07
9.16
$273
,249.5
0$2
93,34
1.39
$314
,392.8
6$3
36,44
3.42
Incom
e tax
prov
ision
20,96
28,4
7429
,376
33,42
335
,551
42,09
41.6
8%$3
2,524
.67$3
3,500
.41$3
4,505
.42$3
5,540
.59$3
6,606
.80$3
7,705
.01$3
8,836
.16$4
0,001
.24$4
1,201
.28$4
2,437
.32
Net in
come
$52,2
93$4
2,833
$81,7
13$9
5,720
$98,4
23$1
14,35
6+.
0025
4.91%
$122
,622.3
0$1
31,28
1.65
$140
,350.2
1$1
49,84
4.73
$159
,782.6
0$1
70,18
1.89
$181
,061.3
2$1
92,44
0.36
$204
,339.1
9$2
20,56
4.38
Com
mon
Siz
e In
com
e St
atem
ent
Fisc
al Y
ear
2008
2009
2010
2011
2012
2013
2014
2015
2016
2017
2018
2019
2020
2021
2022
2023
(Dol
lars
in th
ousa
nds,
exc
ept p
er sh
are
and
sale
s per
squa
re fo
ot d
ata)
Aggre
gate
SG
Stat
emen
t of I
ncom
e Da
ta:
15.96
0%Ag
grega
te
Sale
s Gro
wth
Per
cent
-0.27
3%3.5
82%
5.919
%2.9
24%
3.808
%0.0
33.1
92%
3.00%
3.00%
3.00%
3.00%
3.00%
3.00%
3.00%
3.00%
3.00%
3.00%
30.00
%
Net s
ales
100.0
0%10
0.00%
100.0
0%10
0.00%
100.0
0%10
0%10
0.00%
100.0
0%10
0.00%
100.0
0%10
0.00%
100.0
0%10
0.00%
100.0
0%10
0.00%
100.0
0%
Cost
of g
oods
sold
(1)
24.62
%24
.88%
25.52
%24
.88%
24.27
%24
.83%
24.83
%24
.83%
24.83
%24
.83%
24.83
%24
.83%
24.83
%24
.83%
24.83
%24
.83%
Gros
s pro
fit75
.38%
75.12
%74
.48%
75.12
%75
.73%
75.17
%75
.17%
75.17
%75
.17%
75.17
%75
.17%
75.17
%75
.17%
75.17
%75
.17%
75.17
%
Selli
ng, g
ener
al a
nd a
dmin
istr
ativ
e ex
pens
es6.0
8%5.7
7%5.4
8%5.7
6%6.1
1%5.8
4%5.8
4%5.8
4%5.8
4%5.8
4%5.8
4%5.8
4%5.8
4%5.8
4%5.8
4%5.8
4%
Pre-
open
ing
expe
nses
0.20%
0.31%
0.58%
0.68%
0.69%
0.49%
0.49%
0.49%
0.49%
0.49%
0.49%
0.49%
0.49%
0.49%
0.49%
0.49%
Labo
r Exp
ense
s32
.99%
32.36
%32
.28%
32.07
%32
.11%
32.36
%32
.36%
32.36
%32
.36%
32.36
%32
.36%
32.36
%32
.36%
32.36
%32
.36%
32.36
%
Othe
r Ope
ratin
g Co
sts a
nd E
xpen
ses
25.15
%24
.61%
24.38
%24
.30%
24.10
%24
.51%
24.51
%24
.51%
24.51
%24
.51%
24.51
%24
.51%
24.51
%24
.51%
24.51
%24
.51%
Depr
ecia
tion
and
Amor
tizat
ion
Expe
nses
4.69%
4.35%
4.09%
4.11%
4.18%
4.29%
4.29%
4.29%
4.29%
4.29%
4.29%
4.29%
4.29%
4.29%
4.29%
4.29%
Inco
me
from
ope
ratio
ns4.6
0%7.7
3%7.5
9%7.6
7%8.5
7%+.
0005
% 7.2
3%8.6
2%8.6
7%8.6
7%8.6
7%8.6
7%8.6
7%8.6
7%8.6
7%8.6
7%8.6
7%
(Gai
n) o
n sa
le /
loss
on
writ
e-do
wn
of n
on-c
ash
inve
stm
ent (
2) (3
)
Inte
rest
exp
ense
-1.46
3%-1.
013%
-0.24
5%-0.
261%
-0.24
0%-0.
64%
-0.64
%-0.
64%
-0.64
%-0.
64%
-0.64
%-0.
64%
-0.64
%-0.
64%
-0.64
%-0.
64%
Othe
r inc
ome
Inco
me
befo
re in
com
e ta
xes
3.20%
6.69%
7.35%
7.41%
8.33%
+.00
56.6
0%8.8
3%9.3
3%9.8
3%10
.33%
10.83
%11
.33%
11.83
%12
.33%
12.83
%13
.33%
Prov
isio
n fo
r inc
ome
taxe
s0.5
3%1.7
7%1.9
0%1.9
7%2.2
4%1.6
8%1.6
8%1.6
8%1.6
8%1.6
8%1.6
8%1.6
8%1.6
8%1.6
8%1.6
8%1.6
8%
Net i
ncom
e2.6
7%4.9
2%5.4
5%5.4
4%6.0
9%+.
0025
4.91%
6.34%
6.59%
6.84%
7.09%
7.34%
7.59%
7.84%
8.09%
8.34%
8.74%
Actu
al Fin
ancia
lsFo
reca
sted F
inanc
ial St
ateme
nts
Fore
caste
d Fina
ncial
State
ment
s
Income Statement Forecasts

172 | P a g e
Chee
seca
ke C
ash
Flo
ws
2008
2009
2010
2011
2012
2013
Rat
ioA
ssu
me
2014
2015
2016
2017
2018
2019
2020
2021
2022
2023
Cash flows from operating activities:
Net income
$52,293
$42,833
$81,713
$95,720
$98,423
$114,356
122,
622.
30$
13
1,28
1.65
$
140,
350.
21$
149,
844.
73$
15
9,78
2.60
$
17
0,18
1.89
$
181,
061.
32$
192,
440.
36$
204,
339.
19$
22
0,56
4.38
$
Adjustments to reconcile net income to
cash provided by operating activities:
Depreciation and amortization
73,290
75,184
72,140
71,958
74,433
78,558
Impairment of assets
2,952
26,541
1,547
5,469
3,294
Realized loss on derivative financial
7,421
7,376
instruments
Deferred income taxes
22,179
(4,798)
(4,087)
7,907
(12,758)
4,633
Stock-based compensation
13,132
14,610
10,913
9,635
10,838
14,135
Tax impact of stock options exercised,
(822)
(1,117)
233
844
2,435
7,159
net of cancellations
Excess tax benefit related to stock options
(410)
(857)
(3,357)
(741)
(2,801)
(7,765)
exercised
Other
(145)
1,957
178
1,023
1,259
(464)
Changes in assets and liabilities:
Change in Current Assets
(17,992)
13,825
(9,657)
53,812
(4,304)
Change in PPE, net
(72,087)
(32,934)
3,035
5,915
30,961
55,0
60.5
9$
23,2
08.4
6$
25
,027
.19
$
26
,960
.26
$
27
,769
.06
$
28,6
02.1
4$
29,4
60.2
0$
30
,344
.01
$
31,2
54.3
3$
32,1
91.9
6$
Chan
ge in
PP
E, g
ross
(CA
PEX
)12,950.00
$
(27,362.00)
$
###########
###########
(57,424.00)
$
(59,
472.
03)
$
(4
5,27
8.97
)$
(4
6,63
7.34
)$
(48,
036.
46)
$
(49,
477.
55)
$
(50,
961.
88)
$
(52,
490.
74)
$
(54,
065.
46)
$
(5
5,68
7.42
)$
(5
7,35
8.05
)$
Change in NCA
(77,887)
(32,179)
3,830
15,785
36,251
38,9
57.2
6$
11,6
66.6
7$
28
,465
.05
$
29
,319
.00
$
30
,198
.57
$
31,1
04.5
3$
32,0
37.6
6$
32
,998
.79
$
33,9
88.7
6$
35,0
08.4
2$
Accounts receivable
(1,190)
1,185
(4,832)
4,850
(3,224)
4,477
Other receivables
28,224
5,346
179
(4,800)
(16,004)
(6,486)
Inventories
926
930
(834)
(5,174)
(626)
(6,642)
Prepaid expenses
3,225
(3,217)
(474)
(8,153)
(3,389)
(2,708)
Other assets
2,654
5,013
(1,259)
(545)
(6,533)
(3,997)
Accounts payable
(20,047)
(3,927)
(1,297)
3,508
10,839
(11,580)
Income taxes payable
(9,281)
7,865
(1,964)
(1,632)
6,685
(5,742)
Termination of derivative financial instruments
(7,421)
(7,376)
Other accrued expenses
2,205
29,587
17,984
20,117
30,325
23,557
Cash provided by operating activities
169,185
197,135
165,236
196,064
195,371
204,785
CFFO
/NI
2.00
245,
244.
60$
26
2,56
3.31
$
280,
700.
42$
299,
689.
46$
31
9,56
5.20
$
34
0,36
3.77
$
362,
122.
65$
384,
880.
73$
408,
678.
38$
44
1,12
8.77
$
Cash flows from investing activities:
Additions to property and equipment
(84,907)
(37,243)
(41,847)
(76,746)
(86,442)
(106,289)
(59,
472.
03)
$
(4
5,27
8.97
)$
(4
6,63
7.34
)$
(48,
036.
46)
$
(49,
477.
55)
$
(50,
961.
88)
$
(52,
490.
74)
$
(54,
065.
46)
$
(5
5,68
7.42
)$
(5
7,35
8.05
)$
Sales of available-for-sale securities
11,469
1,000
Additons to intangible assets
(870)
(1,712)
(1,654)
Cash used in investing activities (CAPEX)
(73,438)
(36,243)
(41,847)
(77,616)
(88,154)
(107,943)
(59,
472.
03)
$
(4
5,27
8.97
)$
(4
6,63
7.34
)$
(48,
036.
46)
$
(49,
477.
55)
$
(50,
961.
88)
$
(52,
490.
74)
$
(54,
065.
46)
$
(5
5,68
7.42
)$
(5
7,35
8.05
)$
Cash flows from financing activities:
Deemed landlord financing proceeds
17,862
6,354
4,198
5,070
2,098
13,672
Deemed landlord financing payments
(1,247)
(1,436)
(1,529)
(1,687)
(1,887)
(2,143)
Proceeds from exercise of employee stock
2,669
1,683
30,577
16,146
39,283
72,896
options
Excess tax benefit related to stock options
410
857
3,357
741
2,801
7,765
exercised
Cash Dividends Paid
(12,762)
(27,191)
(30,
398.
00)
$
(3
3,81
0.00
)$
(3
7,67
4.00
)$
(41,
538.
00)
$
(45,
402.
00)
$
(49,
266.
00)
$
(53,
130.
00)
$
(56,
994.
00)
$
(6
0,85
8.00
)$
(6
4,72
2.00
)$
(Repayment) /borrowings on credit facility
100,000
(175,000)
(100,000)
Purchase of treasury stock
(172,459)
(52,088)
(172,126)
(101,392)
(183,659)
Capital contribution
516
Cash used in financing activities
(52,249)
(167,542)
(115,485)
(151,856)
(71,859)
(118,660)
Ave
rage
CF
FO
/Sa
les
9.49
8.13
10.04
8.96
9.26
9.17
CFFO
/SA
LES
9.18
CF
FO
/Ne
t In
co
me
3.24
4.60
2.02
2.05
1.99
1.79
CFFO
/NI
2.00
2.00
2.00
2.00
2.00
2.00
2.00
2.00
2.00
2.00
2.00
CF
FO
/Op
era
tin
g In
co
me
1.94
2.67
1.29
1.47
1.41
1.27
CFFO
/OI
1.68
Div
ide
nd
Pa
yo
ut
12,762
27,191
30,3
98.0
0$
33,810.00
$
37,674.00
$
41,538.00
$
45,402.00
$
49,266.00
$
53,130.00
$
56,994.00
$
60,858.00
$
64,722.00
$
Net change in cash and cash equivalents
43,498
(6,650)
7,904
(33,408)
35,358
(21,818)
Cash and cash equivalents at beginning
36,867
80,365
73,715
81,619
48,211
83,569
of period
Cash and cash equivalents at end of period
$80,365
$73,715
$81,619
$48,211
$83,569
$61,751
Supplemental disclosures:
Interest paid
$14,864
$24,486
$17,492
$4,250
$4,434
$4,602
Income taxes paid
$8,612
$18,576
$31,038
$27,246
$40,954
$37,259
Change in Construction Payable
$4,993
$4,666
$6,397
Co
mm
on
Siz
e C
as
h F
low
s20
0820
0920
102011
2012
2013
2014
2015
$2,016
2017
2018
2019
2020
2021
2022
2023
Ne
t In
co
me
30.9
1%21
.73%
49.4
5%48
.82%
50.3
8%55
.84%
Ad
just
me
nts
to r
eco
ncile
ne
t inc
om
e to
ne
t ca
sh b
y O
pe
ratin
g A
ctiv
itie
s
Lo
ss o
n w
rite
do
wn
of n
on-
cash
inve
stm
ent
De
pre
cia
tion
and
am
ort
iza
tion
43.3
2%38
.14%
43.6
6%36
.70%
38.1
0%38
.36%
De
ferr
ed
Inco
me
Ta
xes
13.1
1%-2
.43%
-2.4
7%4.
03%
-6.5
3%2.
26%
Sto
ck B
ase
d C
om
pe
nsa
tion
7.76
%7.
41%
6.60
%4.
91%
5.55
%6.
90%
Exc
ess
tax
be
nefit
fro
m s
tock
--b
ase
d c
om
pe
nsa
tion
-0.2
4%-0
.43%
-2.0
3%-0
.38%
-1.4
3%-3
.79%
Ta
x b
ene
fit fr
om
exe
rcis
e o
f Sto
ck o
ptio
ns-0
.49%
-0.5
7%0.
14%
0.43
%1.
25%
3.50
%
Oth
er
non-
cash
ite
ms
-0.0
9%
Cha
nge
s in
Ass
ets
and
Lia
bili
ties:
Change in Current Assets
-9.1
3%8.
37%
-4.9
3%27
.54%
-2.1
0%
Change in PPE, net
-36.
57%
-19.
93%
1.55
%3.
03%
15.1
2%
Chan
ge in
PPE
, gro
ss (C
APE
X)-1
.06%
2.26
%6.
98%
5.19
%4.
12%
4.10
%3.
00%
3.00
%3.
00%
3.00
%3.
00%
3.00
%3.
00%
3.00
%3.
00%
A
cco
unts
Re
ceiv
ab
les
-0.7
0%0.
60%
-2.9
2%2.
47%
-1.6
5%2.
19%
In
vent
ori
es
0.55
%0.
47%
-0.5
0%-2
.64%
-0.3
2%-3
.24%
P
rep
aid
exp
ens
es
and
oth
er
ass
ets
1.91
%-1
.63%
-0.2
9%-4
.16%
-1.7
3%-1
.32%
A
cco
unts
Pa
yab
le-1
1.85
%-1
.99%
-0.7
8%1.
79%
5.55
%-5
.65%
A
ccru
ed
exp
ens
es
1.30
%15
.01%
10.8
8%10
.26%
15.5
2%11
.50%
In
com
e T
axe
s P
aya
ble
D
efe
rre
d C
ons
truc
tion
Allo
wa
nce
s
D
effe
red
Re
venu
e a
nd o
the
r L
iab
ilitie
s
Ne
t C
as
h p
rov
ide
d b
y O
pe
rati
ng
Ac
tiv
itie
s10
0.00
%10
0.00
%10
0.00
%10
0.00
%10
0.00
%10
0.00
%
Cash flows from investing activities:
Additions to property and equipment
115.
62%
102.
76%
100.
00%
98.8
8%98
.06%
98.4
7%10
0.00
%10
0.00
%10
0.00
%10
0.00
%10
0.00
%10
0.00
%10
0.00
%10
0.00
%10
0.00
%10
0.00
%
Sales of available-for-sale securities
-15.
62%
-2.7
6%
Additons to intangible assets
0.00
%0.
00%
0.00
%1.
12%
1.94
%1.
53%
Cash used in investing activities
100.
00%
100.
00%
100.
00%
100.
00%
100.
00%
100.
00%
100.
00%
100.
00%
100.
00%
100.
00%
100.
00%
100.
00%
100.
00%
100.
00%
100.
00%
100.
00%
Cash flows from financing activities:
Deemed landlord financing proceeds
-34.
19%
-3.7
9%-3
.64%
-3.3
4%-2
.92%
-11.
52%
Deemed landlord financing payments
2.39
%0.
86%
1.32
%1.
11%
2.63
%1.
81%
Proceeds from exercise of employee stock
-5.1
1%-1
.00%
-26.
48%
-10.
63%
-54.
67%
-61.
43%
options
Excess tax benefit related to stock options
-0.7
8%-0
.51%
-2.9
1%-0
.49%
-3.9
0%-6
.54%
exercised
Cash Dividends Paid
0.00
%0.
00%
0.00
%0.
00%
17.7
6%22
.92%
(Repayment) /borrowings on credit facility
-191
.39%
104.
45%
86.5
9%0.
00%
0.00
%0.
00%
Purchase of treasury stock
330.
07%
45.1
0%11
3.35
%14
1.10
%15
4.78
%
Capital contribution
-0.9
9%
Cash used in financing activities
100.
00%
100.
00%
100.
00%
100.
00%
100.
00%
100.
00%
Div
iden
d Pa
yout
Cha
nge
%11
3.06
%11
.79%
11.2
2%11
.43%
10.2
6%9.
30%
8.51
%7.
84%
7.27
%6.
78%
6.35
%
Net change in cash and cash equivalents
25.7
1%-3
.37%
4.78
%-1
7.04
%18
.10%
-10.
65%
Cash and cash equivalents at beginning
21.7
9%40
.77%
44.6
1%41
.63%
24.6
8%40
.81%
of period
Cash and cash equivalents at end of period
47.5
0%37
.39%
49.4
0%24
.59%
42.7
7%30
.15%
PPE Outflows
(84,907)
(37,243)
(41,847)
(76,746)
(86,442)
(106,289)
PPE net
860,489
788,402
755,468
758,503
764,418
795,379
Ratio of outflows to total ppe
9.87
%4.
72%
5.54
%10
.12%
11.3
1%13
.36%
Cash Flow Forecasts

173 | P a g e
Operating Lease Capitalization Table
2008 B/S rate: 6.55% FV pv factor PV
9-Feb 2006 2007 2008 1 81575 0.000498 40.65$
Total rent exp.81575 92041 104859 2 92041 2.48E-07 0.02$
3 104859 1.24E-10 0.00$
Restate: 40.67$
2009 B/S rate: 6.64% FV pv factor PV
10-Feb 2007 2008 2009 1 92041 0.000498 45.837151
total rent exp.92041 104859 106326 2 104859 2.48E-07 0.0260063
3 106326 1.24E-10 1.313E-05
Restate: 45.863171
2010 B/S rate: 6.45% FV pv factor PV
11-Feb 2008 2009 2010 1 104859 0.000498 52.194624
total rent exp.104859 106326 107012 2 106326 2.48E-07 0.0263439
3 107012 1.23E-10 1.32E-05
Restate: 52.220981
2011 B/S rate: 6.36% FV pv factor PV
12-Feb 2009 2010 2011 1 106326 0.000498 52.898507
total rent exp.106326 107012 111789 2 107012 2.48E-07 0.0264875
3 111789 1.23E-10 1.377E-05
Restate: 52.925009
2012 B/S rate: 6.45% FV pv factor PV
13-Feb 2010 2011 2012 1 107012 0.000497 53.213327
Total rent exp.107012 111789 116667 2 111789 2.47E-07 0.0276423
3 116667 1.23E-10 1.435E-05
Restate: 53.240983
2013 B/S rate: 6.37% FV pv factor PV
14-Feb 2011 2012 2013 1 111789 0.000497 55.561133
total rent exp.111789 116667 119677 2 116667 2.47E-07 0.0288199
3 119677 1.23E-10 1.469E-05
Restate: 55.589968

174 | P a g e
Balance Sheet Restatements
CHEESECAKE FACTORY INC
10-K
Balance Sheet
dr cr
ASSETS
Current assets:
Cash and cash equivalents
Investments and marketable securities
Accounts receivable
Income tax receivable
Other receivables
Inventories
Prepaid expenses
Deferred income taxes
Total current assets
Property and equipment, net
OL Cap. Rights 244,318 244,318
Other assets:
Marketable securities
Trademarks
Prepaid rent
Other
Total other assets
Total assets
LIABILITIES AND STOCKHOLDERS EQUITY
Current liabilities:
Accounts payable
Income taxes payable
Other accrued expenses
Total current liabilities
Deferred income taxes
Deferred rent
Deemed landlord financing liability
Long-term debt
Other noncurrent liabilities
OL Cap. Liabilities 244,318 244,318
Total Liabilities 690,064.00 934,382
Commitments and contingencies
Stockholders equity:
Preferred stock, $.01 par value, 5,000,000
shares authorized; none issued
Junior participating cumulative preferred
stock, $.01 par value, 150,000 shares authorized;
none issued
Common stock, $.01 par value, 250,000,000
shares authorized; 82,846,857 and 82,660,209
shares issued at December 30, 2008 and January 1,
2008, respectively
Additional paid-in capital
Retained earnings
Accumulated other comprehensive loss
Treasury stock 23,100,079 and 13,508,424
shares at cost at December 30, 2008 and January 1,
2008, respectively
Total stockholders equity
Total liabilities and stockholders equity
(506,208)
58,323
4,177
$37,875
$1,142,630
(506,208)
57,286
54,887
275,000
29,422
As stated
December 30, 2008
Restated
$80,365
996
12,537
12,713
32,821
23,132
December 30, 2008
12,713
12,537
996
$80,365
23,132
32,821
24,654
3,001
190,219
860,489
58,323
370,919
828
30,013
(9,684)
596,711
24,654
860,489
190,219
3,001
$1,142,630
452,566
4,177
91,922
$1,386,948
$37,875
147,958
185,833
87,045
828
370,919
596,711
452,566
91,922
87,045
185,833
147,958
275,000
54,887
57,286
$1,386,948
29,422
30,013
(9,684)

175 | P a g e
CHEESECAKE FACTORY INC
10-K
Balance Sheet
dr cr
ASSETS
Current assets:
Cash and cash equivalents
Investments and marketable securities
Accounts receivable
Income tax receivable
Other receivables
Inventories
Prepaid expenses
Deferred income taxes
Total current assets
Property and equipment, net
OL Cap. Rights 266,193 266,193
Other assets:
Trademarks
Prepaid rent
Other
Total other assets
Total assets
LIABILITIES AND STOCKHOLDERS EQUITY
Current liabilities:
Accounts payable
Other accrued expenses
Total current liabilities
Deferred income taxes
Deferred rent
Deemed landlord financing liability
Long-term debt
OL Cap. Liabilities 266,193 266,193
Other noncurrent liabilities
Total Liabilities 530,638 796,831
Commitments and contingencies
Stockholders equity:
Preferred stock, $.01 par value, 5,000,000
shares authorized; none issued
Junior participating cumulative preferred
stock, $.01 par value, 150,000 shares authorized;
none issued
Common stock, $.01 par value, 250,000,000
shares authorized; 83,377,092 and 82,846,857
shares issued at December 29, 2009 and December 30,
2008, respectively
Additional paid-in capital
Retained earnings
Accumulated other comprehensive loss
Treasury stock 23,100,079 shares at cost
at December 29, 2009 and December 30, 2008
Total stockholders equity
Total liabilities and stockholders equity
22,202
27,871
7,737
172,227
788,402
December 29, 2009
$73,715
11,352
1,875
27,475
834
386,562
$33,948
166,513
200,461
87,048
64,209
4,338
54,243
27,541
86,122
$1,046,751
As Stated Restated
December 29, 2009
$73,715
11,352
1,875
27,475
22,202
27,871
7,737
172,227
788,402
4,338
639,544
(4,619)
(506,208)
516,113
$1,046,751
51,802
100,000
27,118
$1,312,944
100,000
27,118
834
386,562
639,544
166,513
200,461
87,048
64,209
51,802
(4,619)
(506,208)
516,113
54,243
27,541
86,122
$1,312,944
$33,948

176 | P a g e
CHEESECAKE FACTORY INC
10-K
Balance Sheet
dr cr
ASSETS
Current assets:
Cash and cash equivalents
Accounts receivable
Income tax receivable
Other receivables
Inventories
Prepaid expenses
Deferred income taxes
Total current assets
Property and equipment, net
OL Cap. Rights 281,051 281,051
Other assets:
Trademarks
Prepaid rent
Other
Total other assets
Total assets
LIABILITIES AND STOCKHOLDERS EQUITY
Current liabilities:
Accounts payable
Other accrued expenses
Total current liabilities
Deferred income taxes
Deferred rent
Deemed landlord financing liability
Long-term debt
Other noncurrent liabilities
Commitments and contingencies
OL Cap. Liabilities 281,051 281,051
Total Liabilities 436,060 717,111
Stockholders equity:
Preferred stock, $.01 par value, 5,000,000
shares authorized; none issued
Junior participating cumulative preferred
stock, $.01 par value, 150,000 shares authorized;
none issued
Common stock, $.01 par value, 250,000,000
shares authorized; 84,912,101 and 83,377,092
shares issued at December 28, 2010 and December 29,
2009, respectively
Additional paid-in capital
Retained earnings
Accumulated other comprehensive loss
Treasury stock 25,204,104 and 23,100,079
shares at cost at December 28, 2010 and December 29,
2009, respectively
Total stockholders equity
Total liabilities and stockholders equity
86,877
31,988
$32,651
170,054
50,391
86,877
As stated
(558,296)
721,257
428,527
$1,028,397
592,337
$1,028,397
67,258
86,918
202,705
849
27,225
51,954
$81,619
December 28, 2010
27,296
3,840
16,184
5,732
28,345
23,036
4,498
755,468
186,052
Restated
December 28, 2010
$81,619
16,184
3,840
27,296
23,036
28,345
5,732
$1,309,448
67,258
51,954
27,225
849
428,527
$1,309,448
$32,651
170,054
202,705
86,918
186,052
721,257
(558,296)
592,337
755,468
4,498
50,391
31,988

177 | P a g e
CHEESECAKE FACTORY INC
10-K
Balance Sheet
dr cr
ASSETS
Current assets:
Cash and cash equivalents
Accounts receivable
Income tax receivable
Other receivables
Inventories
Prepaid expenses
Deferred income taxes
Total current assets
Property and equipment, net
OL Cap. Rights 287,475 287,475
Other assets:
Intangible assets, net
Prepaid rent
Other
Total other assets
Total assets
LIABILITIES AND STOCKHOLDERS EQUITY
Current liabilities:
Accounts payable
Other accrued expenses
Total current liabilities
Deferred income taxes
Deferred rent
Deemed landlord financing liability
Other noncurrent liabilities
Commitments and contingencies
OL Cap. Liabilities 287,475 287,475
Total Liabilities 479,817 767,292
Stockholders equity:
Preferred stock, $.01 par value, 5,000,000
shares authorized; none issued
Junior participating cumulative preferred
stock, $.01 par value, 150,000 shares authorized;
none issued
Common stock, $.01 par value, 250,000,000
shares authorized; 85,863,313 and 84,912,101
shares issued at January 3, 2012 and December 28,
2010, respectively
Additional paid-in capital
Retained earnings
Treasury stock 31,196,128 and 25,204,104
shares at cost at January 3, 2012 and December 28,
2010, respectively
Total stockholders equity
Total liabilities and stockholders equity
$48,211
14,674
758,503
176,395
87,672
23,508
49,490
187,081
$36,159
$1,022,570
69,742
103,927
$1,022,570
542,753
(730,422)
816,977
455,339
As stated As stated
January 3, 2012
$48,211
11,334
5,472
32,096
28,210
36,498
January 3, 2012
32,096
5,472
11,334
36,498
28,210
14,574
176,395
758,503
14,674
49,490
223,240
859
27,822
55,086
223,240
103,927
69,742
55,086
27,822
23,508
87,672
$1,310,045
$36,159
187,081
14,574
$1,310,045
859
455,339
816,977
(730,422)
542,753

178 | P a g e
CHEESECAKE FACTORY INC
10-K
Balance Sheet
dr cr
ASSETS
Current assets:
Cash and cash equivalents
Accounts receivable
Income tax receivable
Other receivables
Inventories
Prepaid expenses
Deferred income taxes
Total current assets
Property and equipment, net
OL Cap. Rights 295,899 295,899
Other assets:
Intangible assets, net
Prepaid rent
Other
Total other assets
Total assets
LIABILITIES AND STOCKHOLDERS EQUITY
Current liabilities:
Accounts payable
Income tax payable
Other accrued expenses
Total current liabilities
Deferred income taxes
Deferred rent
Deemed landlord financing liability
Other noncurrent liabilities
Commitments and contingencies
OL Cap. Liabilities 295,899 295,899
Total Liabilities 512,441 808,340
Stockholders equity:
Preferred stock, $.01 par value, 5,000,000
shares authorized; none issued
Junior participating cumulative preferred
stock, $.01 par value, 150,000 shares authorized; none
issued
Common stock, $.01 par value, 250,000,000
shares authorized; 87,812,022 and 85,863,313 shares
issued at January 1, 2013 and January 3,
2012, respectively
Additional paid-in capital
Retained earnings
Treasury stock 34,414,222 and 31,196,128
shares at cost at January 1, 2013 and January 3,
2012, respectively
Total stockholders equity
Total liabilities and stockholders equity
76,144
91,852
253,034
January 1, 2013
48,100
14,558
$83,569
15,257
39,887
28,836
17,829
764,418
230,207
97,542
28,920
50,793
204,823
1,213
$1,092,167
579,726
As stated Restated
January 1, 2013
$83,569
14,558
48,100
28,836
39,887
15,257
230,207
764,418
17,829
50,793
28,920
878
36,288
55,123
(831,814)
902,532
508,130
$46,998
$1,092,167
97,542
$1,388,066
$46,998
1,213
204,823
508,130
902,532
(831,814)
579,726
253,034
91,852
76,144
55,123
36,288
$1,388,066
878

179 | P a g e
CHEESECAKE FACTORY INC
10-K
Balance Sheet
dr cr
ASSETS
Current assets:
Cash and cash equivalents
Accounts receivable
Income tax receivable
Other receivables
Inventories
Prepaid expenses
Deferred income taxes
Total current assets
Property and equipment, net
OL Cap. Rights 307,645 307,645
Other assets:
Intangible assets, net
Prepaid rent
Other
Total other assets
Total assets
LIABILITIES AND STOCKHOLDERS EQUITY
Current liabilities:
Accounts payable
Income tax payable
Other accrued expenses
Total current liabilities
Deferred income taxes
Deferred rent
Deemed landlord financing liability
Other noncurrent liabilities
Commitments and contingencies
OL Cap. Liabilities 307,645 307,645
Total Liabilities 546,761 854,406
Stockholders equity:
Preferred stock, $.01 par value, 5,000,000
shares authorized; none issued
Junior participating cumulative preferred
stock, $.01 par value, 150,000 shares authorized; none
issued
Common stock, $.01 par value, 250,000,000
shares authorized; 90,632,325 and 87,812,022
shares issued at December 31, 2013 and January 1,
2013, respectively
Additional paid-in capital
Retained earnings
Treasury stock 38,865,951 and 34,414,222
shares at cost at December 31, 2013 and January 1,
2013, respectively
Total stockholders equity
Total liabilities and stockholders equity
(1,015,473)
989,451
602,469
$35,418
$1,124,114
37,121
102,832
$1,431,759
$35,418
228,829
$1,124,114
577,353
December 31, 2013
55,461
4,529
10,081
$61,751
16,008
42,595
35,478
18,647
795,379
225,903
102,832
37,121
47,064
228,829
As stated Restated
December 31, 2013
$61,751
10,081
4,529
55,461
35,478
42,595
16,008
225,903
795,379
18,647
47,064
906
44,390
66,197
$1,431,759
906
602,469
989,451
(1,015,473)
577,353
264,247
97,237
74,690
66,197
44,390
74,690
97,237
264,247
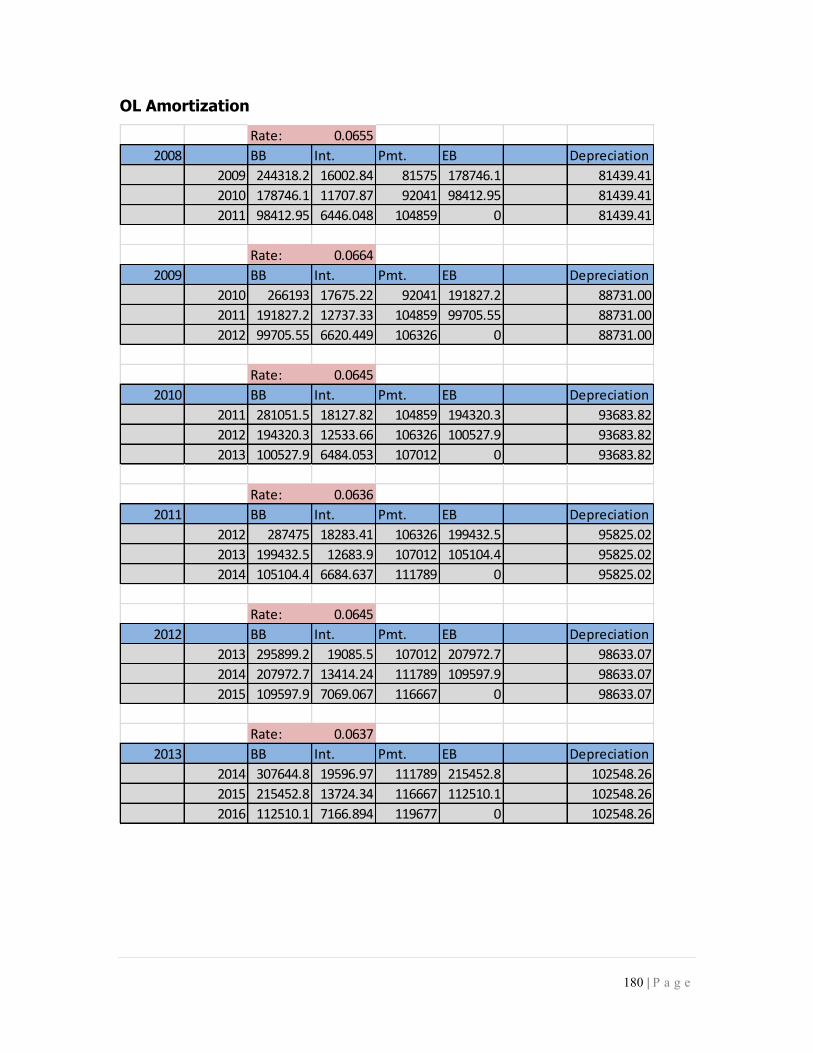
180 | P a g e
OL Amortization
Rate: 0.0655
2008 BB Int. Pmt. EB Depreciation
2009 244318.2 16002.84 81575 178746.1 81439.41
2010 178746.1 11707.87 92041 98412.95 81439.41
2011 98412.95 6446.048 104859 0 81439.41
Rate: 0.0664
2009 BB Int. Pmt. EB Depreciation
2010 266193 17675.22 92041 191827.2 88731.00
2011 191827.2 12737.33 104859 99705.55 88731.00
2012 99705.55 6620.449 106326 0 88731.00
Rate: 0.0645
2010 BB Int. Pmt. EB Depreciation
2011 281051.5 18127.82 104859 194320.3 93683.82
2012 194320.3 12533.66 106326 100527.9 93683.82
2013 100527.9 6484.053 107012 0 93683.82
Rate: 0.0636
2011 BB Int. Pmt. EB Depreciation
2012 287475 18283.41 106326 199432.5 95825.02
2013 199432.5 12683.9 107012 105104.4 95825.02
2014 105104.4 6684.637 111789 0 95825.02
Rate: 0.0645
2012 BB Int. Pmt. EB Depreciation
2013 295899.2 19085.5 107012 207972.7 98633.07
2014 207972.7 13414.24 111789 109597.9 98633.07
2015 109597.9 7069.067 116667 0 98633.07
Rate: 0.0637
2013 BB Int. Pmt. EB Depreciation
2014 307644.8 19596.97 111789 215452.8 102548.26
2015 215452.8 13724.34 116667 112510.1 102548.26
2016 112510.1 7166.894 119677 0 102548.26

181 | P a g e
Sources:
BJ’s Restaurant Inc. 2013 Annual Report. Brinker Restaurants
Incorporated, 2014. Web. 10 June 2014.
Brinker Intl. 2013 Annual Report. Brinker International Incorporated,
2014. Web 10 June. 2014
Darden Inc. 2013 Annual Report. Darden Incorporated, 2014. Web. 10
June 2014.
FASAB. "Combined Lease." . FASAB, n.d. Web. 16 June 2014.
<http://www.fasab.gov/pdffiles/combinedleasev4.pdf>.
"Federal Reserve Economic Data." - FRED. N.p., n.d. Web. 3 July 2014.
<http://research.stlouisfed.org/fred2/>.
Palepu, Kirshna. Business Analysis & Valuation Using Financial Statements.
: Cengage Learning, 2012. Print.
Stern. "Operating versus Capital Leases." . NYU, n.d. Web. 16 June 2014.
<http://pages.stern.nyu.edu/~adamodar/New_Home_Page/AccPrimer/lease.htm
>.
The Cheesecake Facotry Inc. 2013 Annual Report. The Cheesecake
Factory Incorporated, 2014. Web. 10 June 2014.
The Cheesecake Facotry Inc. 2013 Quarterly Report. The Cheesecake
Factory Incorporated, 2014. Web. 10 June 2014.
The Cheesecake Factory Incorporated. "Investor Relations", 1 Jan. 2014.
Web. 10 June 2014.
<http://investors.thecheesecakefactory.com/phoenix.zhtml?c=109258&p=irol-
IRHome/>.
"Yahoo Finance - Business Finance, Stock Market, Quotes, News." Yahoo
Finance. N.p., n.d. Web. 3 July 2014. <http://finance.yahoo.com/>.