Embed Size (px)
Citation preview

1
AnyLogic Conference 2013
Joe Simkins
Economist
Battelle Technology Partnership Practice
Disaster Response Applications
Using Agent-Based Modeling

Battelle• The world’s largest non-profit independent R&D organizations ($5.6 billion in revenues)
• Worldwide leader in development, commercialization, and transfer of technology
• Contract research with nearly 1,100 firms annually
• Battelle manages or co-manages seven national labs for the U.S. Department of Energy and the
U.S. Department of Homeland Security, and one international nuclear laboratory in the United
Kingdom
• More than 20,000 employees in more than 130 cities worldwide
• Simulation applications using AnyLogic across wide range of areas:
Health Care – Provider Resource Management, Clinical Workflow Modeling, Infection Control
Economic Development and Industry Cluster Forecasting
Vehicle Fleet Logistics and Maintenance
National Security & Disaster Response
2

Overview
3
• Disaster modeling represents a unique challenge:
Natural vs. man-made
Unique environments and physical consequences
Numerous scenario possibilities and threat vectors
Disaster response strategies rarely implemented as planned
Unknown human reactions
• Goal: Produce downstream model outputs to test policy decisions and input to other
models
Consequence
Model Inputs
Simulation
Model
Economic Impact
Models
Public Health
Response Models
Emergency
Response
Strategies

Using Simulation for Disaster
Modeling• Simulation is good way to evaluate the space of potential scenarios for a
variety of reasons
Disaster event that has never happened (and we hope never does)
Human response is a fundamentally unpredictable phenomenon which deterministic models
have limitations in incorporating
Often do not need exact answers, but instead need to compare alternatives (ordinal analysis)
• To truly capture the most important dynamics of a disaster event, the model
should sometimes exhibit unexpected outcomes
Emergence is key principle in modeling human systems
More simulation runs = better, build distribution of outcomes
• Key challenge: How do I validate a disaster model?
• Case study: IND Evacuation Model
4

Framework
5
Node Agents
Vehicle Agents
Disaster Consequence Contours
Transportation Infrastructure

Environment• Road networks are commonly modeled using node-
network layout
Data on road layouts from GIS databases
Local highway agencies keep data on speed limits, lane
capacity
Generate layout of node locations and network connections
from configuration files
• Use agents as node points to allow greater control
• Must incorporate changes to network through
dynamic events as disaster event unfolds, for
example:
Flooding of roads
Destruction of bridges and buildings
• Incorporation of major evacuation routes is often
enough to capture major emergent evacuation
patterns based on sensitivity studies
6

Agents – Physical Properties• Use agents linked to network model entities to model vehicles
• Physical limitations of vehicle agents are governed by parameter data
Vehicle profiles – US Census, Bureau of Transportation data
• Note: this library of models was built before the AnyLogic road library
was available
Future updates could incorporate hybridization of existing model with these
models – tradeoffs in model scale and runtime
7
Follow distance
Max speed/accelerationPassing decision
Node agent
Linked Agent Behavior
Statecharts
Stopping distance/queuing behavior
Linked Node Agent
Control Rules
Agents- Behavior• Drivers are irrational under normal circumstances, so how will behavior change during a mass
evacuation?
Data from disaster response studies, past mass evacuation events informs rational/irrational driving behavior
• Dynamic route finding – studies show that on a familiar road networks, drivers will make tradeoffs
between evacuation route attributes
Closest “exit”
Time spent waiting/stopped
Perceived asymmetric information
Route tables calculated on model initialization, allows for more efficient dynamic optimization of route decisions
• In the case of the IND model, there are several interlinked agent state sets that are dynamically
tracked and updated
Priority set – Evacuate/shelter/seek medical attention/find persons of interest
Physical/health state - Flash blindness, blast damage, accident injuries, fatigue, sickness
Radiation dosage received – linked to health state and priority set
• All of these behavior states linked to physical vehicle movement parameters
Vehicles can experience stoppages as drivers become incapacitated
8

Disaster Events• Use dynamic contours to track regions of disaster
consequences
These are often derived from other simulation models to
compartmentalize processing requirements
Contours update in real time based on predicted weather
patterns, land cover, any other relevant factors
• Multiple interlinked contour sets can be adapted
to represent almost any disaster scenario
Flooding levels
Fire spread
Damage path
Contamination/fallout spread
• IND model uses 2 main contour sets
Blast radius levels – fireball and overpressure force
contours
Fallout distribution – radiation levels in air and deposition
on ground from various radioactive particle types
9
Examples of Disaster Contours
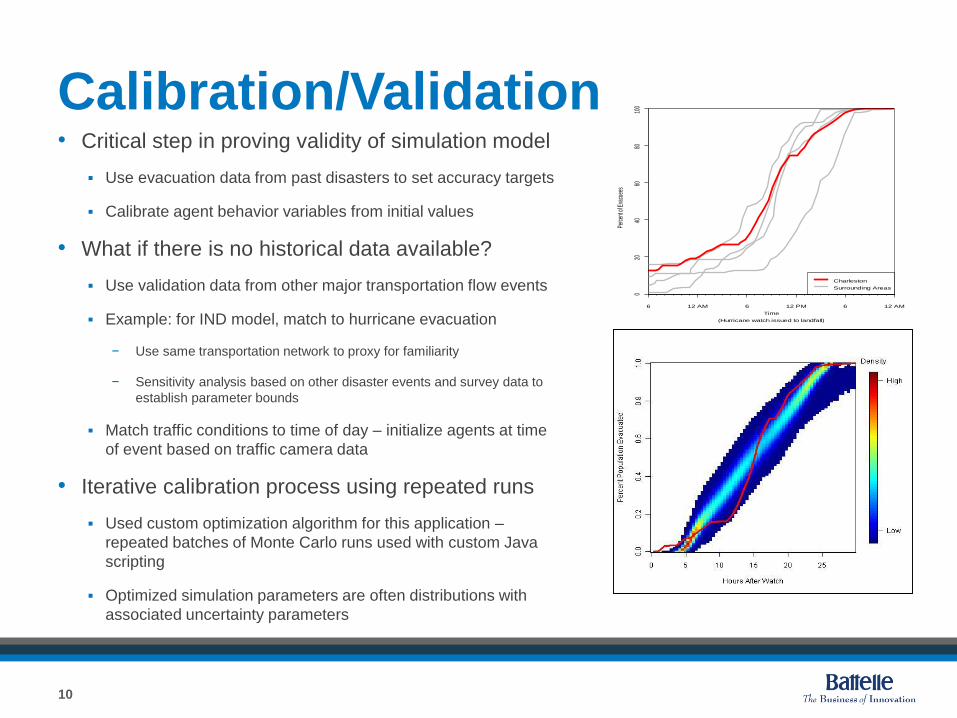
Calibration/Validation• Critical step in proving validity of simulation model
Use evacuation data from past disasters to set accuracy targets
Calibrate agent behavior variables from initial values
• What if there is no historical data available?
Use validation data from other major transportation flow events
Example: for IND model, match to hurricane evacuation
− Use same transportation network to proxy for familiarity
− Sensitivity analysis based on other disaster events and survey data to
establish parameter bounds
Match traffic conditions to time of day – initialize agents at time
of event based on traffic camera data
• Iterative calibration process using repeated runs
Used custom optimization algorithm for this application –
repeated batches of Monte Carlo runs used with custom Java
scripting
Optimized simulation parameters are often distributions with
associated uncertainty parameters
10
Time
(Hurricane watch issued to landfall)
Perc
ent o
f Eva
cuee
s
020
4060
8010
0
6 12 AM 6 12 PM 6 12 AM
Charleston
Surrounding Areas

Agent Populations
Calibrated Model
11
Agent Parameters
GIS Route Maps
GIS Environment Vehicle Agents
Node Agents
Model Environment
Disaster Event Contour Sets/ Modifiers
Traffic Conditions
Scenario
Interventions
(optional)
Scenario
Parameters
Network Model (initialized from
model environment
& agent populations)
Vehicle Entities
Node Entities
Event Location
Parameters
Scenario Parameters
AnyLogic Engine
Database Inputs
Health/Behavior
Statecharts
Flow Control
Statecharts
Experiments
• Monte Carlo
• Repeated Runs
Scenario
Run
Outputs &
Distributions

Results• For IND scenario, wanted to test the effectiveness of a 48 hour shelter-in-place order
Intended goal – reduce radiation dosages received during uncoordinated mass evacuation
Compare 2 sets of runs – immediate evacuation vs. shelter in place order
− Some households assumed to ignore evacuation order or shelter order
− Some agents proceed to designated shelter areas
• For large INDs, simulation shows that shelter in place order significantly reduces dosage received
as well as cases of severe radiation poisoning
12

Policy Planning• Use simulation to test of different disaster response
strategies – find best response strategy among several
likely options
• Can incorporate emergency responder agents
• Can incorporate different scenario interventions
Test different traffic flow control configurations using node agent
behavior
• Interchangeable model components
Different locations for same disaster scenario
Different disaster for same location
13

Questions?
14

15


